Article

Comparative Study of Methane Production in a One-Stage vs. Two-Stage Anaerobic Digestion Process from Raw Tomato Plant Waste

by
Graciela M. L. Ruiz-Aguilar
1,
Hector G. Nuñez-Palenius
2,
Nanh Lovanh
3 and
Sarai Camarena-Martínez
1,*
1
Departamento de Ciencias Ambientales, División Ciencias de la Vida, Campus Irapuato-Salamanca, Universidad de Guanajuato, Irapuato 36500, Mexico
2
Departamento de Agronomía, División Ciencias de la Vida, Campus Irapuato-Salamanca, Universidad de Guanajuato, Irapuato 36500, Mexico
3
Food Animal Environmental Systems Research, Agricultural Research Service, USDA, Bowling Green, KY 42101, USA
*
Author to whom correspondence should be addressed.
Energies 2022, 15(23), 9137; https://doi.org/10.3390/en15239137
Submission received: 8 October 2022 / Revised: 14 November 2022 / Accepted: 29 November 2022 / Published: 2 December 2022

Abstract

:
An anaerobic digestion process performed in two stages has the advantages of the production of hydrogen in addition to methane, and of further degradation of the substrate over the conventional process. The effectiveness of the implementation of this system for the treatment of lignocellulosic waste has been demonstrated. In 2020, more than 180 million tons of organic waste were generated worldwide from tomato crop production, posing a serious environmental risk. In the present investigation, methane production was compared in a two-stage system versus one-stage system from non-pretreated tomato plant residues. For this, different temperature (37 and 55 °C) and initial pH (5.5 and 6.5) conditions were evaluated during hydrogenesis and a constant temperature (37 °C, without pH adjustment) during methanogenesis. At the same time, a one-stage treatment (37 °C, without pH adjustment) was run for comparison purposes. The two-stage treatment in which the highest production of hydrogen, 12.4 mL/g VS, and methane, 252.3 mL/g VS, was observed occurred under the conditions of pH 6.5 and at 37 °C. However, this energy production was statistically similar (p < 0.5) to the one-stage treatment (365.4 mL CH4/g VS). Furthermore, there were also no significant differences in the removal of volatile solids between the different treatments.

1. Introduction

Population growth has resulted in a greater demand for food and energy and, at the same time, a greater generation of waste. Much of this organic waste is derived from agricultural activity and most is sent directly into landfills or incinerated with other waste [1]. For instance, tomato is broadly cultivated worldwide and represents one of the most economically important vegetable crops globally. In 2020, more than 5 million hectares were planted, producing greater than 180 million tons worldwide [2]. Similarly, tomatoes in México are of high importance and according to SIAP data, in 2020 México produced approximately 3.5 million tons of tomatoes, in 48,000 harvested hectares [3]. Regarding the organic waste related to tomato crop production, it has been shown that, roughly 50% of total plant weight is fruit and the other 50% is plant organic waste [4,5]. Thus, considering the 180 million tons of tomato fruit that were produced around the world in 2020, 180 million tons of organic waste were therefore generated worldwide, posing a serious environmental risk.
Mexico, crops production are mostly sugar cane, coffee beans, orange, wheat, agave, nopal and barley but tomato is the crop mostly produced in greenhouse [3]. Greenhouse require a high heat demand which increases the production costs of the fruits and vegetables grown there. These additional costs could be reduced by energy production from plant waste anaerobic digestion (AD) generated in the greenhouse [6]. Some studies have concluded that AD is a good option for agricultural residues disposal as well as for partially supply the energy demands of a greenhouse [7]. In anaerobic digestion in plants, an organic fertilizer is produced that reduces the demand for chemical fertilizers on farms [8]. Furthermore, in a social context, the implementation of this technology in rural areas improves economic development by generating new jobs [9]. Nevertheless, the potential of biomethane production from lignocellulosic waste is not well recognized due to the low yields obtained from these substrates.
The tomato crop is rich in carbohydrates and has been proven to be a potential source for bioenergy production through AD technology [7,10]. The main treatments to improve the yields of methane production from agricultural residues entail the application of physical and chemical pretreatments on the feedstock [11]. These treatments may involve the supply of energy and the addition of expensive chemicals that may form inhibitory effects on methanogenic activity [12,13].
Two-stage anaerobic systems are another promising technology used to improve the efficiency of the anaerobic digestion process. The one-stage anaerobic digestion system (1SADS), in which hydrolysis, acidogenesis, acetogenesis, and methanogenesis are performed in a single reactor, is the process that is widely used for waste treatment [14]. However, the activity of hydrolytic/acidogenic microorganisms differs with respect to methanogenic ones since they present different growth rates, and their activity is enhanced at a different range of pH and temperatures. A two-stage anaerobic digestion system (2SADS) allows both groups of microorganisms to be separated in two reactors, in such a way that hydrolysis/acidogenesis is performed in an initial reactor and subsequently, the soluble products derived from this first stage (mainly volatile fatty acids) are used in a second reactor by methanogenic microorganisms. This configuration provides greater stability to the process and improves the use of the substrate by both groups of microorganisms [15,16].
By presenting a higher degradation efficiency, the energy conversion efficiency is also improved and two biofuels with high energy values can be obtained continuously in separate reactors: H2 during hydrolysis/acidogenesis and CH4 during methanogenesis. Therefore, the hydrogen fermentation stage in a 2SADS could be considered as a biological pretreatment method for waste, but with the advantage of recovering additional bioenergy in the form of hydrogen and simultaneously pretreatment of the substrate [17]. Considering these advantages, a 2SADS is considered a better way to pretreat organic waste and improve methane production [18].
Comparative studies of methane production between 1SADS and 2SADS from agricultural residues have revealed that the two-stage process is more attractive in terms of energy recovery compared to the single-stage one [19,20,21,22,23]. In these investigations, corn silage, grass silage, agave bagasse, sugar cane bagasse, and coffee bean hulls, among others, have been tested in batch and semi-continuous regimes, in addition to thermophilic and mesophilic conditions. In all mentioned studies, chemical or biological pretreatments have been used prior to feeding the 2SADS. These treatments are used to facilitate hydrolysis during H2 production. However, they lead to an increase in the operating cost of the process as well as its complexity. Up to our knowledge, most of reported studies using tomato plant-waste have focused on co-digestion for methane production, but not for hydrogen yielding. Therefore, in this study, the comparison of methane production was made in a 1SADS with respect to 2SADS from non-pretreated tomato plant waste.

2. Materials and Methods

2.1. Substrate

The substrate consisted of the aerial part (stem and leaves) of tomato plant (TPW) collected at the end of the life cycle of tomato. The tomato variety was Saladette. The plant waste was collected at the Agrifood Expo located in the city of Irapuato, Guanajuato, México. The plant was dried under sunshine (20 °C ± 8 °C) for 15 d until reaching 8 ± 3% humidity. The dried plant was milled in an agricultural hammer mill and stored at room temperature until use. Subsequently, a sample of 200 g was milled in a cereal and grain mill (SURTEK, Grupo Urrea Salamanca, Guanajuato, Mexico) and passed through a set of laboratory sieves (W.S. Tyler, Mentor, OH, USA). Samples whose particle size was between 0.85 mm and 1.68 mm were selected for the laboratory test. The TS and VS contents of the substrate were 93.93 ± 0.31% on a wet basis and 80.79 ± 0.45% on a dry basis, respectively.

2.2. Inoculums

The inoculum used for hydrogen production consisted of the microorganisms present on the surface of a tomato plant [24,25].
In the case of methane production, the inoculum consisted of anaerobic sludge collected from a 1000 L geomembrane bag biodigester fed with a mixture of cow manure and water (7–10% TS, pH 6.83 ± 0.14). The collected inoculum was degassed at room temperature (19.7 ± 7.0 °C) for 10 days before being used for a methane production test. The biodigester was operated at room temperature (20 °C ± 8 °C) with a solid retention time of 7 d. The digester was installed in the experimental unit of the Laboratory of Technology for Sustainability, University of Guanajuato. The TS and VS contents of the inoculum was 6.86 ± 0.06% on a wet basis and 57.14 ± 0.54% on a dry basis, respectively.

2.3. Batch Assays and Experimental Design

The 1SADS experiment consisted of a single stage in which only the methane production was performed. In contrast, the 2SADS experiments consisted of two stages in which the hydrogen production (Hydrogenesis Stage) and methane production (Methanogenesis Stage) was performed (Figure 1).

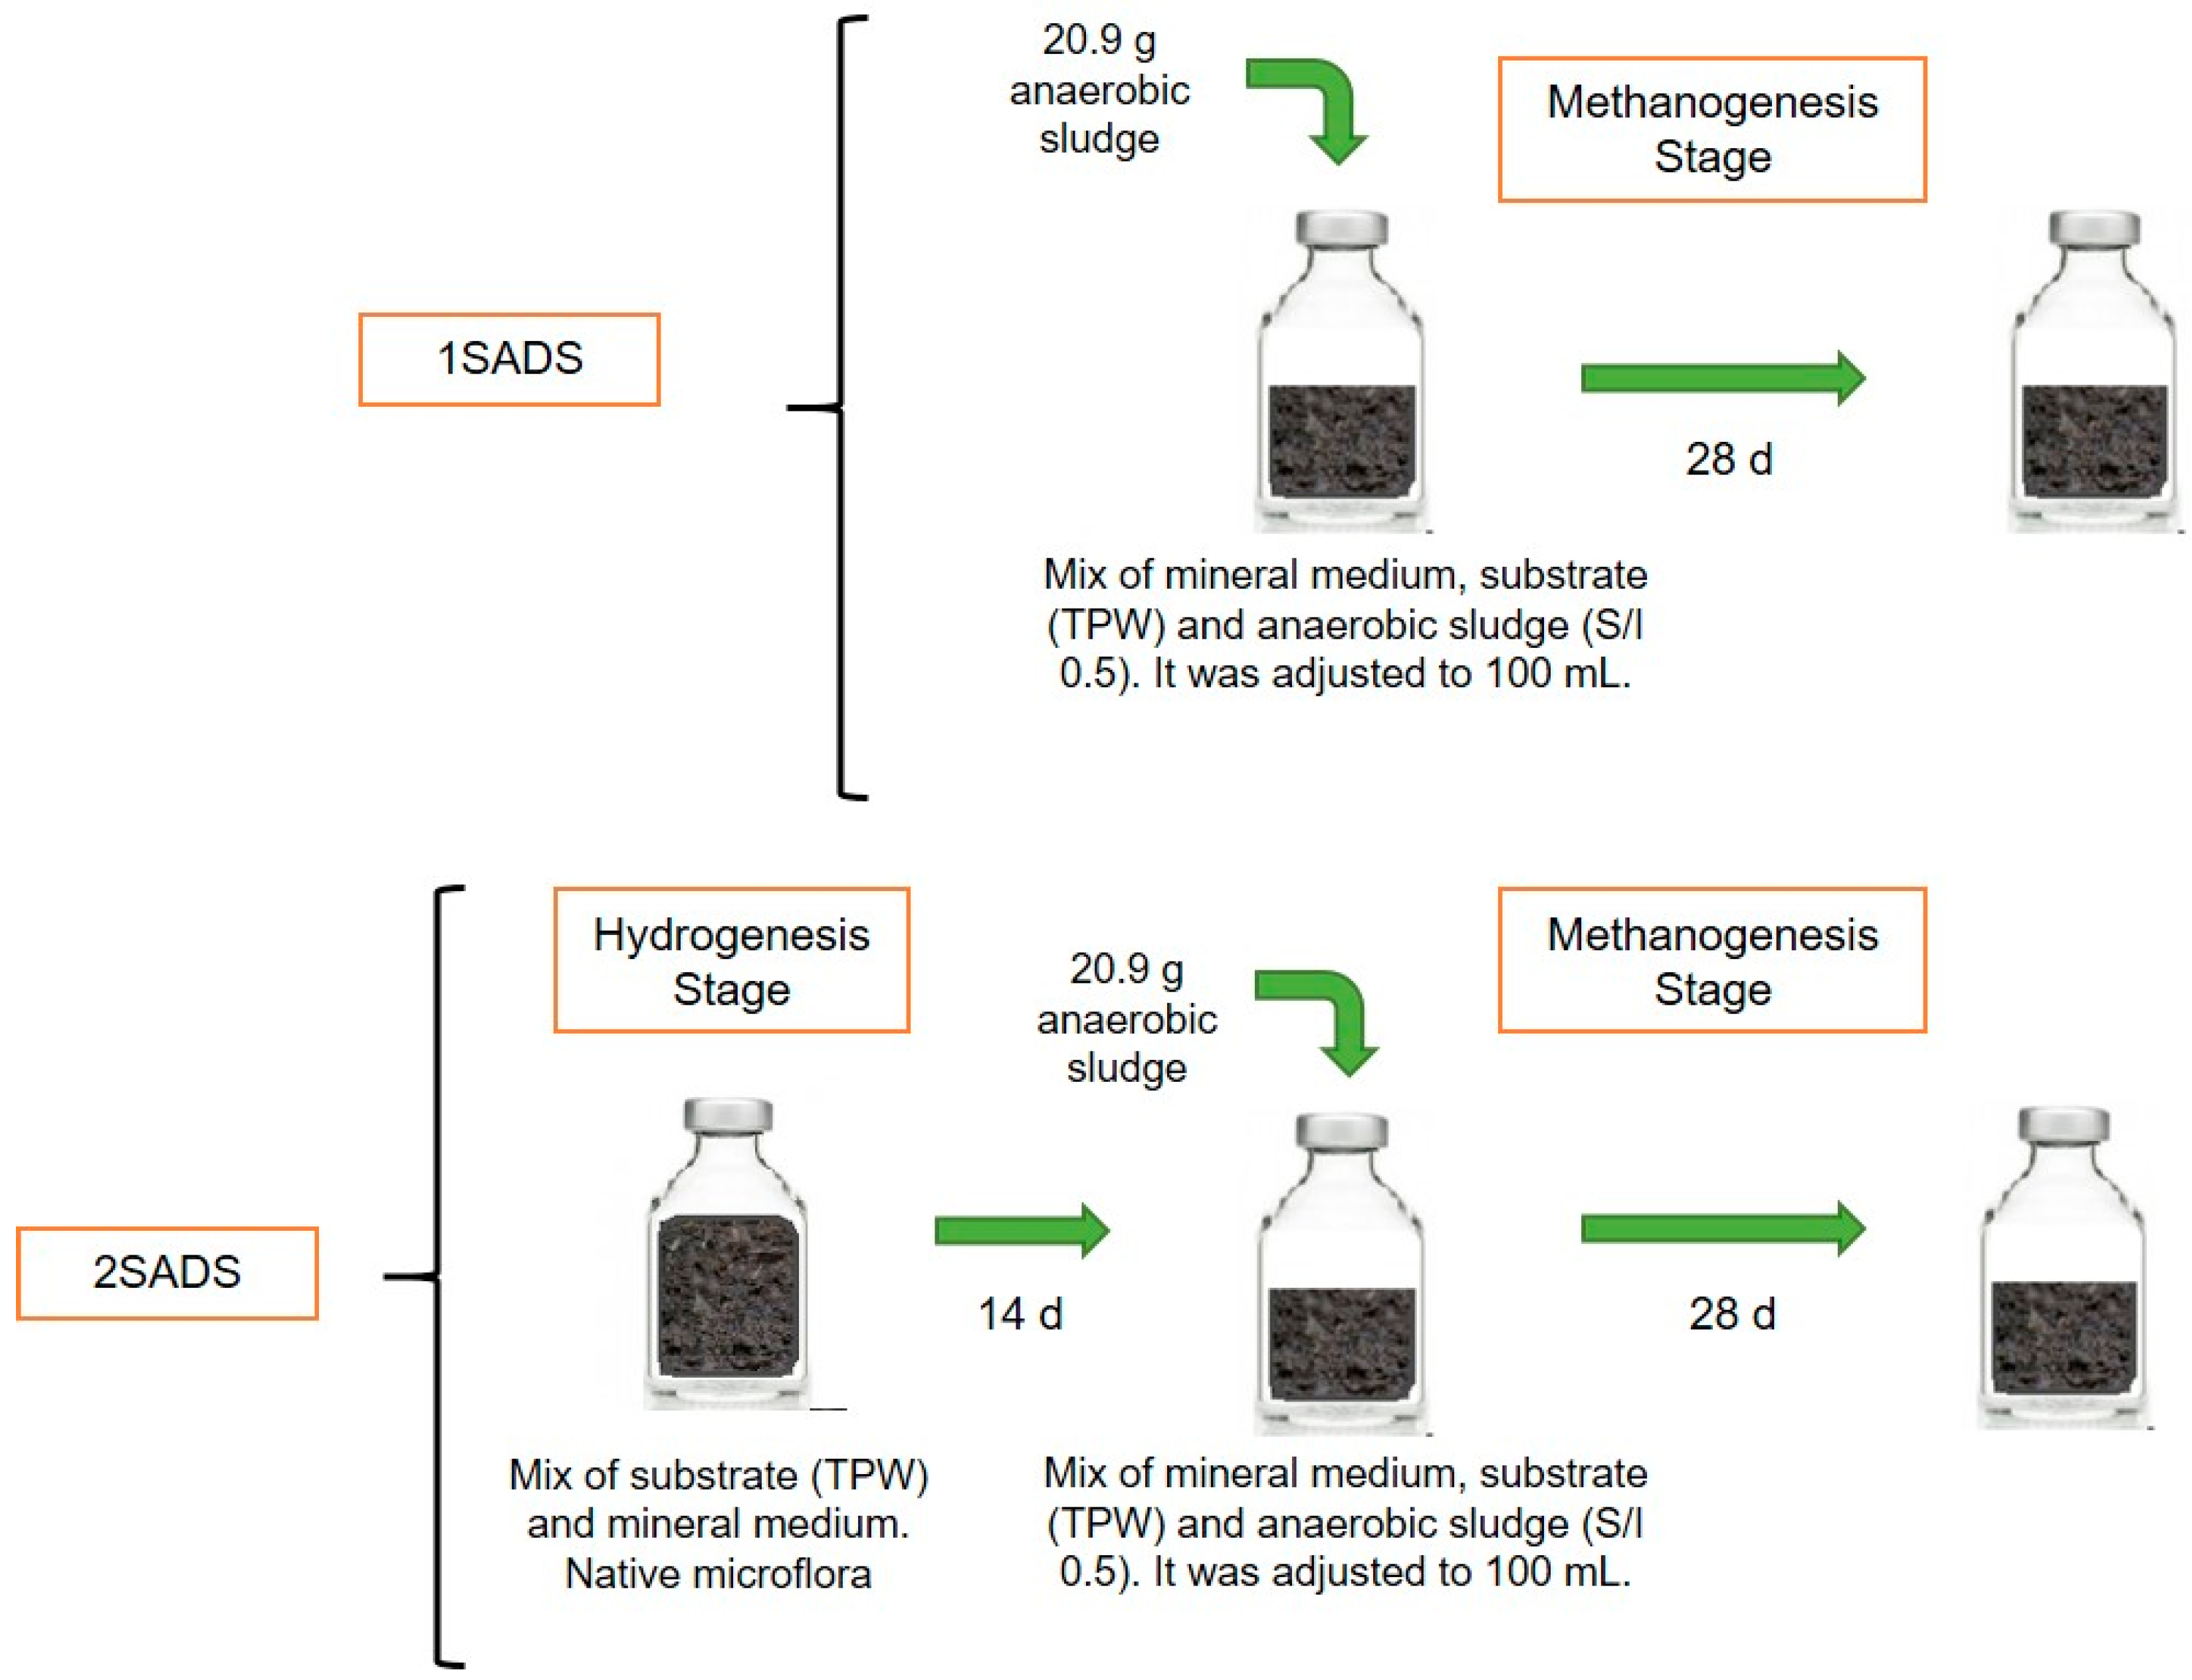
2.3.1. One-Stage Anaerobic System (1SADS)

For 1SADS treatment (T5), serological bottles of 160 mL with a working volume of 100 mL were used. To the vials, 20.9 g of inoculum (anaerobic sludge) were added equivalent to 8.2 g VS/L. The mixture consisted of a mineral medium, substrate (TPW), and inoculum. The S/I ratio was 0.5 [10]. The initial pH was not adjusted, and the incubation time was 28 d under static conditions at 37 °C.
The composition of mineral medium per liter was 4.8 g KH2PO4, 6.98 g K2HPO4, 6.0 g NH4Cl, 0.1 g MgCl2·6H2O, 0.02 g CaCl2, 0.015 g MnSO4·6H2O, 0.025 g FeSO4·7H2O, 0.005 g CuSO4·5H2O, and 0.125 mg CoCl2·5H2O [26]. An endogenous control was included consisting of inoculum (8.2 g VS/L) with mineral medium only. The TS and VS contents and pH were determined at the beginning and end. Two replicates were made.
For comparison purposes, 1SADS was run while the methanogenesis stage for the two-stage system was happening, which is explained below.

2.3.2. Two-Stage Anaerobic System (2SADS)

For 2SADS treatments (T1–T4), serological bottles of 160 mL with an initial working volume of 140 mL were used. The mixture for the hydrogenesis stage consisted only of mineral medium [26] and substrate (TPW). In this stage, no external inoculum was added since the necessary microorganisms for digestion are present in the tomato plant. Therefore, the bioreactors were fed with nonsterile tomato plant for the hydrogenesis stage of 2SADS [24,25].
A 2 × 2 factorial experimental design was established to evaluate hydrogen production, where two variables were considered at two different levels: the “initial pH” (X1) (5.5 and 6.5) and “Temperature” (X2) (37 and 55 °C). Table 1 lists the treatments corresponding to the 2 × 2 factorial design. The vials were sealed and incubated under static conditions for 14 d.
For the methanogenesis stage, the same four treatments coming from the hydrogen production were used. Each vial was opened under an anerobic chamber and 20.9 g of inoculum equivalent to 8.2 g VS/L were added and each vial was sealed again. The amount of inoculum added was sufficient to achieve an S/I ratio of 0.5 in this stage. In order to compare methane production, the conditions used in the methanogenic phase of 2SADS were the same conditions used in the 1SADS. The initial pH was not adjusted at this stage and the incubation time was 28 d under static conditions at 37 °C for all treatments.
An endogenous control was included consisting of inoculum (8.2 g VS/L) with mineral medium only. The TS and VS contents and pH were determined at the beginning and end of the methanogenesis stage. Each treatment was performed in duplicate.

2.4. Statistic Analysis

The software utilized for statistical analyses was Statgraphics Centurion XVI (Statpoint Technologies, Inc., version 16.1.03, The Plains, VA, USA).
To analyze the pH and temperature effect on hydrogen production during the hydrogenesis stage of 2SADS treatments (T1–T4), a multi-factor ANOVA and a Tukey’s method were applied, with p values of 0.05. To analyze the significant differences on methane production between each the treatment performed in a 2SADS (T1-T4) with respect to the treatment performed in an 1SADS (T5), a simple ANOVA (one way) and Tukey’s method were applied with a p value of 0.05.

2.5. Analytical Methods

Determination of the TS and VS contents was performed according to standard procedures [27]. The pH was measured using the method reported by Kang et al. [28]. Namely, the pH measurement of the samples from the biogas tests was performed by shaking the sample manually, and left to stand for 10 min and the supernatant reading was taken.
The volume of biogas produced was determined by liquid displacement using acidified water (pH = 2) to minimize the dissolution of carbon dioxide in water. The reactors were shaken manually at the time of gas measurement. Gas volumes were calculated based on standard conditions (273.15 K, 101.325 kPa). Hydrogen and methane yields are given per gram of volatile solid of substrate added.
The presence of methane in the biogas was verified by gas chromatography for the detection of H2, O2, N2, and CH4, taking 30 μL of the gas present in the headspace of each bottle. This measurement was performed using a PerkinElmer Clarus 580 chromatograph, with an Elite CG GS-MOSIEVE 52 capillary column (30 m × 0.53 mm × 50 μm) and a thermal conductivity detector (TCD). The temperatures of the injector, oven, and detector were 150, 50, and 200 °C, respectively. Argon was used as a mobile phase at a pressure of 14 psi and contained less than 5 ppm O2. All other chemicals used were of reagent grade from Sigma-Aldrich.

3. Results

3.1. One-Stage Anaerobic Digestion System (1SADS)

The methane yield obtained was 365.4 mL/g VS (T5). The average content of methane in the biogas was 66.1%. The methane yield obtained in our study was similar or better than reported for other lignocellulosic substrates [20,29] without the need to pretreat the feedstock. Nkemka et al. [20] reported 358 mL CH4/g VS from corn silage and Miftah et al. [29] reported methane yields of 46.1 to 148.3 mL/g VS from pretreated and non-pretreated sugarcane leaves, respectively.

3.2. Two-Stage Anaerobic Digestion System (2SADS)

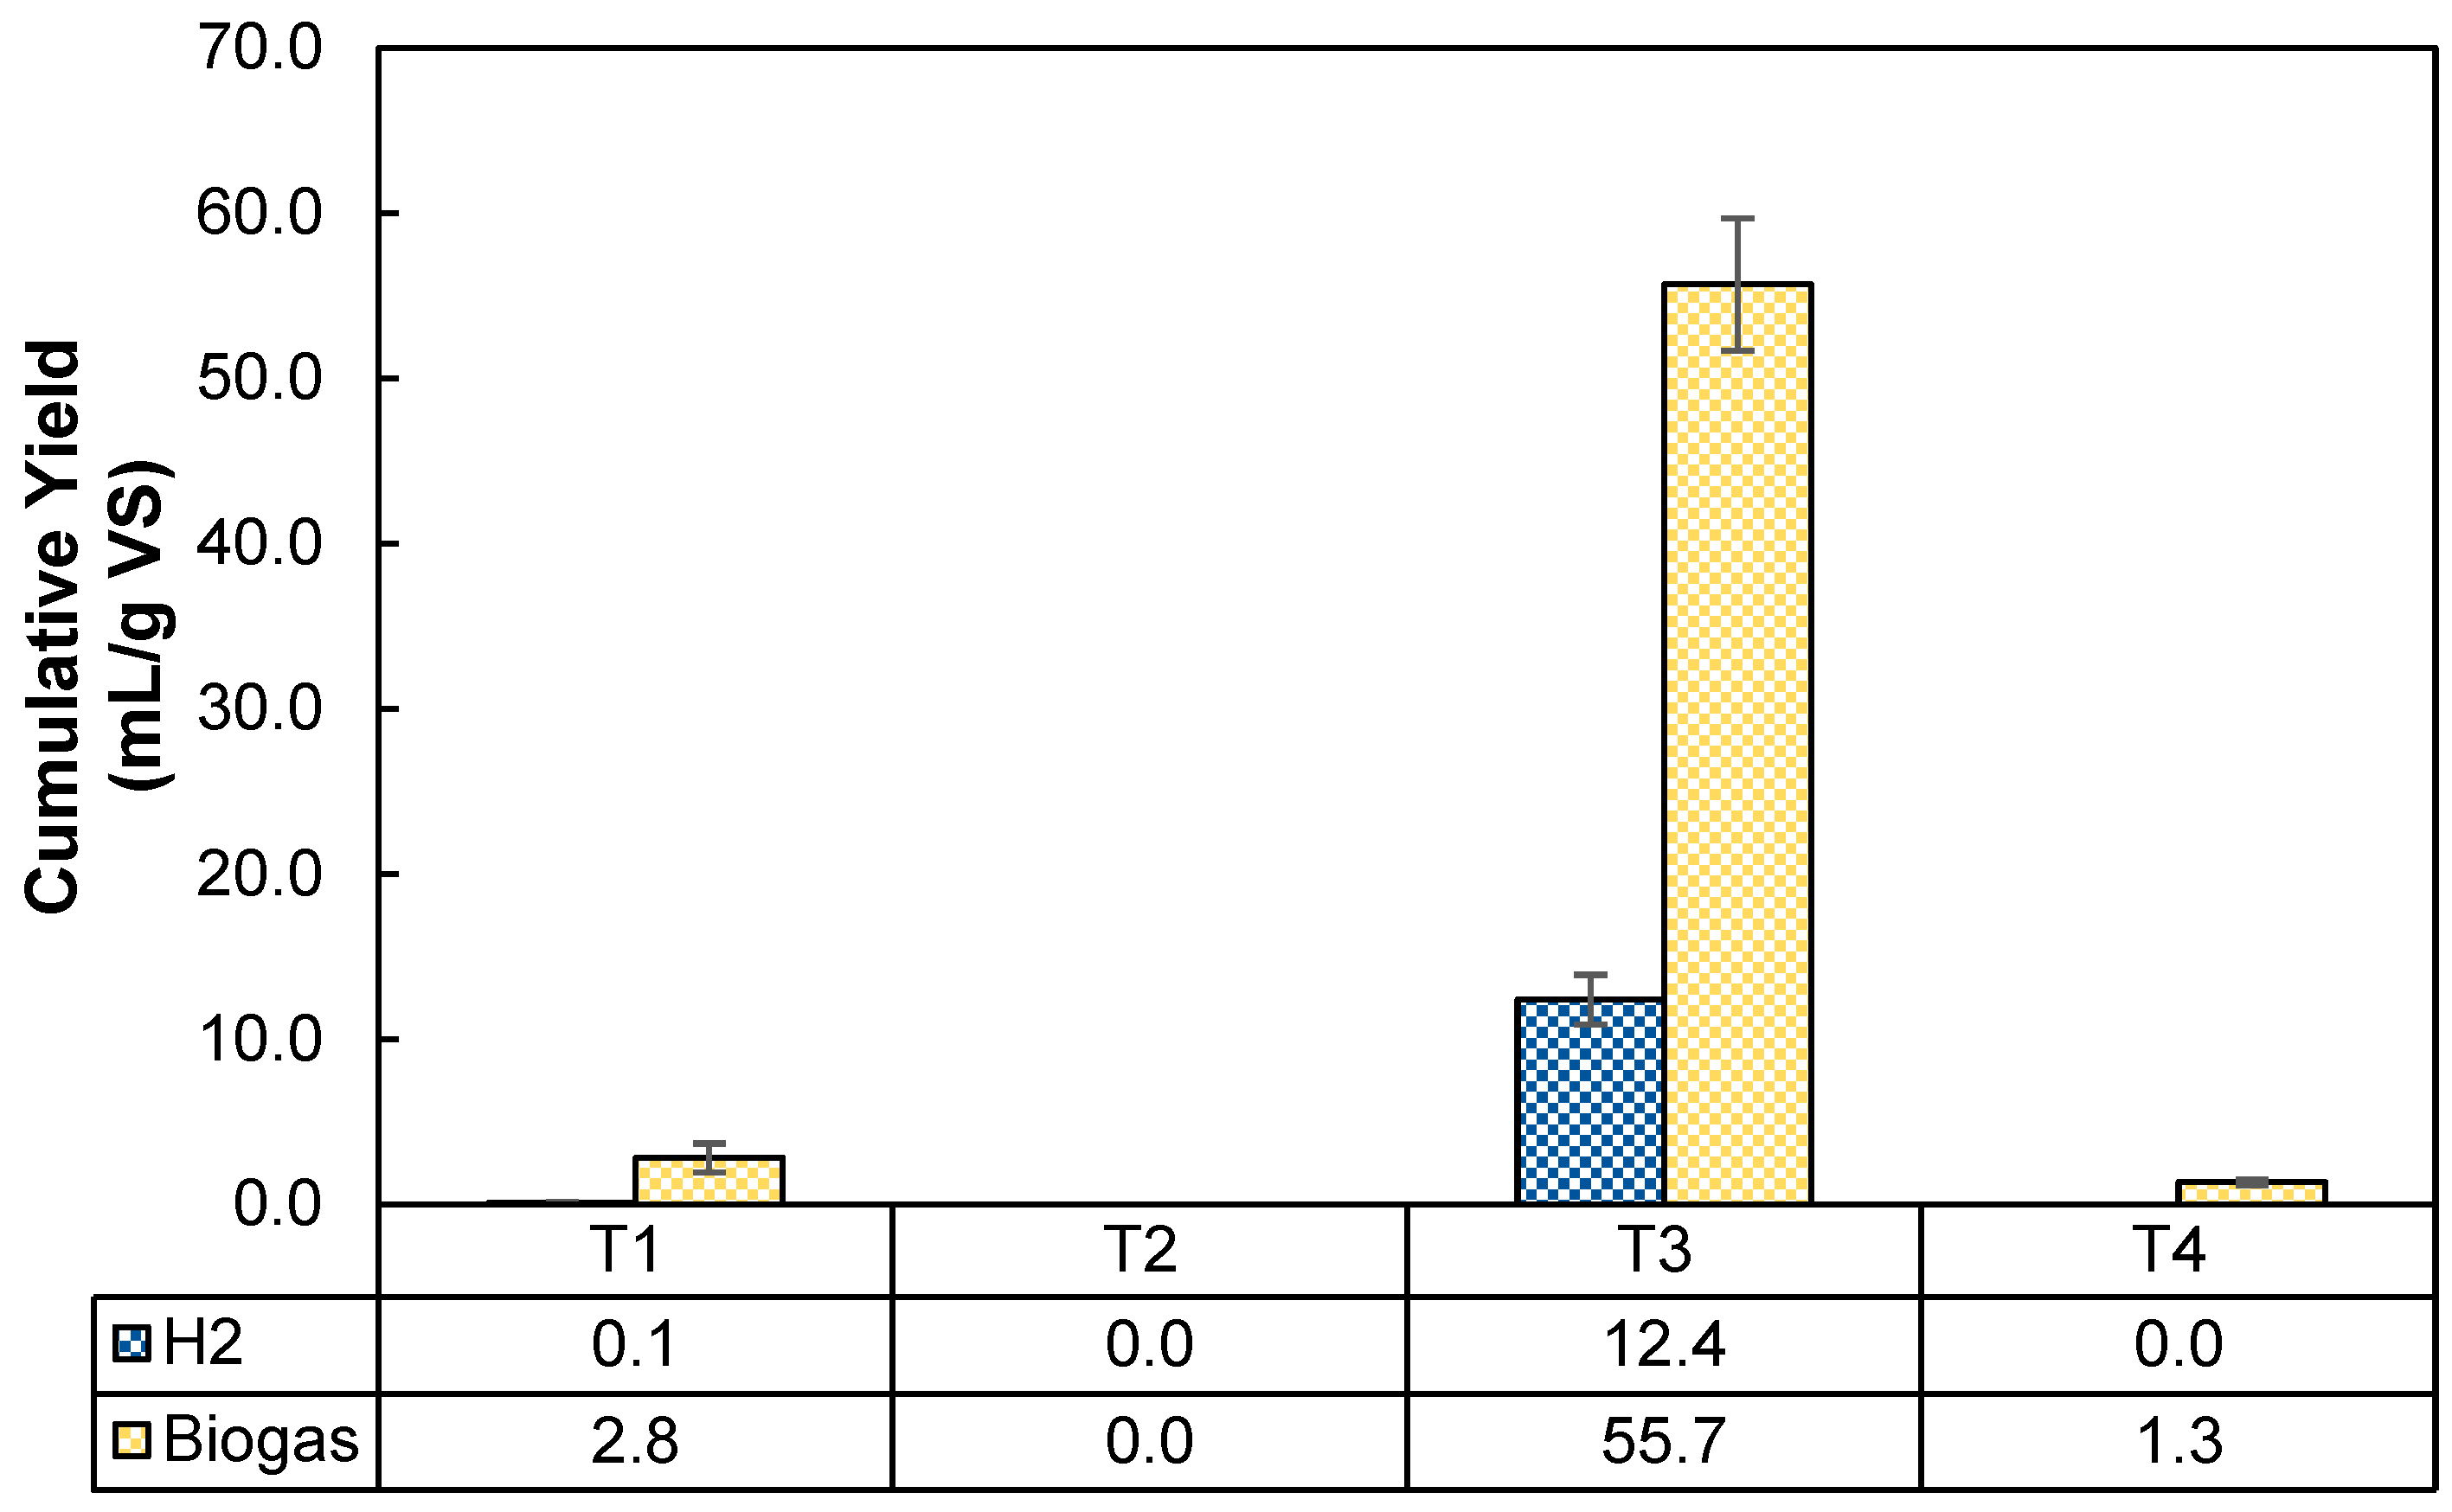
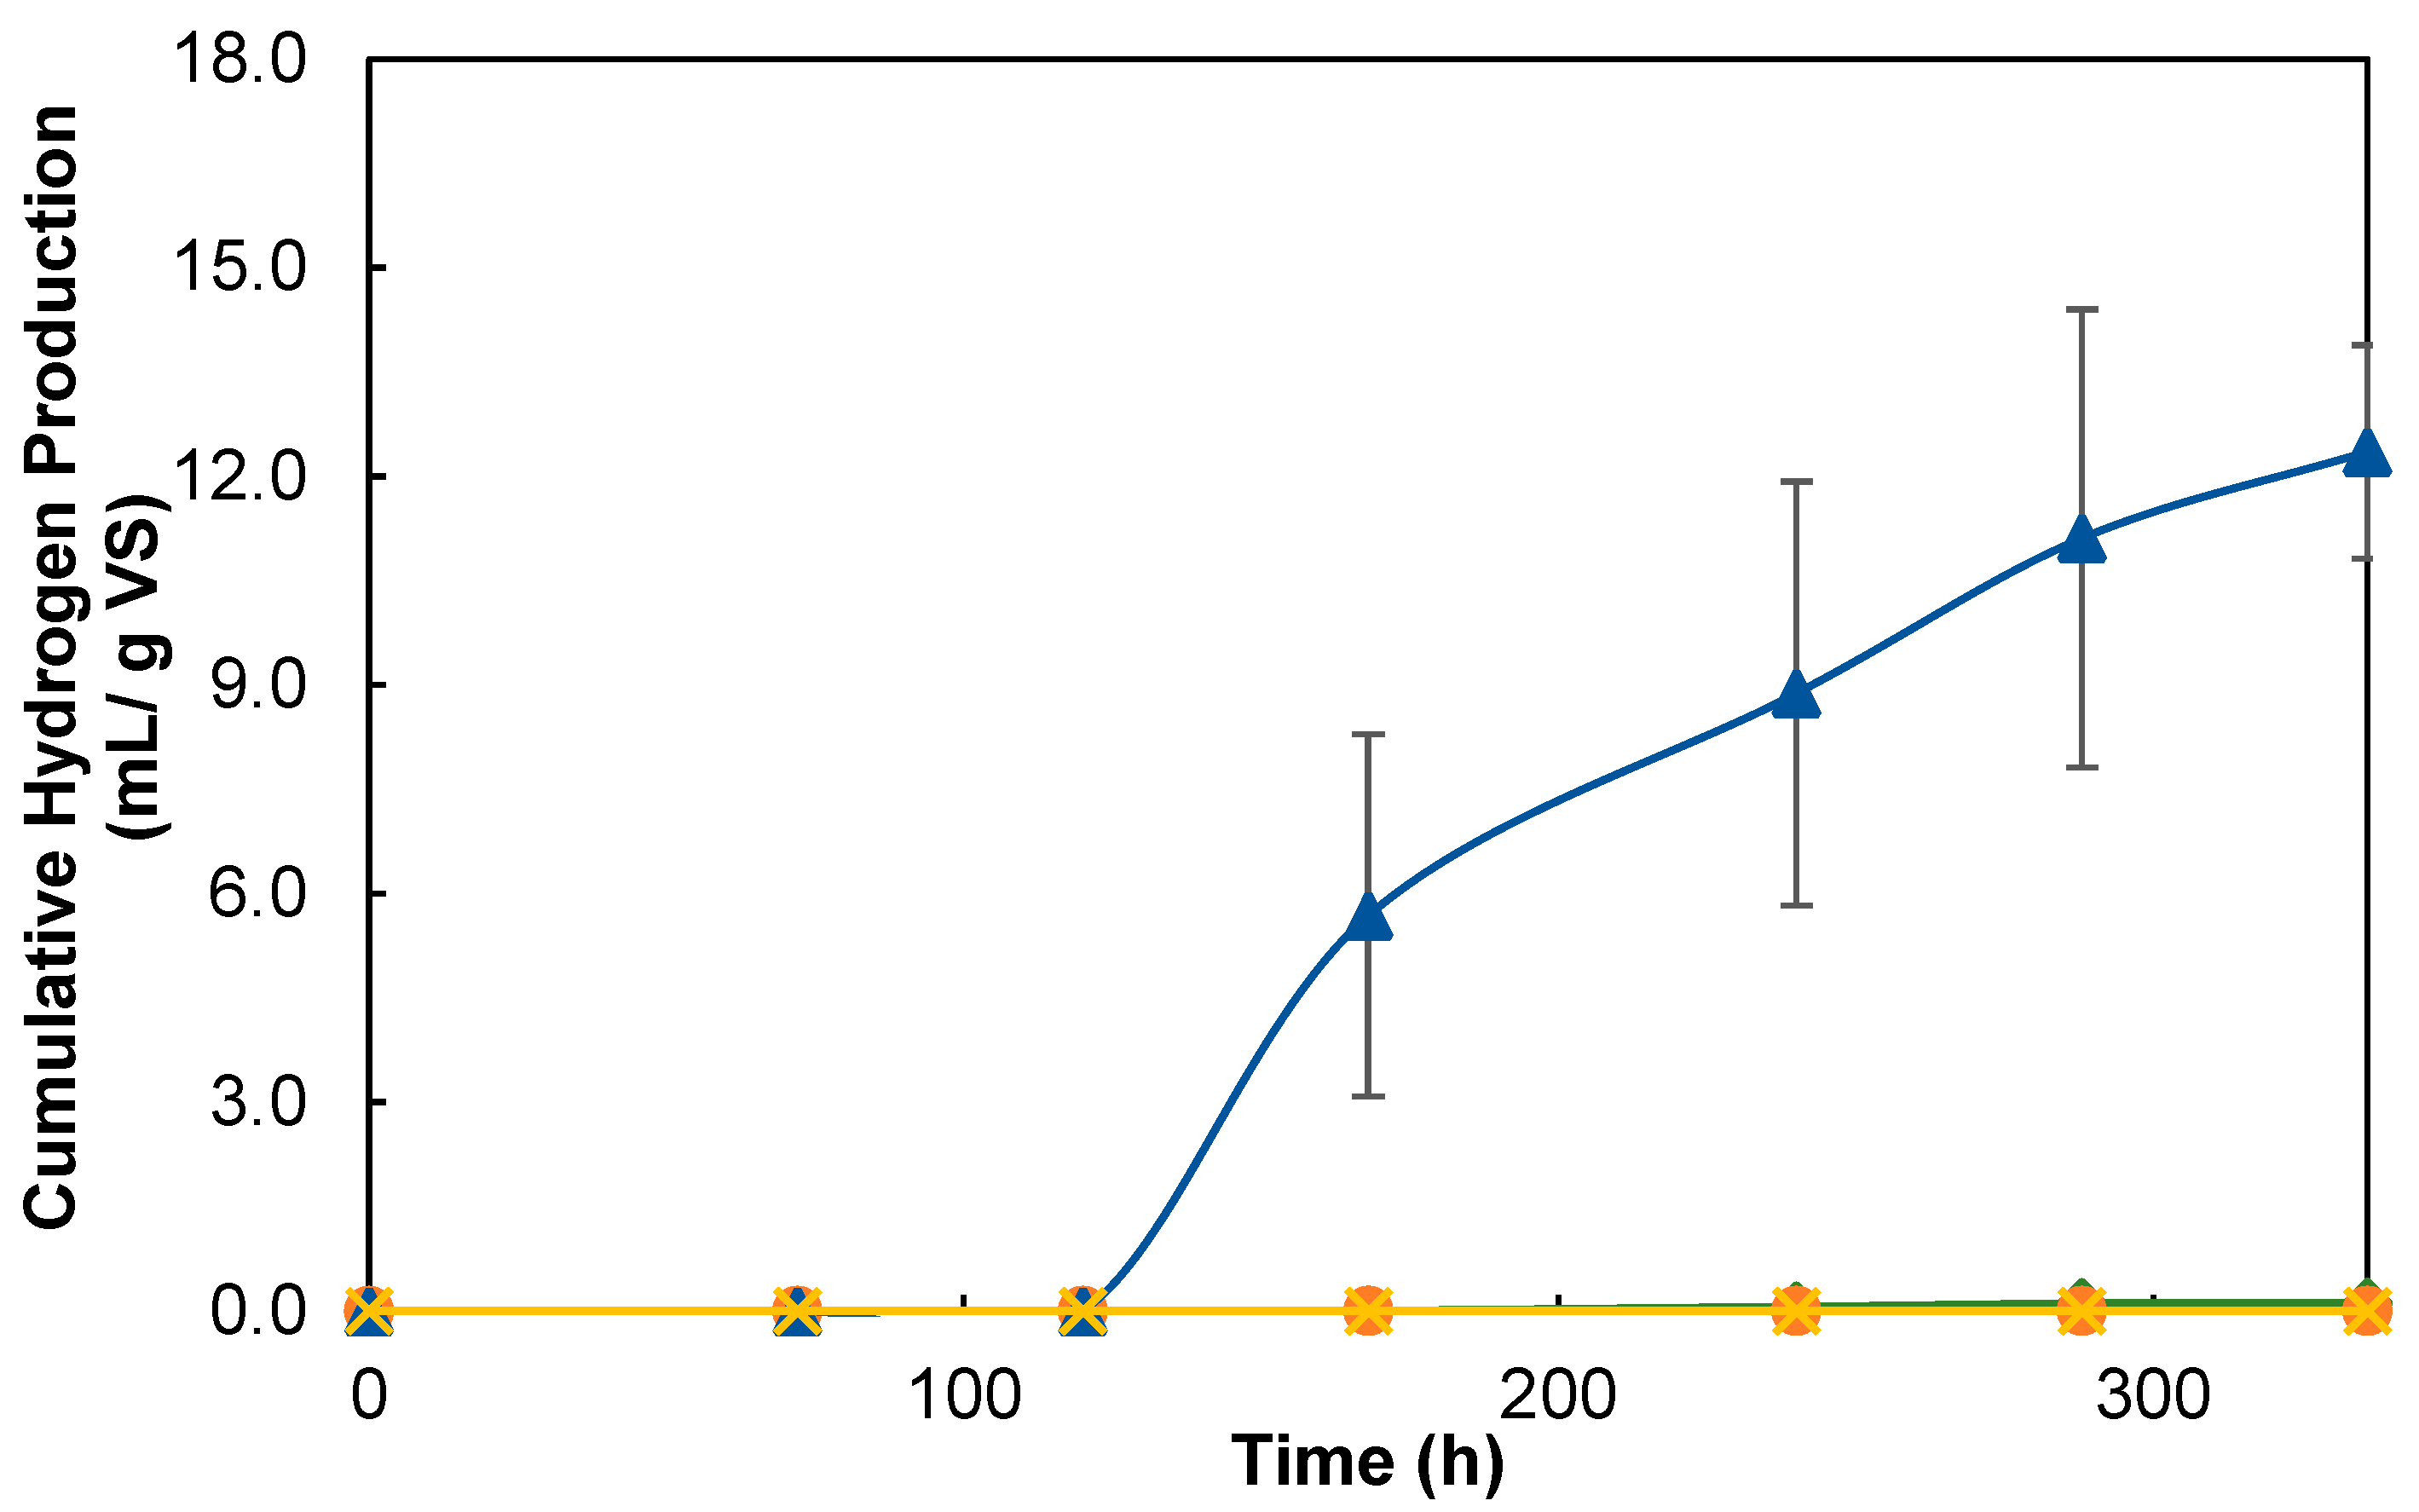
3.2.1. Hydrogenesis Stage

The highest hydrogen yield (12.4 mL/g VS) was obtained in the treatment performed at pH of 6.5 and 37 °C (T3). Only in the treatments in which a temperature of 37 °C was used (T1 and T3), hydrogen production was detected (Figure 2). According to the analysis of variance performed, the pH and temperature were not statistically significant (p > 0.05) on the production of hydrogen.
Figure 3 shows cumulative hydrogen production (mL/g VS) obtained in each of the treatments during an incubation period of 14 days. In the T3 treatment, the hydrogen production increased gradually and in the T1 treatment, the production was almost undetectable. The hydrogen content in the biogas in the T3 treatment fluctuated between 19.4 and 30.3%.
In our tests, the hydrogenesis retention time was 14 days. This value was lower in comparison to reports by other authors, who performed their experiments in batch regimen using lignocellulosic substrates [22,23]. Santos et al. [23] set a retention time of 700 h from coffee husk, and Lobo et al. [22] set a retention time of 19 days from sugarcane bagasse. In both studies, thermally pretreated anaerobic sludge and pretreated substrate were used. It is important to mention that in our experiments the substrate and inoculum were not pretreated.
The hydrogen yields obtained in our study are similar to those reported by other authors from lignocellulosic substrates [25,29]. Miftah et al. [29] reported hydrogen yields of 0.8 to 39.8 mL H2/g from pretreated and non-pretreated sugarcane leaves. Perez-Rangel et al. [25] obtained 13, 17, and 38 mL H2/g VS from agave bagasse, corn stalk, and wheat straw, respectively. In our study, 11.6 mL/g VS were obtained from tomato plant waste.
Miftah et al. [29] added Clostridium butyricum TISTR 1032 preparations as inoculum for their hydrogen assays while Perez-Rangel et al. [25] used native microflora of the plants. In previous studies, the presence of facultative bacteria belonging to the genus Enterococcus has been detected in forage crops [24,30]. These microorganisms, naturally present in the leaves and stems of the plants, are known as epiphytic microflora [31]. The epiphytic microorganisms degrade the cell wall of the plants and, owing to their hydrolytic activity, can be used to obtain hydrogen from lignocellulosic substrates [32]. However, the use of native microflora as inoculum has been little studied and this alternative has only been evaluated in single-stage systems for H2 production [24,25,32]. Although in most hydrogen assays an external inoculant for the fermentation is added, the native microflora of the plants has the potential for performing hydrogen production because they are bacteria that already have the natural capacity to degrade lignocellulosic compounds [25].

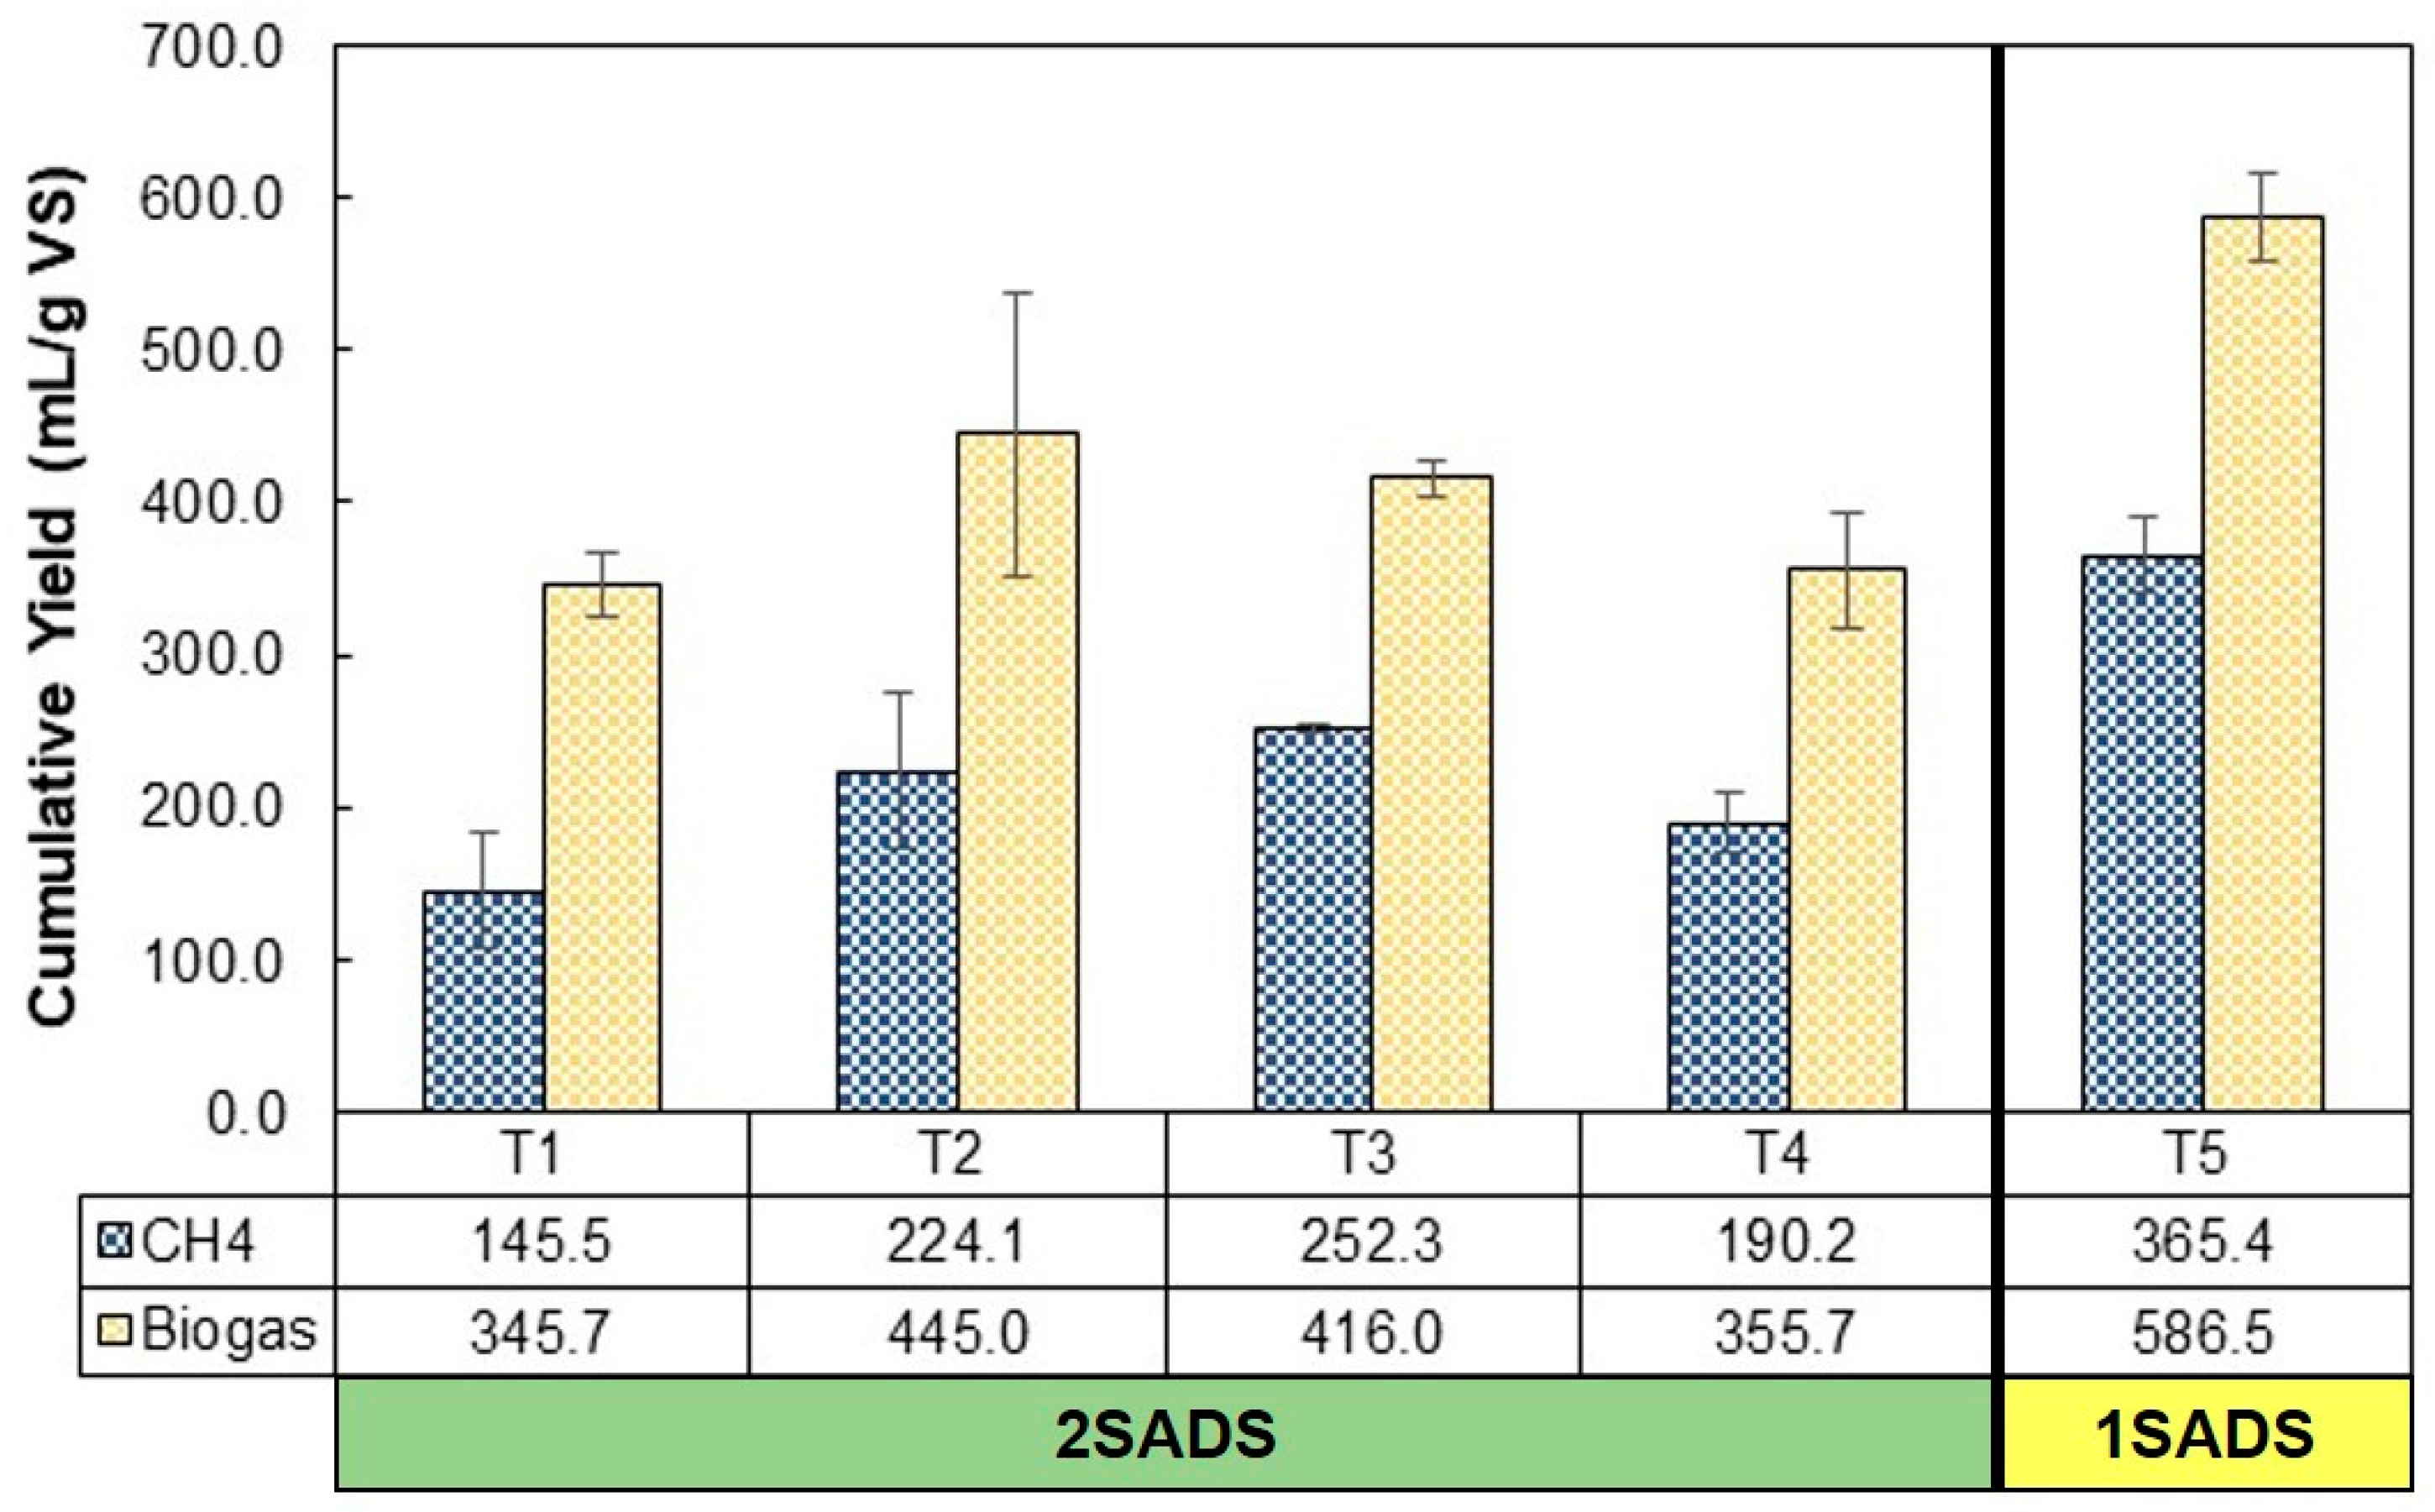
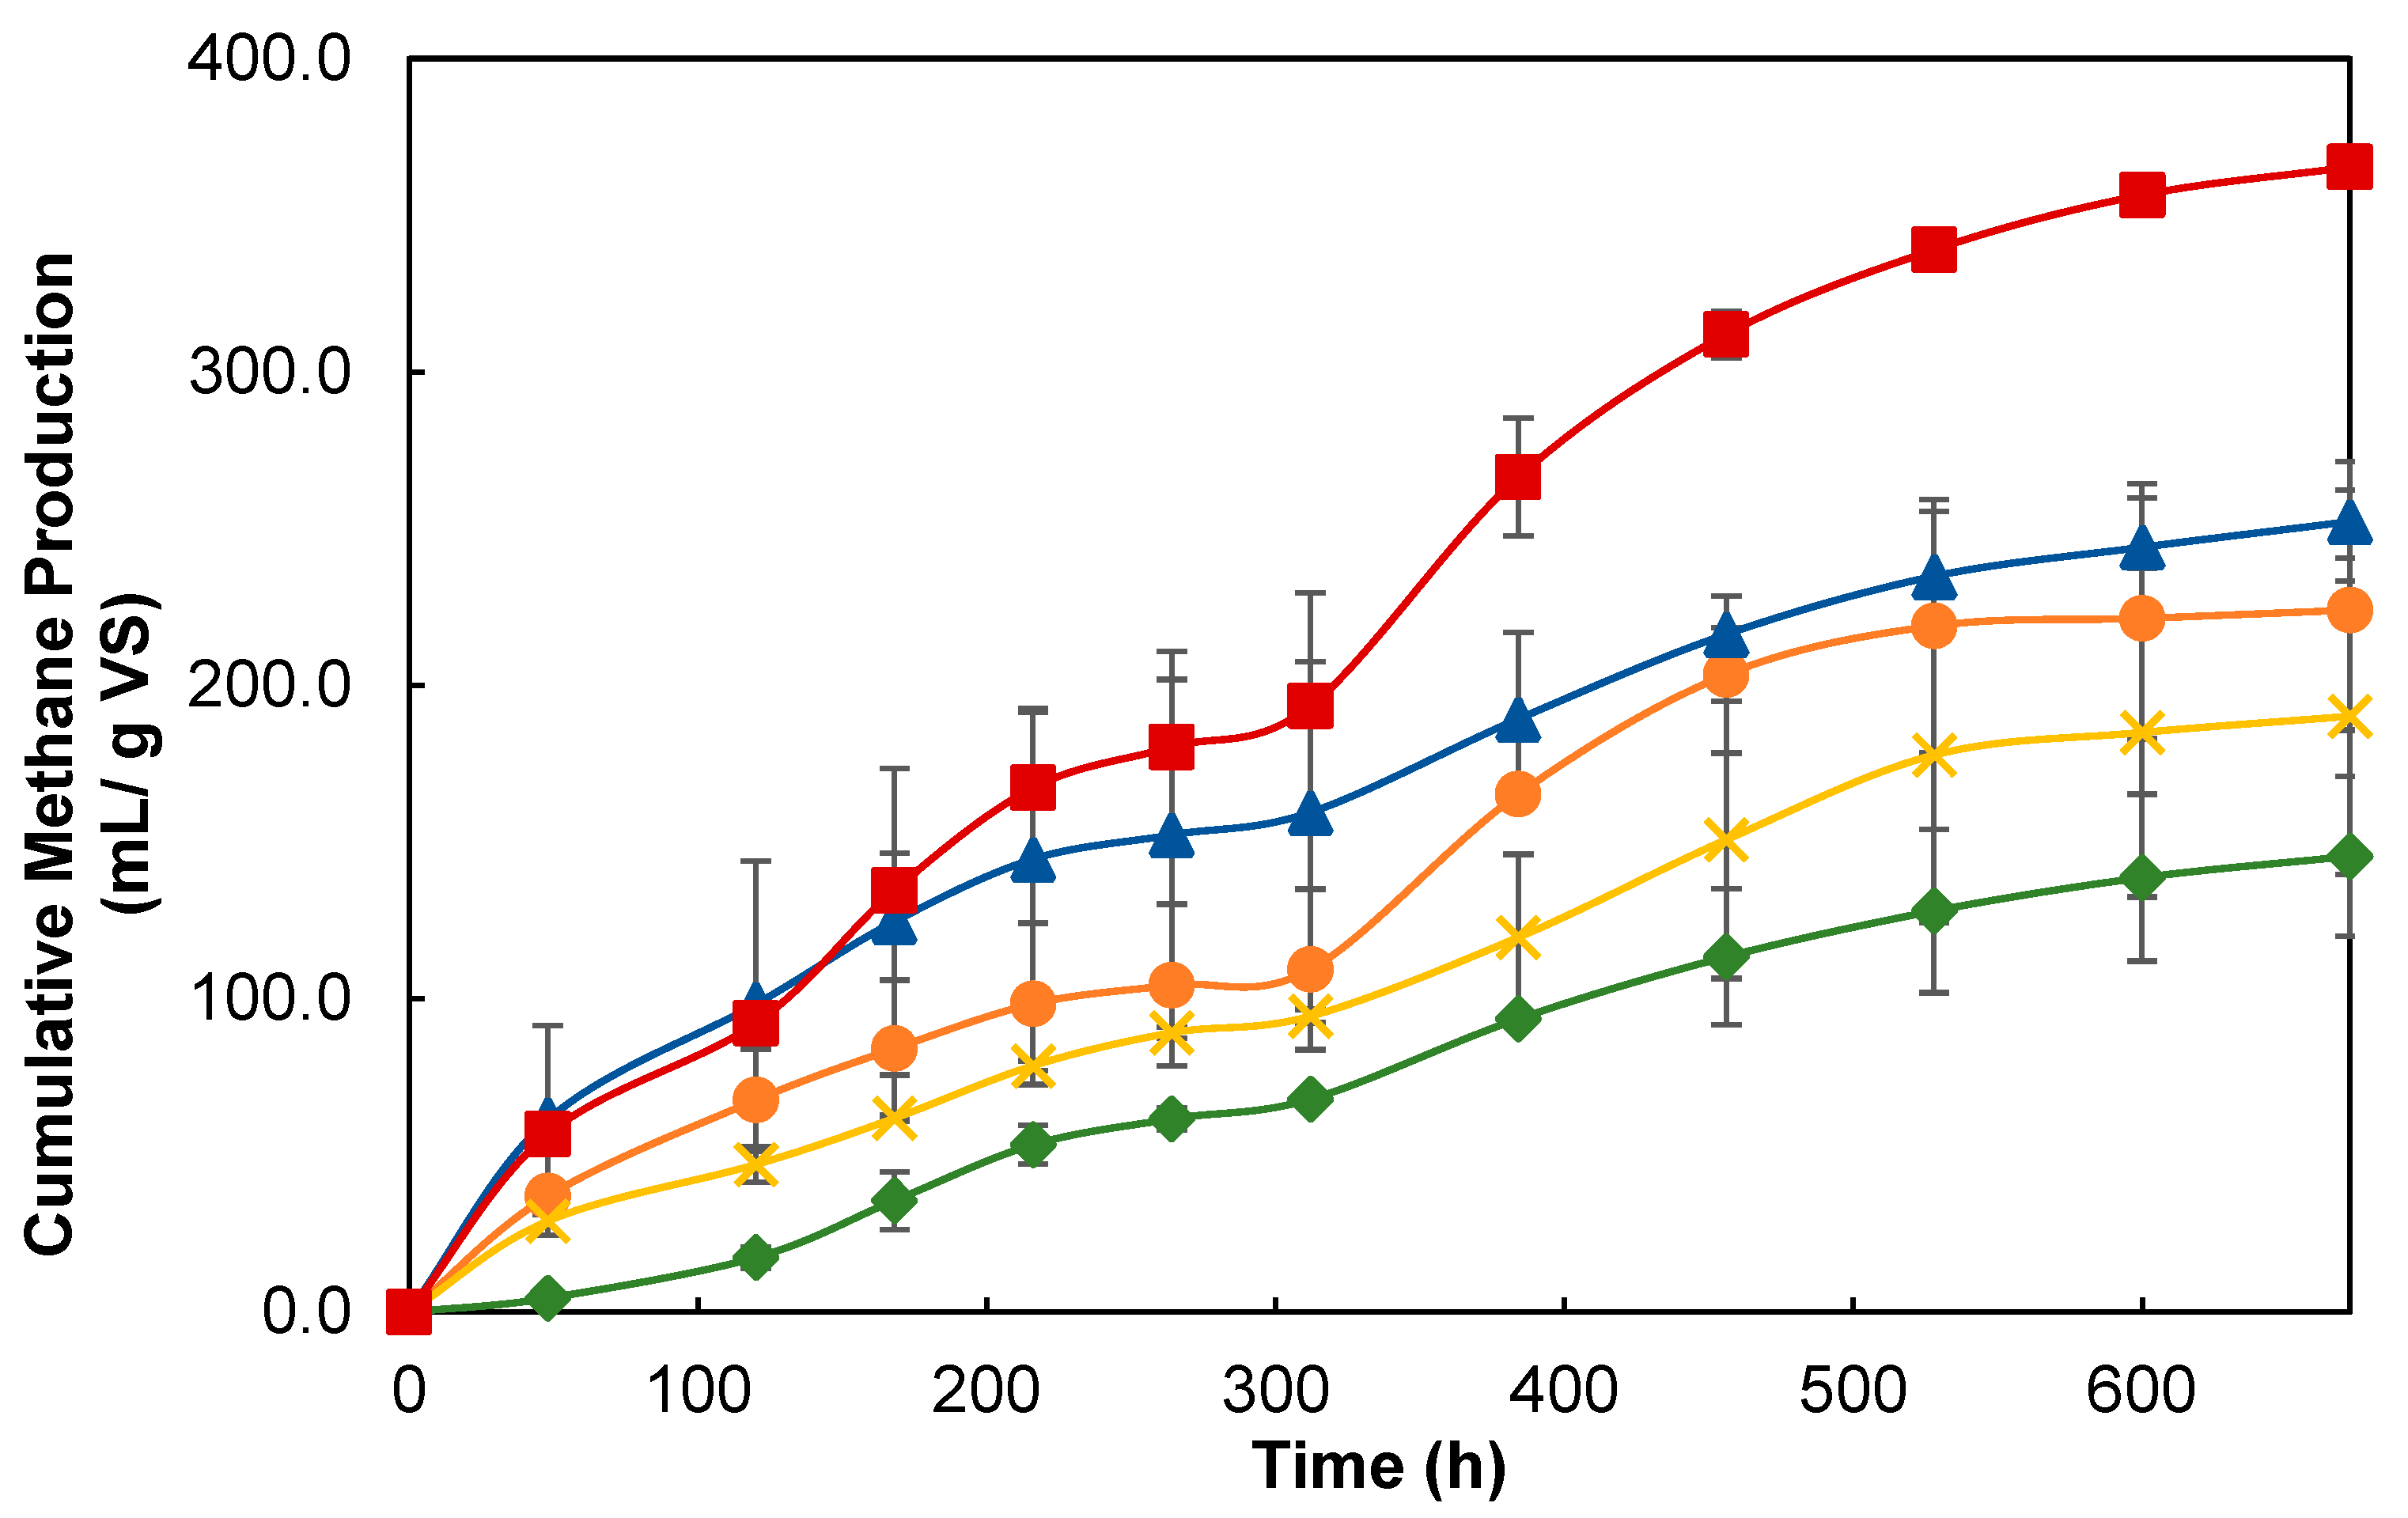
3.2.2. Methanogenesis Stage

The maximum methane yield was obtained in treatment T3 (252.3 mL/g VS). This treatment was done at an initial pH of 6.5 and a temperature of 37 °C during the hydrogenesis stage. The lowest yield was obtained in the T1 treatment (145.5 mL/g VS). This treatment was performed at an initial pH of 5.5 and a temperature of 37 °C during the hydrogenesis stage. The average methane content in the biogas for the treatments T1, T2, T3, and T4 were 50.6, 52.6, 63.0, and 57.0%, respectively. The methane yield obtained from treatments T1-T4 was statistically similar (p > 0.05).

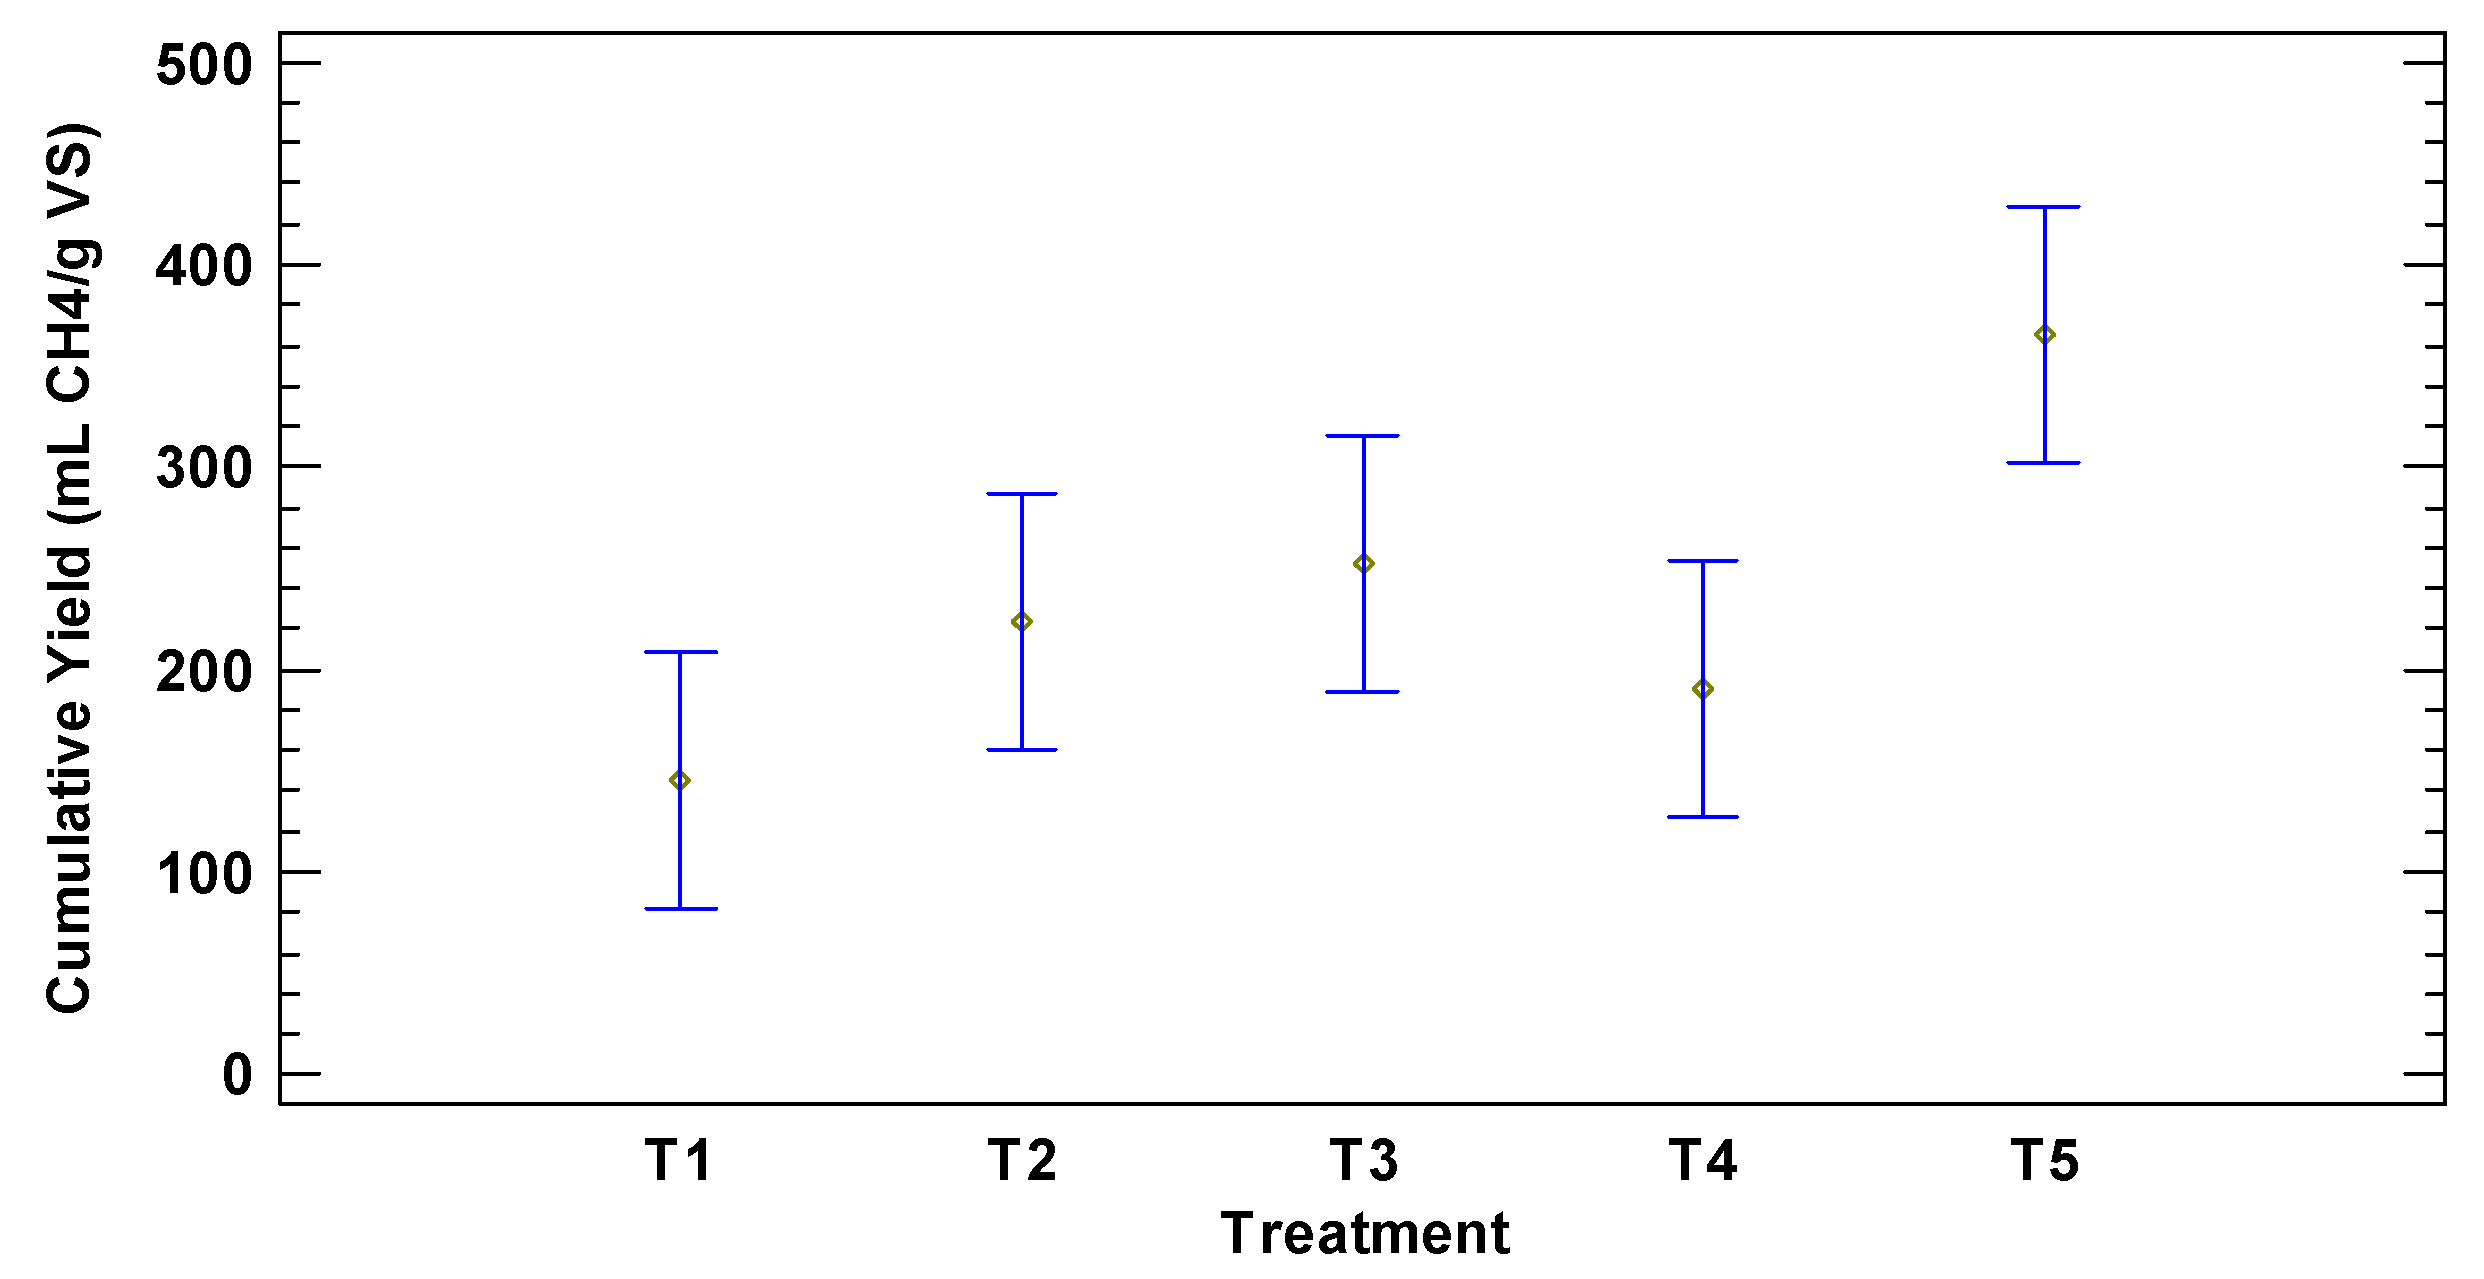
3.3. Comparison of Methane Production between 1SADS VS 2SADS

The highest methane yield and the highest average methane content was obtained in the treatment performed in a single stage (T5). Figure 4 shows the methane and biogas yield (mL/g VS) obtained in each treatment.
Figure 5 shows the cumulative methane production curves for each of the treatments. In all treatments, a gradual increase in methane production was observed during the incubation period.
Through a one-way analysis of variance, the significant differences in methane production were analyzed between the different treatments performed in a two-stage system (T1–T4) with respect to the treatment performed in a single stage (T5). Of the treatments carried out in two stages, only in T3 treatment was able to obtain a statistically similar methane yield (p < 0.5) to that obtained in treatment performed in a single stage (T5) (Figure 6).
The energy recoveries for 1SADS (T5) and 2SADS (T3) were 14506.1 and 10199.3 MJ/Kg substrate, respectively. Even considering the hydrogen production, the best energy recovery in 2SADS (obtained in T3) was less compared to 1SADS. For quantification purposes, the high heating values of hydrogen and methane (141.9 and 55.5 MJ/Kg, respectively) were used for calculation and assumed that both gases behave as ideal gas at standard conditions [33]. Thus, the hydrogen yield obtained in the first stage of the treatment T3 does not justify the need for the AD system to be performed in two stages using non-pretreated TPW.

3.4. Comparison with Other Works

Some authors indicated a substantial improvement in methane production by incorporating a hydrogenesis stage into the process for hydrogen production [21,22,23]. However, the substrates used in the aforementioned studies were subjected to a biological, physical, or chemical pre-treatment before carrying out the production of H2. For example, in the study by Arreola et al. [21] in which agave bagasse was used, an enzymatic pretreatment of the substrate was applied, which facilitated the assimilation of carbohydrates by part of the microorganisms during the hydrogenesis stage. In the study by Lobo et al. [22], they applied autohydrolysis to pretreat sugarcane bagasse, and Santos et al. [23] used ozonolysis to pretreat coffee husks before digestion. This explains the higher performance obtained in these studies compared to ours. Nevertheless, our results are similar to those reported in another studies which concluded that the single-stage system is better for the recalcitrant substrate [20,34]. Nkemka et al. [20] reported higher methane production yield in the one-stage system compared to the two-stage system from corn silage. Dareioti et al. [34] found no significant differences in a two-stage system compared to a single one, concluding that liquid cow manure is a recalcitrant substrate which can be treated by implementing a single-stage process. Their experiments were performed in continuous stirred-tank reactors. Table 2 lists some comparative studies between 1SADS and 2SADS.
The goal of this paper was to consider a new strategy for the production of biogas from tomato plant residues without the need for pretreatment. According to the results obtained it is recommended to apply a biological, chemical, or physical pretreatment (or combination) to improve the low yields of H2 and CH4 production obtained in two-stage system. The pretreatment is necessary to breakdown the lignin and improve its degradation since it is a substrate with a high content of lignocellulosic components. This pretreatment will be more beneficial for a 2SADS since both hydrogen, and methane production will be improved substantially [15,16]. Therefore, it is expected that the energy recovery of this system will be higher compared to a 1SADS from the same feedstock.
It is important to evaluate these types of treatments and check if the performance obtained by pretreating the substrate is good enough for optimal operation and costs effectiveness to choose a 2SADS instead 1SADS from TPW.

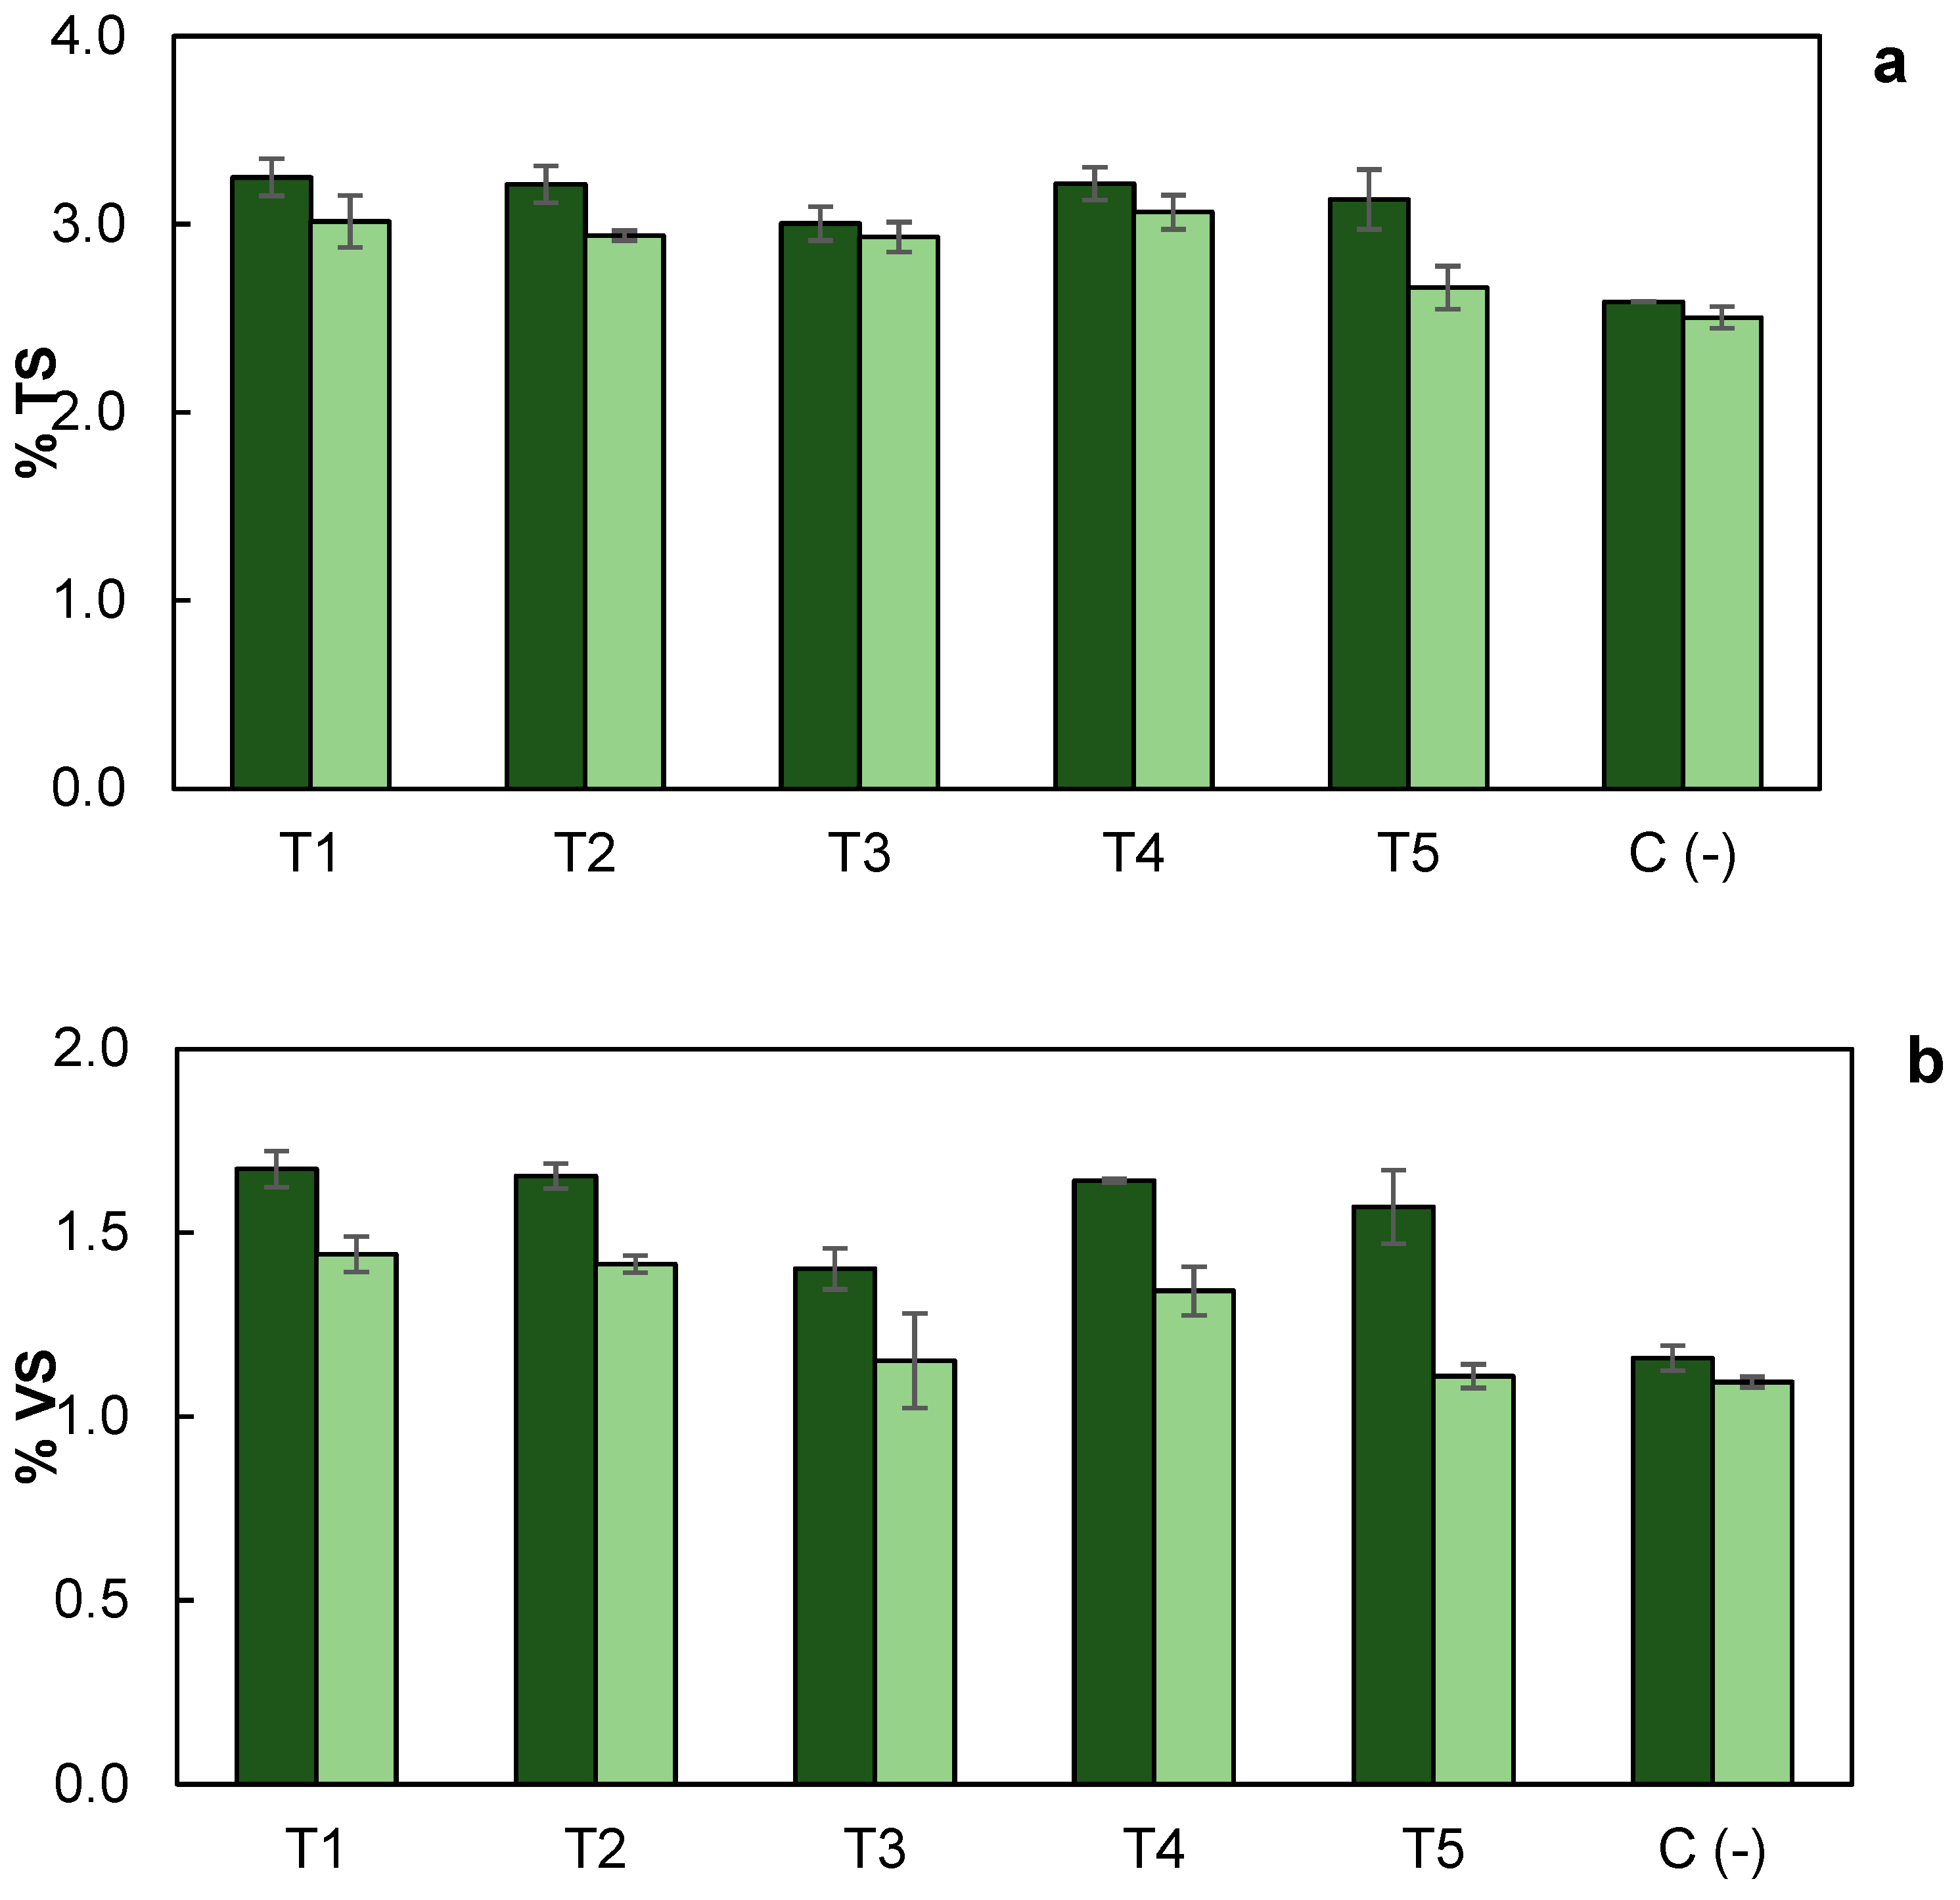
3.5. Total Solids and Total Volatile Solids Removal

At the conclusion of the methanogenesis stage, a decrease in the content of total and volatile solids was observed at the end of the incubation period of 28 d in all treatments (Figure 7). The total solids removal percentages were 7.2, 8.5, 7.5, 4.7, and 14.9% for treatments T1, T2, T3, T4, and T5, respectively. The volatile solids removal percentages were 13.8, 14.5, 18.0, 18.3, and 29.2% for treatments T1, T2, T3, T4, and T5, respectively.
The significant differences in the volatile solids removal among the 2SADS treatments (T1-T4) with respect to the 1SADS treatment (T5) were analyzed. The volatile solids removal percentages for treatments T1, T2, T3, T4, and T5 were 11.8, 14.8, 18.0, 18.4, and 29.3%, respectively. Evidently, the highest percentage was obtained in treatment T5. Nevertheless, according to the multiple range test, there were only significant differences in the volatile solids removal between treatments T1 and T5, and T2 and T5, with a confidence level of 95%.
In the study by Nkemka et al. [20], the removal efficiency of volatile solids depended mainly on the type of substrate used. They tested two substrates, maize silage, and cattail, in a 2SADS. In addition, they applied a bioaugmentation process with Pyromyces rhizinflata YM600 to pretreat both substrates. They obtained a global VS removal of 81.0 and 84.4% for non-pretreated corn silage and pretreated corn silage, respectively. However, they only achieved a reduction of 22.7 and 36.6% using unpretreated and pretreated cattail, respectively. Therefore, the removal efficiency depends largely on the characteristics of the substrate. The removal of solids obtained in the present study was similar to that reported by Nkemka et al. [20] for cattail.

4. Conclusions

Due to the non-significant differences in methane production between the treatment with the highest yield in a 2SADS (T3) with respect to the treatment in 1SADS (T5), a single-stage anaerobic digestion process a more viable system for obtaining methane from raw TPW. Furthermore, the single-stage assembly is simpler and less incubation time is required. In addition, the volatile solids removal in 1SADS was significantly higher compared to some treatments in the two-stage system (T1 and T2).
In our study, we obtained a similar or better methane production yield with respect to that reported for other lignocellulosic substrates without the need to pretreat the tomato plant waste, independently the process will be carried out in one or two stages.
It will be important to continue evaluating other strategies to improve the performance of the process using tomato plant as a substrate. This will help to reduce the negative impact of tomato plant waste disposal in greenhouse settings since these residues can be used for clean, renewable energy production and partially supply the energy demands of a greenhouse.

Author Contributions

Conceptualization and methodology, G.M.L.R.-A. and S.C.-M.; software, S.C.-M.; validation G.M.L.R.-A. and S.C.-M.; formal analysis S.C.-M.; investigation, S.C.-M.; resources G.M.L.R.-A.; data curation S.C.-M.; and writing, review and editing, G.M.L.R.-A., S.C.-M., H.G.N.-P. and N.L. All authors have read and agreed to the published version of the manuscript.

Funding

This research received no external funding.

Data Availability Statement

Not applicable.

Acknowledgments

The authors are grateful for the support from the CONACYT scholarship to Sarai Camarena-Martínez, No. 442714.

Conflicts of Interest

The authors declare no conflict of interest.

References

  1. Rena; Bin Zacharia, K.M.; Yadav, S.; Machhirake, N.P.; Kim, S.-H.; Lee, B.-D.; Jeong, H.; Singh, L.; Kumar, S.; Kumar, R. Bio-hydrogen and bio-methane potential analysis for production of bio-hythane using various agricultural residues. Bioresour. Technol. 2020, 309, 123297. [Google Scholar] [CrossRef] [PubMed]
  2. Food and Agriculture Organization of United Nations (FAO). 2022. Available online: https://www.fao.org/faostat/en/#data/QCL (accessed on 21 September 2022).
  3. Servicio de Información Agroalimentaria y Pesquera (SIAP). 2022. Available online: https://nube.siap.gob.mx/cierreagricola/ (accessed on 21 September 2022).
  4. Bergougnoux, V. The history of tomato: From domestication to biopharming. Biotechnol. Adv. 2014, 32, 170–189. [Google Scholar] [CrossRef] [PubMed]
  5. Ronga, D.; Zaccardelli, M.; Lovelli, S.; Perrone, D.; Francia, E.; Milc, J.; Ulrici, A.; Pecchioni, N. Biomass production and dry matter partitioning of processing tomato under organic vs. conventional cropping systems in a Mediterranean environment. Sci. Hortic. 2017, 224, 163–170. [Google Scholar] [CrossRef]
  6. Pietzsch, M.; Meyer, J. Use of reject heat from biogas power plants for greenhouse heating. Acta Hort. 2008, 801, 719–724. [Google Scholar] [CrossRef]
  7. Oleszek, M.; Tys, J.; Wiącek, D.; Król, A.; Kuna, J. The possibility of meeting greenhouse energy and CO2 demands through utilization of cucumber and tomato residues. BioEnergy Res. 2016, 9, 624–632. [Google Scholar] [CrossRef]
  8. Iwaszczuk, N.; Szyba, M.; Iwaszczuk, A.; Yakubiv, V. Production of agricultural biogas from waste—An element of socially responsible actions in the food sector. Acta Innov. 2019, 33, 52–62. [Google Scholar] [CrossRef]
  9. Janas, M.; Zawadzka, A.A. Assessment of environmental impact of agricultural biogas plant. Acta Innov. 2018, 27, 24–31. [Google Scholar] [CrossRef]
  10. Camarena-Martínez, S.; Martínez-Martínez, J.H.; Saldaña-Robles, A.; Nuñez-Palenius, H.G.; Costilla-Salazar, R.; Valdez-Vazquez, I.; Lovanh, N.; Ruiz-Aguilar, G.M. Effects of experimental parameters on methane production and volatile solids removal from tomato and pepper plant wastes. BioResources 2020, 15, 4763–4780. [Google Scholar] [CrossRef]
  11. Cremonez, P.A.; Teleken, J.G.; Weiser Meier, T.R.; Alves, H.J. Two-Stage anaerobic digestion in agroindustrial waste treatment: A review. J. Environ. Manag. 2021, 281, 111854. [Google Scholar] [CrossRef]
  12. Neshat, S.A.; Mohammadi, M.; Najafpour, G.D.; Lahijani, P. Anaerobic co-digestion of animal manures and lignocellulosic residues as a potent approach for sustainable biogas production. Renew. Sustain. Energy Rev. 2017, 79, 308–322. [Google Scholar] [CrossRef]
  13. Salakkan, A.; Plamgklang, P.; Sittijunda, S.; Kongkeitkajorn, M.B.; Lunprom, S.; Reungsang, A. Bio-Hydrogen and Methane Production from Lignocelluulosic Materials in Biomass for Bioenergy: Recent Trends and Future Challenges; Abd El-Fatah, A., Ed.; IntechOpen: London, UK, 2019; Available online: https://www.intechopen.com/books/biomass-for-bioenergy-recent-trends-and-future-challenges/bio-hydrogen-and-methane-production-from-lignocellulosic-materials (accessed on 1 October 2022).
  14. Bouallagui, H.; Touhami, Y.; Ben Cheik, H.R.; Hamdi, M. Bioreactor performance in anaerobic digestión of fruit and vegetable wastes. Process Biochem. 2005, 40, 989–995. [Google Scholar] [CrossRef]
  15. Shin, H.S.; Han, S.K.; Song, Y.C.; Lee, C.Y. Performance of UASB reactor treating leachate from acidogenic fermenter in the two phase anaerobic digestion of food waste. Water Res. 2001, 35, 3441–3447. [Google Scholar] [CrossRef] [PubMed]
  16. Salomoni, C.; Caputo, A.; Bonoli, M.; Francioso, O.; Rodriguez-Estrada, M.T.; Palenzona, D. Enhanced methane production in a two-phase anaerobic digestion plant, after CO2 capture and addition to organic wastes. Bioresour. Technol. 2011, 102, 6443–6448. [Google Scholar] [CrossRef] [PubMed]
  17. Ariunbaatar, J.; Panico, A.; Esposito, G.; Pirozzi, F.; Lens, P.N.L. Pretreatment methods to enhance anaerobic digestion of organic solid waste. Appl. Energy 2014, 123, 143–156. [Google Scholar] [CrossRef]
  18. Schievano, A.; Tenca, A.; Lonati, S.; Manzini, E.; Adani, F. Can two-stage instead of one-stage anaerobic digestion really increase energy recovery from biomass? Appl. Energy 2014, 124, 335–342. [Google Scholar] [CrossRef]
  19. Pakarinen, O.M.; Tähti, H.P.; Rintala, J.A. One-stage H2 and CH4 and two-stage H2 + CH4 production from grass silage and from solid and liquid fractions of NaOH pre-treated grass silage. Biomass Bioenergy 2009, 33, 1419–1427. [Google Scholar] [CrossRef]
  20. Nkemka, V.N.; Gilroyed, B.; Yanke, J.; Gruninger, R.; Vedres, D.; McAllister, T.; Hao, X. Bioaugmentation with an anaerobic fungus in a two-stage process for biohydrogen and biogas production using corn silage and cattail. Bioresour. Technol. 2015, 185, 79–88. [Google Scholar] [CrossRef]
  21. Arreola-Vargas, J.; Flores-Larios, A.; González-Álvarez, V.; Corona-González, R.I.; Méndez-Acosta, H.O. Single and two-stage anaerobic digestion for hydrogen and methane production from acid and enzymatic hydrolysates of Agave tequilana bagasse. Int. J. Hydrogen Energy 2016, 41, 897–904. [Google Scholar] [CrossRef]
  22. Lobo, B.E.; Sousa, D.R.; Balena, J.G.; Herrera, O.F.; Alves, L.V.; de Aquino, S.F. Evaluation of hydrogen and methane production from sugarcane bagasse hemicellulose hydrolysates by two-stage anaerobic digestion process. Bioresour. Technol. 2016, 218, 436–446. [Google Scholar] [CrossRef]
  23. dos Santos, L.C.; Adarme, O.F.H.; Baeta, B.; Gurgel, L.; de Aquino, S.F. Production of biogas (methane and hydrogen) from anaerobic digestion of hemicellulosic hydrolysate generated in the oxidative pretreatment of coffee husks. Bioresour. Technol. 2018, 263, 601–612. [Google Scholar] [CrossRef]
  24. Valdez-Vazquez, I.; Morales, A.L.; Escalante, A.E. History of adaptation determines short-term shifts in performance and community structure of hydrogen-producing microbial communities degrading wheat straw. Microb. Biotechnol. 2017, 10, 1569–1580. [Google Scholar] [CrossRef] [PubMed] [Green Version]
  25. Pérez-Rangel, M.; Barboza-Corona, J.E.; Buitrón, G.J.; Valdez-Vazquez, I. Essential nutrients for improving the direct processing of raw lignocellulosic substrates through the dark fermentation process. BioEnergy Res. 2020, 13, 349–357. [Google Scholar] [CrossRef]
  26. Lara, A.R.; Sánchez, A.; Vázquez, I. Hydration treatments increase the biodegradability of native wheat straw for hydrogen production by a microbial consortium. Int. J. Hydrogen Energy 2014, 39, 19899–19904. [Google Scholar] [CrossRef]
  27. American Public Health Association (APHA). Standard Methods for the Examination of Water and Wastewater, 21st ed.; American Public Health Association/American Water Works Association/Water Environment Federation: Washington, DC, USA, 2005. [Google Scholar]
  28. Kang, J.; Kim, K.; Oh, G.; Rhee, S. Analysis on biochemical methane potential of agricultural byproducts with different types of silage storage. J. Mater. Cycles Waste Manag. 2013, 16, 468–474. [Google Scholar] [CrossRef]
  29. Miftah, A.K.; Sittijunda, S.; Imai, T.; Salakkam, A.; Reungsang, A. Biohydrogen and Methane Production from Sugarcane Leaves Pretreated by Deep Eutectic Solvents and Enzymatic Hydrolysis by Cellulolytic Consortia. Fermentation 2022, 8, 396. [Google Scholar] [CrossRef]
  30. Cai, Y. Identification and characterization of Enterococcus species isolated from forage crops and their influence on silage fermentation. J. Dairy Sci. 1999, 82, 2466–2471. [Google Scholar] [CrossRef]
  31. Vorholt, J.A. Microbial life in the phyllosphere. Nat. Rev. 2012, 10, 828–840. [Google Scholar] [CrossRef]
  32. Pérez-Rangel, M.; Quiroz-Figueroa, F.R.; González-Castañeda, J.; Valdez-Vazquez, I. Microscopic analysis of wheat straw cell wall degradation by microbial consortia for hydrogen production. Int. J. Hydrogen Energy 2015, 40, 151–160. [Google Scholar] [CrossRef]
  33. Nikolaidis, P.; Poullikkas, A. A comparative overview of hydrogen production processes. Renew. Sustain Energy Rev. 2017, 67, 597–611. [Google Scholar] [CrossRef]
  34. Dareioti, M.A.; Vavouraki, A.I.; Tsigkou, K.; Kornaros, M. Assessment of Single- vs. Two-Stage Process for the Anaerobic Digestion of Liquid Cow Manure and Cheese Whey. Energies 2021, 14, 5423. [Google Scholar] [CrossRef]
Figure 1. Schematic assays of 1SADS and 2SADS in batch.
Energies 15 09137 g001
Figure 2. Hydrogen and biogas cumulative yield (mL/g VS) in the hydrogenesis stage of 2SADS. Error bars correspond to the standard deviation. Zero value represents no detection of the gas.
Energies 15 09137 g002
Figure 3. Cumulative hydrogen production (mL/g VS) in the hydrogenesis stage of 2SADS during an incubation period of 14 d. T1 (♦), T2 (●), T3 (▲), and T4 (×). Error bars correspond to the standard deviation at each point.
Energies 15 09137 g003
Figure 4. Methane and biogas cumulative yield (mL/g VS) in 1SADS and 2SADS. Treatments T1 to T4 were performed in two stages, while treatment T5 was performed in one stage. The error bars correspond to the standard deviation.
Energies 15 09137 g004
Figure 5. Cumulative methane production (mL/g VS) during an incubation period of 28 d. T1 (♦), T2 (●), T3 (▲), T4C (×), and T5 (■). Treatments T1 to T4 were performed in two stages, while treatment T5 was performed in one stage. Error bars correspond to the standard deviation.
Energies 15 09137 g005
Figure 6. Graph of means to compare the significant differences in CH4 yield (mL/g VS) between the treatments performed in 2SADS (T1–T4) with respect to the treatment performed in 1SADS (T5).
Energies 15 09137 g006
Figure 7. Percentage of TS (a) and VS (b) at the beginning (dark green bars) and at the end (light green bars) of the methanogenesis stage. Error bars correspond to the standard deviation of duplicate samples.
Energies 15 09137 g007
Table 1. Treatments for the two-stage system (2SADS).
TreatmentHydrogenesis Stage
Initial pHX1Temperature (°C)X2
15.5−137−1
25.5−155+1
36.5+137−1
46.5+155+1
Table 2. Comparative studies of 1SADS VS 2SADS from different lignocellulosic residues.
SubstratePretreatment2SADS1SADSIMY aRef.
Hydrogenesis StageMethanogesis Stage
Corn silageSilage and Bioaugmentation with Pyromyces rhizinflata YM60059 mL H2/g VS
120 mL CH4/g VS
Uncontrolled pH
HRT 4.3 d
OLR 5.0 g COD/L-d
Semicontinuous
175 mL CH4/g VS
Uncontrolled pH
Batch
358 mL CH4/g VS
Uncontrolled pH
RT 60 d, 37 °C
S/I 1.0
Batch
−51%[20]
Hydrolyzate of Agave tequilana bagasseEnzimatic (Celluclast 1.5 L 45 °C/10 h)3.4 mol H2/mol hexose
Initial pH 7.0, RT not mentioned, 37 °C
20% (v/v) hydrolyzate
Batch
240 mL CH4/g COD
Initial pH 8.0
RT not mentioned, 37 °C
Batch
90 mL CH4/g COD
pH 8.0, RT not mentioned, 37 °C
20% (v/v) hydrolyzate, Batch
267%[21]
Sugarcane bagasseAutohydrolysis (182.9 °C, 40.7 min)3.7 mmol H2
pH 5.5
RT 19 d, 35 °C
S/I 1.85 (g TOC/g VSS)
Batch
1.87 mmol CH4
pH not mentioned
RT 20 d, 35 °C
S/I 0.4 (g TOC/g VSS)
Batch
N.A.400% b[22]
Coffee husksOzonolysis (liquid-to-solid ratio 10 mL
/g, pH 11, 18.5 mg O3/g substrate)
48.5 mL H2/g COD
pH not mentioned
RT 700 h, 35 °C
S/I 1.8 (g COD/g VSS)
Batch
284.6 mL CH4/g COD
pH not mentioned
RT 900 h, 35 °C
S/I 0.7 (g COD/g VSS)
Batch
91.1 mL CH4/g COD
pH not mentioned
RT 900 h, 35 °C
S/I 0.7 (g COD/g VSS)
Batch
312%[23]
Tomato plant residuesNone11.6 mL/g VS
Initial pH 6.5,
RT 14 d, 37 °C
Batch
252.3 mL/g VS
Uncontrolled pH
RT 28 d, 37 °C
S/I 0.5 (g VS/g VS)
Batch
365.4 mL/g VS
Uncontrolled pH
RT 28 d, 37 °C
S/I 0.5 (g VS/g VS)Batch
−31% cThis study
a Increased Methane Yield (IMY) in 2SADS with respect to 1SADS; b Estimated value using a mathematical model; c This percentage did not represent a significant difference (p > 0.05) in the production of CH4 between a 1SADS with respect to 2SADS. NA: not applicable.
Publisher’s Note: MDPI stays neutral with regard to jurisdictional claims in published maps and institutional affiliations.

