1. Introduction
Worldwide concerns over energy optimization and waste energy recovery have sparked initiatives for various research. The main aim has been to harness wasted energy in common industrial applications. One of those approaches is to utilize natural gas transmission lines with their rich gas flows and high pressure for electricity generation [
1]. This can be achieved at the consumer destination, where expander generators can replace conventional pressure-reducing valves.
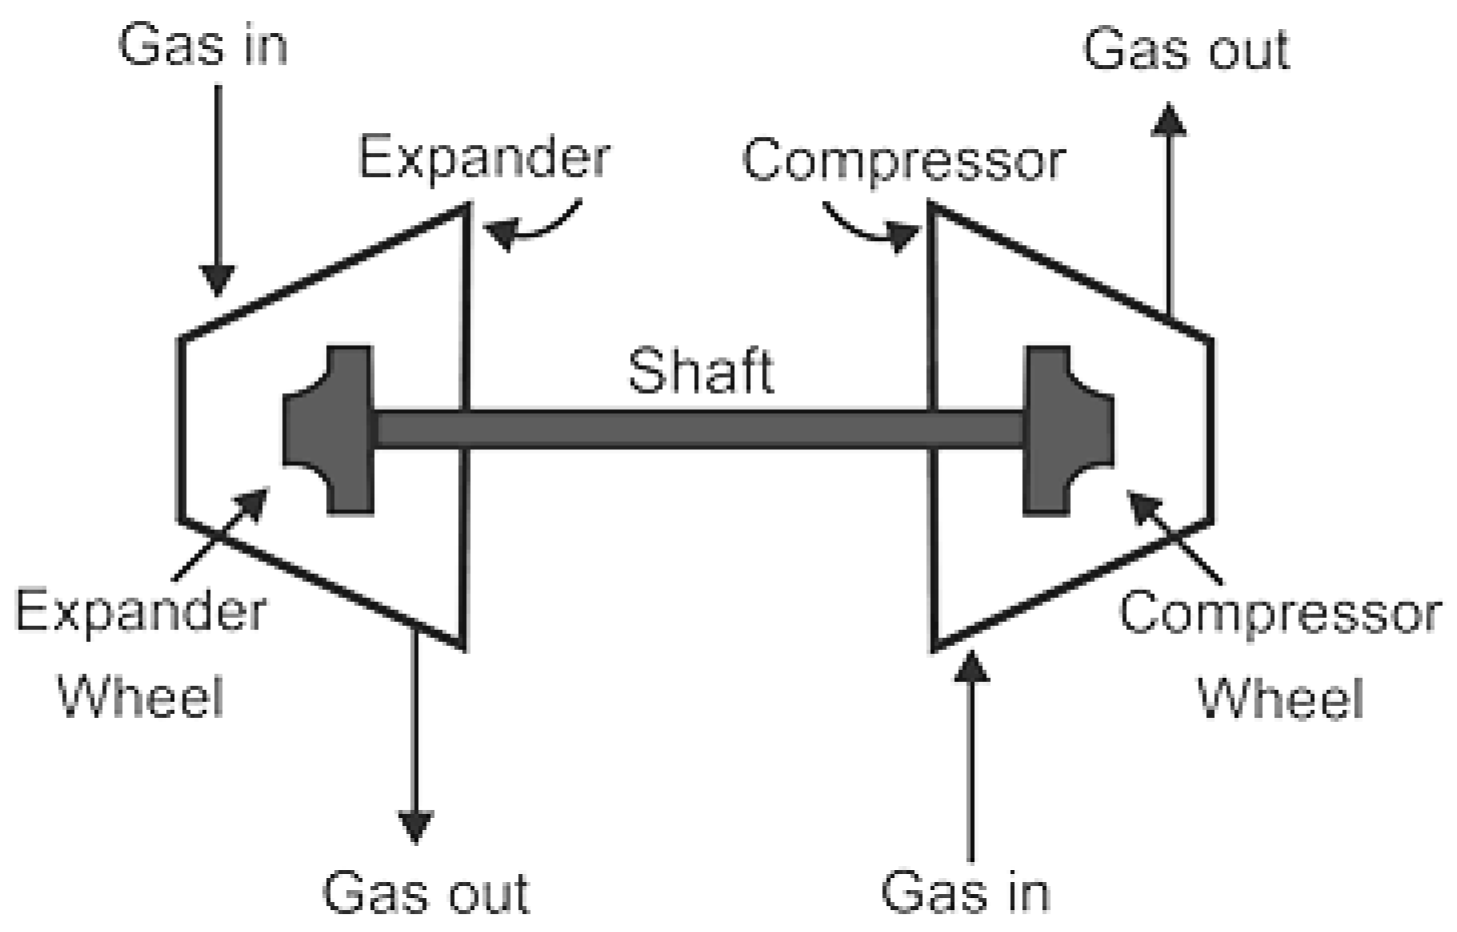
Expander generators are turbomachinery expansion turbines that allow the passage of gaseous fluids at high pressure through guided vanes and impellers that utilize pressure drops to reach isentropic gaseous expansion. Then, the shafts are rotated at fixed speeds for stable electricity generation. This effectively enhances traditional systems in hopes of raising efficiency, fuel saving and generating electricity from energy-dissipating conventional systems [
2]. A figure that describes the main components of the turbo expander is shown in
Figure 1. The utilized expander generator works with the same principle as the turbo expander. The main difference lies in replacing the compressor with a generator attached to the expander shaft.
On the contrary, conventional pressure-reducing valves rely on isenthalpic expansion through which pressure is converted to velocity through a Joule–Thomson effect, causing friction, heat dissipation and wasted flow velocity [
3]. Global research has shown an interest in energy recovery applications in general and in expander generator replacements of conventional systems in particular.
Davide Borelli et al. have discussed waste energy recovery from a natural gas distribution network: the CELSIUS Project Demonstration [
4]. The possibility of utilizing natural gas pressure potential in Genova to generate electric power has been proposed using an expander generator system. This system combines heat and power unit linkage of Genova’s present district heating network. The energy recovered from this system was found to be 2.9 GWh/year of electricity savings which is equivalent to more than 1000 tons of CO2/year of natural gas saved.
Imran Nazir et al. studied the expected power production potential of various unit sales metering stations (SMS) of an SSGCL company by simulating the HYSYS model [
5]. The simulated system relied on the expander generator’s power utilization from a natural gas high pressure–high flow. The obtained results were 1.7 MW of electricity savings in one SMS.
Saif Ul Islam et al. presented an energy recovery system at a natural gas regulating station by replacing the pressure control valve with a turbo expander using Aspen HYSYS: A WAH +SMS (sales metering station) located in Pakistan was used in this study [
6]. The obtained results show power saving of up to 180 kW based on 80% conversion efficiency that can be produced by installing a turbo expander at the city gate station.
Furthermore, Golchoobian et al. presented research on thermodynamic analysis of turboexpander and gas turbine hybrid systems for gas pressure reduction stations of a power plant [
7]. The aim of this study was to utilize pressure-reduction energy waste in driving a turboexpander. The thermal energy of the gas turbine outlet was also used to preheat the turboexpander inlet gas. These results illustrate the way that the turboexpander preheating power savings are more than 1200 kW. The turboexpander produced mechanical power of more than 950 kW and cooling power between 2700 and 5300 kW for the warm months of the year.
Mihaela NORIȘOR et al. studied energy recovery in pressure reduction stations of natural gas using expander generators [
8]. The aim of this research was to investigate the considerable decrease in temperature at the exit of the turboexpander. Two solutions were studied. Firstly, the natural gas preheating solution is to burn gas share in a furnace prior to its expansion in an expander generator. The second solution is a gas intermediate preheating and fractional expansion to avoid condensate formation and prevent the expander generator application from falling into the cryogenic low-temperature operation zones. These calculations indicate that reducing the natural gas pressure from 20 bar to six by expanding it in a turbo expander leads to negative gas temperatures at the turboexpander outlet. The solution of preheating the natural gas up to 80 °C by burning a share of the gas in a furnace led to a gas temperature of 10 °C at the turboexpander outlet. Thus, removing the temperature limitation issue.
Regarding Egypt’s research approaches to energy harness generally and on expander generator replacements of conventional systems. Doaa M Attia et al. discussed the organic Rankine cycle (ORC) based on geothermal energy for power generation in Egypt [
9]. The design of a binary cycle power plant was addressed. This design utilized the low-temperature geothermal resources of temperatures up to 92 °C and four alternative working fluids—Butane, Isobutane, Pentane and 1,1,1,3,3-Pentafluoropropan (R245fa)—were used. Bir Nabi is a well under construction in the eastern desert of Egypt. The paper proposed a design of an ORC binary power plant for low-temperature geothermal resources to suggest a proper system for geothermal energy harness.
Omar Aboelwafa et al. studied power generation using waste heat recovery by Organic Rankine Cycle and steam Rankine cycle in the cement industry [
10]. The need for the use of ORC for power generation is addressed when compared to the steam Rankine cycle in a cement plant in Egypt. Aspen HYSYS was used to build the simulation model in which water and methanol have been investigated. The comparison is based on parameters such as net power output, efficiency, and profitability analysis. As a result, the authors were able to perform a comparative analysis of waste heat recovery in an existing Egyptian cement plant using the ORC and steam Rankine cycle.
Mostafa A. Elshahed et al. discussed the recovery of lost power in natural gas pressure reduction stations using hybrid expander generators and fuel cell systems [
11]. Hybrid single/dual expander generators and fuel cells were used to capture lost energy in El-Mansoura pressure-reducing station (PRS) and produced electrical power that could be supplied to the grid. El-Mansoura PRS was selected specifically because of the high-pressure and high flow rate. It was found that the optimal efficiency for this PRS was achieved when using a 15,000 m
3/hr. Single turbo expander with a 300 KW fuel cell power, signaling an increase in the fuel used for preheating by 116,362,557 m
3 annually.
In correspondence with all the previous research, their methodologies and energy harness objectives, this paper endorses the same approach for the development of a case study for energy recovery and its utilization on a specific sector of the Egyptian natural gas national grid. Such a specific sector was chosen to be the new gas extension line to New Al-Alamein city due to the following reasons:
1. New cities usually seize governmental interest and effort for the provision of adequate infrastructure and the facilities necessary to rise with population demands and attractions. At a proper cost and energy promise, such an energy recovery solution can add value to the supply of some of the electricity needs of the city in a green and efficient way.
2. The extension line is currently undergoing construction phase. Hence, natural gas supply has not been linked yet to allocated cities. This provides practicality for new approaches beside the rejuvenation of existing conventional pressure reducing stations. Thus, no down time is at stake and no initial costs are brought to waste.
1.1. Egypt’s Natural Gas Extension to New Al-Alamein City
Egypt’s natural gas transportation policy regarding the national grid is known to sustain a source pressure of 71 bar to 53 bar throughout various natural gas processing plants scattered across Egypt. Such an approach allows the compressed gas to travel through reduced transportation pipe sizes so that when consumers’ destinations are reached, the pressure can be reduced to eight bar to ensure safe gas travel through the inner transmission grids of Egyptian cities.
Regarding natural gas supply to thermal power plants commodities, it is globally known that this ranges from two to 44 bar based on the burner’s module. Given Egypt’s natural gas national company’s transportation policy, this is set to be supplied at eight bar whenever a thermal power plant application is approached. Potential consumers for these new extension lines are shown in
Table 1.
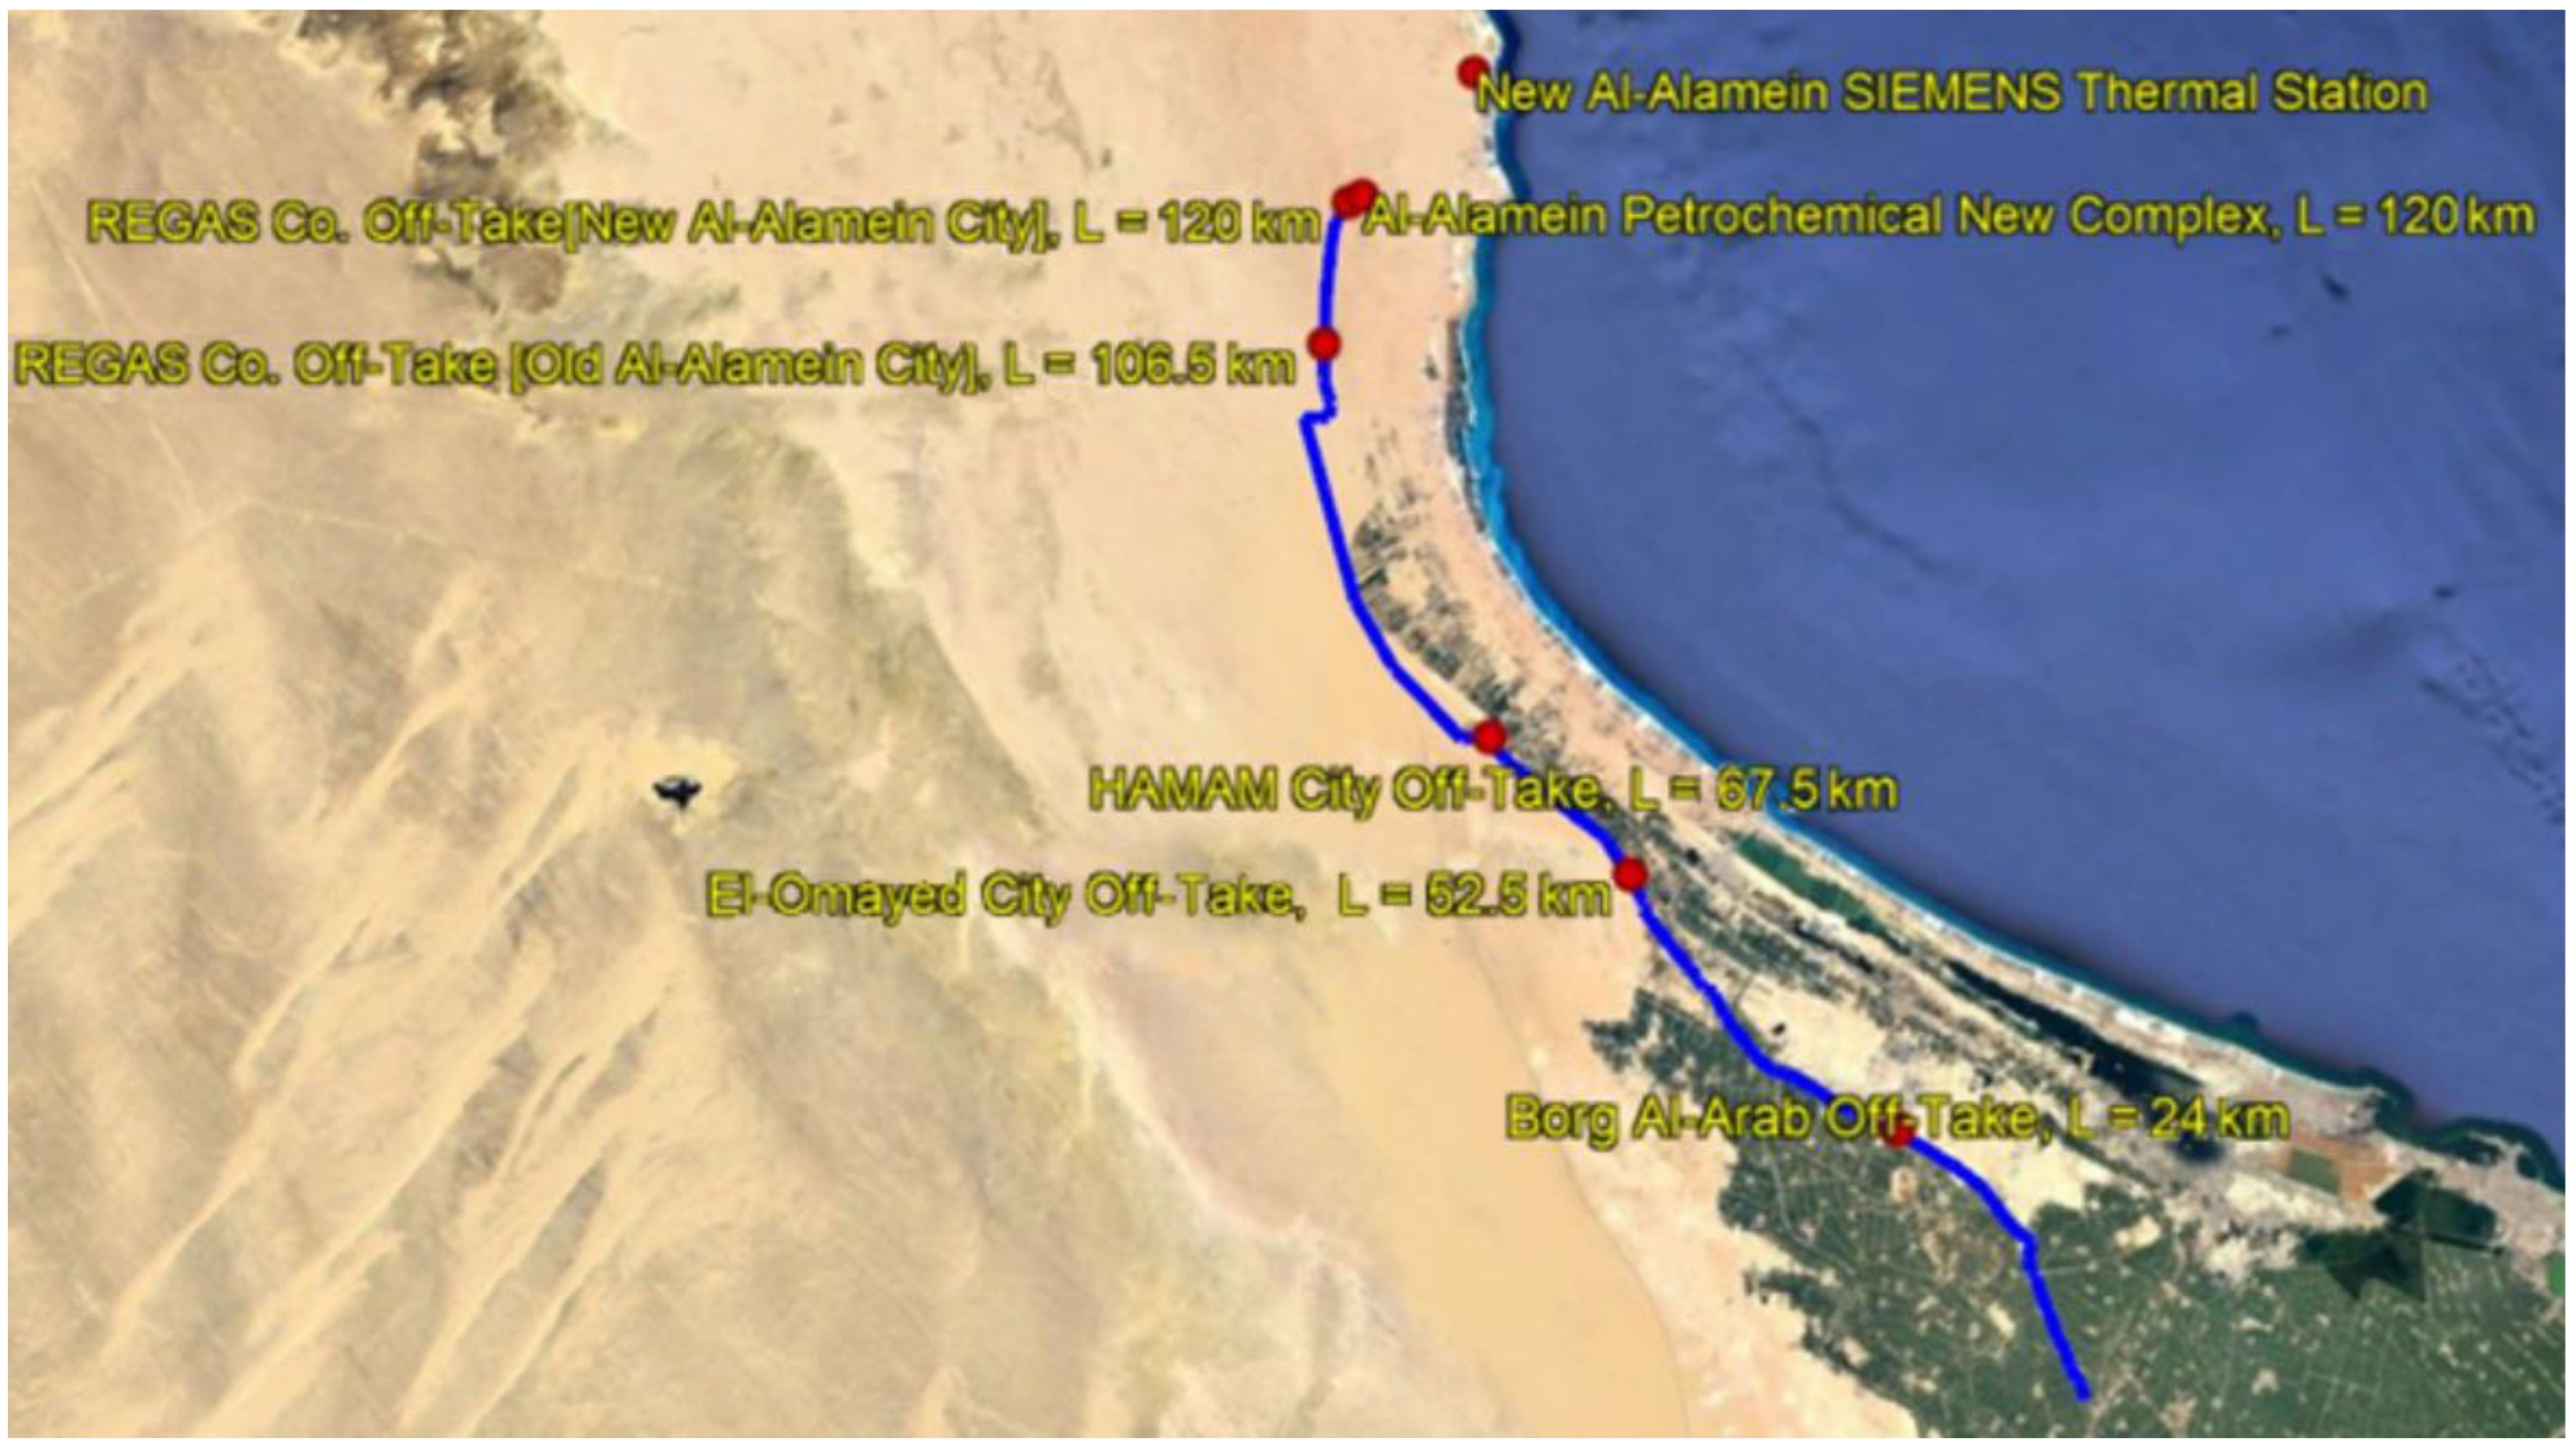
As for the ongoing routing of the New Al-Alamein city gas line,
Figure 2 shows a screenshot from Google earth for the current planning phase.
The natural gas feed in this region is supplied from the national grid through the Western Desert Gas Complex located in the city of Amreya. Such a gas treatment facility processes the feed of the gas wells by separating water content and natural gas condensates among the other gas constituents, such as ethane, propane and butane for petrochemical use and gas export. The remaining natural gas, composed mostly of methane, is then passed to the national gas grid for city pipeline transportation. Hereby, this gas is fully treated through dehydration and drying packages that extract water vapor content and condensate gas C
3+. The ongoing pipeline extension is connected to the existing national grid through the Al-Galaa pressure regulating station (17 km from the Western Desert Gas Complex). The distance between the Al-Galaa pressure station and New Al-Alamein city is 120 km. In addition to New Al-Alamein city, this line also serves other close cities such as El Hamam and Borg El Arab. Hereby, the expected natural gas flow rate supply of the New Al-Alamein city extended line is thoroughly shown in
Table 1.
1.2. SIEMENS Thermal Power Plant in New Al-Alamein City
Nowadays, New Al-Alamein city is undergoing up-to-date developments and extensions that include the construction of a SIEMENS thermal power plant combined cycle [
12]. This SIEMENS thermal power plant will be situated approximately 20 km away from the Al-Alamein gas extension line’s end, as shown in
Figure 2.
1.3. Research Objectives and Optimization Criterion
The objective of this paper to thoroughly inspect the potential of energy recovery in the gas extension line through which energy waste can be utilized effectively in the supply of green energy to New Al-Alamein city. In order to achieve such goal, a real case study of new gas extension line was studied, and practical scenarios and locations were suggested as to where such expander generator pressure reducing systems may be placed. Input parameters for proposed systems at their suggested locations were theoretically derived, and simulation through a commercially available software was implemented to estimate energy output at each scenario. Limitations of safe operation of such systems were considered, and scenarios were compared throughout a specific optimization criterion to select the most favourable scenario.
The main optimization goals in this research can be summarized as follows:
- (1)
Maximize energy recovery output in the form of useful power with the least energy input requirements of the proposed systems.
- (2)
Minimize dependency of fuel consumption as a source of heat addition of proposed systems to overcome hydrate formation constraints.
This paper is summarized as follows; the methodology of this research is presented in
Section 2. The modelling and simulation of the three scenarios are presented in
Section 3. The obtained results are detailed and discussed in
Section 4. Conclusion and future work are presented in
Section 5.
2. Methodology
The presented scenarios in this paper are governed by global energy recovery practices. Pressure potential difference in gas grid can be utilized in the following approaches:
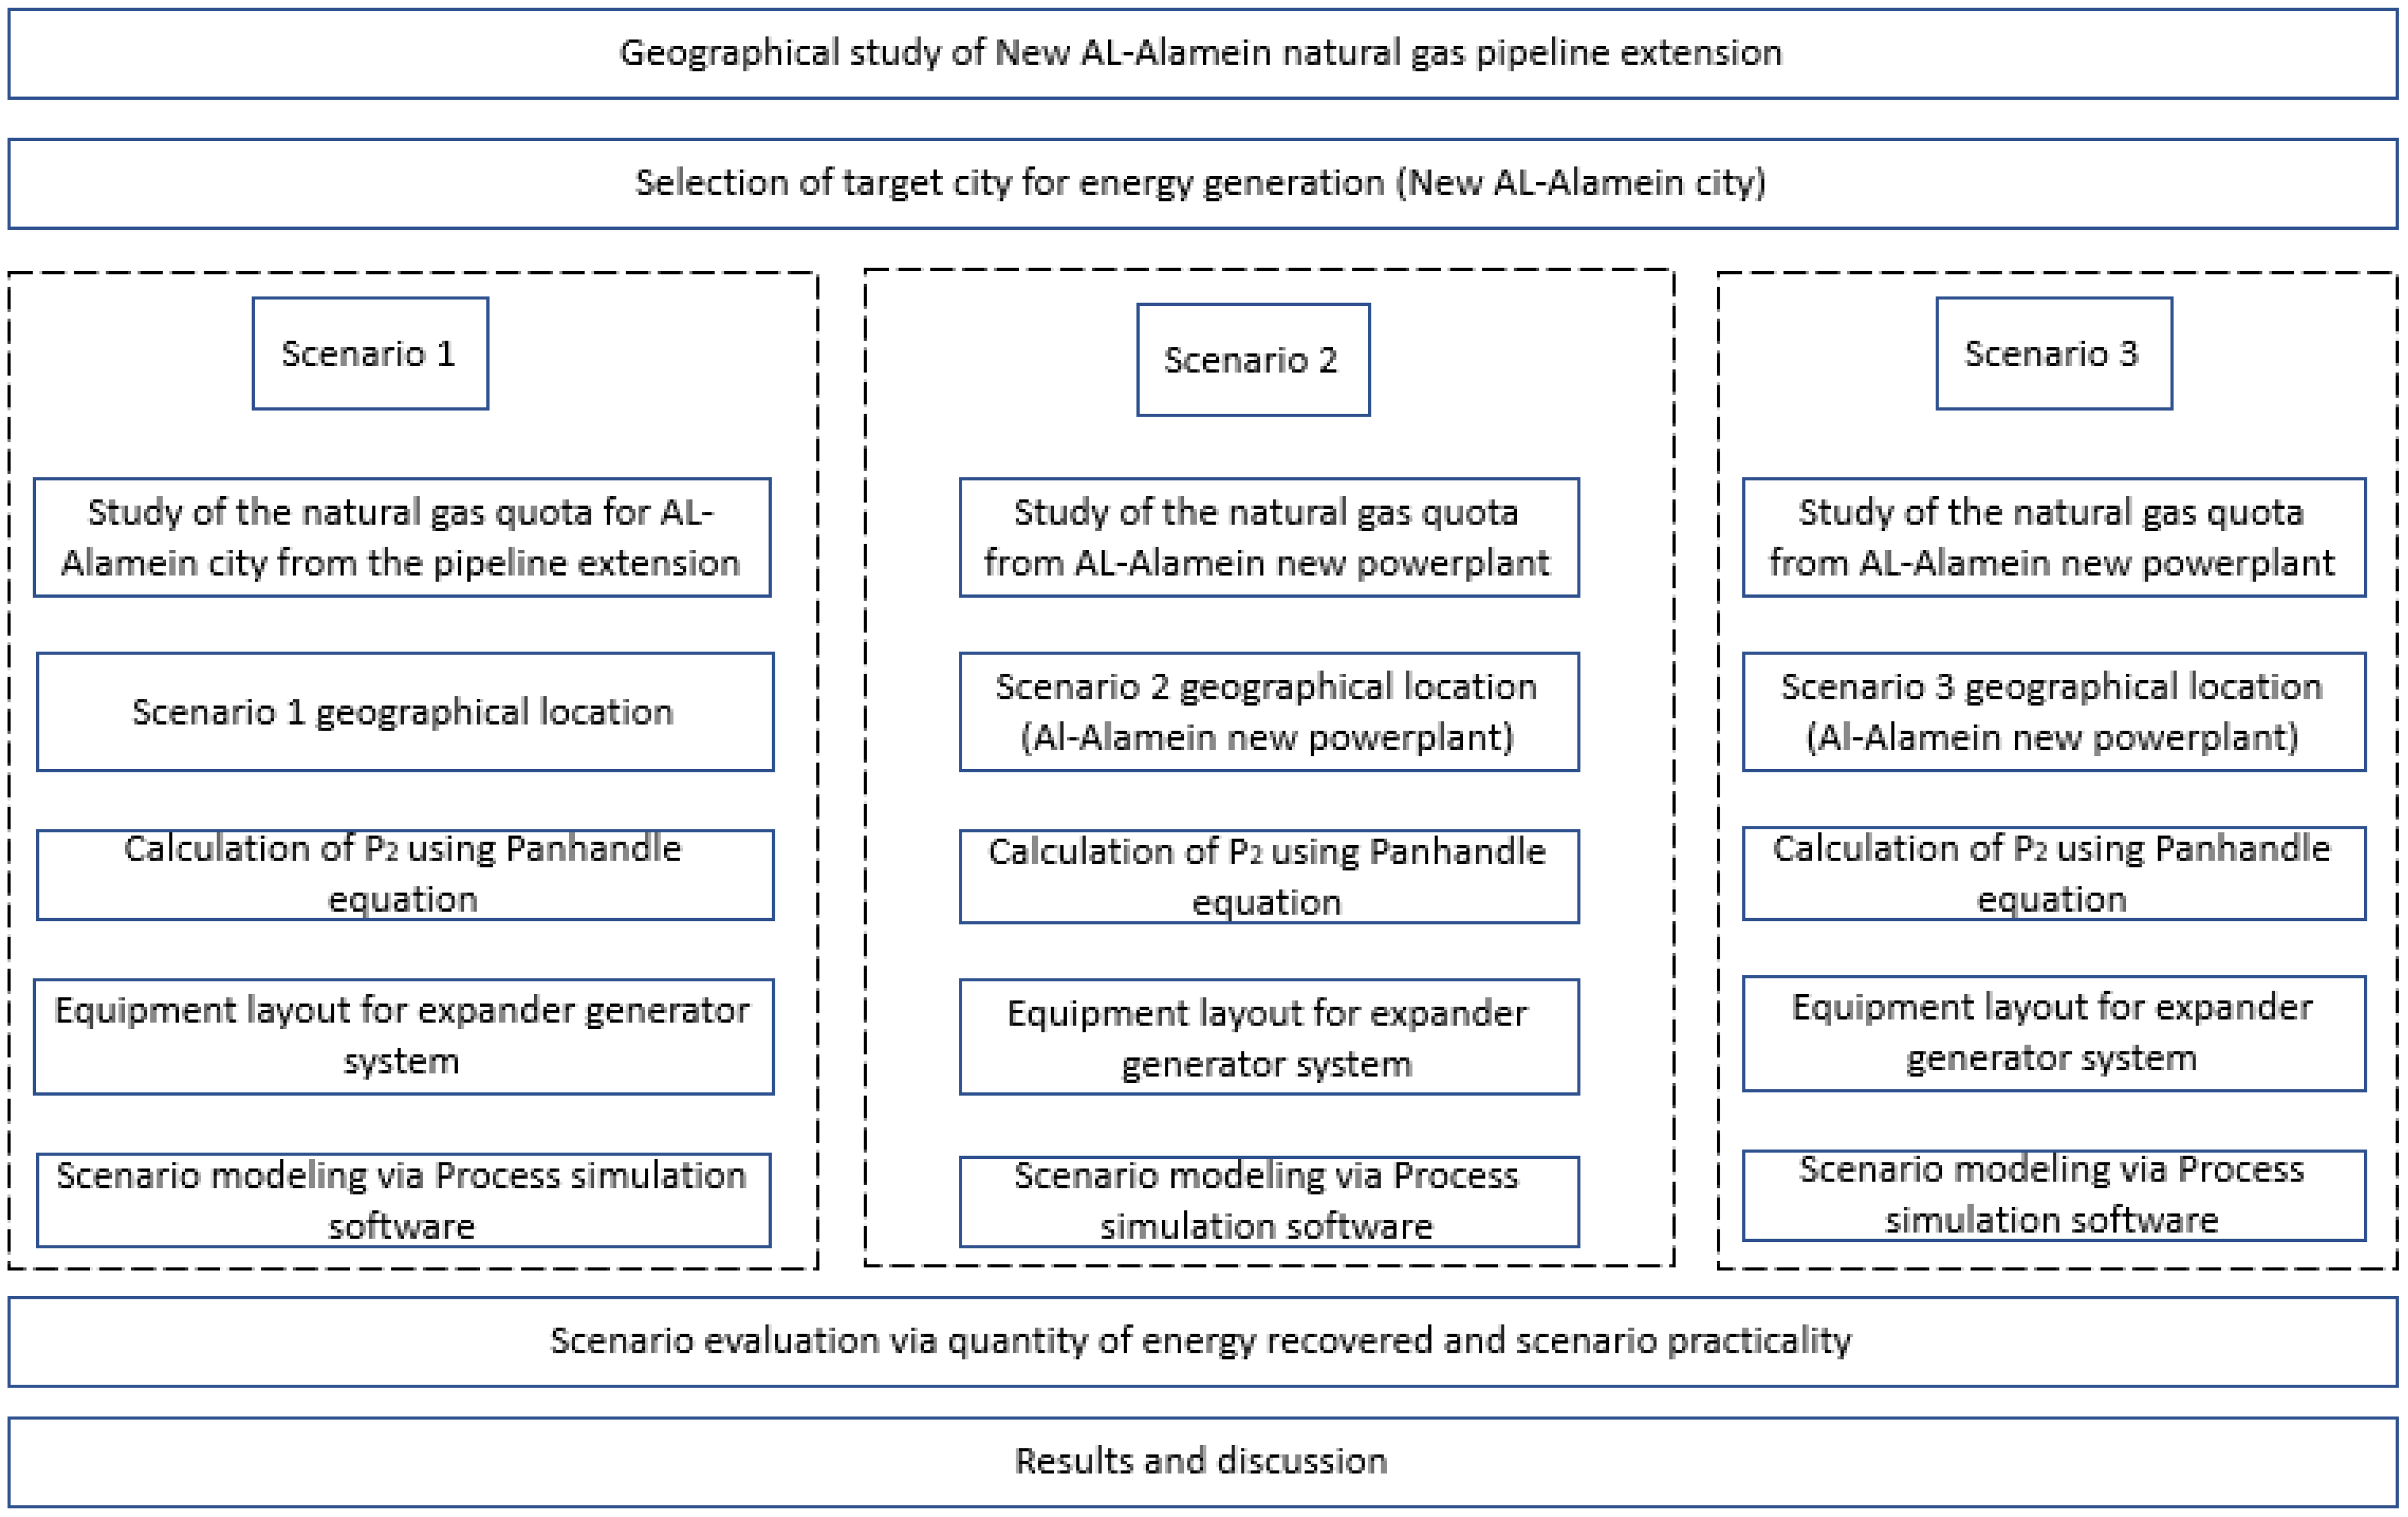
Scenario 1 proposes the maximum attainable electricity generation through the application of the total inlet gas feed of Al-Alamein city in an expander generation system and studies the implications (energy demand) of preheating requirements through a fuel consuming preheater.
Scenario 2 proposes electricity generation with no energy input cost by preheating the gas inlet feed of an expander generator system through the exhaust gas outlet of the gas turbines present in New Al-Alamein’s thermal power plant.
Scenario 3 proposes a power/cooling system in New Al-Alamein’s thermal power plant to supply electricity, in addition to cooling capacity that can be used to:
Enhance the volumetric efficiency of thermal power plant thermal power cycles.
Satisfy New Al-Alamein’s thermal power plant cooling loads with energy recovered, thus saving energy even more by refraining from a vapor compression cycle and utilizing energy recovery instead.
District cooling.
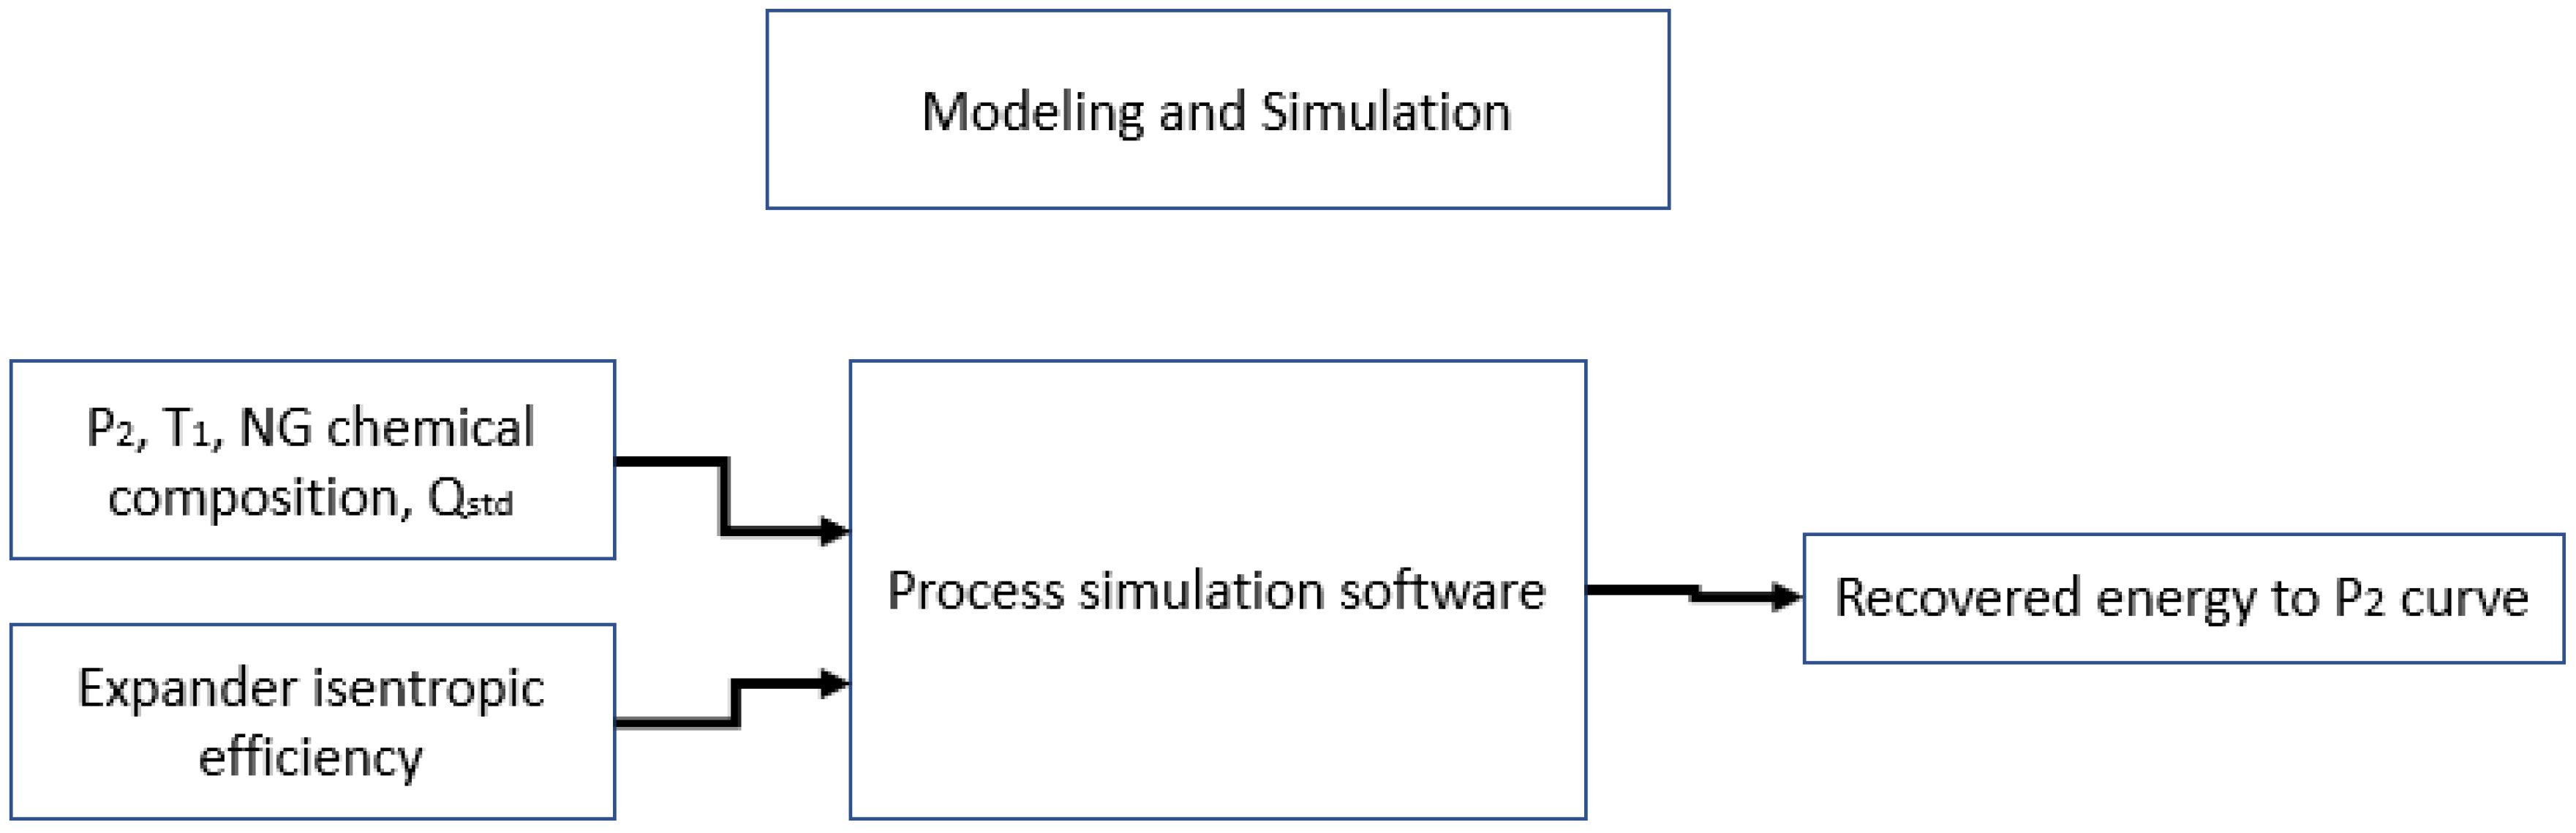
To implement the previously mentioned scenarios. The new system needs to be modeled. Real field data have been acquired from the natural gas company in Egypt. These parameters are summarized in
Table 2. Additionally, the chemical composition of natural gas is needed in the next models and is detailed in
Table 3.
2.1. Modeling Scenarios for Energy Recovery
As mentioned earlier, there are three proposed scenarios for energy recovery in this paper. As shown in
Figure 3. The first scenario proposes the placement of an expander generator pressure-reducing station at a pipeline travel distance of 106 km, just 0.5 km before the old Al-Alamein natural gas supply takeoff. This station will be located at Petroleum Street and will utilize the quota for new and old Al-Alamein cities of a total natural gas flow of 5.736 MMSCMD.
The second and third scenarios propose the placement of an expander generator pressure-reducing station at the New Al-Alamein SIEMENS combined cycle power plant. This station will be close to the coastal side of Sidi Abd El Rahman at 20 km from the end of the New Al-Alamein city pipeline extension. For compressible gases, pressure calculation at any travel distance through a pipe can be identified by a set of equations. The equation recommended for use in this work is the Panhandle equation, as it is one of the most widely used equations for long lines transmission and delivery research fields [
13].
The Panhandle rule consists of two similar equations known as Panhandle A and Panhandle B. The choice between both equations depends on the range of Reynolds number of the actual gas flow in the pipeline. Hence, the Reynolds number needs to be derived and assessed. If the Reynolds number is greater than 14 × 106, Panhandle B is recommended. Whereas a Reynolds number between 4 × 10⁶ to 14 × 106 recommends Panhandle A.
2.2. Utilizing Reynolds Number and Panhandle Equation
To calculate the Reynolds number, the following steps are considered:
Inlet pressure at the gas extension line starting point as shown in
Table 2.
Isothermal average temperature of natural gas is 30 °C.
Natural gas composition is taken as an average from the natural gas chemical composition previously shown in
Table 3.
Standard volume flow rate of 9.936 MMSCMD at starting point and 5.736 MMSCMD at the destination of the first scenario expander generator pressure-reducing station.
The compressibility factor Z which depends on:
The compressibility factor (
Z) at the line’s starting point at the Western Desert Gas Complex is 0.855 at
and 0.885 at
. Hence, the Reynolds number shall be calculated using Equation (3) as follows:
where
D is the pipe inner diameter accounted from ASME B36.1. The standard natural gas volume flowrate was used to calculate actual gas flowrate in m
3/s as can be seen in Equation (4), where as
is substituted with
= 71 bar [
15]:
As a result,
Qact from the equation is 1.4773 m
3/s and by considering the equation,
is found to be 3.1 m/s and the Reynolds number is calculated as 10.69 ×
. The same steps are recalculated at
= 53 bar,
= 9.936 MMSCMD and
= 0.885. The resultant
is found to be 4.3 m/s. Thus, the Reynolds number is calculated as 11.35 ×
. Since the Reynolds number at the starting points of the pipeline is less than the limit 14 ×
, Panhandle A is applicable and is used to estimate the pressure of natural gas arrival at the first scenario (106 km pipe travel distance). Panhandle A equation is mentioned in Equation (6) as follows [
16]:
The input parameters for the previous equation are listed in
Table 4. By substituting the pipeline pressure range supply at scenario 1.
is found to be 68.3 bar and
is 49.2 bar.
By considering the pressure drops due to geographical elevation differences and minor valve, elbow, and fitting losses, the simulation pressure range used for scenario 1 will be 67 bar maximum and 48 bar minimum. Additionally, the Reynolds number in both cases is found to be 6.2 × and 6.54 × respectively.
The same calculations are used for scenario 2 and 3. Hence, the arrival pressure at New Al-Alamein combined cycle station (20 km away from the extension line’s end and with a pipeline diameter of 0.4064 m, 1.03 MMSCMD) would be = 66 bar and = 47 bar.
2.3. Principal Requirements for System Modeling
There are several technical settings that should be considered for modeling the suggested expander generator system. Due to the nature of the isentropic work that would be exerted on the expander generator by the inlet feed stream, the hydrate point of the natural gas must be taken into consideration in all scenarios. Hereby, for scenario 1, it is essential that a gas heater is introduced just before the expander generator, and that the fuel that is used be from an external supply. In addition, the chemical composition of the inlet natural gas stream is taken to be the average mentioned previously in
Table 3.
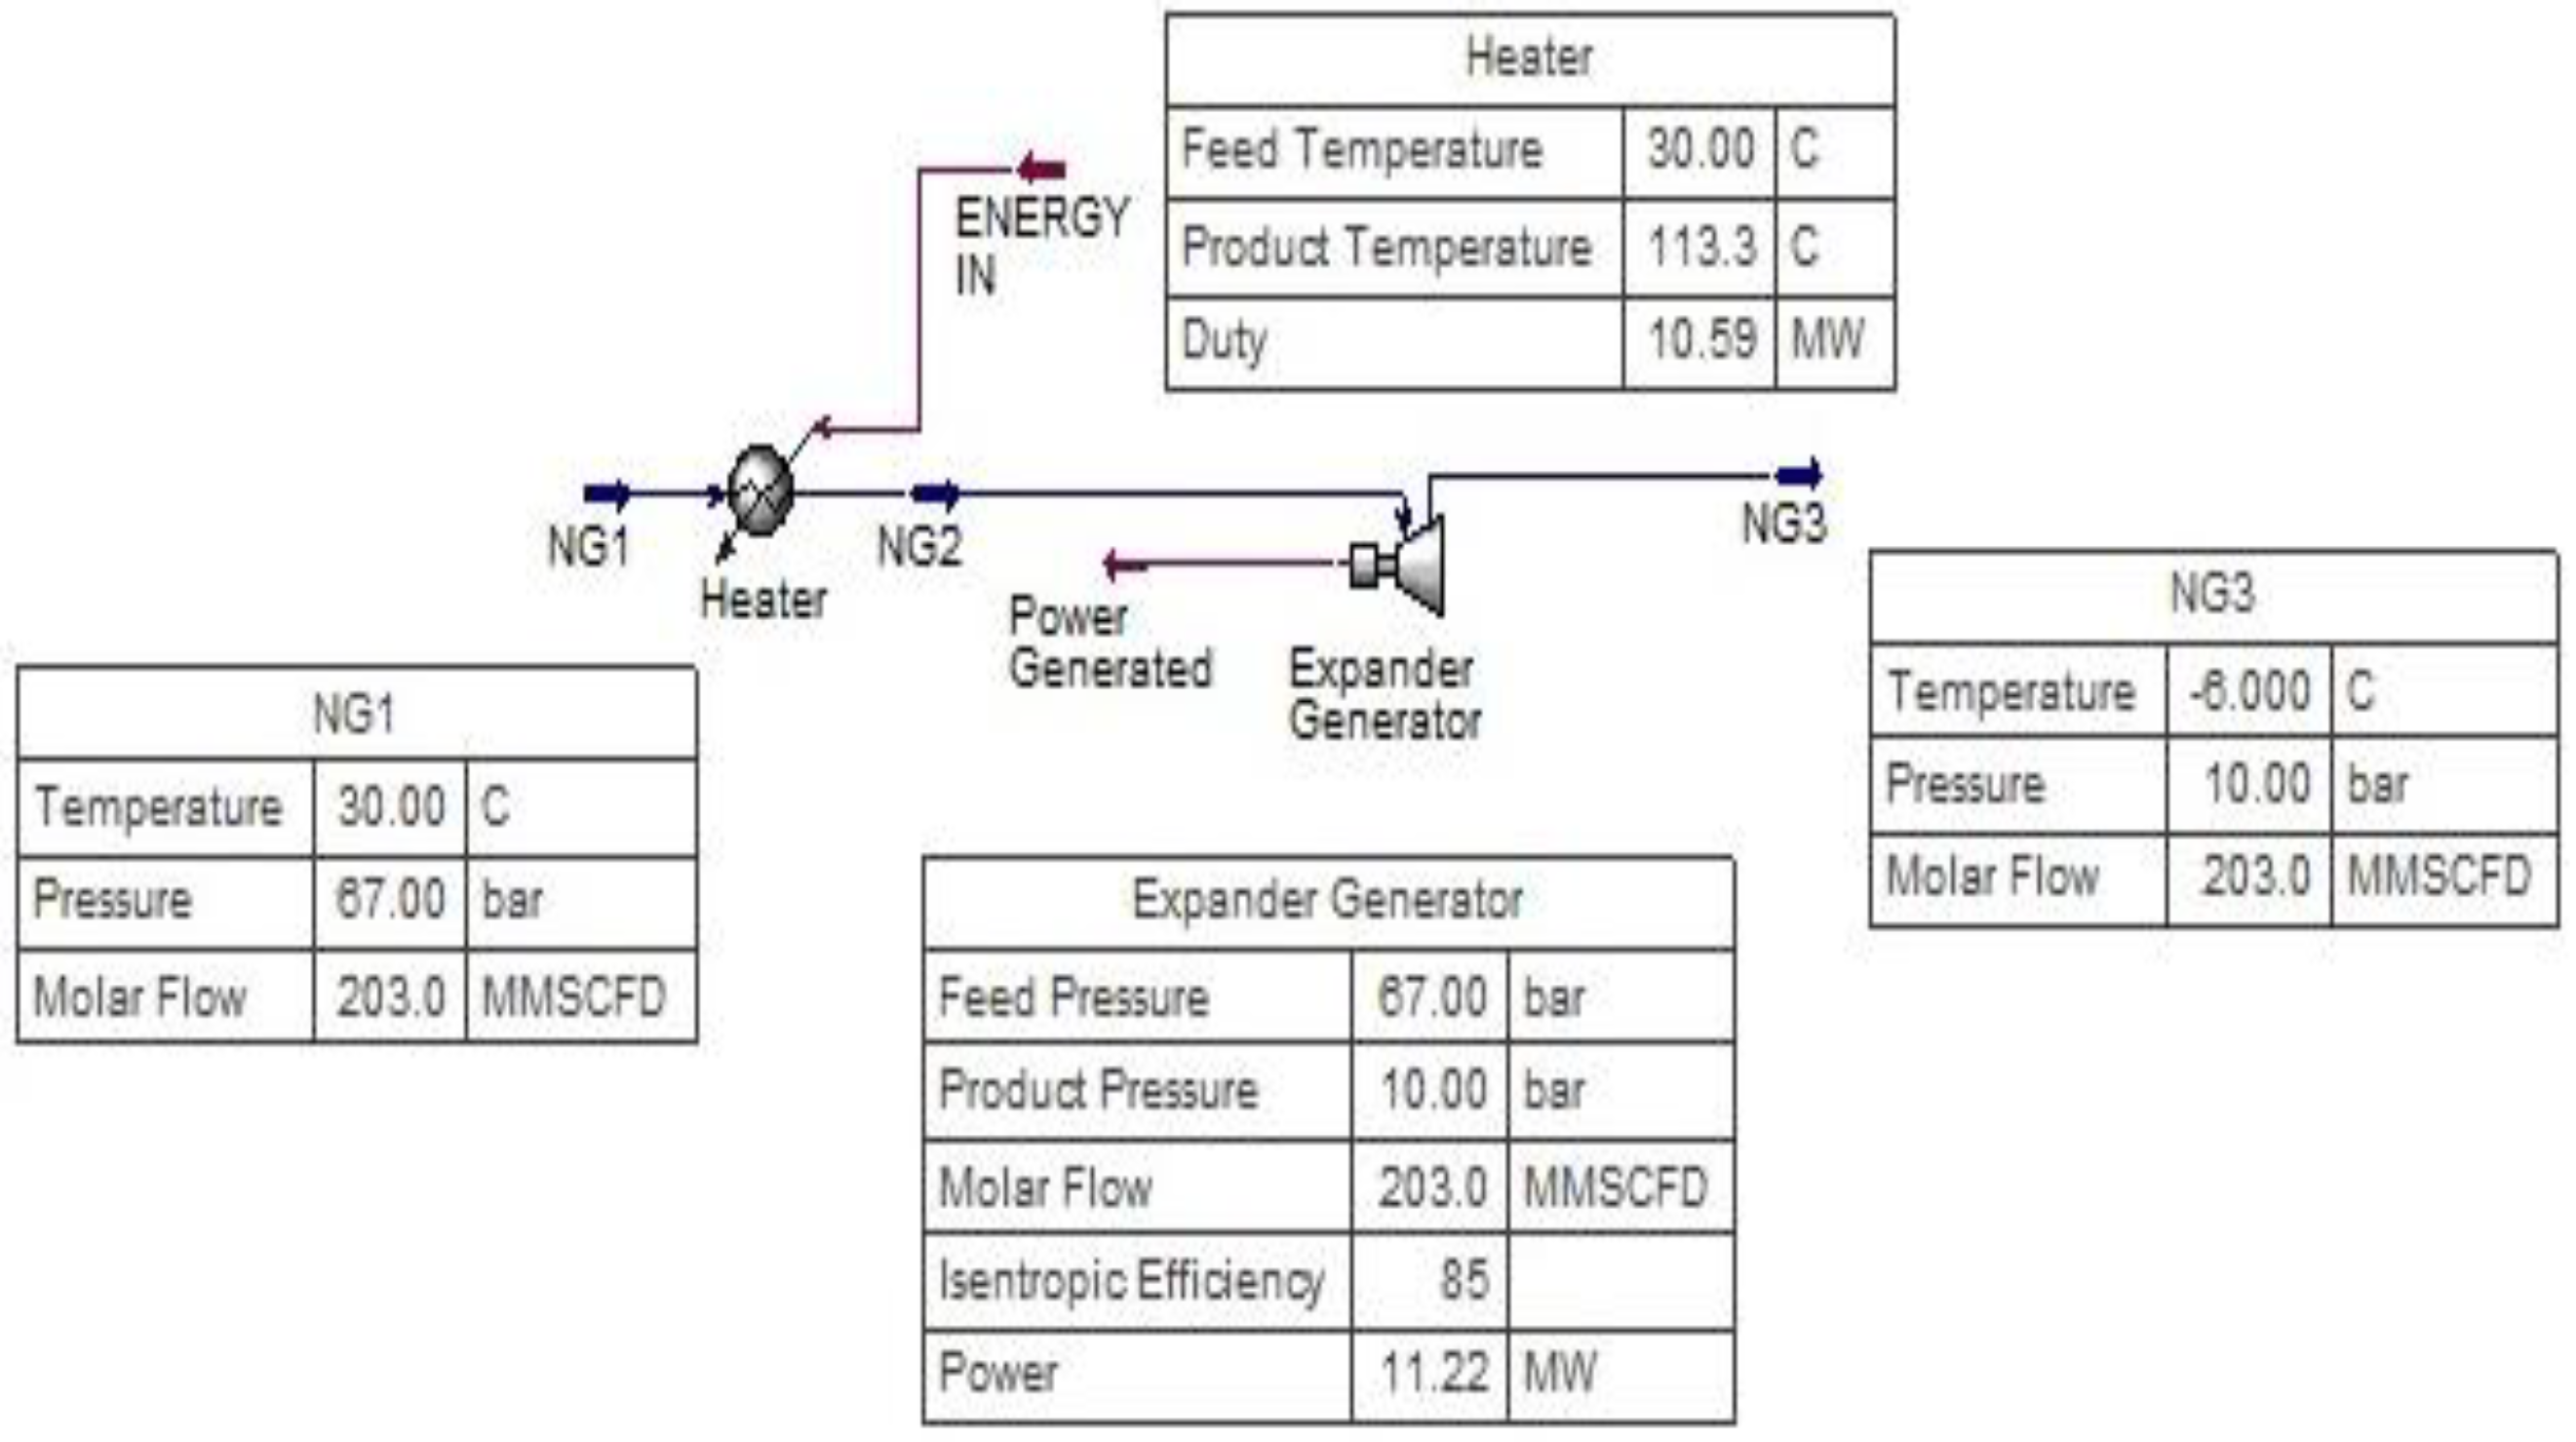
Following the same pressure gradient calculated above through Panhandle A, the pressure outlet of the expander is set to 10 bar to reserve pressure for the delivery of natural gas to the farthest client in the line. The temperature outlet will be assumed to be −6 °C and will be checked with the hydrate point. The desired modeling outputs are the expander power variation to the pressure inlet and the rate of heat flow of the heater variation to the pressure inlet.
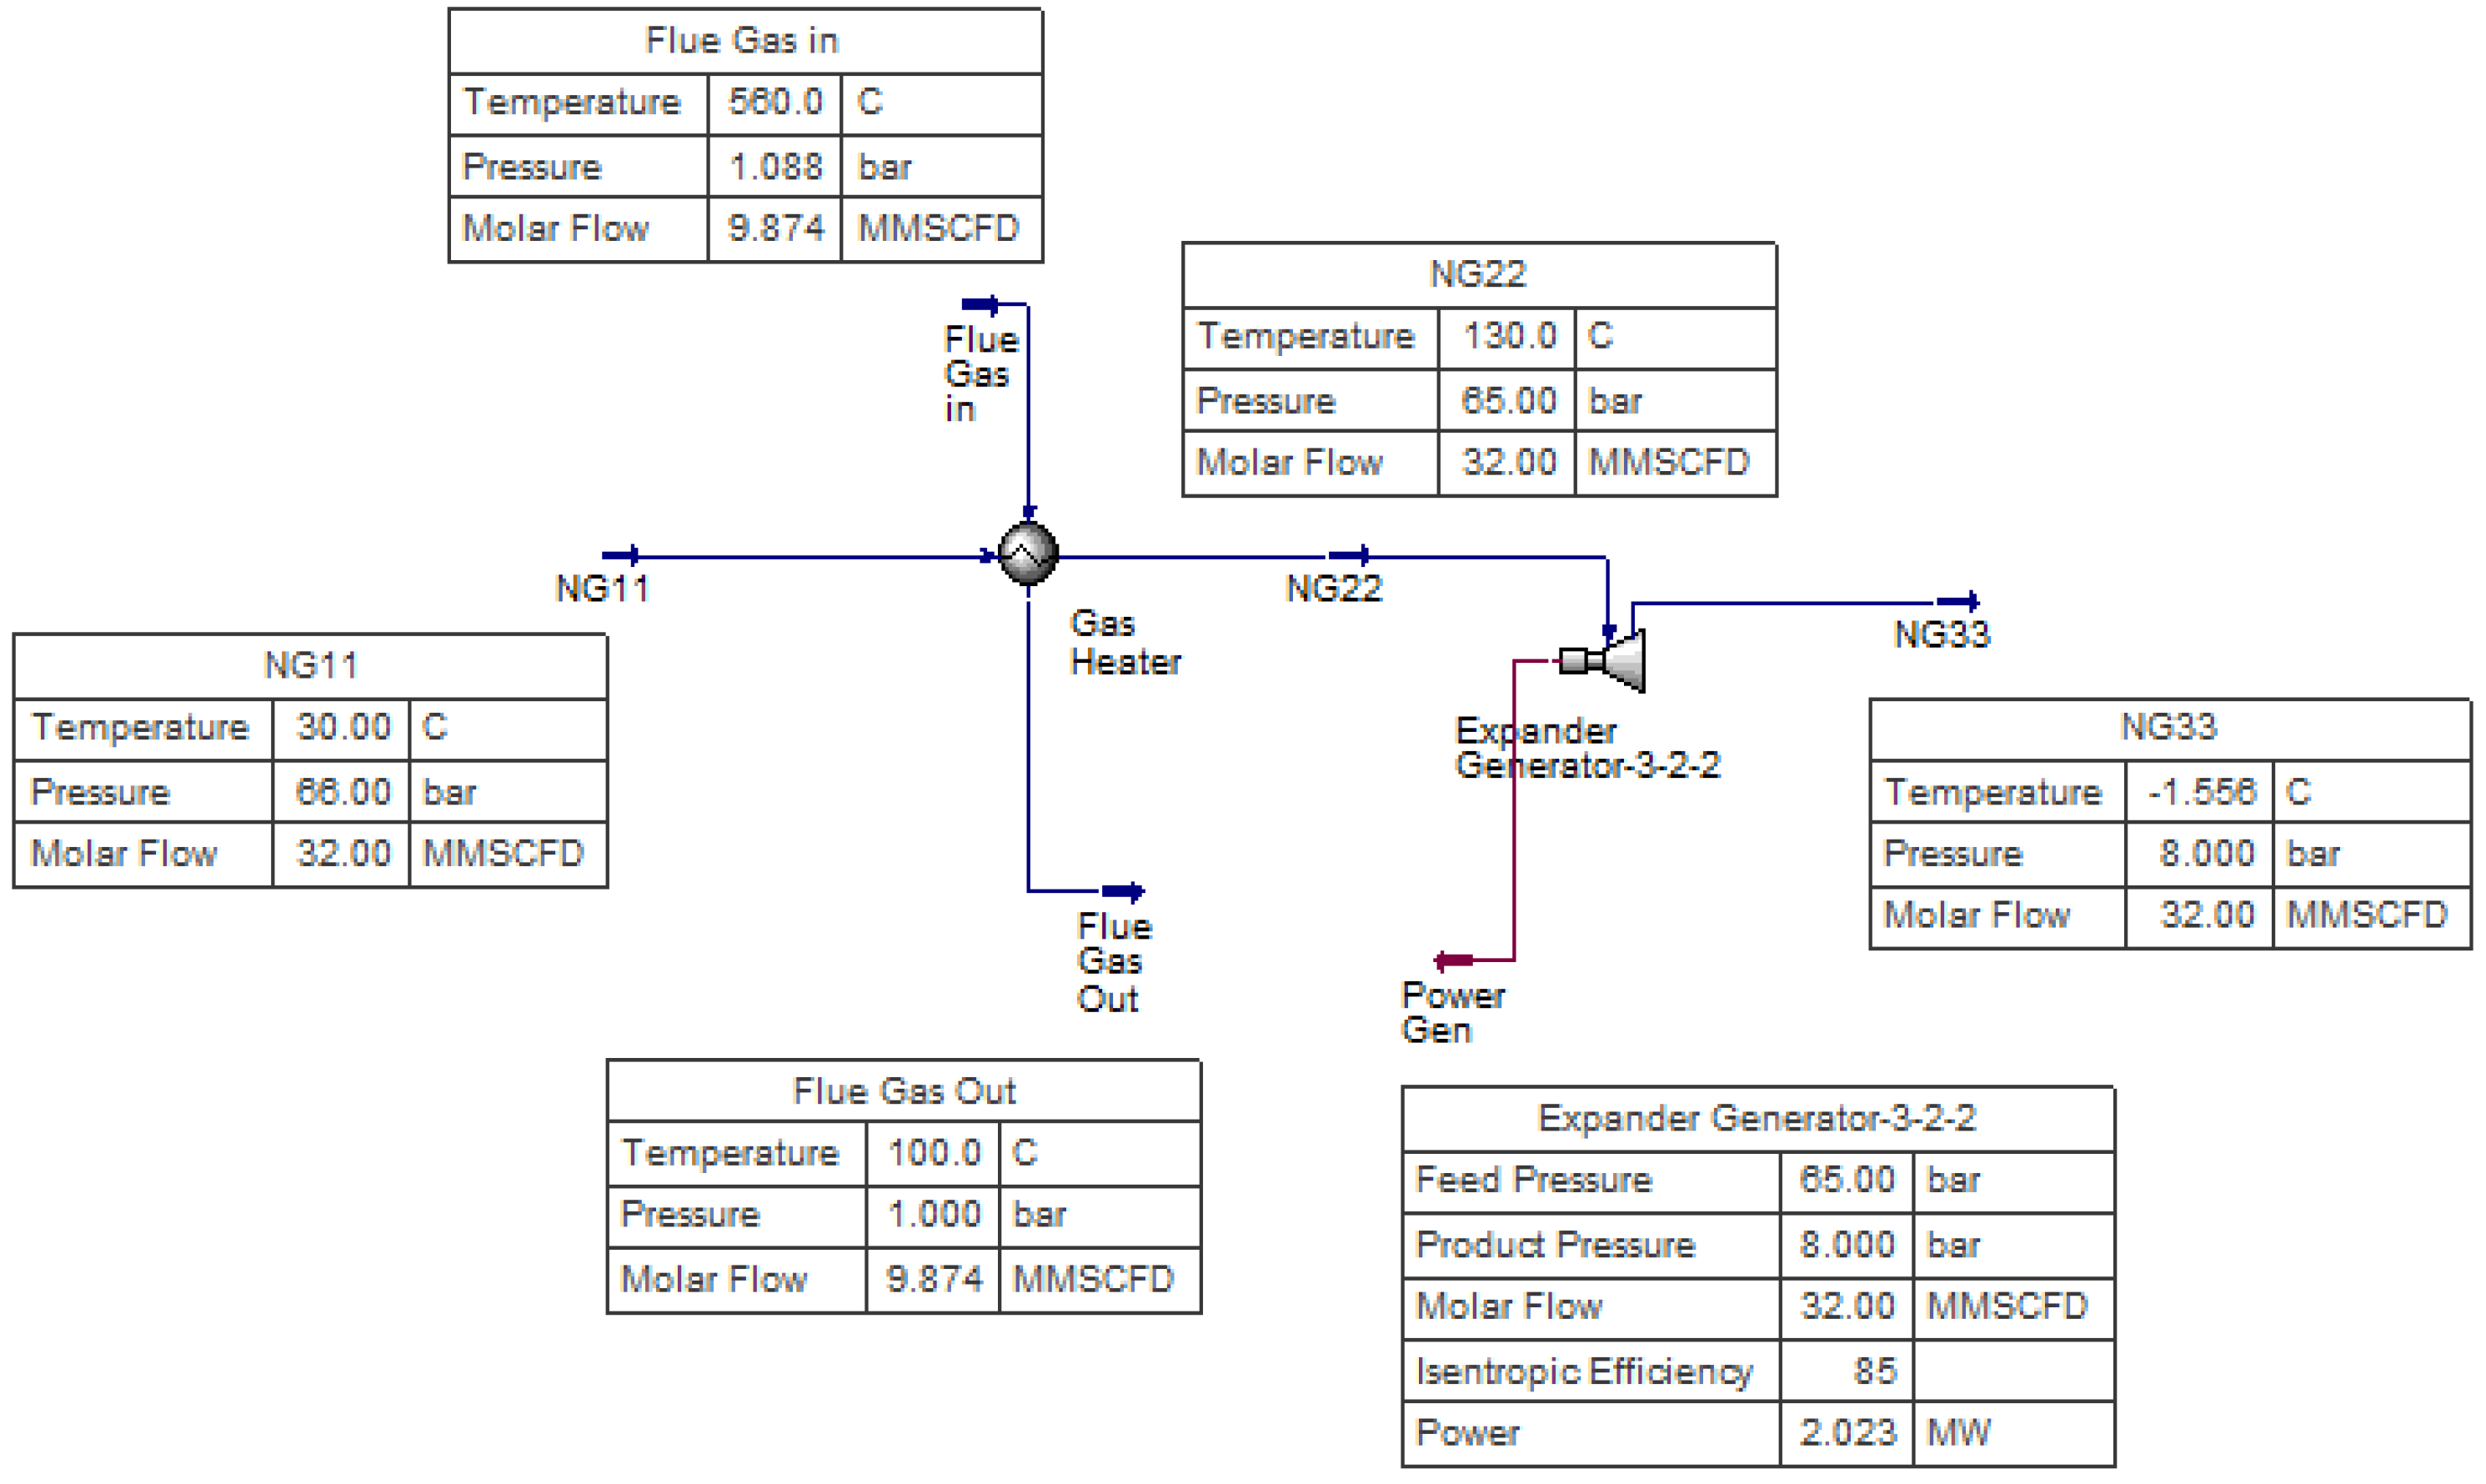
As for the second scenario, an expander generator system is used in the natural gas feed’s inlet for the New Al-Alamein thermal power plant. The benefit of this system is to utilize gas turbine’s exhaust gas to avoid hydrate formation occurrence at the expander generator’s natural gas outlet feed. This will be achieved by taking a feed from the on-service gas turbine’s exhaust gas and passing it onto a heat exchanger with the reducing station’s inlet natural gas feed.
As with the new SIEMENS power plant station in the administrative capital [
17], the New Al-Alamein combined cycle station (CCS) will be assumed to have 8 SGT-800 50 MW version whereas each two gas turbines are linked to one steam turbine combined cycle to produce the required total output of 480 MW for the CCS. Therefore, the expected exhaust gas exit temperature from the gas turbine is 560 °C, whereas each gas turbine has an exhaust gas mass flow rate of 124.7 kg/s. This makes the mass flow rate of the exhaust gas from the eight gas turbines reach a sum of 997.6 kg/s [
18].
The heat exchanger temperatures in the simulation software are as follows, exhaust gas feed temperature inlet is 560 °C. Exhaust gas feed temperature exit is 100 °C. The natural gas feed temperature inlet is 30 °C while natural gas feed outlet temperature is 130 °C. Additional input parameters are added to the simulation software as follows:
The natural gas input feed stream is 1.03 MMSCMD
The expander generator inlet pressure range is set to 65 bar maximum and 46 bar minimum.
The output pressure of the expander generator is set to eight bar.
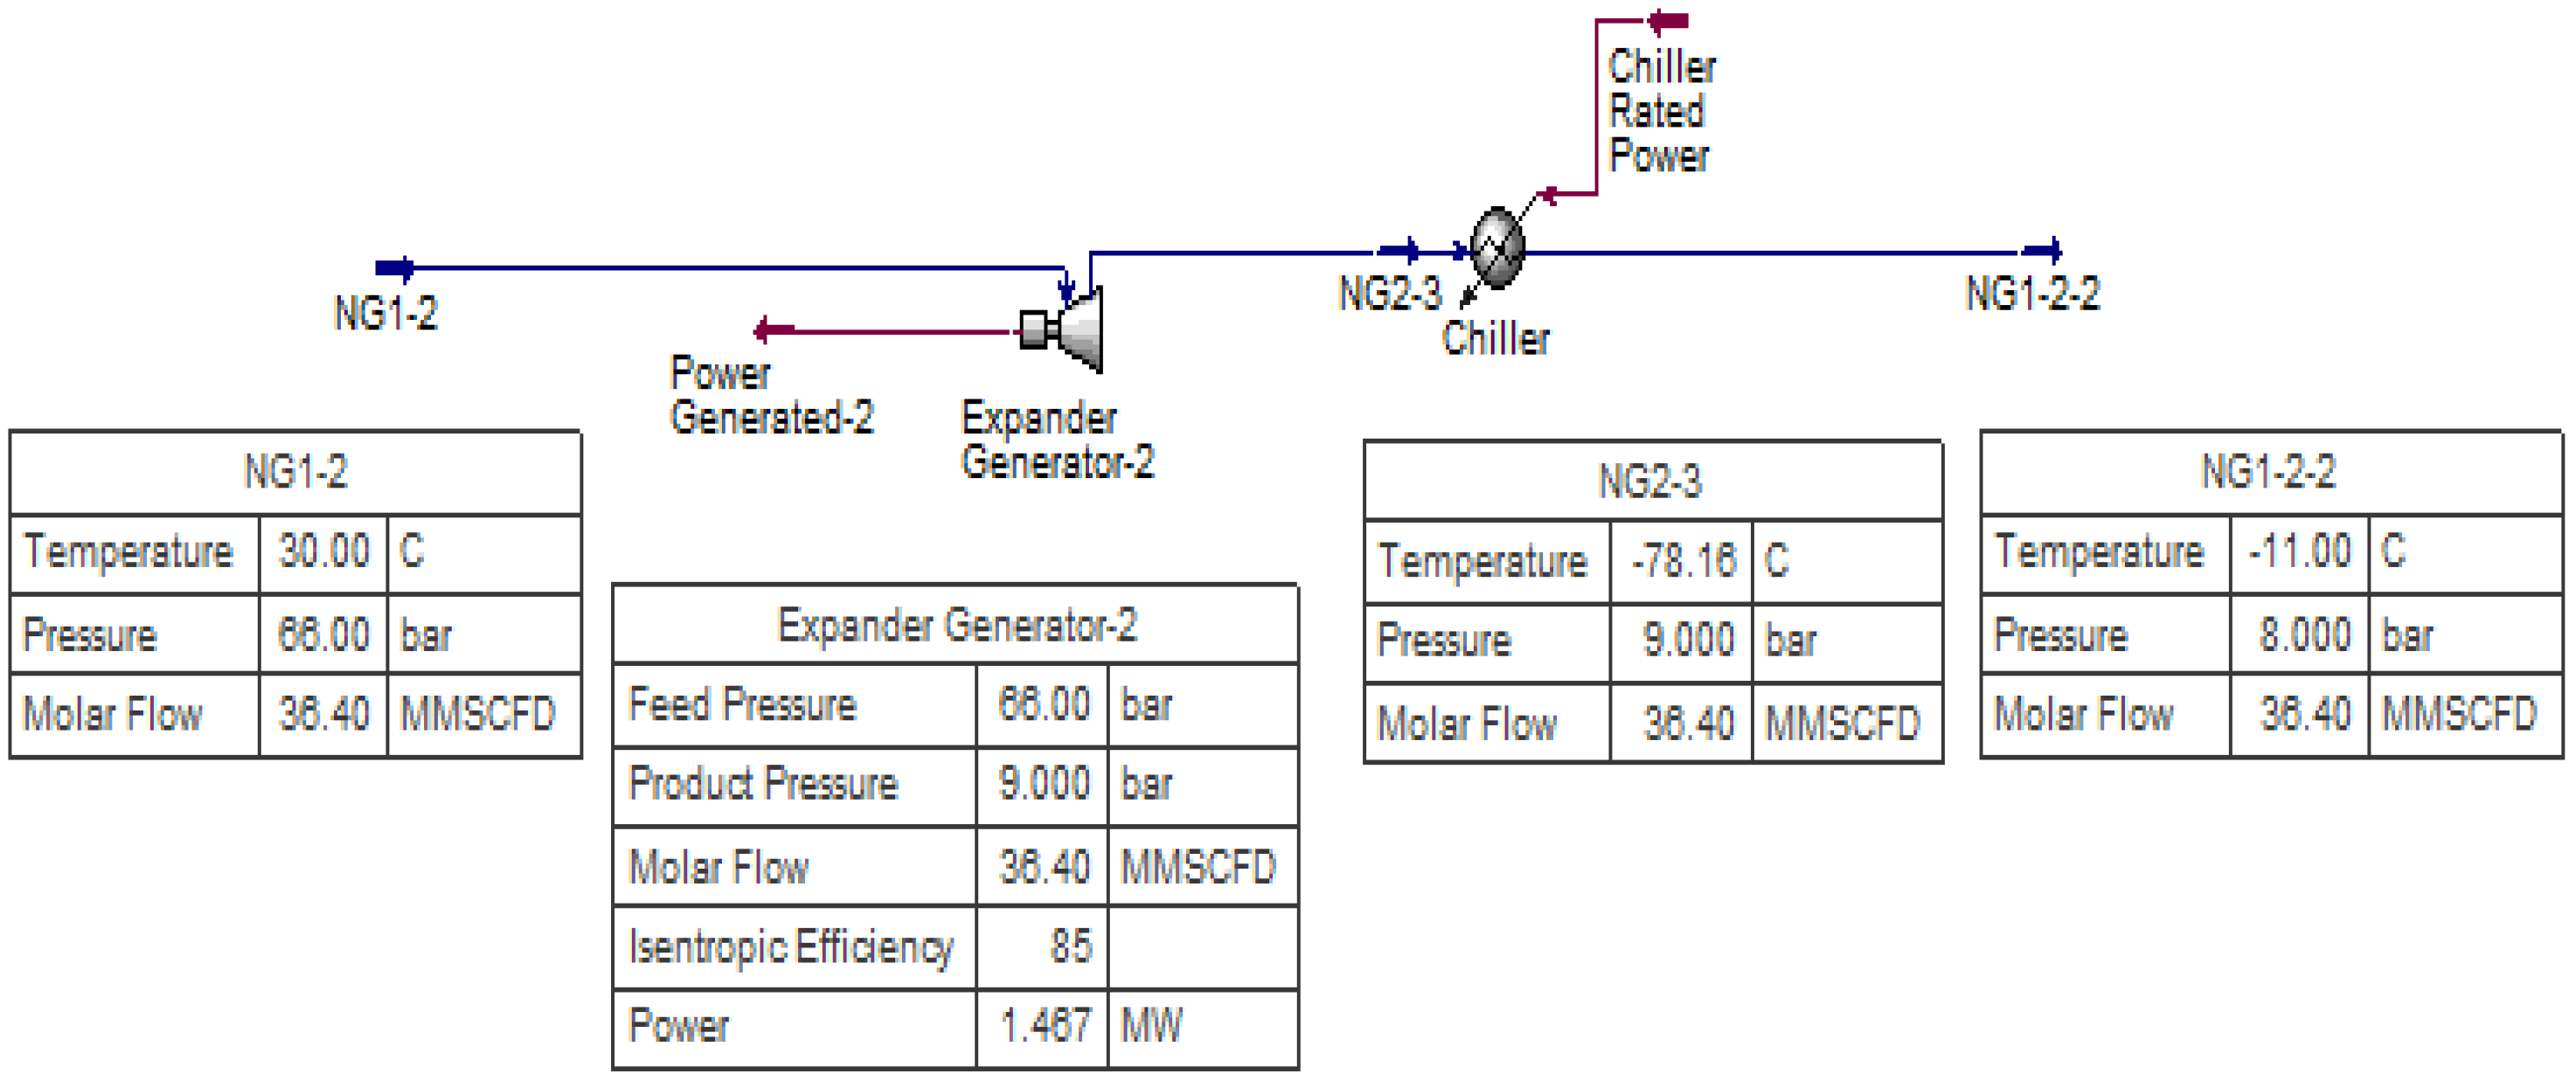
The third scenario is to apply an expander generator system onto the inlet of the natural gas feed and utilize the temperature drop at the expander generator outlet onto a chiller heat exchanger. This scenario can be proven very useful in utilizing the pressure wasted energy to its full, producing both electrical power and cooling capacity that can be used by the CCS. The presumed parameters for this scenario must be:
No water particulates are present in the natural gas feed stream.
The volume flowrate 1.03 MMSCMD.
Natural gas inlet feed temperature is 30 °C.
The expander generator inlet gas pressure range is set to 66 bar maximum and 47 bar minimum.
The output pressure of the expander generator is set to nine bar.
The presumed outputs for both models 2 and 3 are the expander power variation to the pressure inlet, the expander generator exit temperature, and the thermal fluid suitable to withstand the application’s low temperature.
4. Discussion and Results
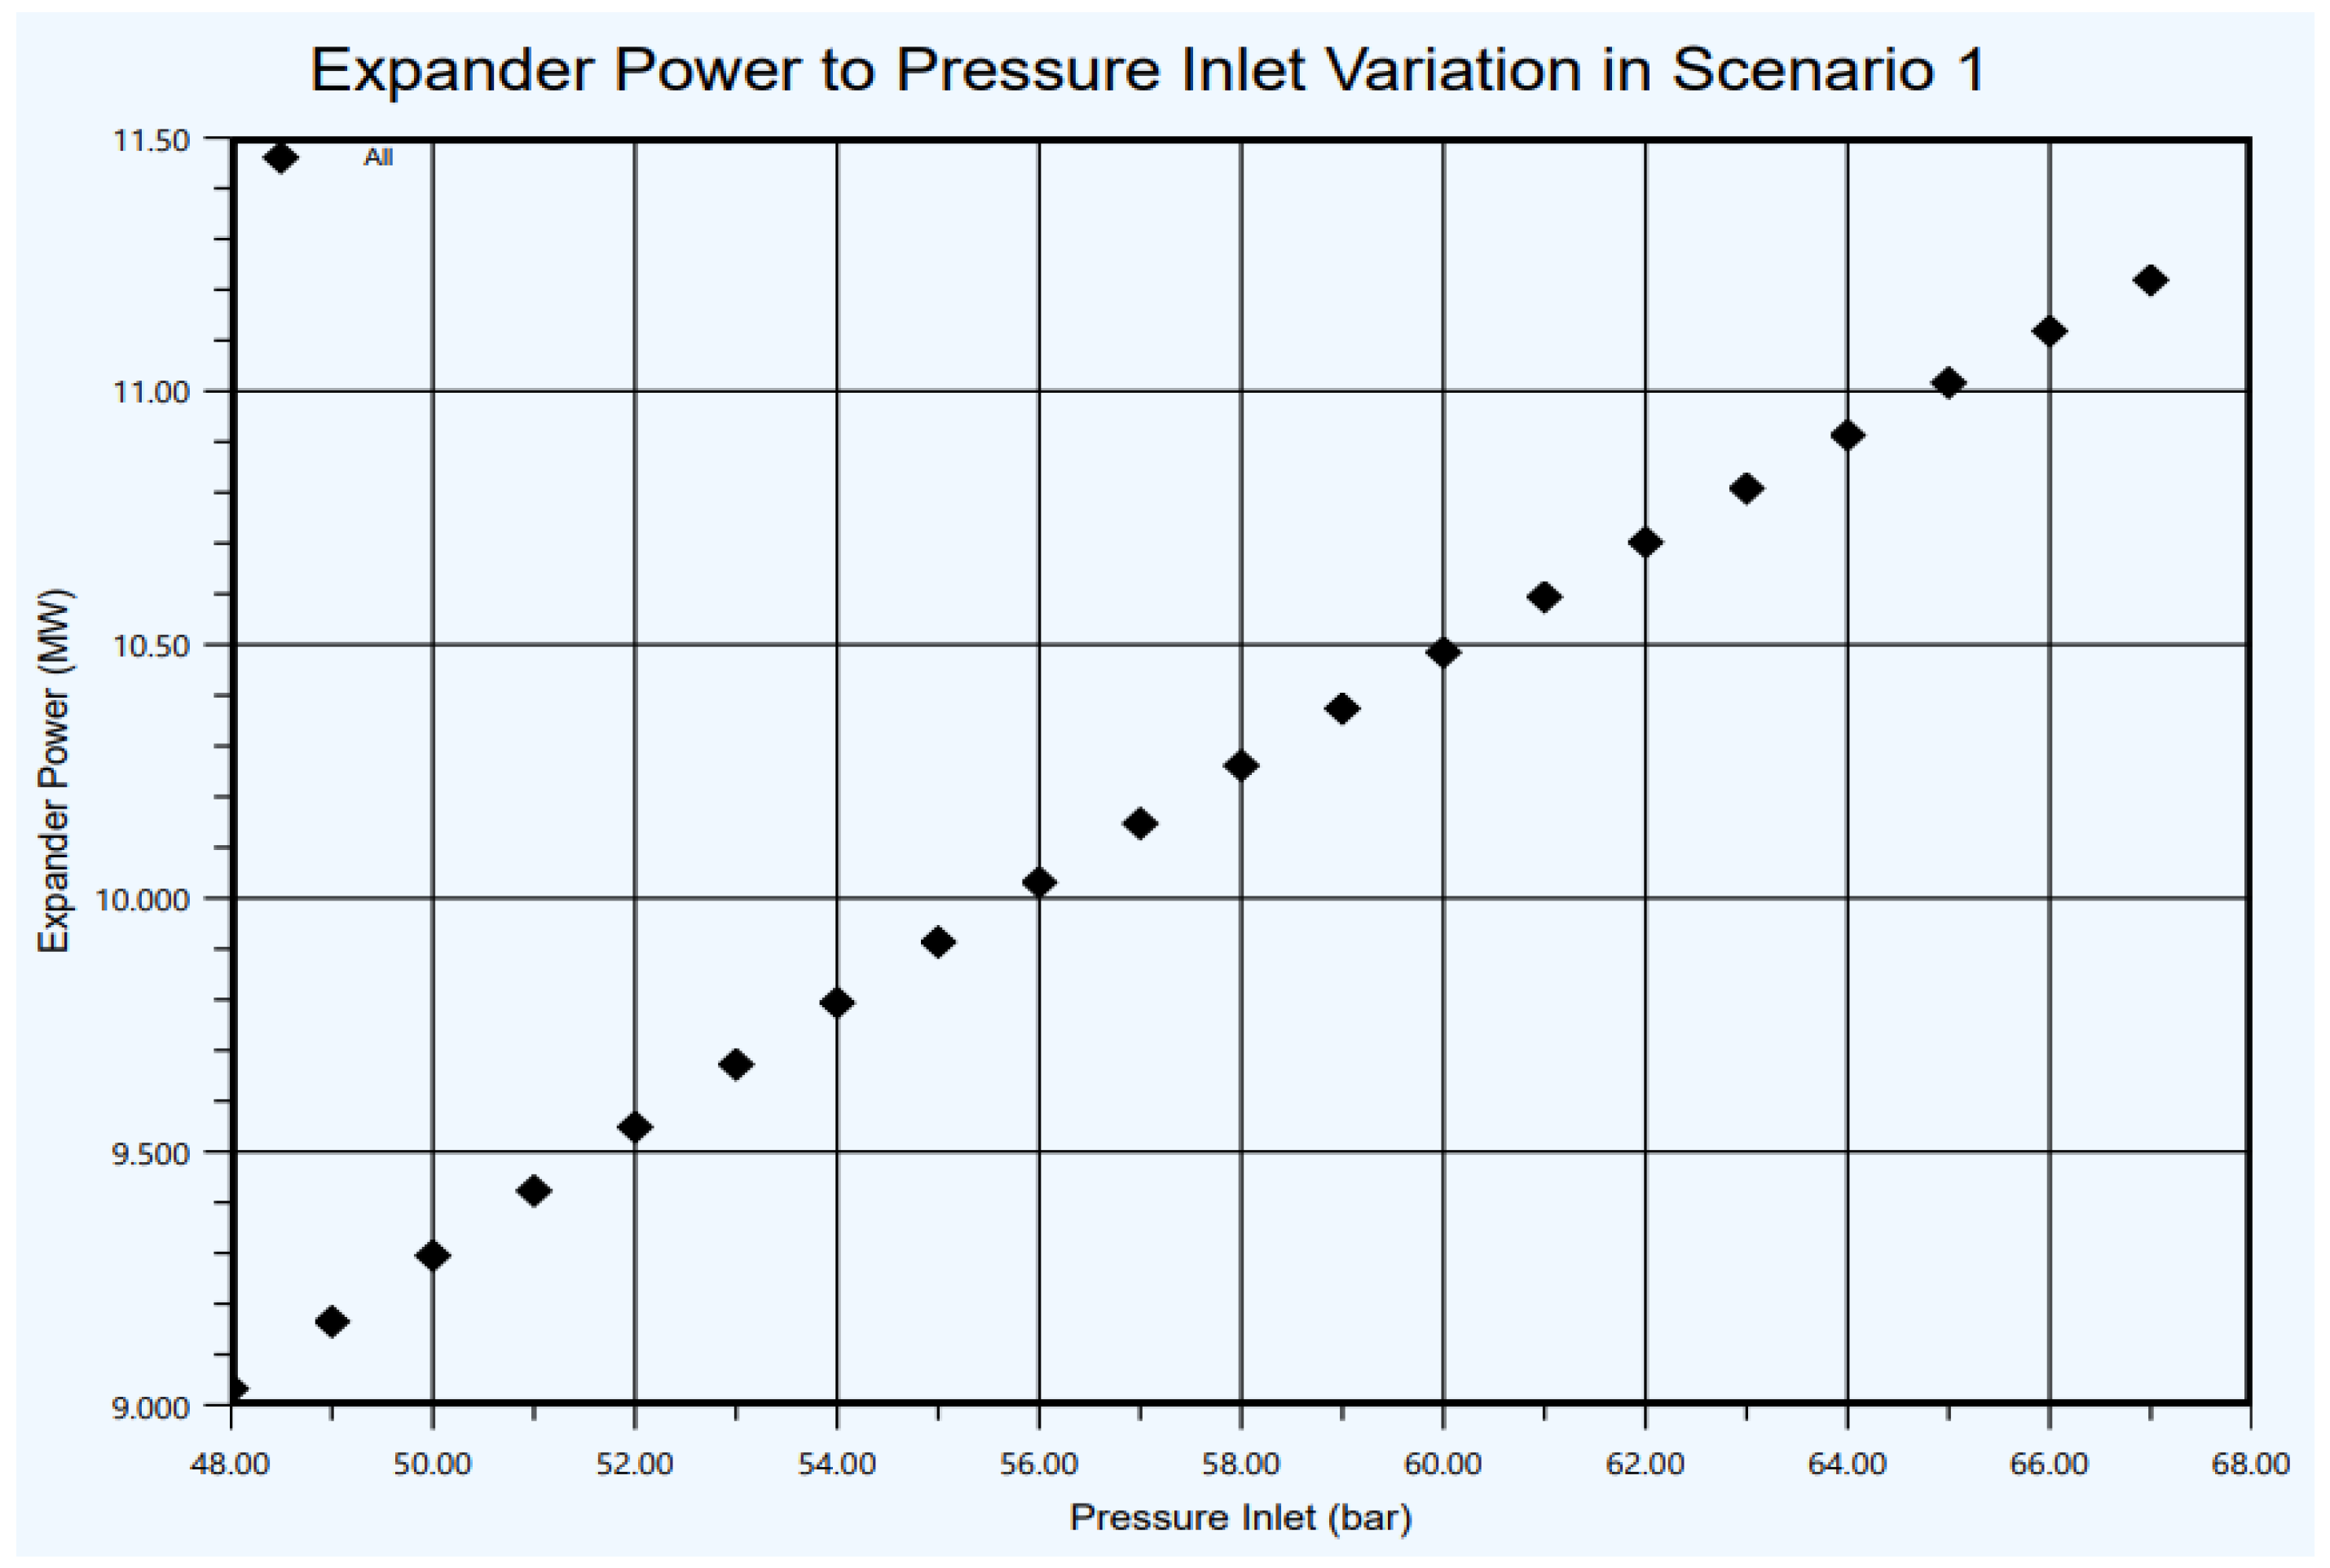
The generated power from the first scenario model is calculated where the full natural gas stream to old and New Al-Alamein city is passed through an expander generator, the power generated is as shown in
Figure 8.
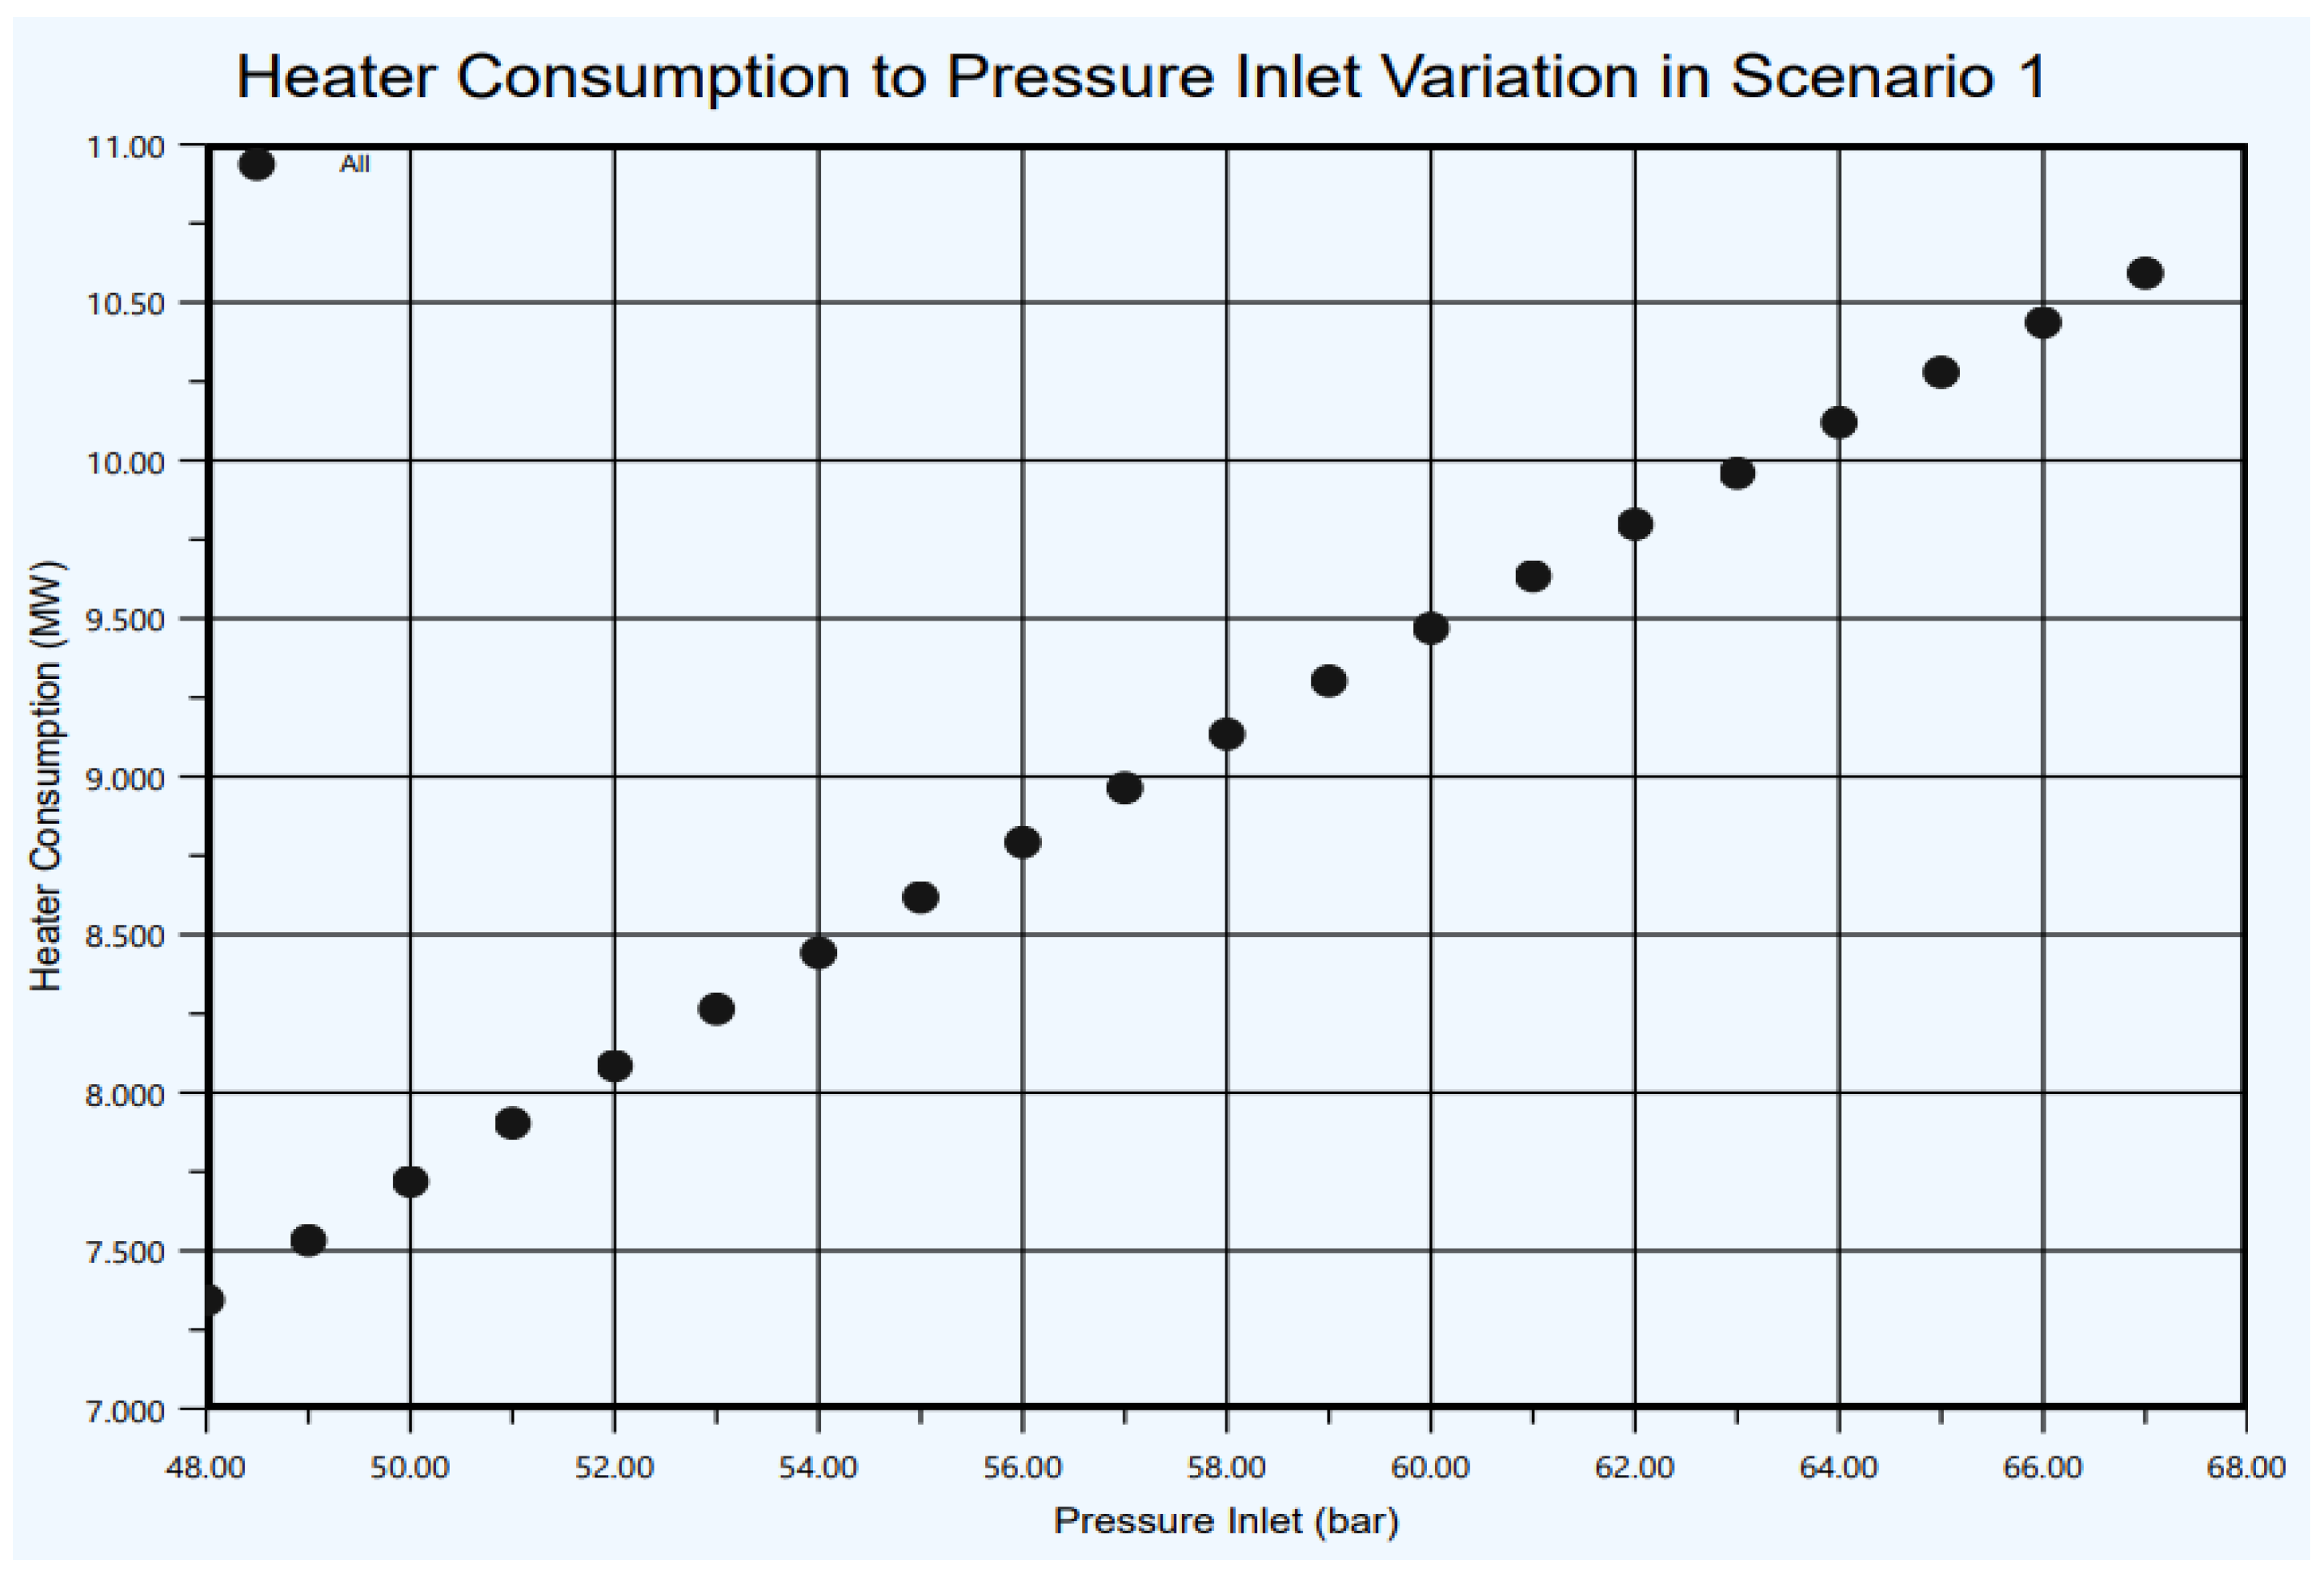
The maximum electrical power recovered from the expander generator system at 67 bar gas pressure inlet is 11.22 MW. The required natural gas preheater thermal energy is shown for that scenario in
Figure 9.
The design thermal load for this preheater at the highest gas pressure inlet (67 bar) is 10.59 MW. This would result in an expander generator inlet feed temperature of 113.3 °C and an expander outlet temperature of −6 °C. For this scenario, the amount of energy recovered is vast given the high amount of gas volume flowrate allocated to both old and new Al-Alamein. However, the practicality of this scenario is in question due to the following points:
Despite the high-power output of this scenario, input energy requirement represents 94% of the total electricity generated. This is due to the high thermal consumption needed for the heater to avoid hydrate formation. In addition, the utilized gas heater will consume an external fuel source that would contribute to carbon emissions. Thus, efficient power generation is not achieved.
The electricity grid connection will not be close to the pressure reducing station because of its presence in the outskirts of the city. Thereby, the added cost of electrical transmission lines will affect the total cost.
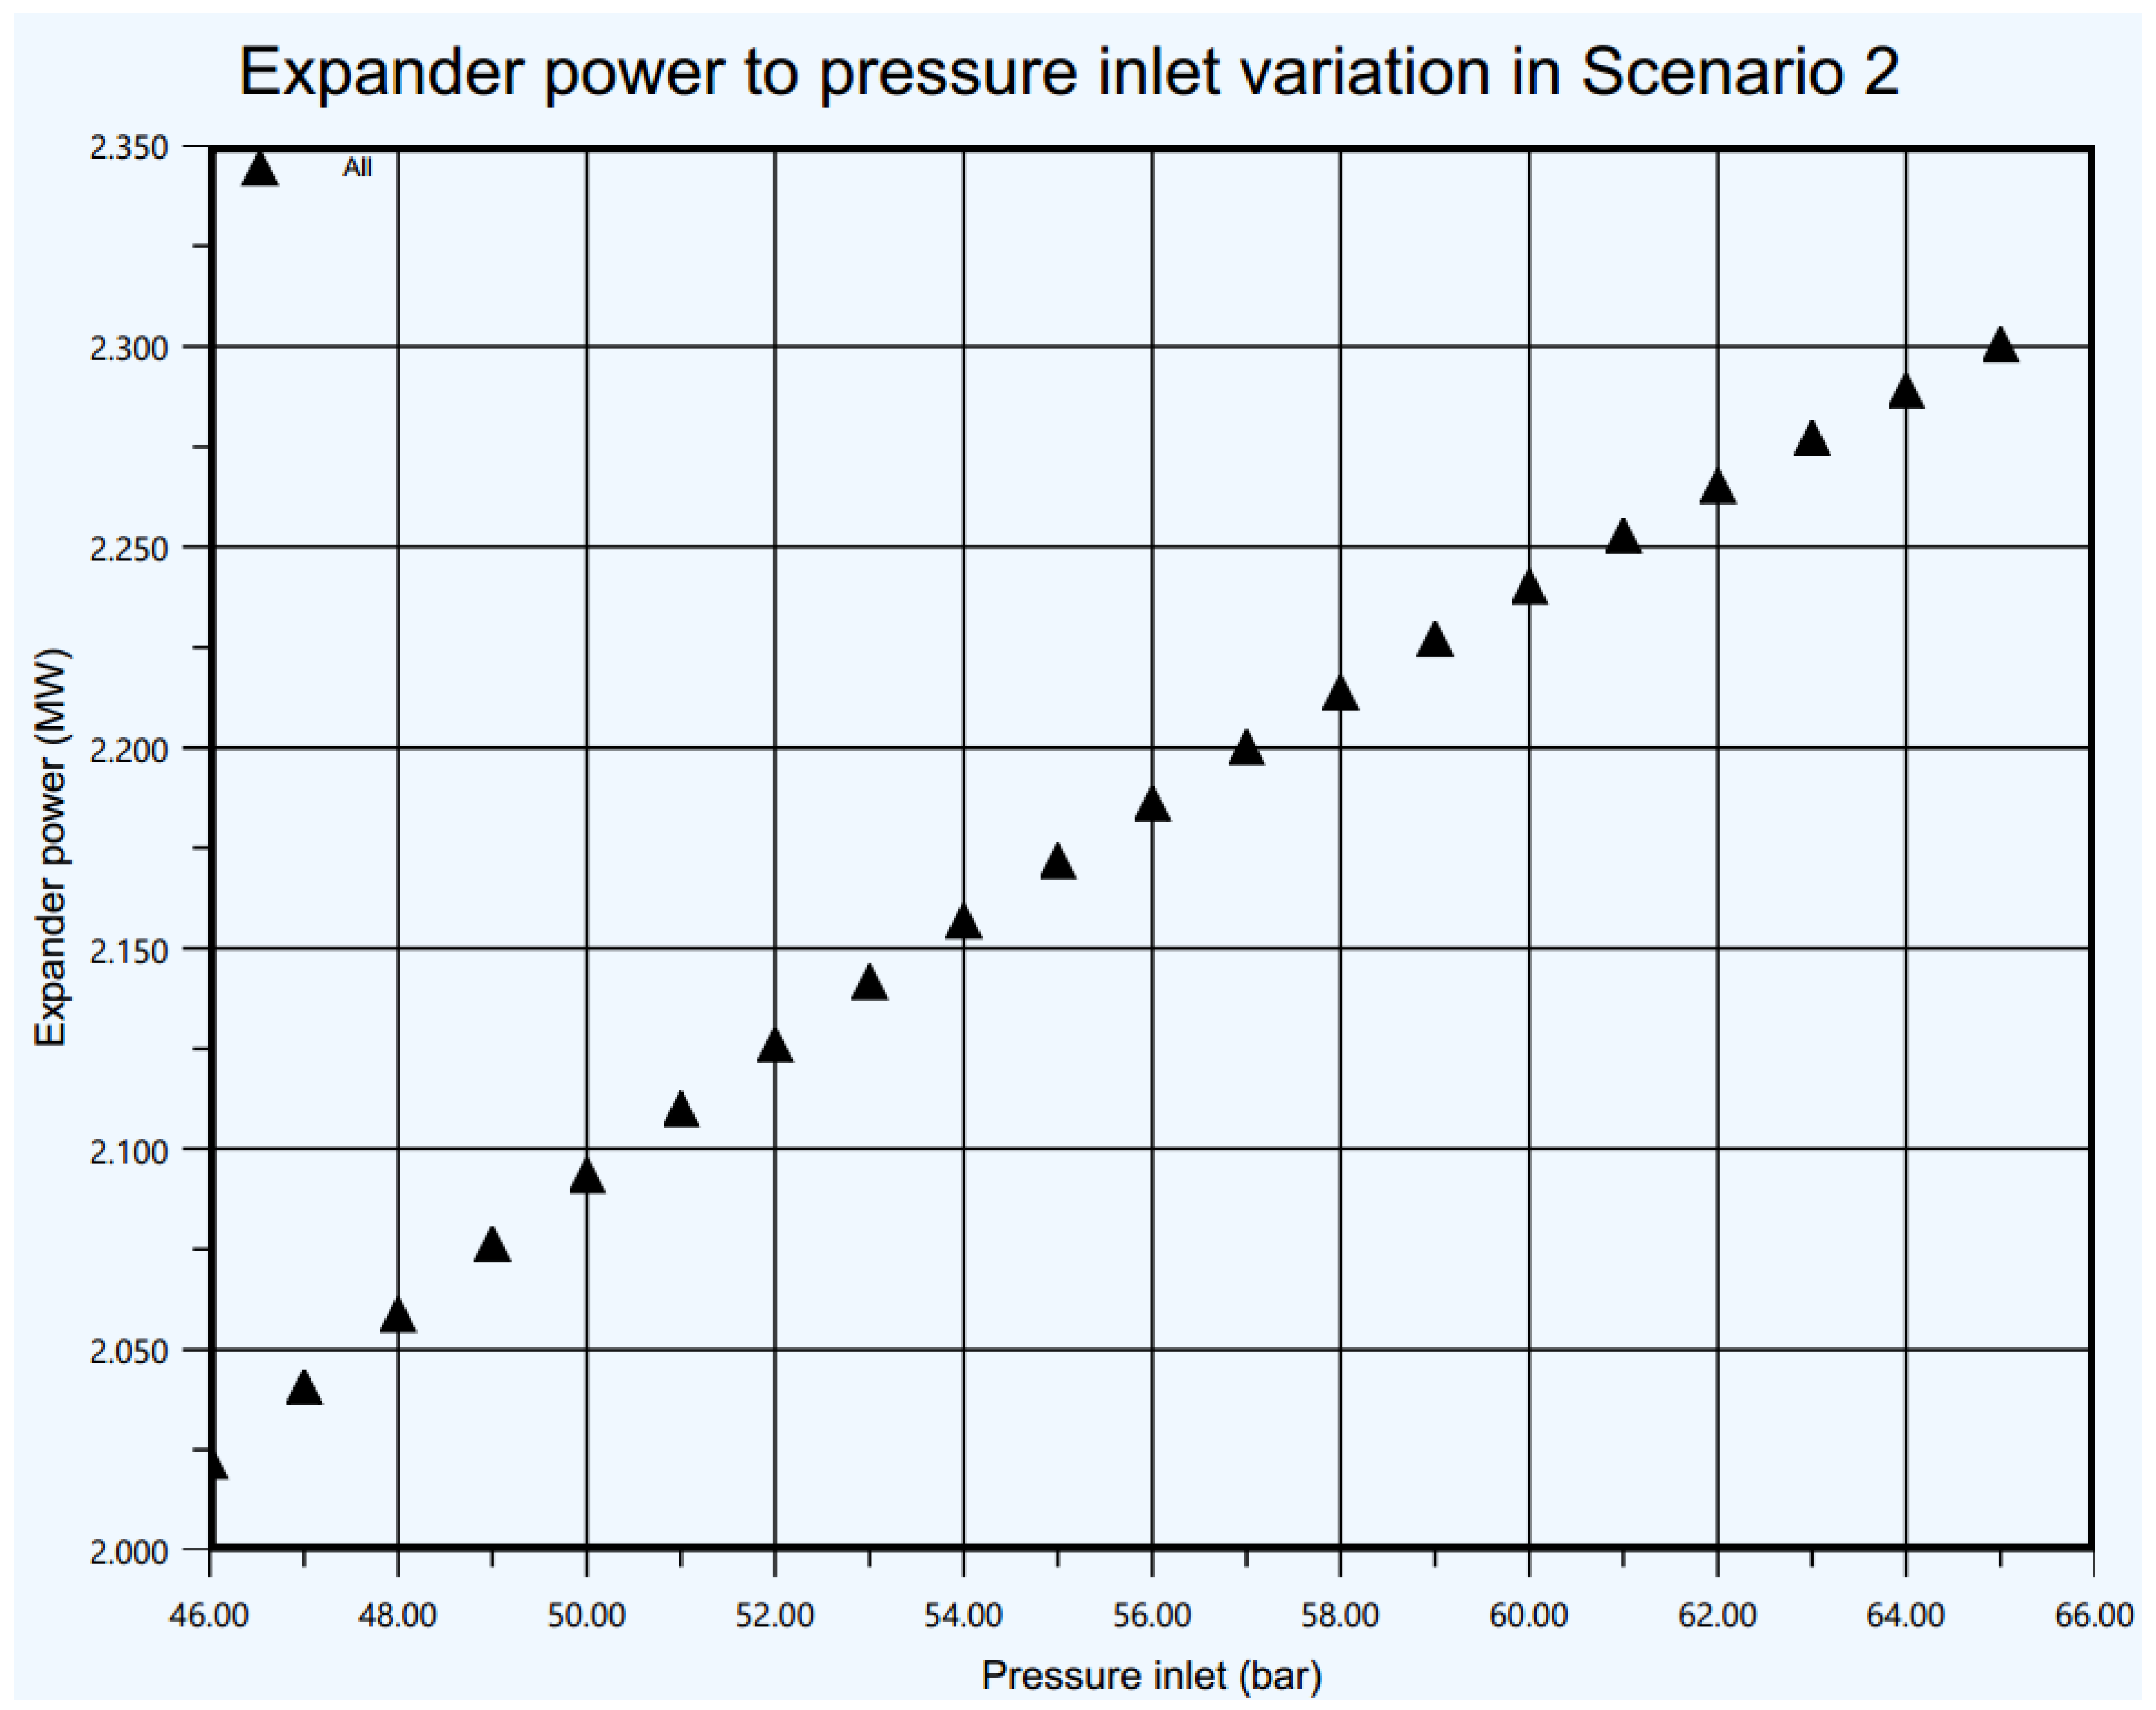
For scenario 2, the expander generator is utilized to provide the pressure reducing station of the New Al-Alamein SIEMENS thermal power station, the power generated is as shown in
Figure 10.
The maximum electrical power recovered from the expander generator system at 65 bar is 2.3 MW. The volume flow rate of the gas turbine exhaust necessary to avoid hydrate formation is shown in
Table 6. It is equal to
m
3/h.
These simulation results are compared by theoretical calculations to check the applicability of such exchanger through size and type. First, to identify the exchanger type, the log mean temperature difference will be calculated using the following equation.
By recalling the following temperatures,
K
For exhaust gas inlet feed flow rate calculation, the specific properties of exhaust gases at inlet temperature are acquired from flue gas properties tables as follows:
Whereas the natural gas properties with respect to its chemical composition is:
Average Cp = 2490 J/kg
= 0.763 kg/
= 9.1026 kg/s
By using thermodynamics heat balance equation.
Therefore, the actual volume flow rate of the exhaust gas at the exchanger inlet is . Hereby, when comparing theoretical and simulation results, the percentage of error is as minimal as 1.9%. The practicality of such a scenario is observable because there is no added cost of thermal energy through an external fuel source. Instead, thermal energy addition is acquired from exhaust gas utilization. Thus, wasted energy is efficiently utilized with the least input requirements.
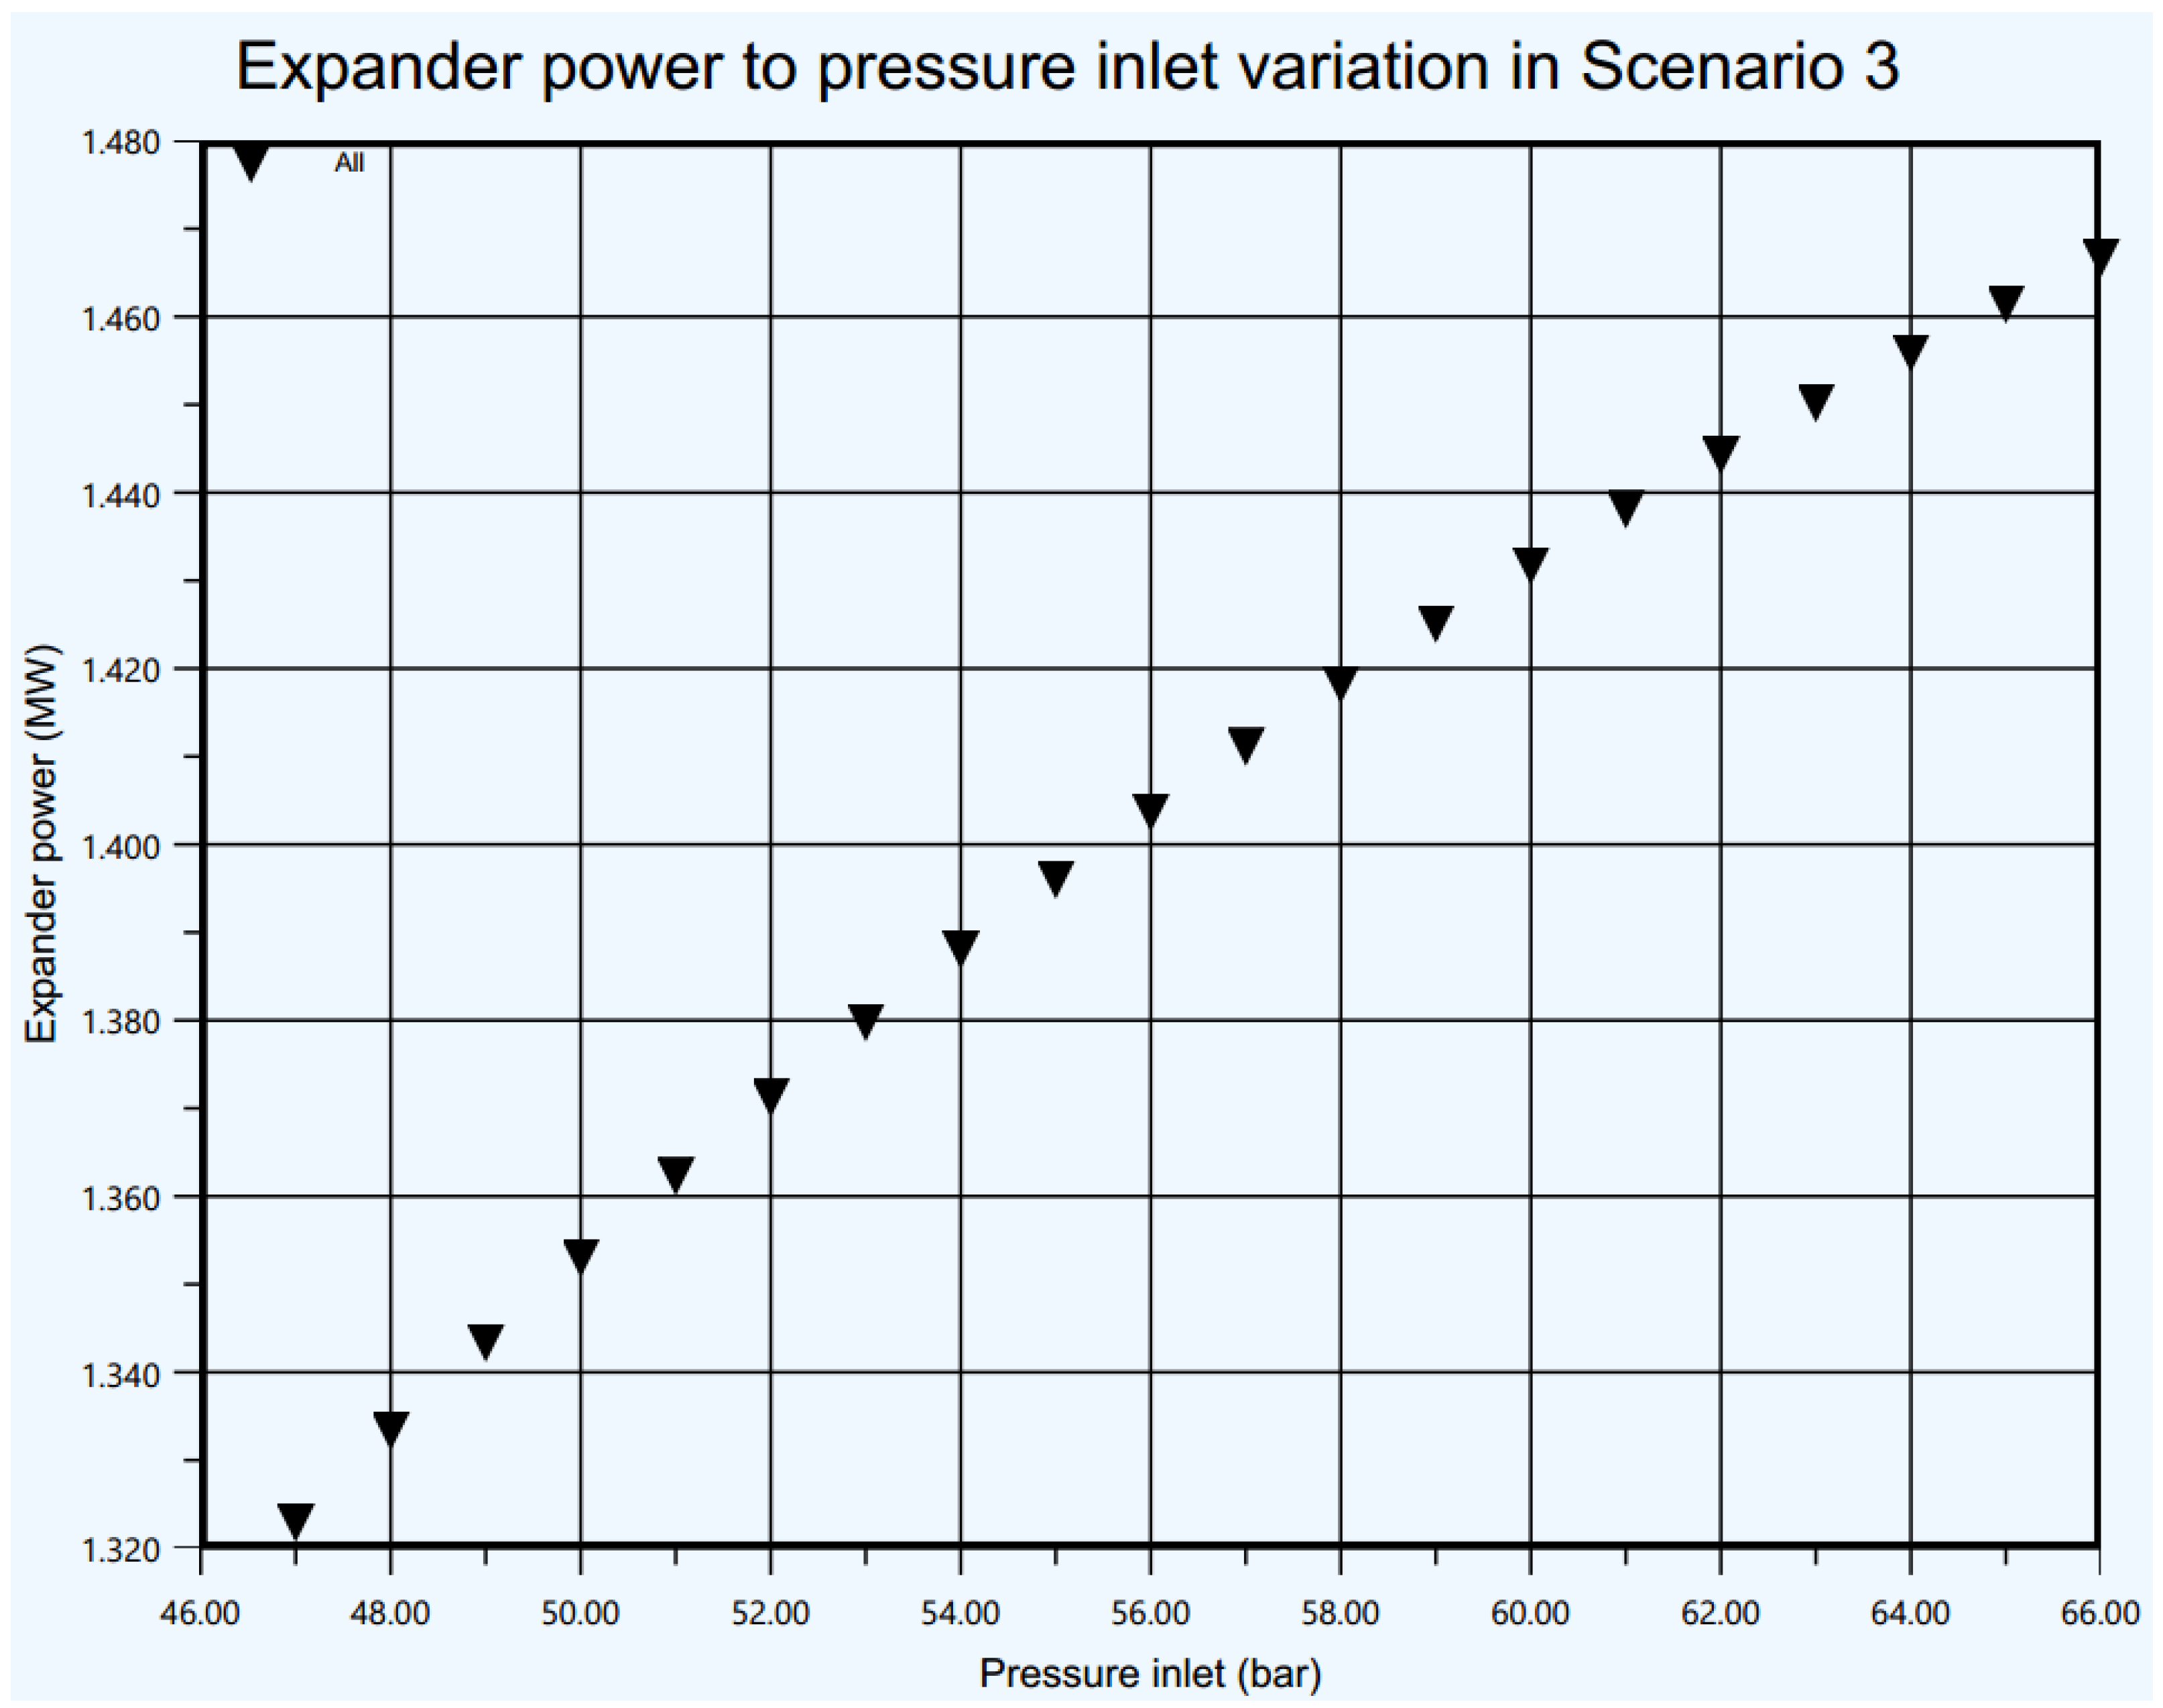
On the other hand, the flowrate of the exhaust gas feed required is minimal when compared to the resultant full exhaust gas from the full thermal combined cycle plant (4.176 kg/s to 997.6 kg/s). In this way, the heat steam recovery generator (HSRG) performance is not affected. Additionally, the electricity grid will be at the vicinity of the thermal power plant. Thus, power transmission lines will not travel for long distances. Finally, in scenario 3, the natural gas outlet from expander generator is passed to a chiller heat exchanger. The expander power generated per pressure input is shown in
Figure 11.
The maximum electrical power generated from the expander generator system at 66 bar gas pressure inlet is 1.467 MW. Whereas the temperature of the natural gas outlet from the expander is found to be −78.16 °C.
Given such a low temperature, the refrigerant on the shell side of the chiller must be carefully selected to avoid freezing through such cold temperatures and during shutdowns of such a system. In this case, glycolated water is incompatible due to such a low temperature of natural gas outlet from expander. Hereby, it is found that a synthetic hydrocarbon blend fluid can be used instead. Consequently, Paratherm CR is suggested for this application, as it can withstand temperatures as low as −88 °C without risk of freezing [
19].
The thermophysical properties of this fluid is then obtained through the official manufacturer website. The density of such a fluid is found to be 833 kg/ and the specific heat capacity is .
By considering the following temperatures for the Tubular Exchangers Manufacturers Association (TEMA), the chiller heat exchanger’s size is based on the following assumptions.
Overall heat transfer coefficient for gas at high pressure inside and liquid outside the tube is .
The log mean temperature difference is calculated as previously discussed and it is found to be , the tube side is then chosen to be the natural gas side while the shell side is to be the Paratherm CR fluid.
Next, by applying heat balance equation;
The acquired cooling load is and the mass flowrate of the synthetic hydrocarbon blend is Hereby, the Paratherm CR volume flowrate required for this system is 472.25 .
From the above equations, the number of tubes required for the natural gas tube side
can be calculated. The length of pipe (
is assumed as 3 m and the flow diameter D is assumed as 0.1905 mm. The following equation is then used,
where
is the area is the total surface area of the tube bundle and is calculated as;
By solving Equations (10) and (11), the number of tubes is .
The actual velocity of natural gas is then inspected at the exit side of the tube side since the volume flowrate increases prior heating. Using Equations (4) and (5), the compressibility factor is calculated through a pseudo chart and is found to be = 0.97. Whereas the density of natural gas at tube exit ( is 6.814 kg/ as calculated from the simulation software. The actual flow velocity is acquired and is found to be 6.315 m/s.
According to the American Petroleum Institute’s (API) RP 14E standard for erosional velocity limits, the maximum allowable gas velocity limit suggested by the API is calculated using the following equation [
20],
When the erosional velocity factor is taken as 100 for maximum safety and density of natural gas at tube exit is applied, erosion velocity is 38.3 m/s. This value is halved as a safety margin, the erosional velocity will be which is typically within range of the commonly advised velocities for natural gas pipeline transportation commodities. Hence, is suitable and safe regarding that the maximum allowable gas velocity limit suggested by API.
All the previous three scenarios are analyzed and their results are compared based on the proposed optimization criterion mentioned in
Section 1.3. It is found that, despite scenario 1 producing high electricity generation, the input requirement is also considerable. Thus, it cannot be considered an optimized solution.
As for scenario 2, the system input requirements are eliminated through utilization of gas turbine exhaust that results in green energy recovery in the form of generated electricity, amounting to 2.3 MW.
In scenario 3, green energy is obtained without any power input requirements or fuel consumption from the system. Furthermore, this scenario generates electricity (1.467 MW) as well as high cooling capacity of 1.249 MW (355 TR). Such cooling capacity saves energy requirements for conventional vapor compression cooling cycles if used in district cooling or in satisfying thermal power plant cooling loads. Additionally, cooling capacity generated from energy recovery can also be utilized to enhance the efficiency of the combined power cycle of Al-Alamein power plant by increasing volumetric efficiency of the gas turbine cycle through intercooler technologies. These advantages are not present in the other energy recovery scenarios (scenario 1 and scenario 2).
5. Conclusions and Future Work
This paper presents a comprehensive analytical study on the provision of suggestions and solutions for harnessing energy through conventional natural gas transmission systems. The linkage of New Al-Alamein city to Egypt’s natural gas grid is studied with its flow conditions and designated routing paths. Three scenarios with three variants of equipment layouts for expander generators are suggested and studied for the utilization of gas grid pressure loss and its potential in green energy recovery.
The first scenario showed a maximum electricity generation of 11.22 MW with constraints of a maximum power input requirement of 10.59 MW thermal power addition through an external fuel source. In comparison, the second scenario produced electricity generation of 2.3 MW with no system energy input constraints nor thermal addition cost through an external fuel source. The third scenario produced a total power of 2.716 MW in the form of two energy sources (1.467 MW electricity and 1.249 MW cooling capacity).
Scenarios 2 and 3, present in the new SIEMENS combined power plant in New Al-Alamein city, are recommended over the first scenario based on their minimal input requirements and optimization criterion compliance in terms of the recovery of green energy. Furthermore, both scenarios easily link the expander generator power generated and the thermal power plant electricity grid.
Finally, given the nature of power plants, stable diversity factor and consumption of natural gas, both scenarios are subjected to stable operating flow and conditions. Thus, power is produced continuously and close to their calculated peak power.
This paper recommends scenario 3 in terms of the results demonstrated. However, the practical implementation choice between scenarios 2 and 3 will depend on the following:
The ability to satisfy the desired flue gas feed from the HSRG and gas turbine manufacturer in the proposed layout for scenario 2.
The utilization and the possibility of benefiting from the cooling load of scenario 3 by the combined thermal power plant.
A detailed cost analysis for the recommended scenario will be considered for future work. Key economic aspects will be addressed, such as installation, maintenance and operation costs.


