1. Introduction
The negative impacts of carbon-emitting energy sources have hastened the need to develop alternative forms of energy production. The Office of Energy Efficiency & Renewable Energy reports that renewable energy accounted for approximately 20% of all U.S. electricity in 2021, and that percentage is expected to grow [
1]. The International Energy Agency (IEA) is expecting the renewable capacity to increase over 8% in 2022 [
2]. Popular forms of eco-friendly renewable energy include land- and sea-based solar and wind applications. Novel devices that utilize marine energy offer the possibility of harnessing the kinetic energy of ocean waves. One such design uses the oscillating water column principle and has received renewed attention. The Oscillating Water Column (OWC) is a well-studied marine renewable energy harvesting technique that has successfully produced electricity. A significant component of the conventional OWC is the Wells turbine. However, an OWC equipped with a Wells turbine has a limited operating range, low aerodynamic efficiency, high noise levels, and poor starting characteristics. Among the wide range of renewable energy sources, wave energy could become economically viable in the near future. The conversion of wave energy is an attractive proposition for countries surrounded by the sea, such as the British Isles, Japan, India, and others. Globally, ocean waves offer huge potential for harnessing energy. Locally, in the U.S., more than 50% of the population lives within 50 miles of the coast, making wave energy a logical and ideal form of power generation [
3].
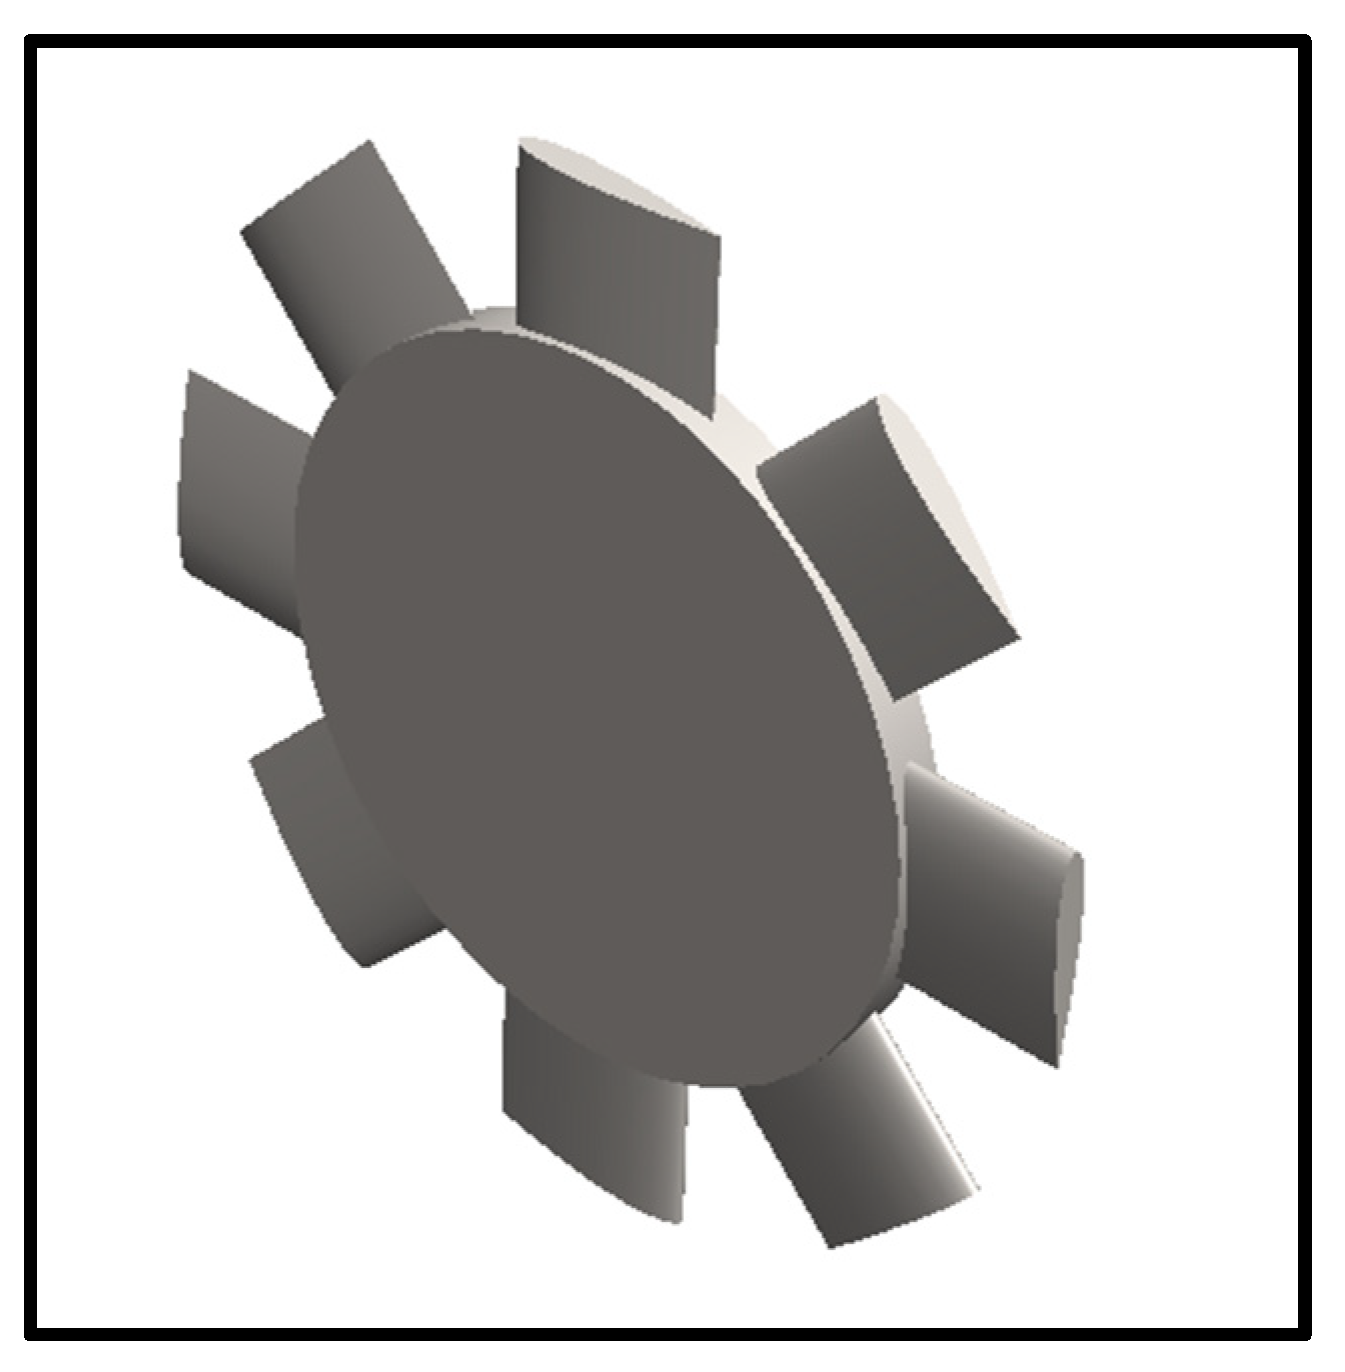
In the late 1970s, Prof. Alan Arthur Wells of Queen’s University Belfast developed the Wells turbine, an effective air turbine used for bi-directional air flow. The Wells turbine rotor is illustrated in
Figure 1. It consists of several symmetrical airfoil blades arranged around a central hub with their chord lines normal to the rotation axis. This turbine is more efficient than other turbines because it doesn’t require rectifying air valves and can extract power at low mass flow rates. An axial flow air turbine such as the Wells is considered one of the simplest and most economical ways to harness wave energy
It is proven that the Wells turbine is an adequate wave energy converter, even with its well-known aerodynamic performance limitations [
4]. This research will investigate the aerodynamic effect of adding trailing edge serrations to Wells turbine blades.
Ocean waves create a reciprocating airflow that transfers energy to the turbine blades through the OWC. Air, which is the circulating fluid, reverses its direction with the oscillating wave (i.e., inhalation and exhalation), but the Wells turbine rotation direction remains the same. Researchers have investigated the effect of varying Wells turbine design parameters through experimental and numerical analyses. In the following section, we briefly discuss prior studies whose aim was to assess and improve its design for performance.
Using NACA0015 profiles, Ghisu et al. [
5] compared experimental and numerical performance characteristics of a high-solidity Wells turbine at different non-dimensional piston frequencies. The unsteady numerical simulations were carried out using ANSYS™ Fluent, a commercial computational fluid dynamics (CFD) flow solver. The computations focused on the flow upstream and downstream of the rotor and investigated hysteresis during piston acceleration and deceleration. Examination of the flow field differences, between the intake and exhaust strokes, were result of the machine’s asymmetry. Moreover, this study shows that turbine performance can be solely attributed to delays introduced by the internal flow field correlating the turbine’s performance with flow parameters (i.e., velocity and pressure) near the blade. In a similar study, Ghisu et al. [
6] showed that compressibility effects determine the hysteresis between acceleration and deceleration, while differences in flow parameters and secondary structures near the rotor are negligible under similar flow conditions.
Taha et al. [
7] compared the performance of a NACA0020 blade profile with various uniform tip and non-uniform [
8] tip clearances using CFD. The results showed that the turbine performance is significantly influenced by tip clearance. It was shown that a turbine with non-uniform tip clearance performs similarly to one that is uniform. However, a turbine with non-uniform tip clearance, however, seems to have a better overall performance. One of the most noticeable features is that a turbine with a larger tip clearance is able to operate at a greater flow rate without stalling. Additionally, this research showed that turbine performance was greatly influenced by tip leakage flow. The study concluded that increased tip clearance to chord length ratios led to reduced peak efficiency and wider stall margins of the turbine.
As part of the effort to improve Wells turbine performance, different researchers considered different methodologies. Takao et al. [
9] improved the original Wells turbine design by adding end plates. Das et al. [
10] obtained improvement of a Wells turbine through an automated optimization technique using OPAL++. In this study, a turbine with a ring-type endplate was optimized using four geometric properties. The modified geometry increased the peak torque by 120%, the efficiency by 9%, and delayed the stall point. Shaaban et al. [
11] used a duct geometry on Wells turbine to improve the performance by optimizing the duct geometry. By optimizing the duct geometry, turbine power and efficiency are increased by 14% and 9%, respectively. Halder et al. [
12] improved the design of a Wells turbine by increasing the operating range. In order to find the optimal design, Reynolds-averaged Navier-Stokes (RANS) equations were solved and a surrogate approximation model was constructed. For this design, the peak efficiency dropped by 3.1%. However, compared to the reference case, both relative power output and relative stall point increased by 29% and 18%, respectively.
Mohamed et al. [
13] studied multi-objective optimization of the turbine blade’s airfoil to increase power and improve efficiency. The methodology explored using a monoplane Wells turbine with symmetric airfoil blades to optimize efficiency by increasing the tangential force. The performance of the proposed solution is demonstrated by detailed comparisons with the classical Wells turbine with symmetric airfoils. A new design of the airfoil shape increased power output by 11.3%, and efficiency by 1% throughout the operating range.
Setoguchi et al. [
14] used 2-D and 3-D models with guide vanes to improve turbine performance. This study showed that design parameters as well as the nature of the flow downstream and upstream to determine the efficiency of a turbine. Furthermore, the study showed the upstream guide vanes are primarily responsible for improving the turbine running characteristic, while the downstream guide vanes are improving the turbine starting characteristic.
Halder et al. [
15] completed a detailed review of Wells turbine design modifications and some key selected design changes include variation of airfoil profiles, blade sweep, pitch angle, and geometry. However, the research focused on multi-objective optimization of blade sweep. This study performed numerical analysis by solving the RANS equations and k-ω SST turbulence model for the flow field. Based on the computational results, the peak of torque coefficient was increased by 28.28% and the efficiency was decreased by 13.5%
Watterson et al. [
16] studied the effect of solidity calculations on Wells turbine performance. A three-dimensional RANS flow solver was used to determine the performance of a Wells turbine. Using NACA 0015 blades, a monoplane device performance has been calculated with Reynolds number 8 × 10
5, tip Mach number 0.4, hub-to-tip ratio 0.6, and a tip clearance of 2%. For different blade counts, calculations were performed to study the effects of solidity. The results showed that by increasing turbine solidity and thus blade-to-blade fluid interaction, the turbine is less susceptible to stall.
In the present work, a Wells turbine blade design was changed by adding the Trailing Edge Serration (TES) patterns. Several theoretical [
17,
18], numerical [
19], and experimental [
20,
21] studies have shown that TES can mitigate negative aeroacoustics impacts caused by the interaction of turbulent boundary layers at the trailing edge of the blade. The results of these studies verified the positive effect of trailing edge serrations on noise reduction. Recent studies have demonstrated that the practical implementation of the serration design alters the flow streamlines at the teeth’s roots [
22,
23]. While trailing edge serrations reduce noise, the aerodynamic impacts on turbine performance have not been studied thoroughly.
2. Materials and Methods
In this work, we assess the aerodynamic performance of different trailing-edge serration designs, by solving the RANS equations using ANSYS™ CFX. Fourteen three-dimensional incompressible simulations were completed. The turbine’s performance was evaluated by its torque coefficient, efficiency, and pressure drop coefficient under steady-state conditions. The system of equations was closed by coupling the RANS equations with the k-ω SST turbulence model. In order to ensure numerical accuracy, we used the grid metrics carried out in previous work [
24]. Furthermore, the computational model was validated by comparing the results to available numerical [
25] and experimental [
26] data. A summary of the grid independence study is provided below.
2.1. Geometry Modeling
A Wells turbine with symmetrical NACA 0015 airfoil blades fixed at a 90-degree staggered angle was utilized. The demonstrated turbine model consists of eight blades around the hub and perpendicular to the axial fluid flow direction. Each blade has a 0.125 m chord length, with hub and tip radius of 0.200 m and 0.300 m, respectively. To precisely assess the turbine performance, the tip clearance has been taken into consideration. For fluid flow in turbomachinery, the tip leakage flow is a significant secondary flow which was chosen to be 1% of the chord length.
The turbine rotor blade solidity is used to account for the wake effect on the blades. During the rotation of a turbine, solidity indicates the amount of obstructions in the airflow. Furthermore, it is a measurement of a turbine’s blades’ mutual interaction and a crucial design element for self-starting [
27,
28,
29,
30,
31]. Solidity is constant at 0.67 which leads to having eight blades around the rotor. As a result of numerous studies [
32], it has been demonstrated that this solidity value of 0.67 is highly suitable for Wells turbines. As a result of the Wells turbine’s symmetry, we have thoroughly analyzed only one of its eight blades.
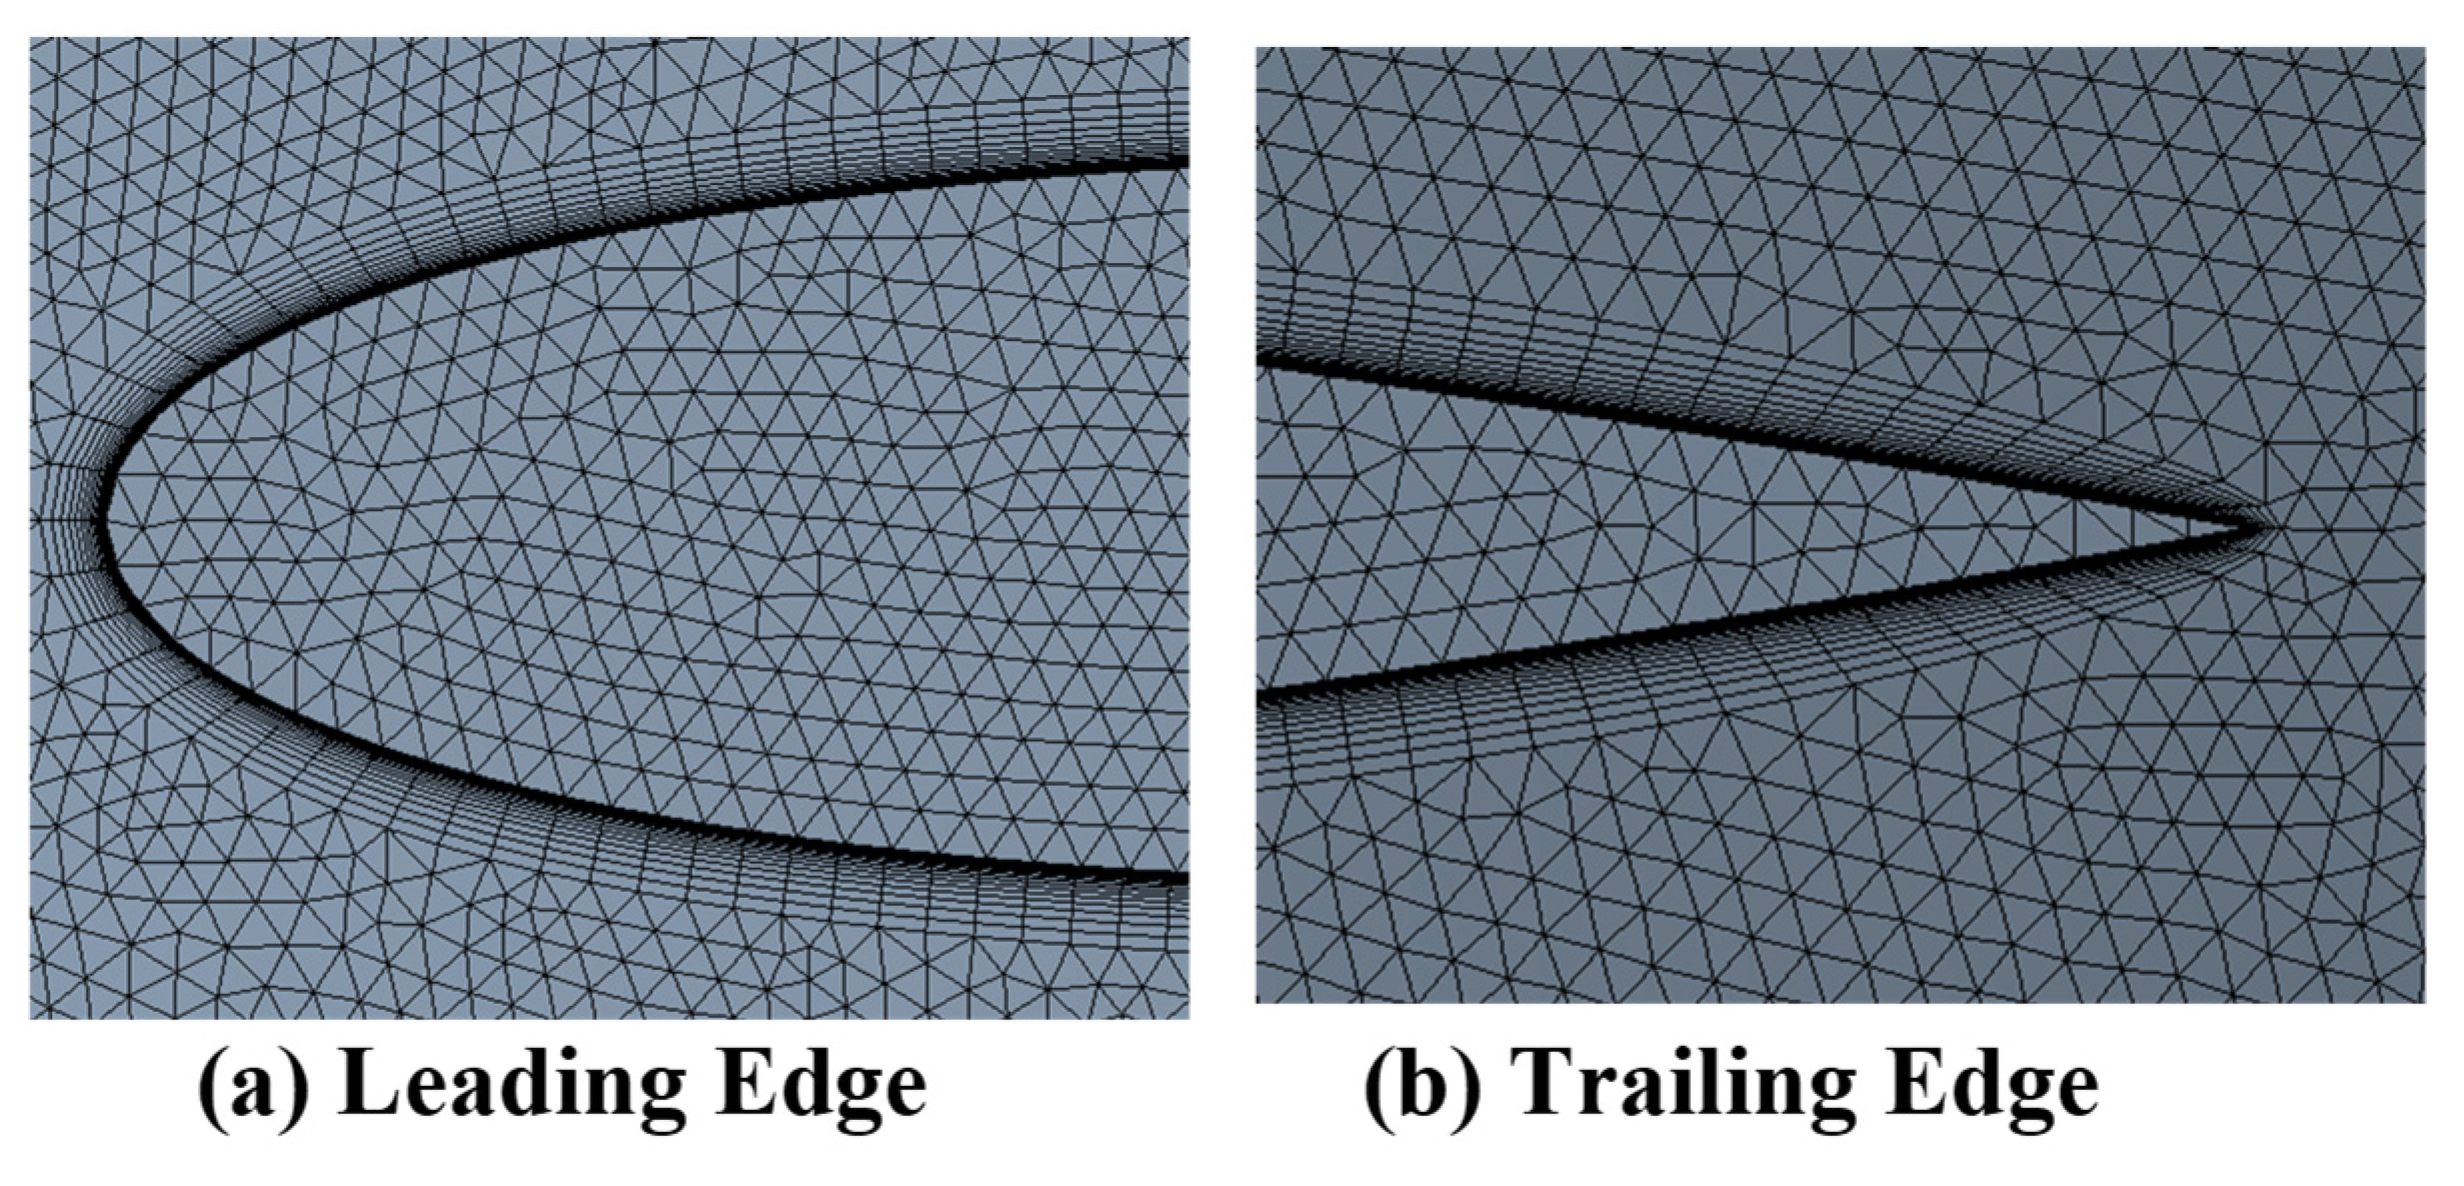
CFD analysis requires discretization of the governing equations. Also, consequently, discretization errors can appear in the CFD results. In numerical analysis, errors can be primarily caused by the quality of the computational grids. ANSYS meshing was used to discretize the flow domain by forming an unstructured mesh for the presented designs (see
Figure 2). The boundary layer flow of the rotor blades must be sufficiently resolved to predict the dynamic stall point of a turbine. In order to accurately predict the viscous sublayer, because of their sensitivity to meshes, the k-ω SST turbulence model requires high resolution with
< 1. Therefore, to capture the boundary layer flow, inflation layers of closely spaced hexahedrons were generated on the walls of the turbine blades.
An inviscid flow occurs away from the airfoil surface, and a viscous flow occurs adjacent to it, where friction dissipates energy (i.e., the boundary layer). CFD has traditionally measured boundary layer thickness by δ, which is a dimensionless distance normal to the airfoil surface. By adjusting this parameter, the boundary layer develops correctly. Fluid density, absolute distance from wall, friction velocity, and viscosity are all used to calculate
Based on equation or
the first layer height was obtained as
with a growth factor of 1.2. The total number of inflation layers was 20. As shown below, friction velocity can be calculated using the square root of the wall shear stress to fluid density ratio.
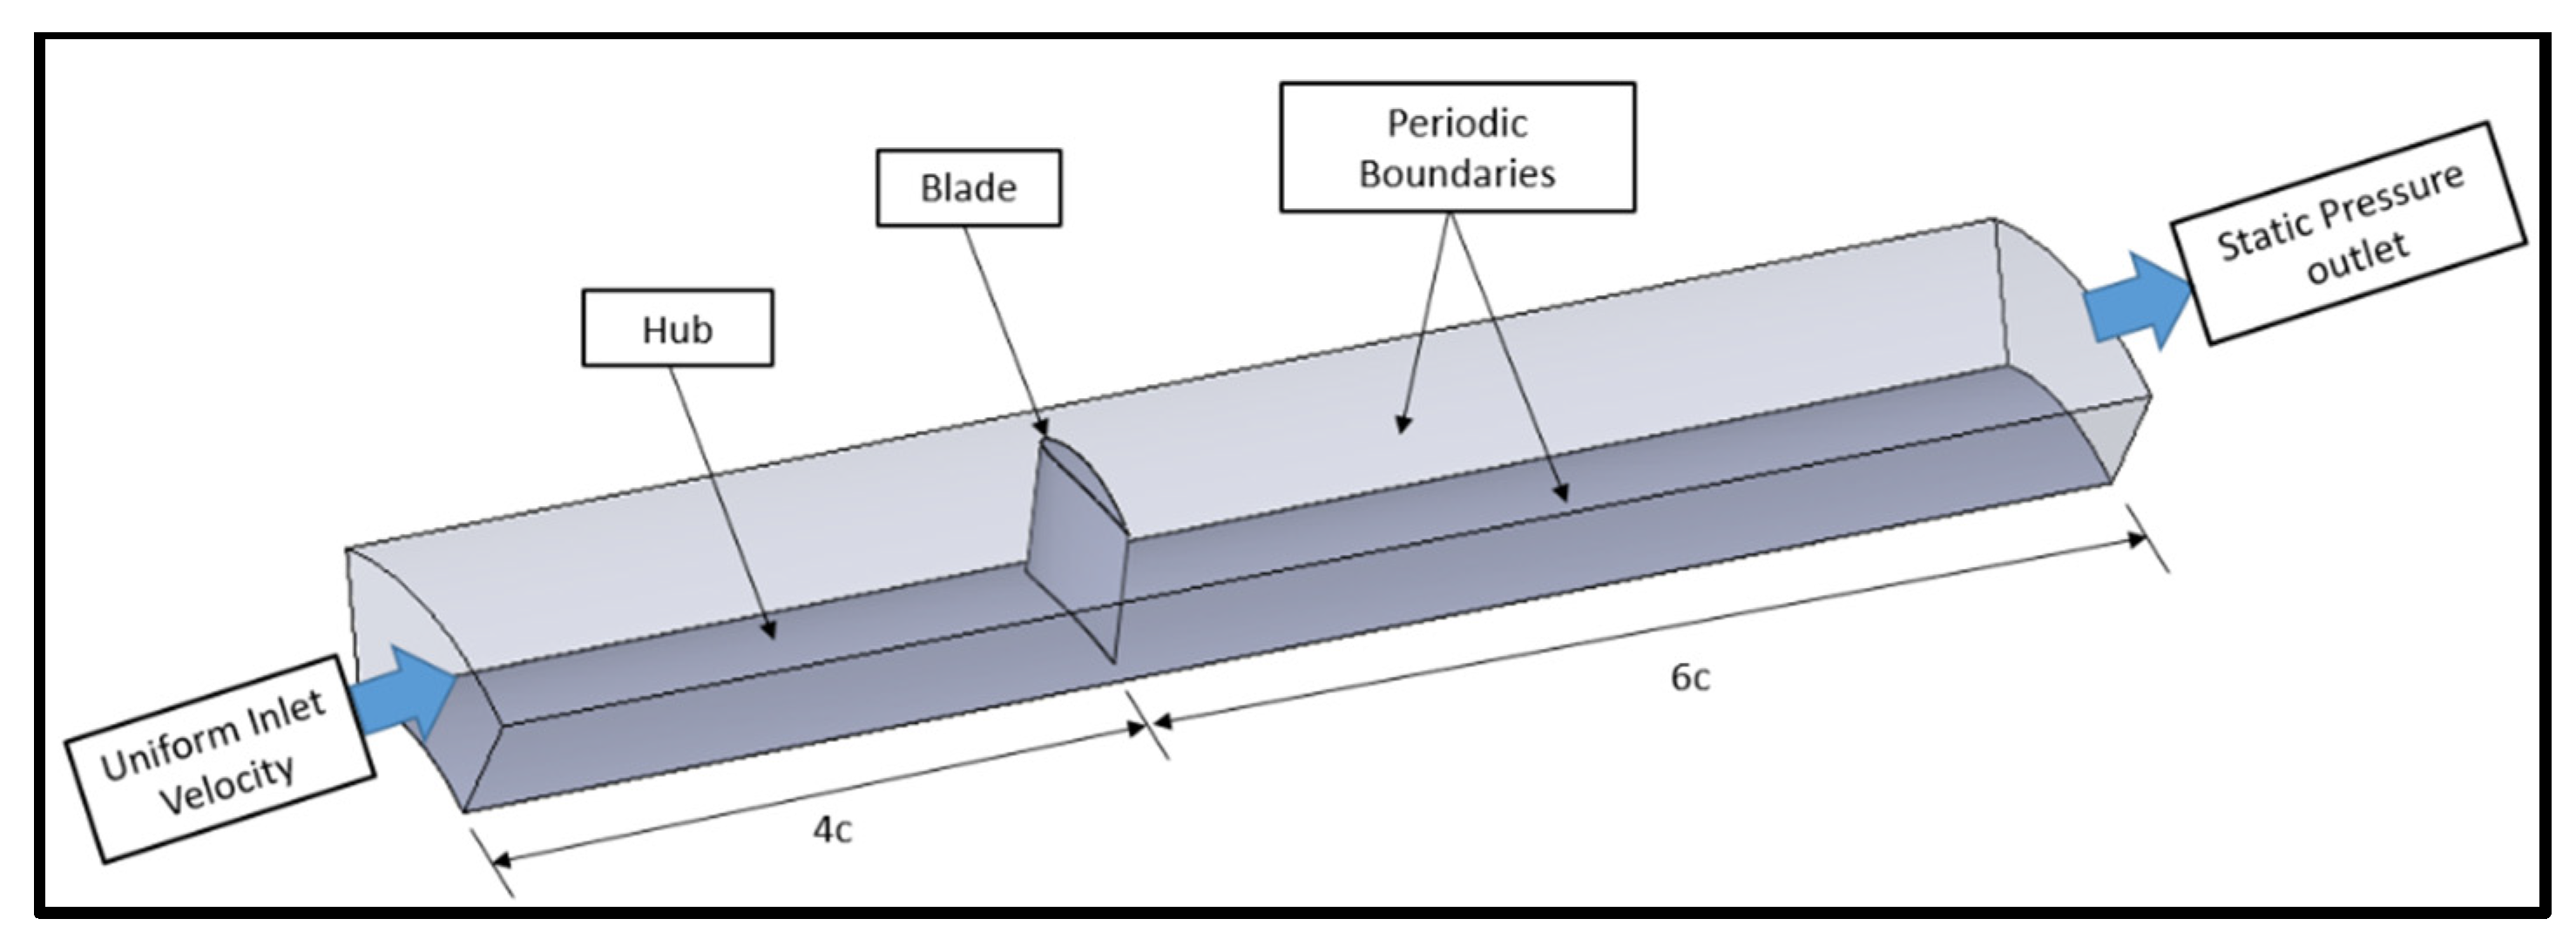
At the velocity inlet, there is a 5% turbulent intensity distributed uniformly across the velocity profile. Output boundary conditions are imposed by static pressure of 101.3 KPa at the outlet. There are four and six times the blade chord lengths upstream and downstream of the computational domain length. At the hub, tip, and blade surface, no-slip boundary conditions are specified. Considering that Wells turbines have symmetrical geometry, calculations are restricted to one blade-to-blade passage with periodic boundary conditions, as illustrated in
Figure 3. Also, the turbine was set to rotate at 2000 rpm and the assigned convergence criterion for the solver was
.
In the fluid zone, the Moving Reference Frame (MRF) rotates at a speed equivalent to the Wells turbine rotors. The governing equations incorporate centripetal and Coriolis components to take into account the MRF. ANSYS™ CFX solved the following governing equations:
The conservation of momentum
In this equation, , , , , and respectively define transitional velocity, absolute velocity, angular velocity, viscous stress, and axis of rotation.
2.2. Grid Indepandance Study
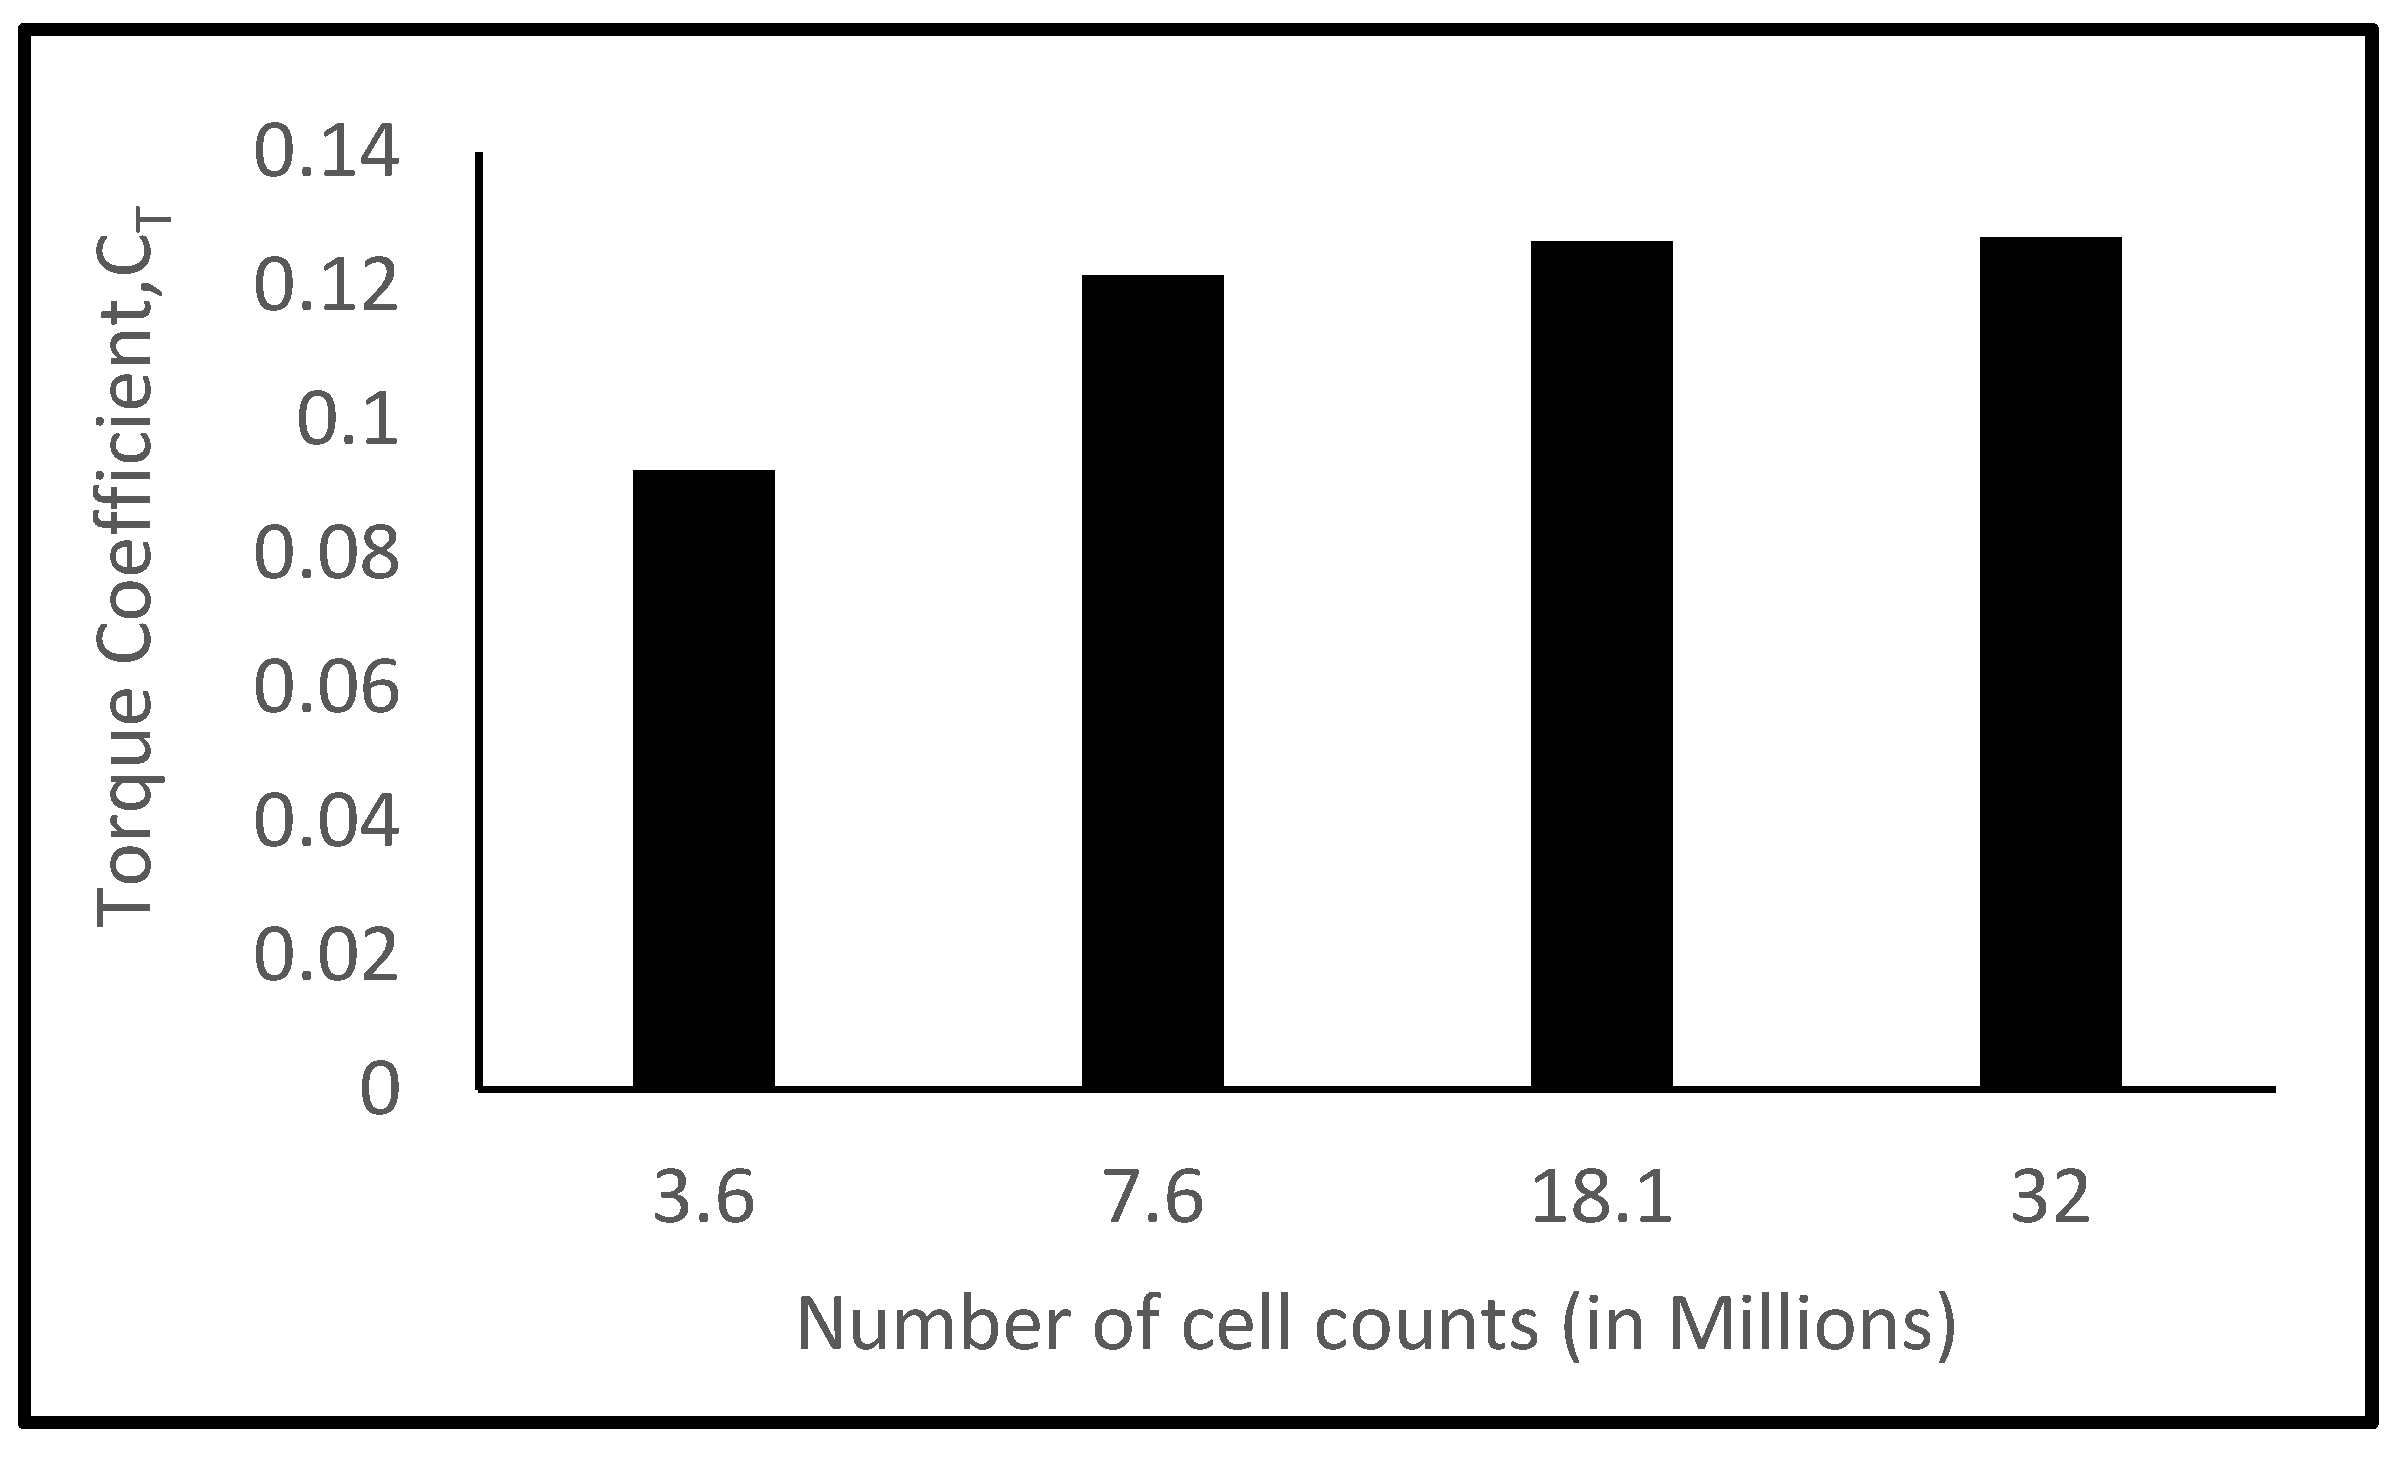
In a prior study, four different cell-size grids were analyzed [
24]. The simulations were carried out at ϕ = 0.225 and the torque coefficient was compared. A change in grid size resulted in discrepancies of approximately 24%, 4%, and 0.5% between medium, fine, and extra-fine grids, respectively on
Table 1. For the fine grid, variation in the results was negligible, resulting in reasonable accuracy. However, after examining the flow topology there was a qualitative difference between the fine and extra-fine grid. This is typical of RANS turbulence modeling of separated flows. As a result, subsequent simulations were performed using the extra-fine grids; grid dependency statistics are shown in
Figure 4.
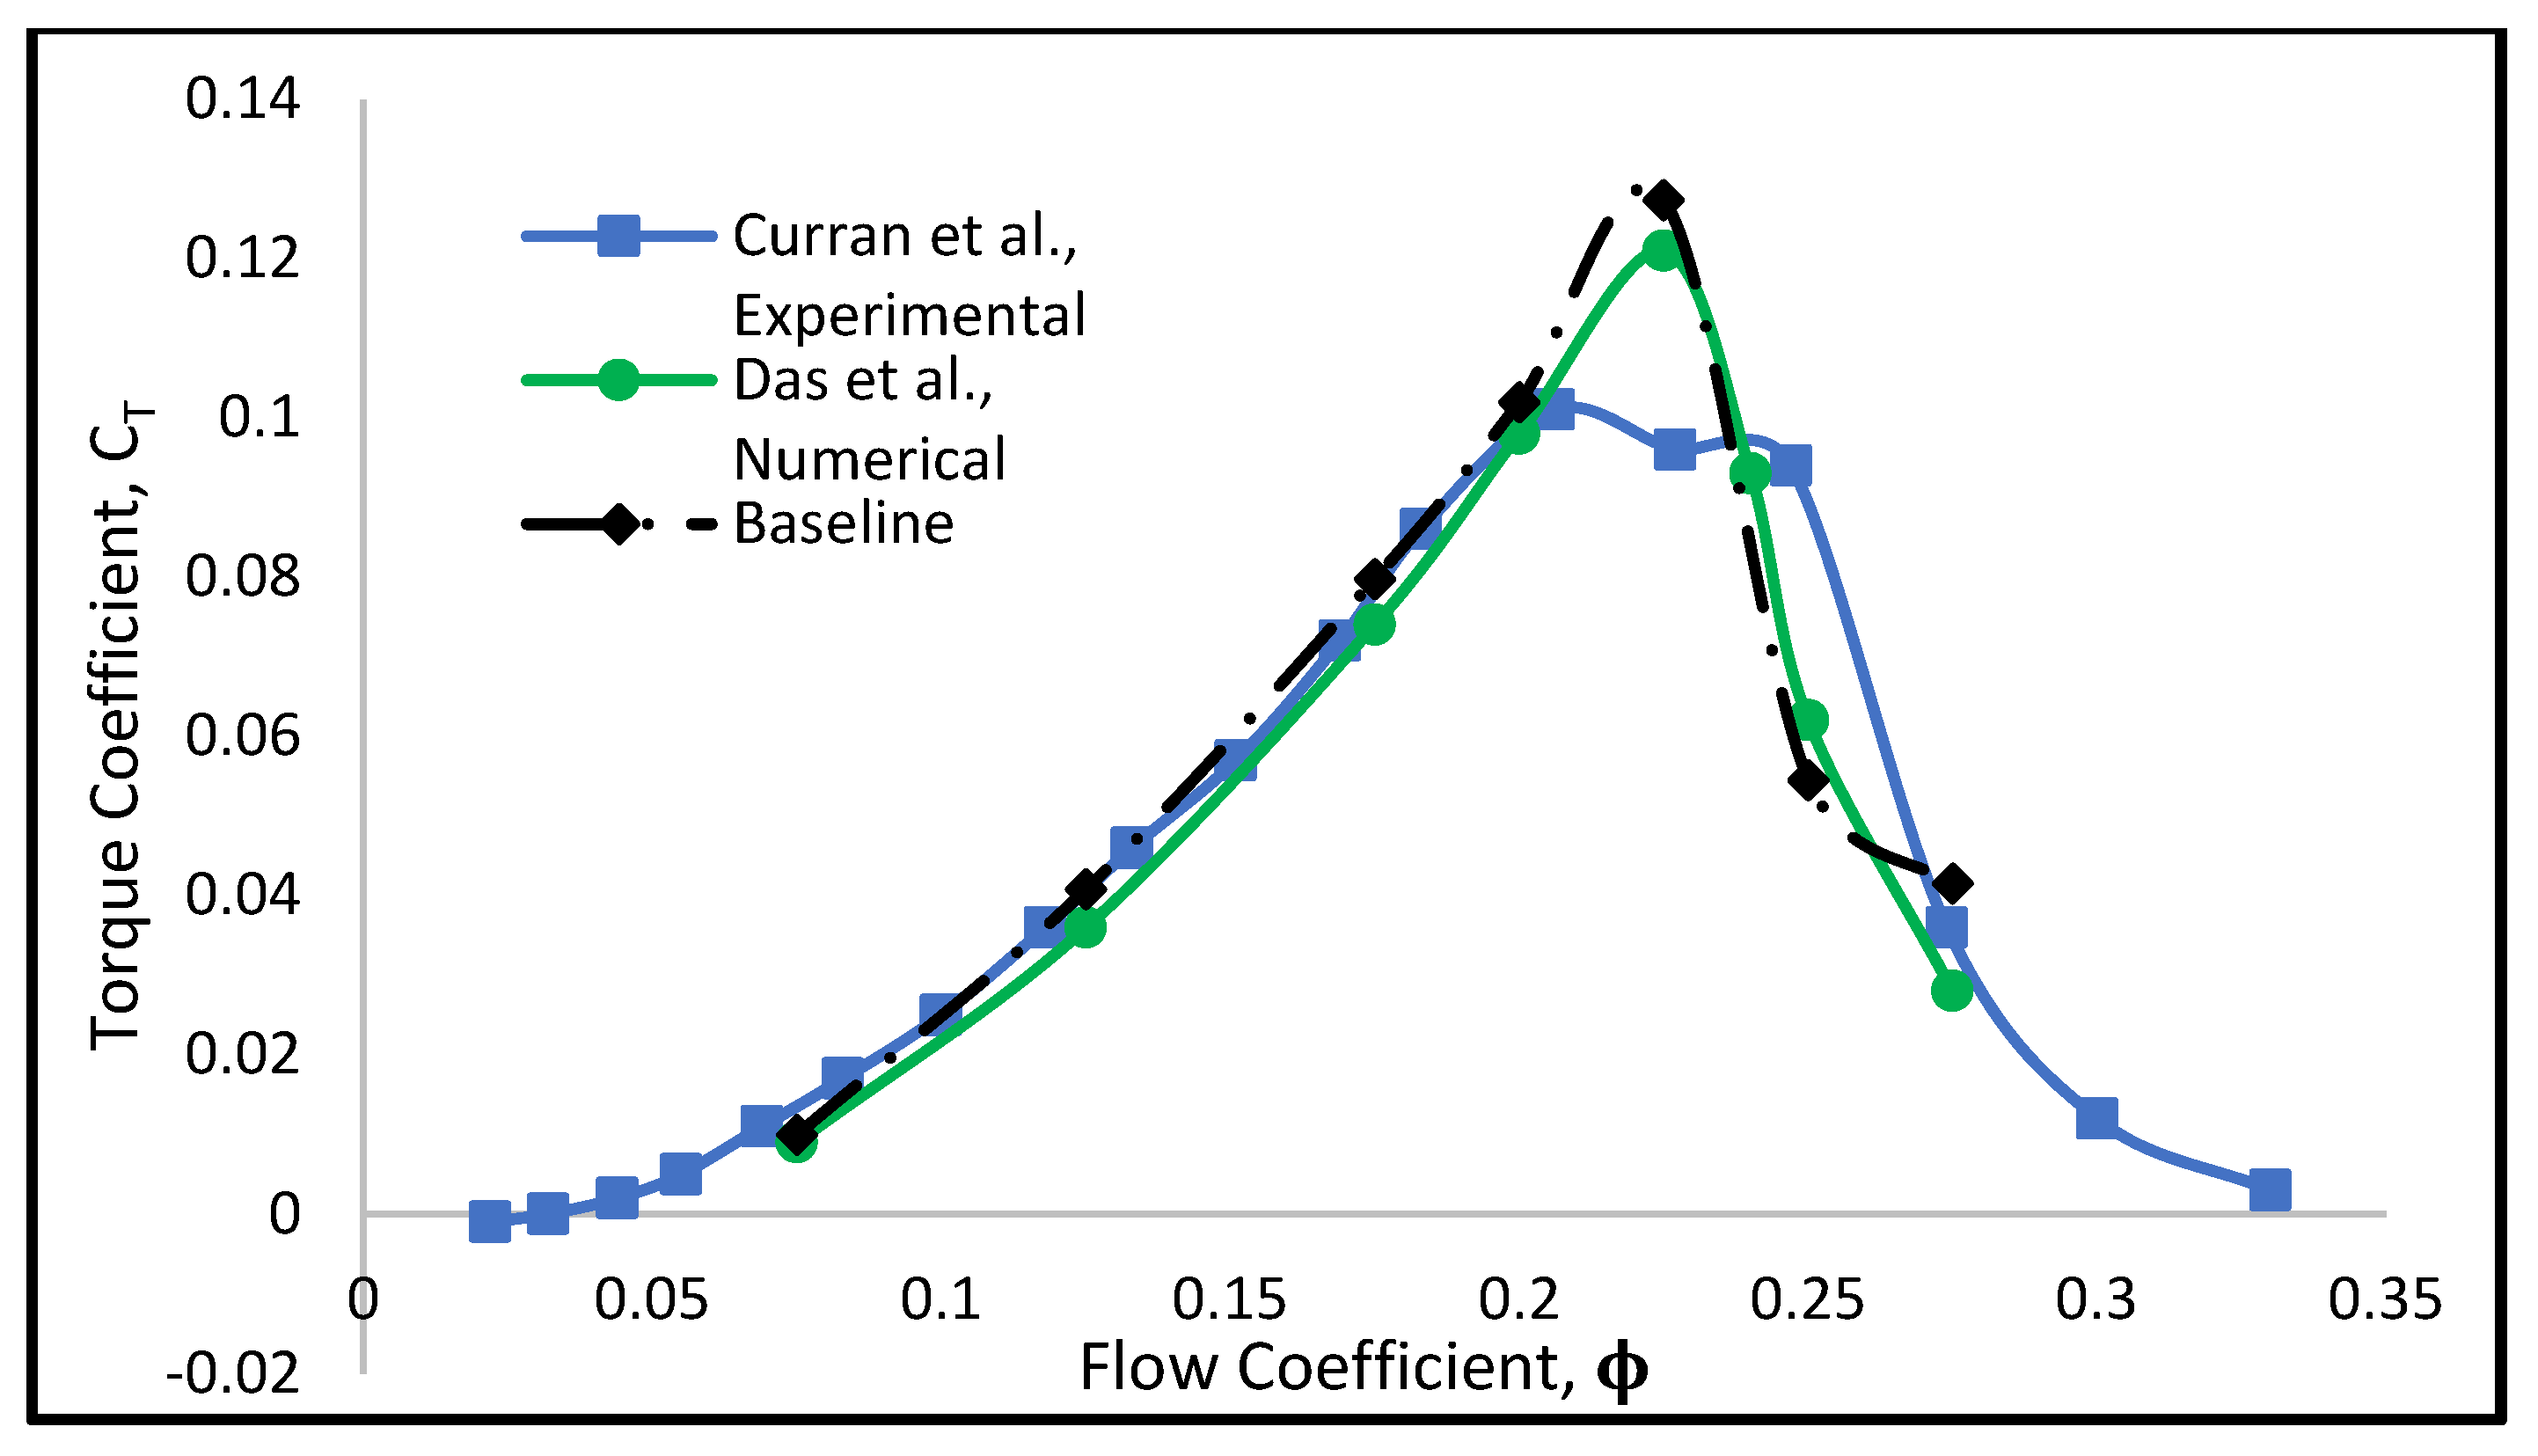
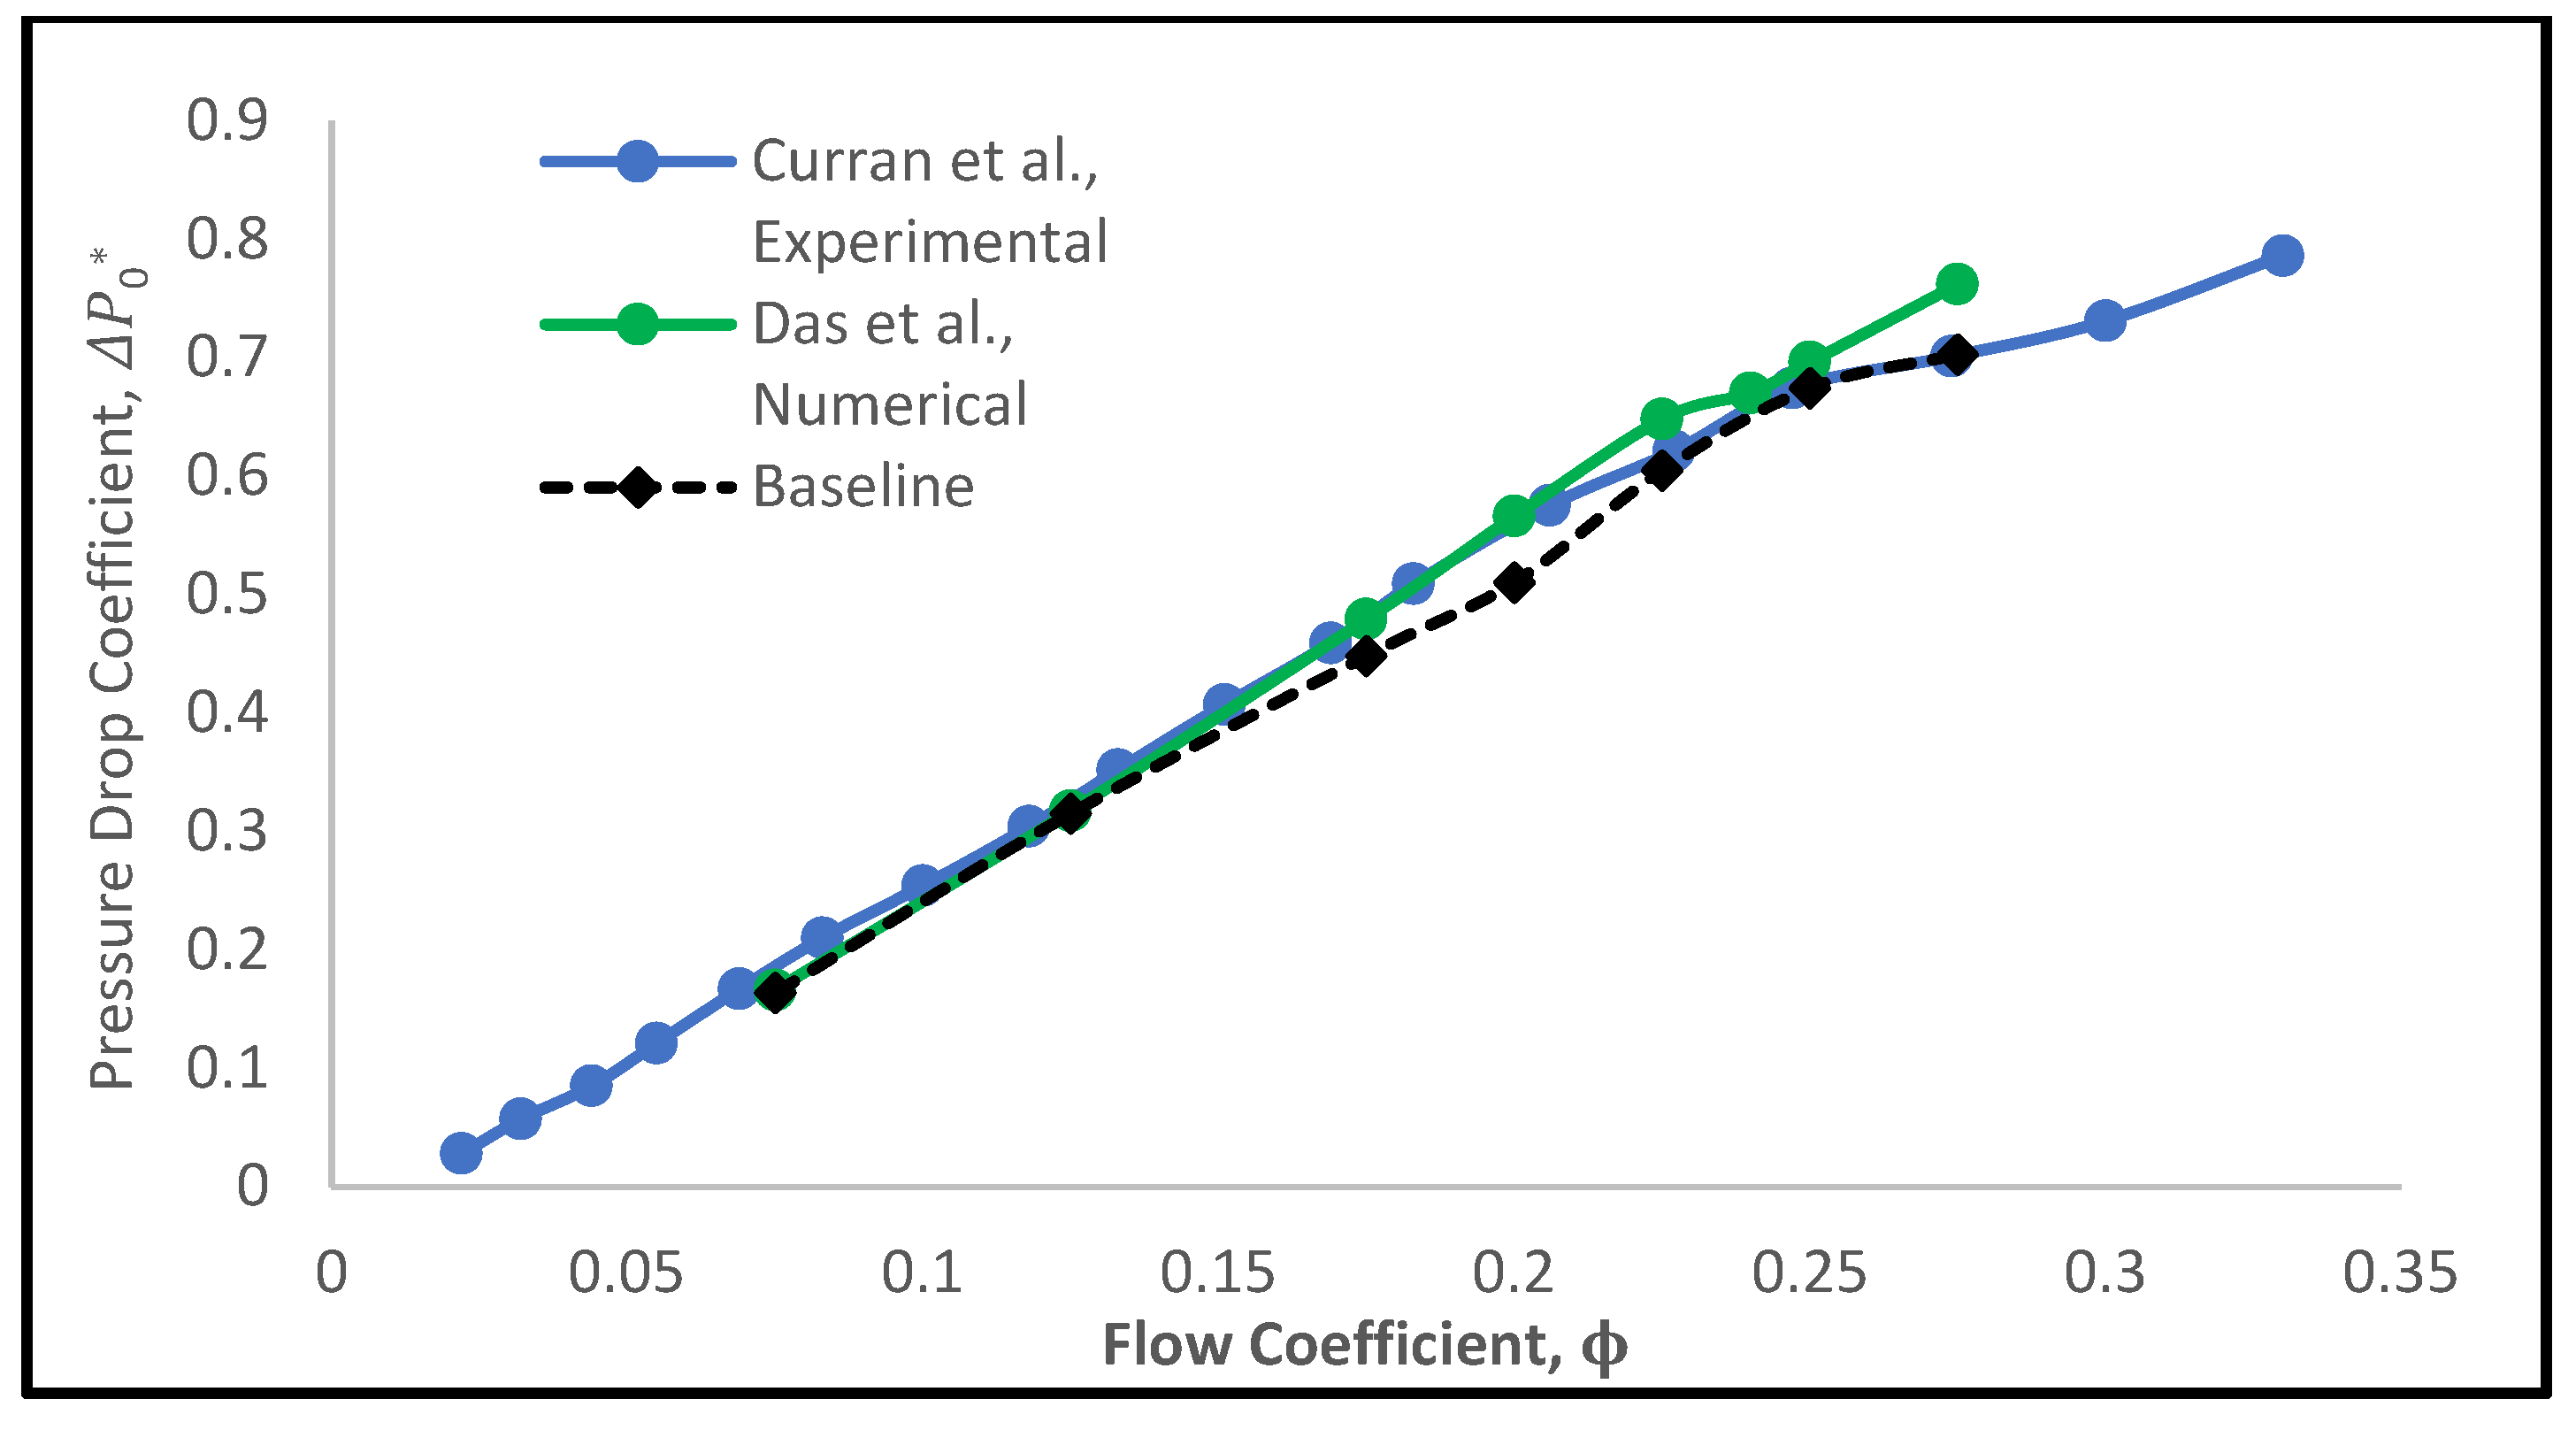
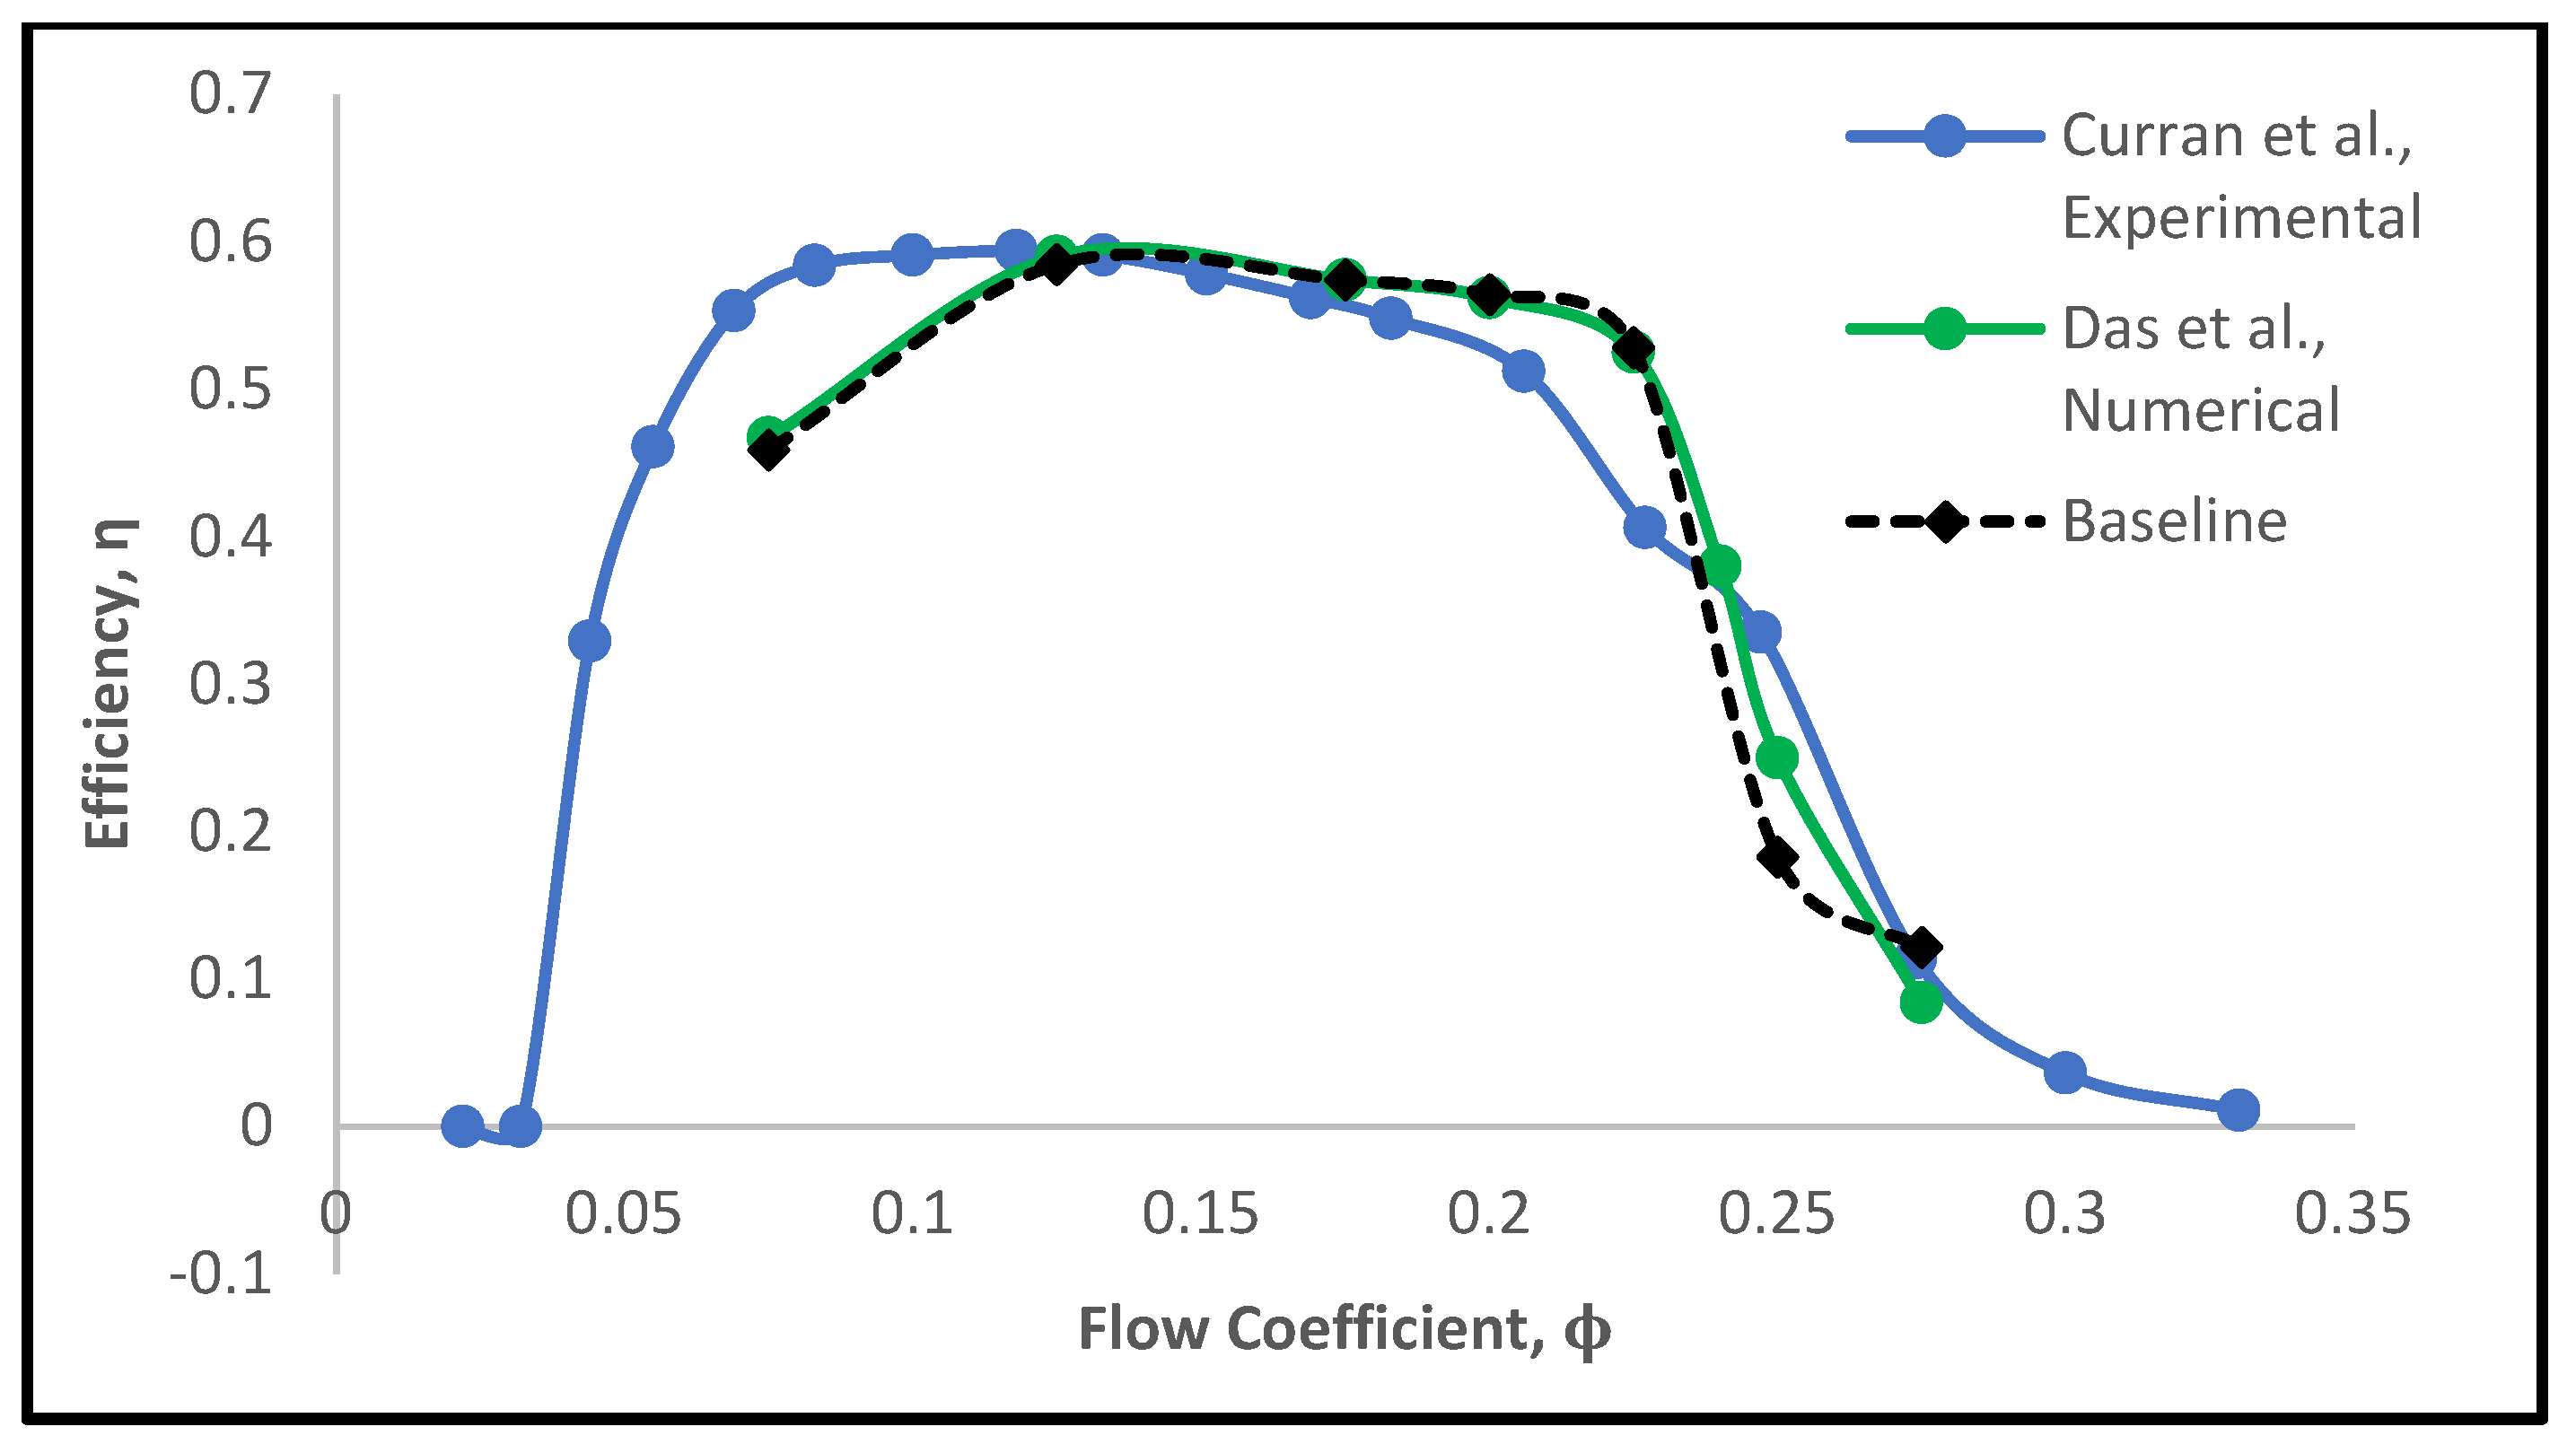
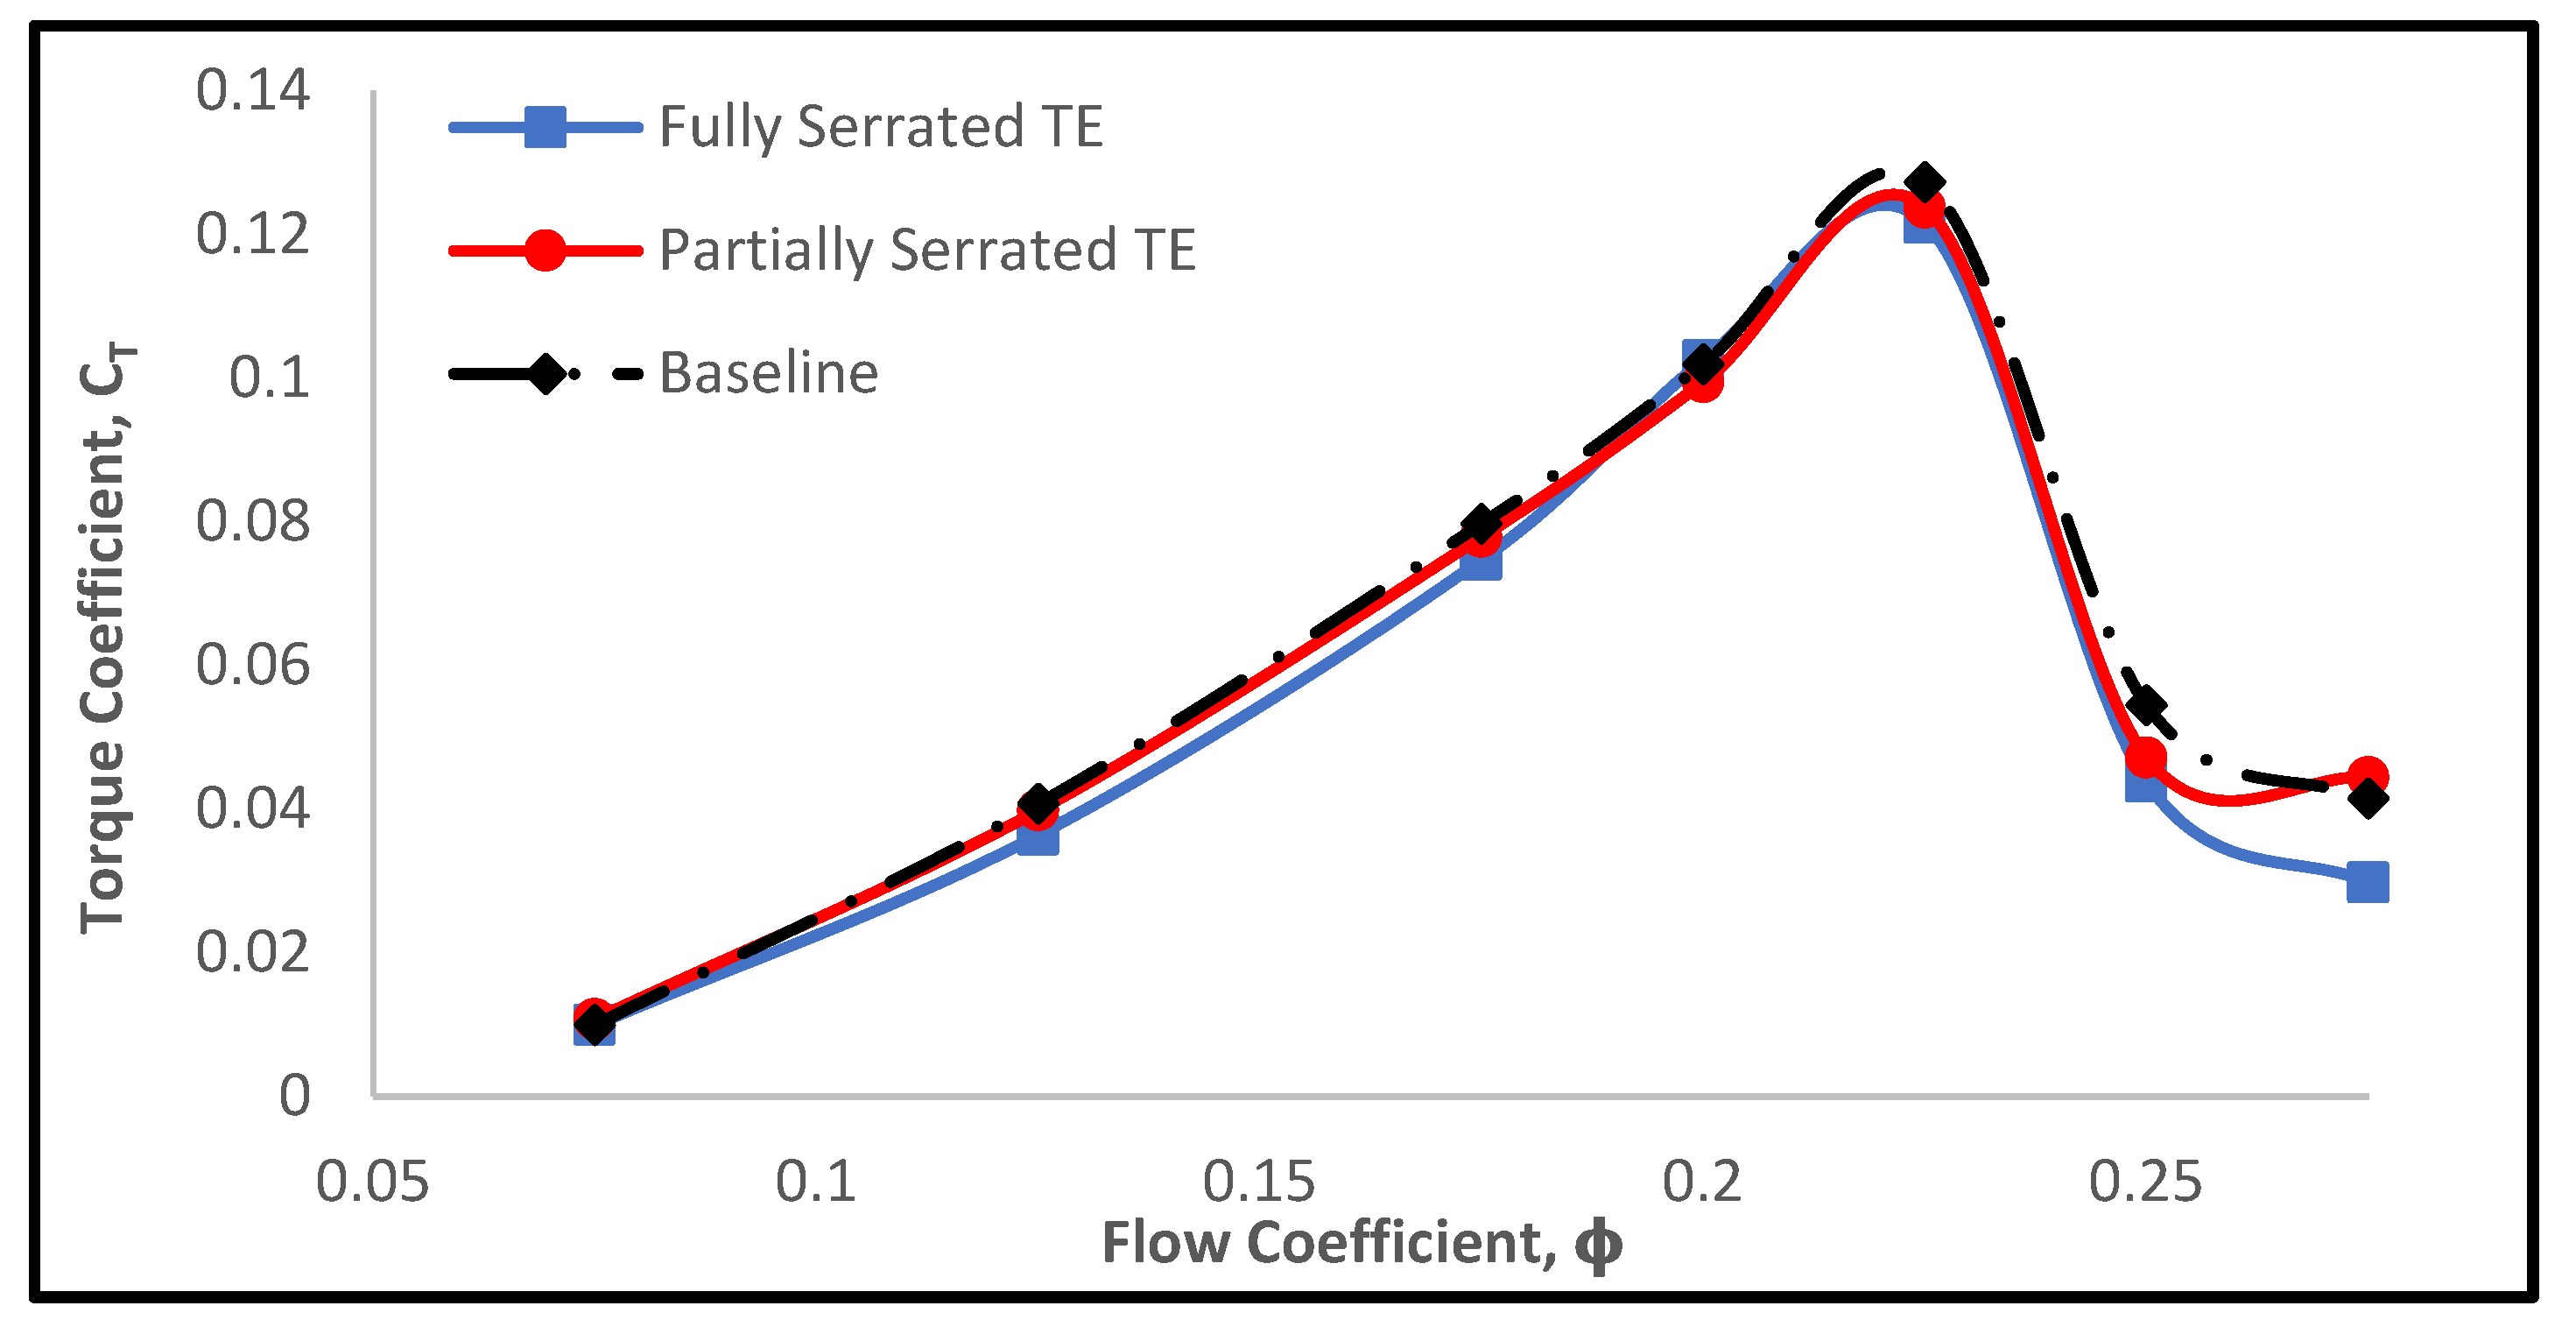
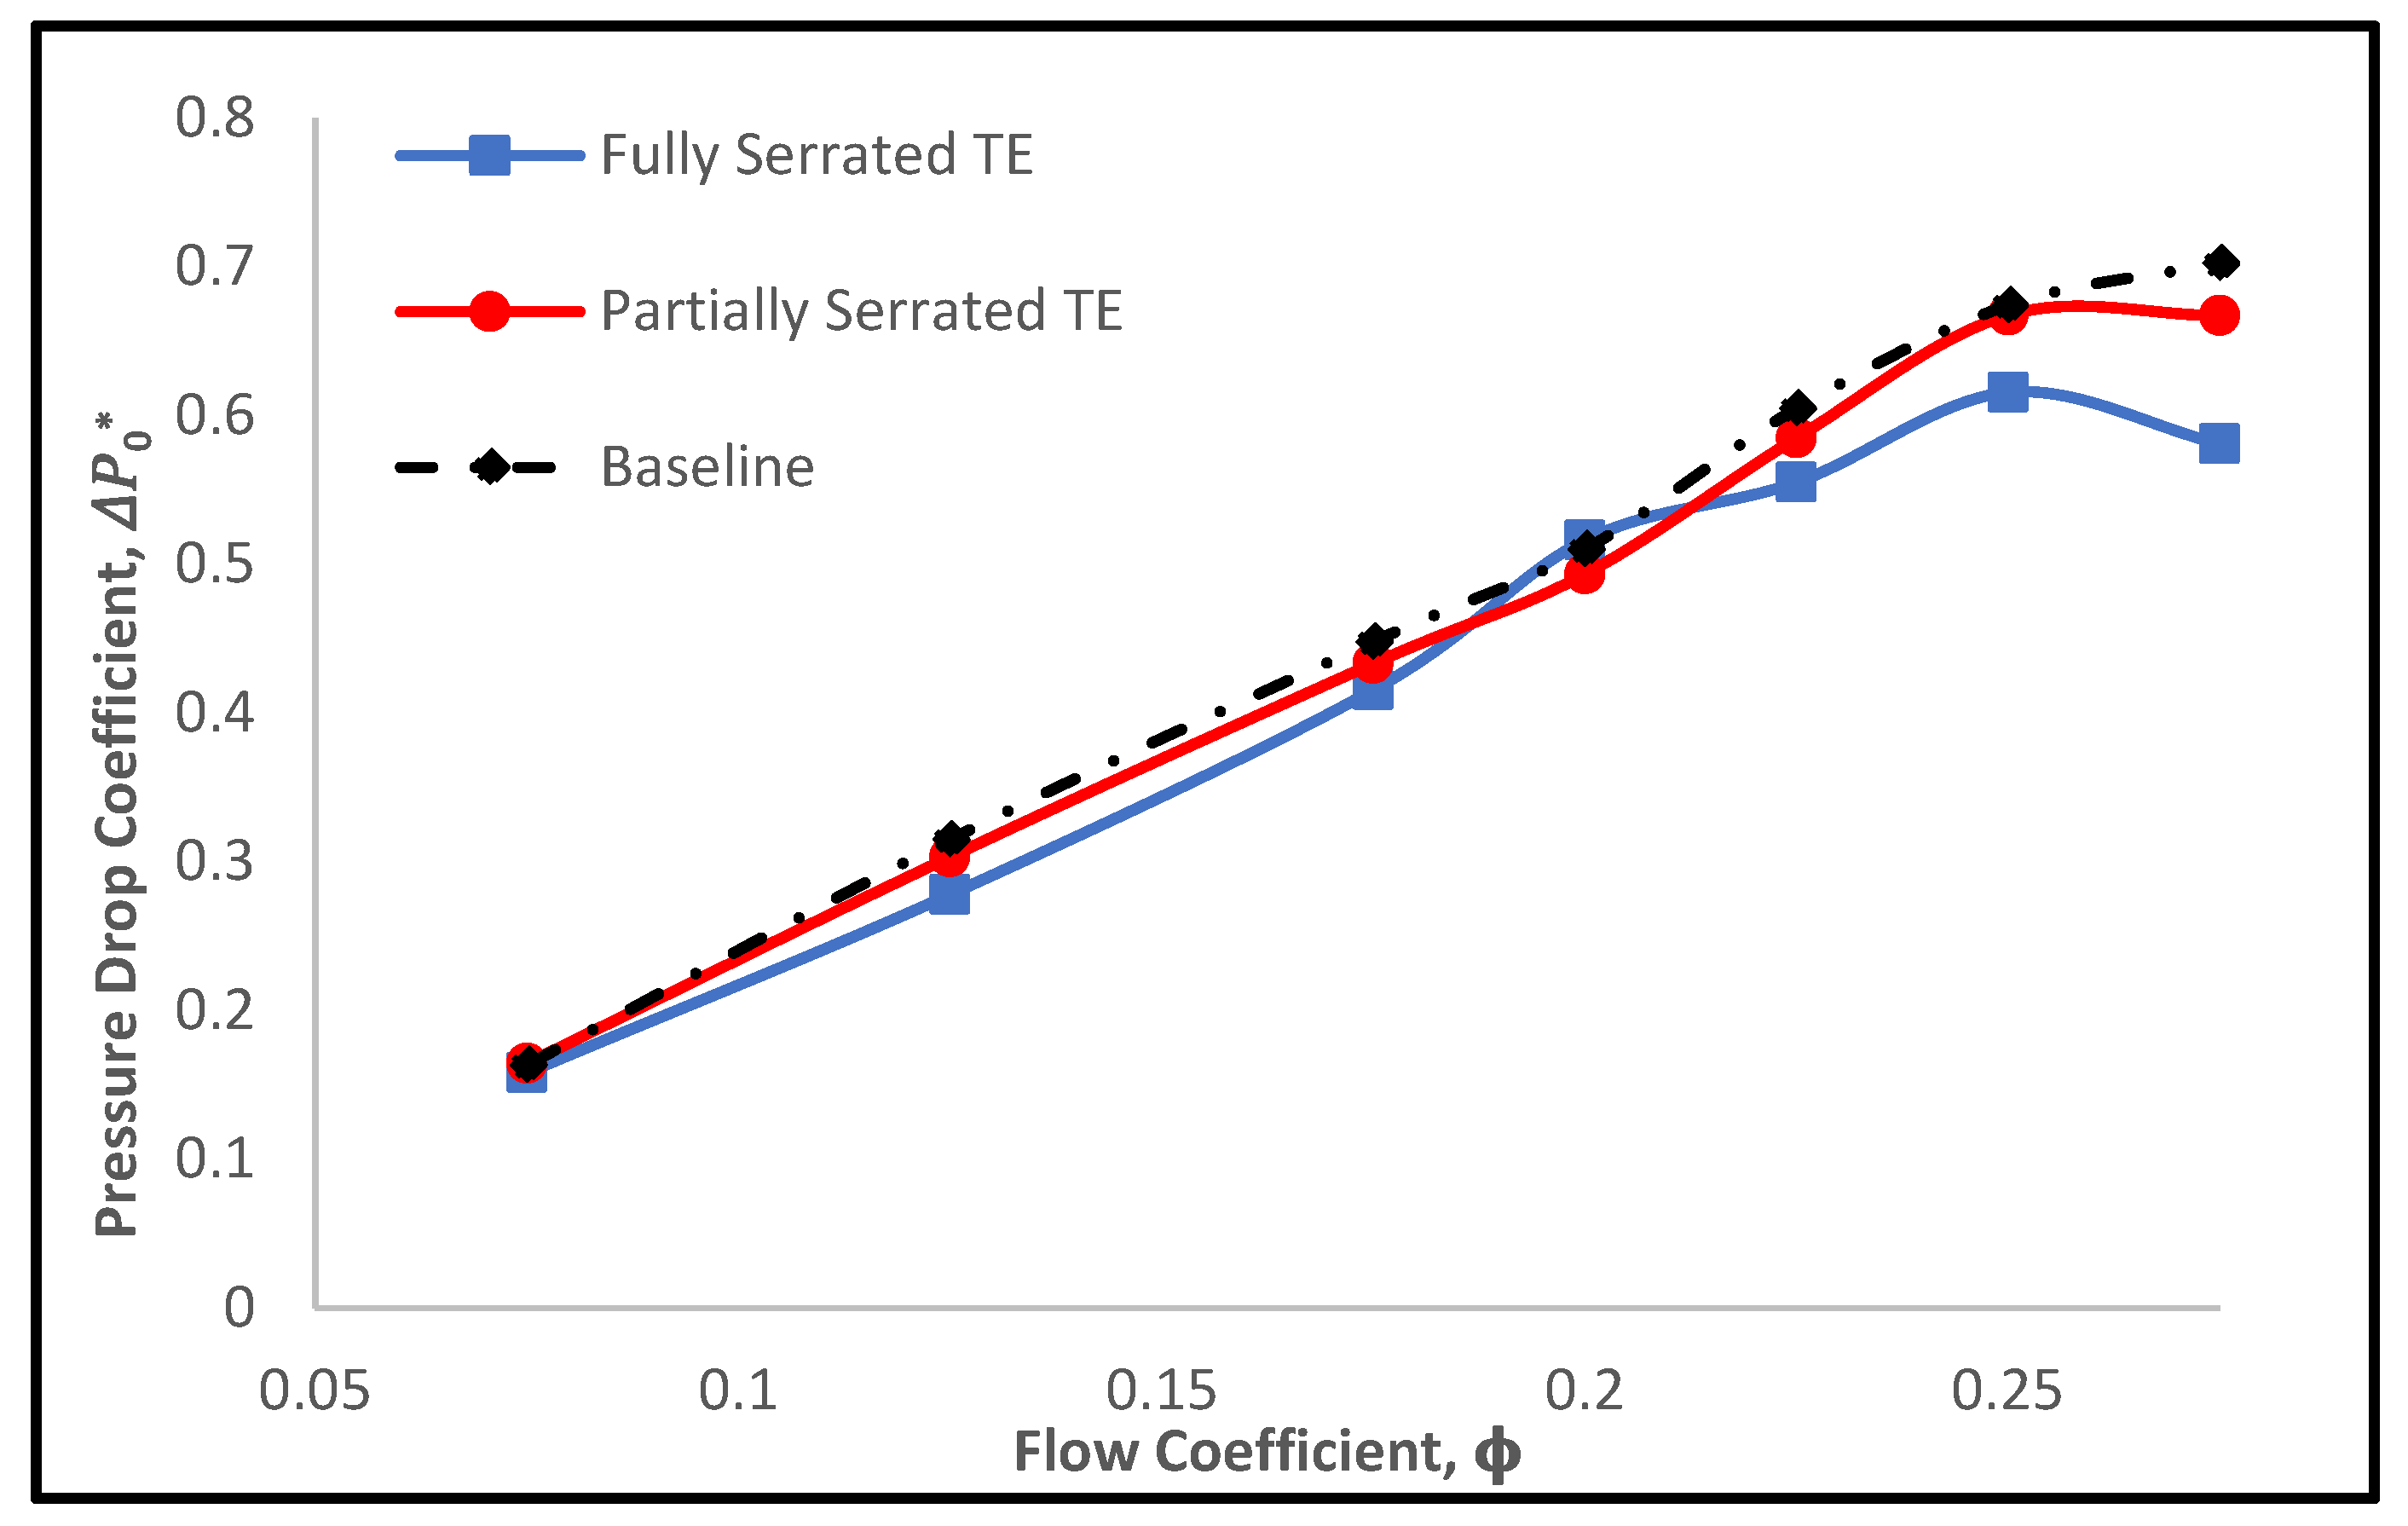
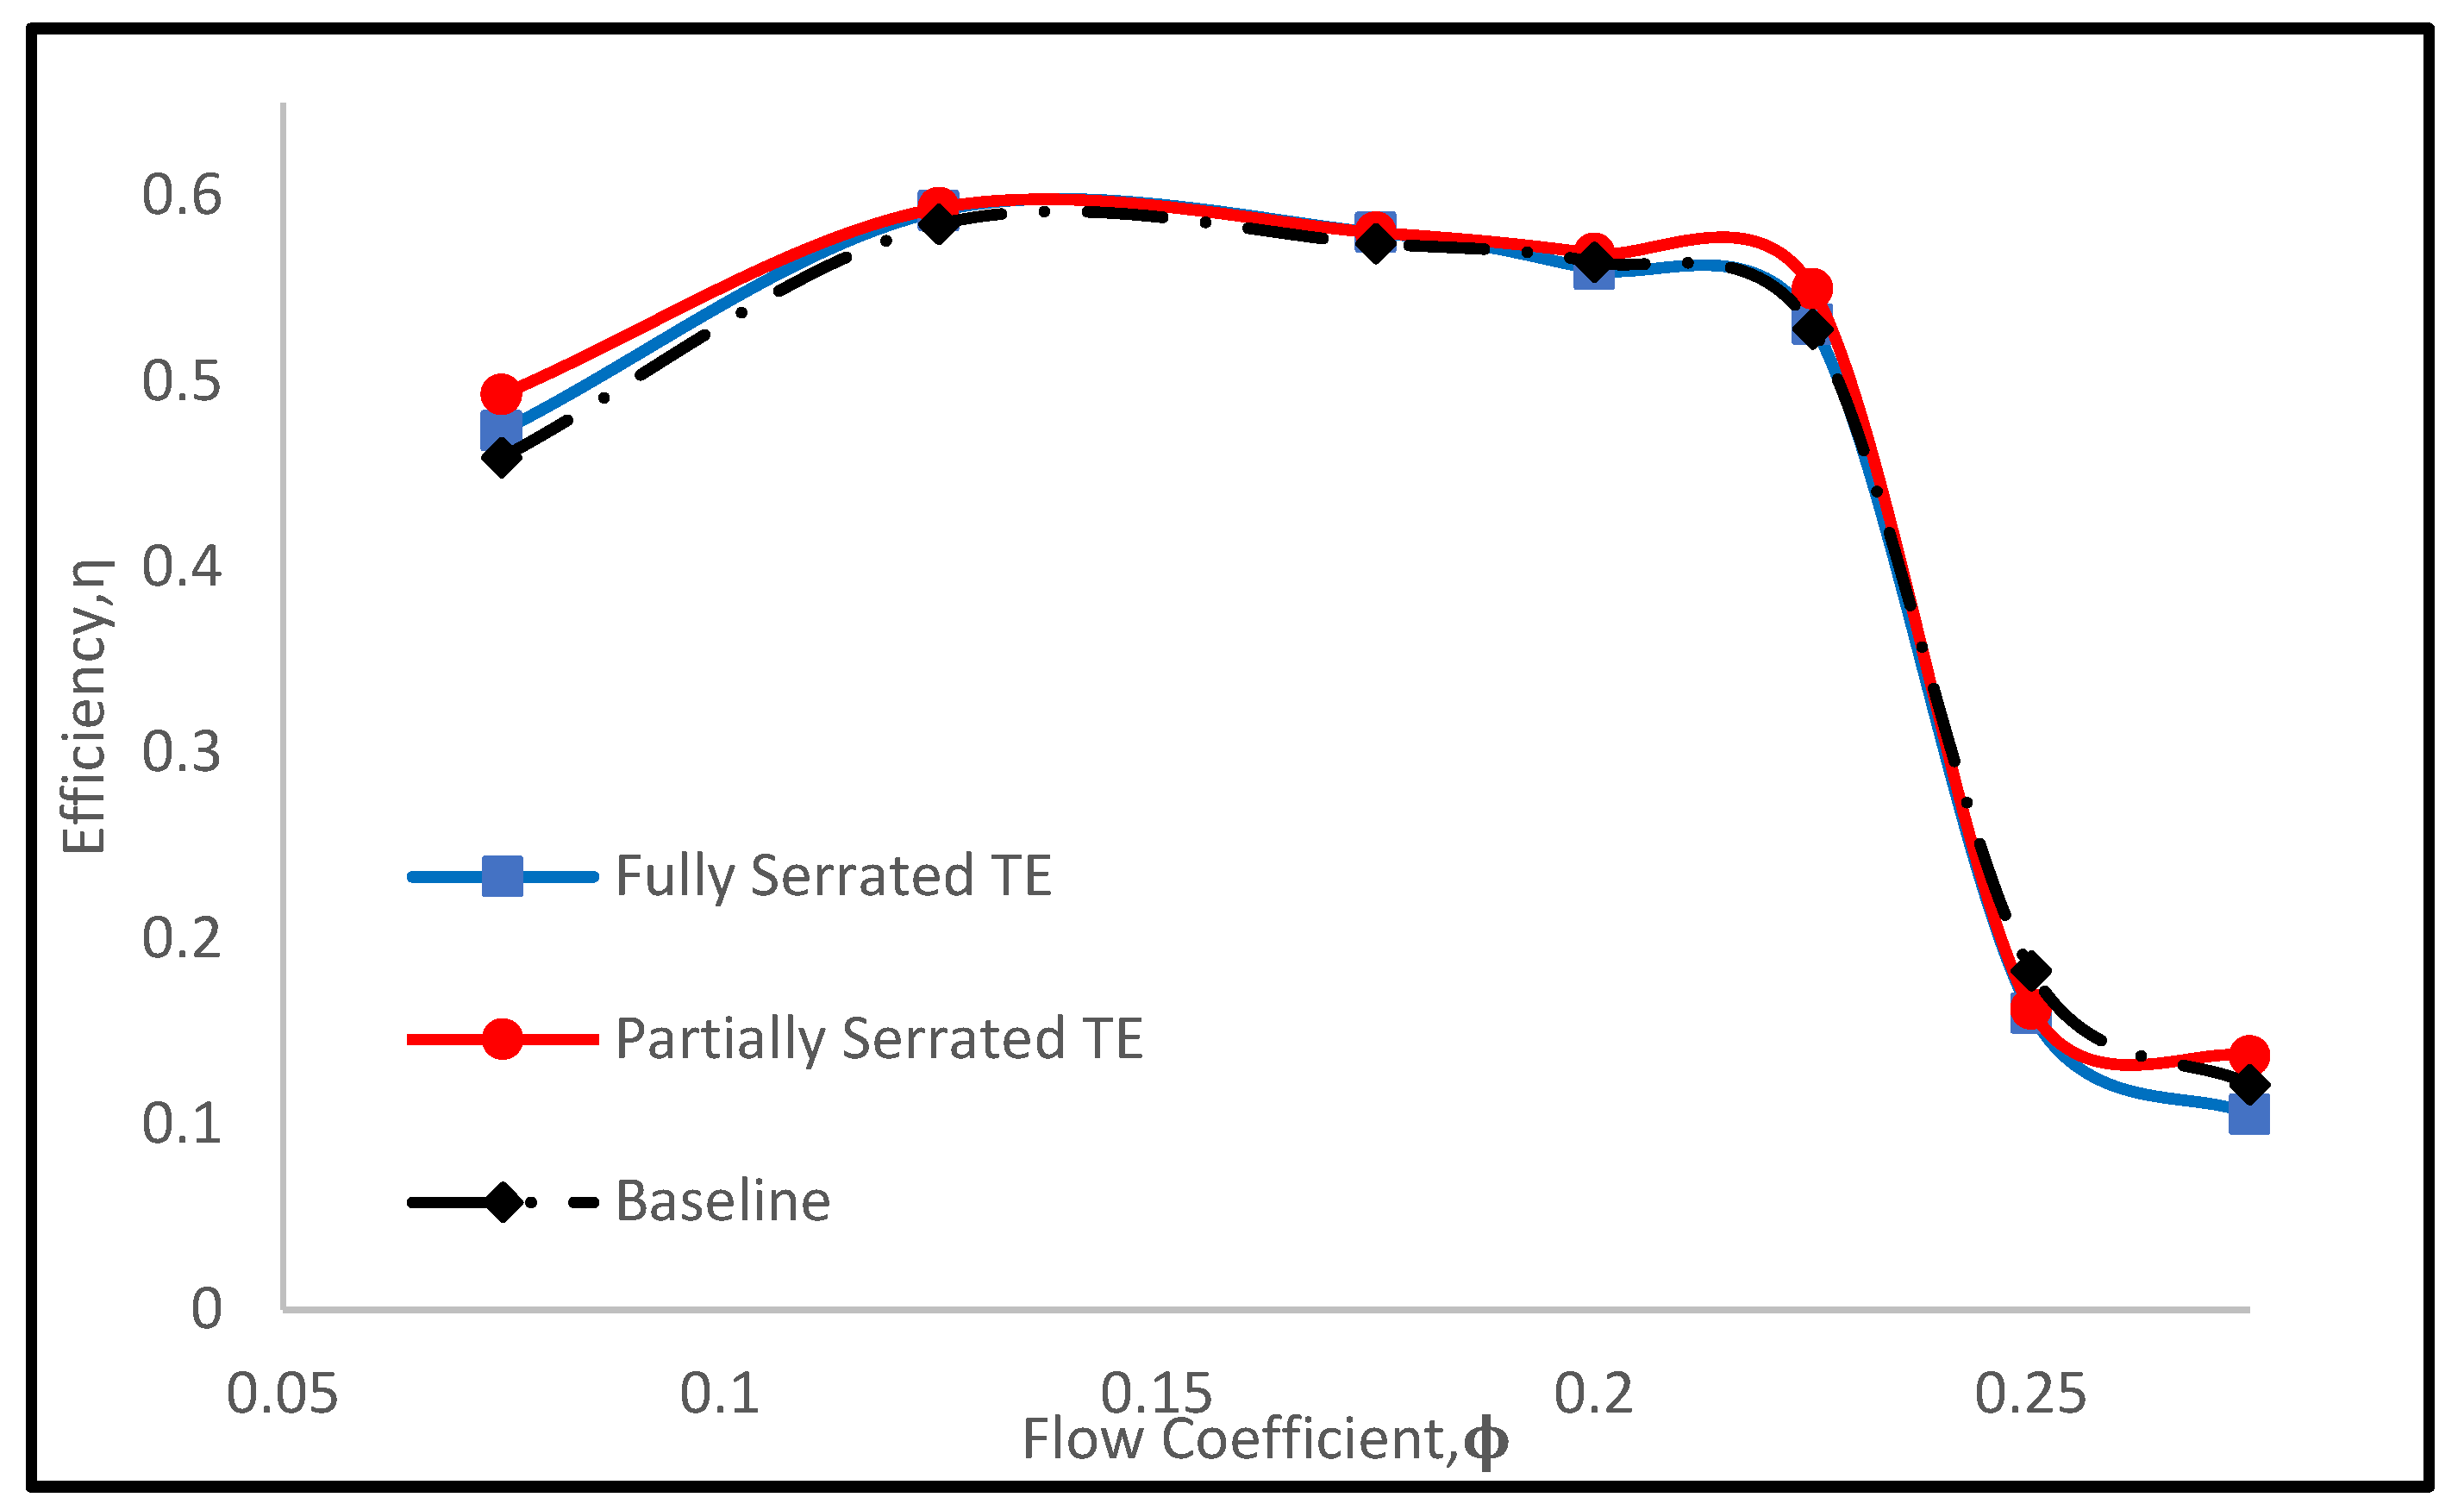
2.3. Validation
Upon completion of the grid independence study, we compared the torque coefficient (
), pressure drop coefficient (
), and efficiency (
) at various flow coefficients conducted in prior work [
24]. As shown in
Figure 5,
Figure 6 and
Figure 7, the CFD results are in good agreement until the flow coefficient reached
. Here the flow coefficient is representative of a high angle of attack. Therefore, flow separation starts to form at the leading edge and causes a rapid decrease in the torque coefficient and efficiency. The numerical results deviate from the experiment because of RANS modeling inability to adequately resolve highly separated flows. Therefore, it tends to over predict torque after stall [
25]. However, the present work corresponds well to other CFD results [
25], given the same geometrical features.
Traditionally, turbine performance is characterized by non-dimensional coefficients such as:
The torque coefficient,
CTThe Pressure drop coefficient,
The terms represent the blade torque, volumetric flow rate, static pressure drop across the turbine, the circumferential velocity at blade mean radius, blade height, blade chord length, number of blades, axial inlet velocity, the angular velocity of the turbine, and air density, respectively.
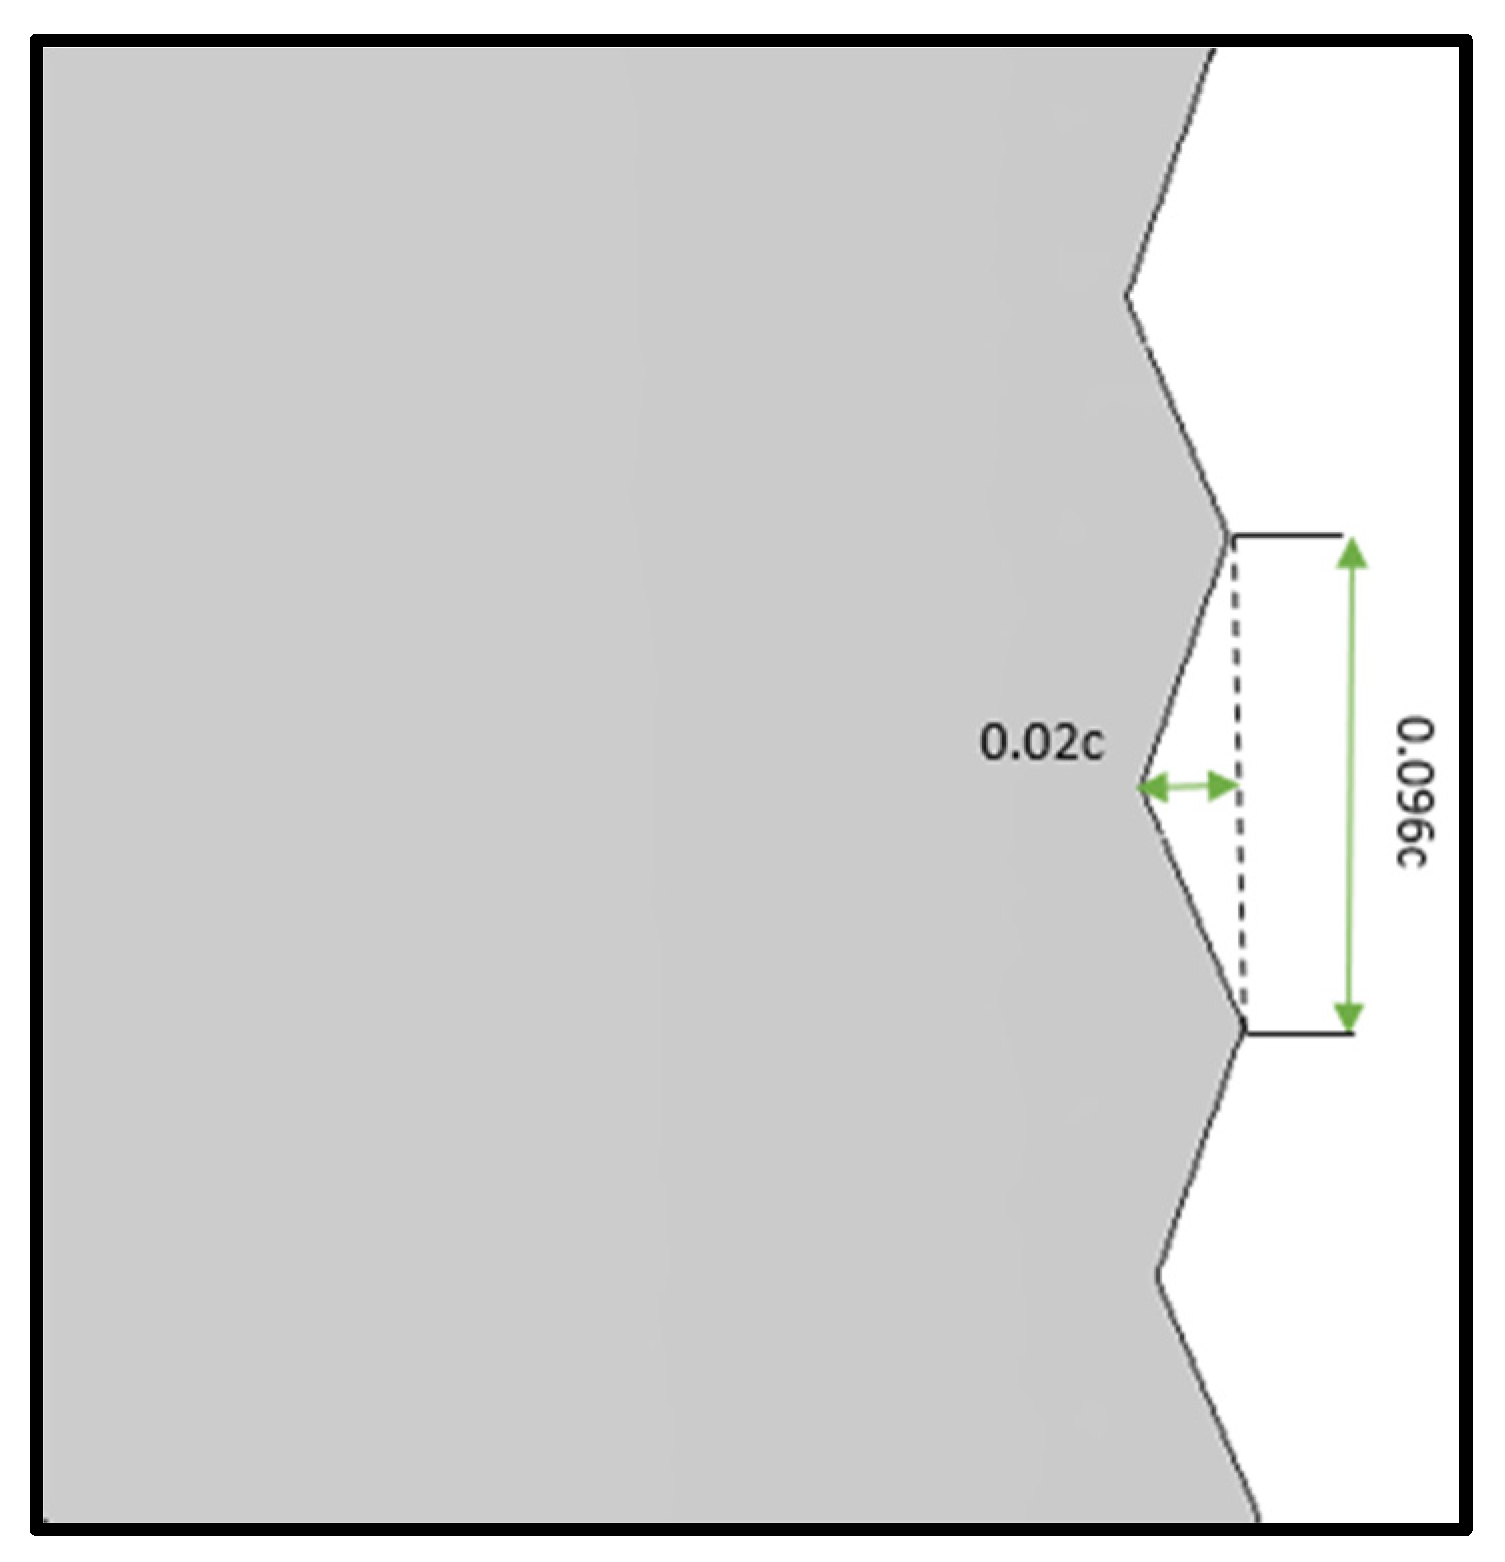
2.4. Serrations Setup
The modified blade model corresponds to a NACA 0015 airfoil, with chord length of c = 0.125 m and a span of L = 0.100 m. The NACA 0015 blade’s profile was designed in the x-axis and y-axis, then extruded in the z-axis direction. The serrations were made by cutting triangular patterns on the Trailing Edge (TE) with assigned parameters. For our serration parameters, we have considered the existing modeling criterion for noise attenuation, even though we are primarily investigating the aerodynamic characteristics of the serrated trailing edges.
At a Strouhal number of
noise reduction occurs in the low-frequency region when
. On the other hand, noise can increase when
reguardless of angle of attack and mean flow velocity [
33]. Furthermore, according to Das et al. [
25] a Wells turbine normally operates at a reduced frequency in the order of 10
−3, which makes it fall under the condition of
1. However, Gruber et al. [
33] have considered critical values of either
or
, beyond which significant noise reduction can occur. Our assigned serration depth,
and width is
(See
Figure 8). By the assigned dimensions; therefore, our serration pattern can meet the noise attenuation condition of:
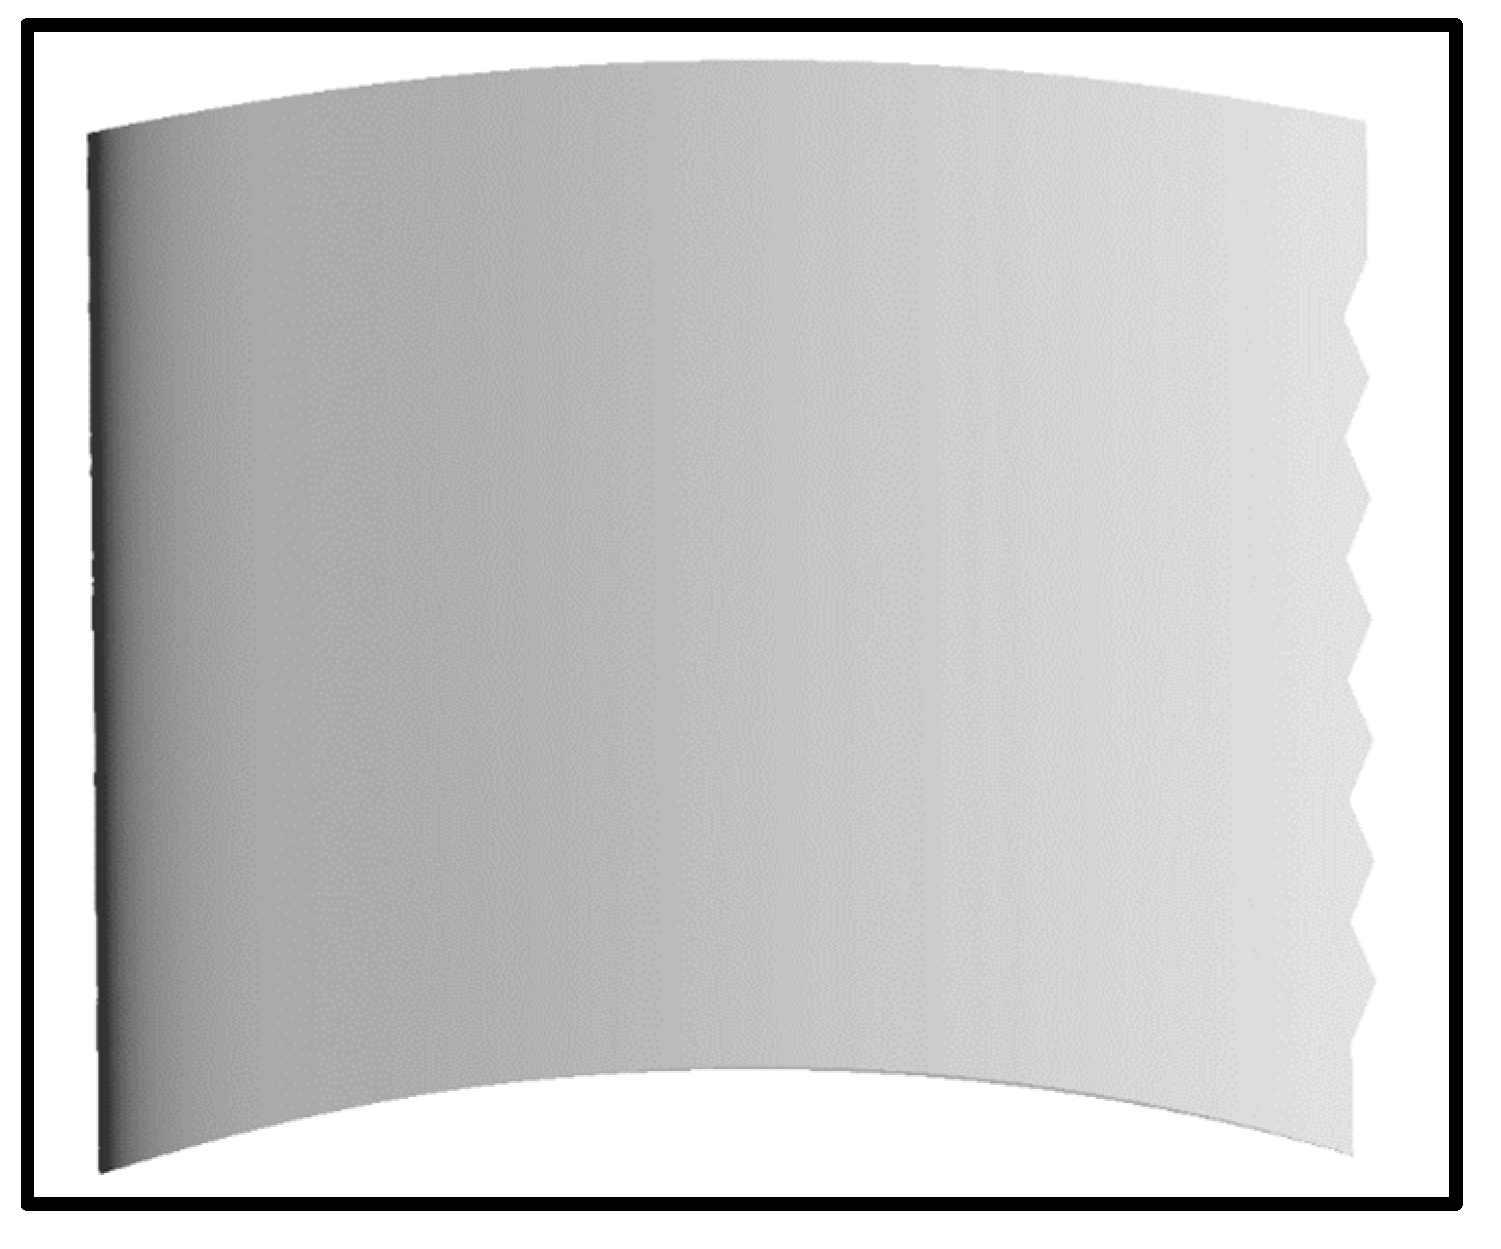
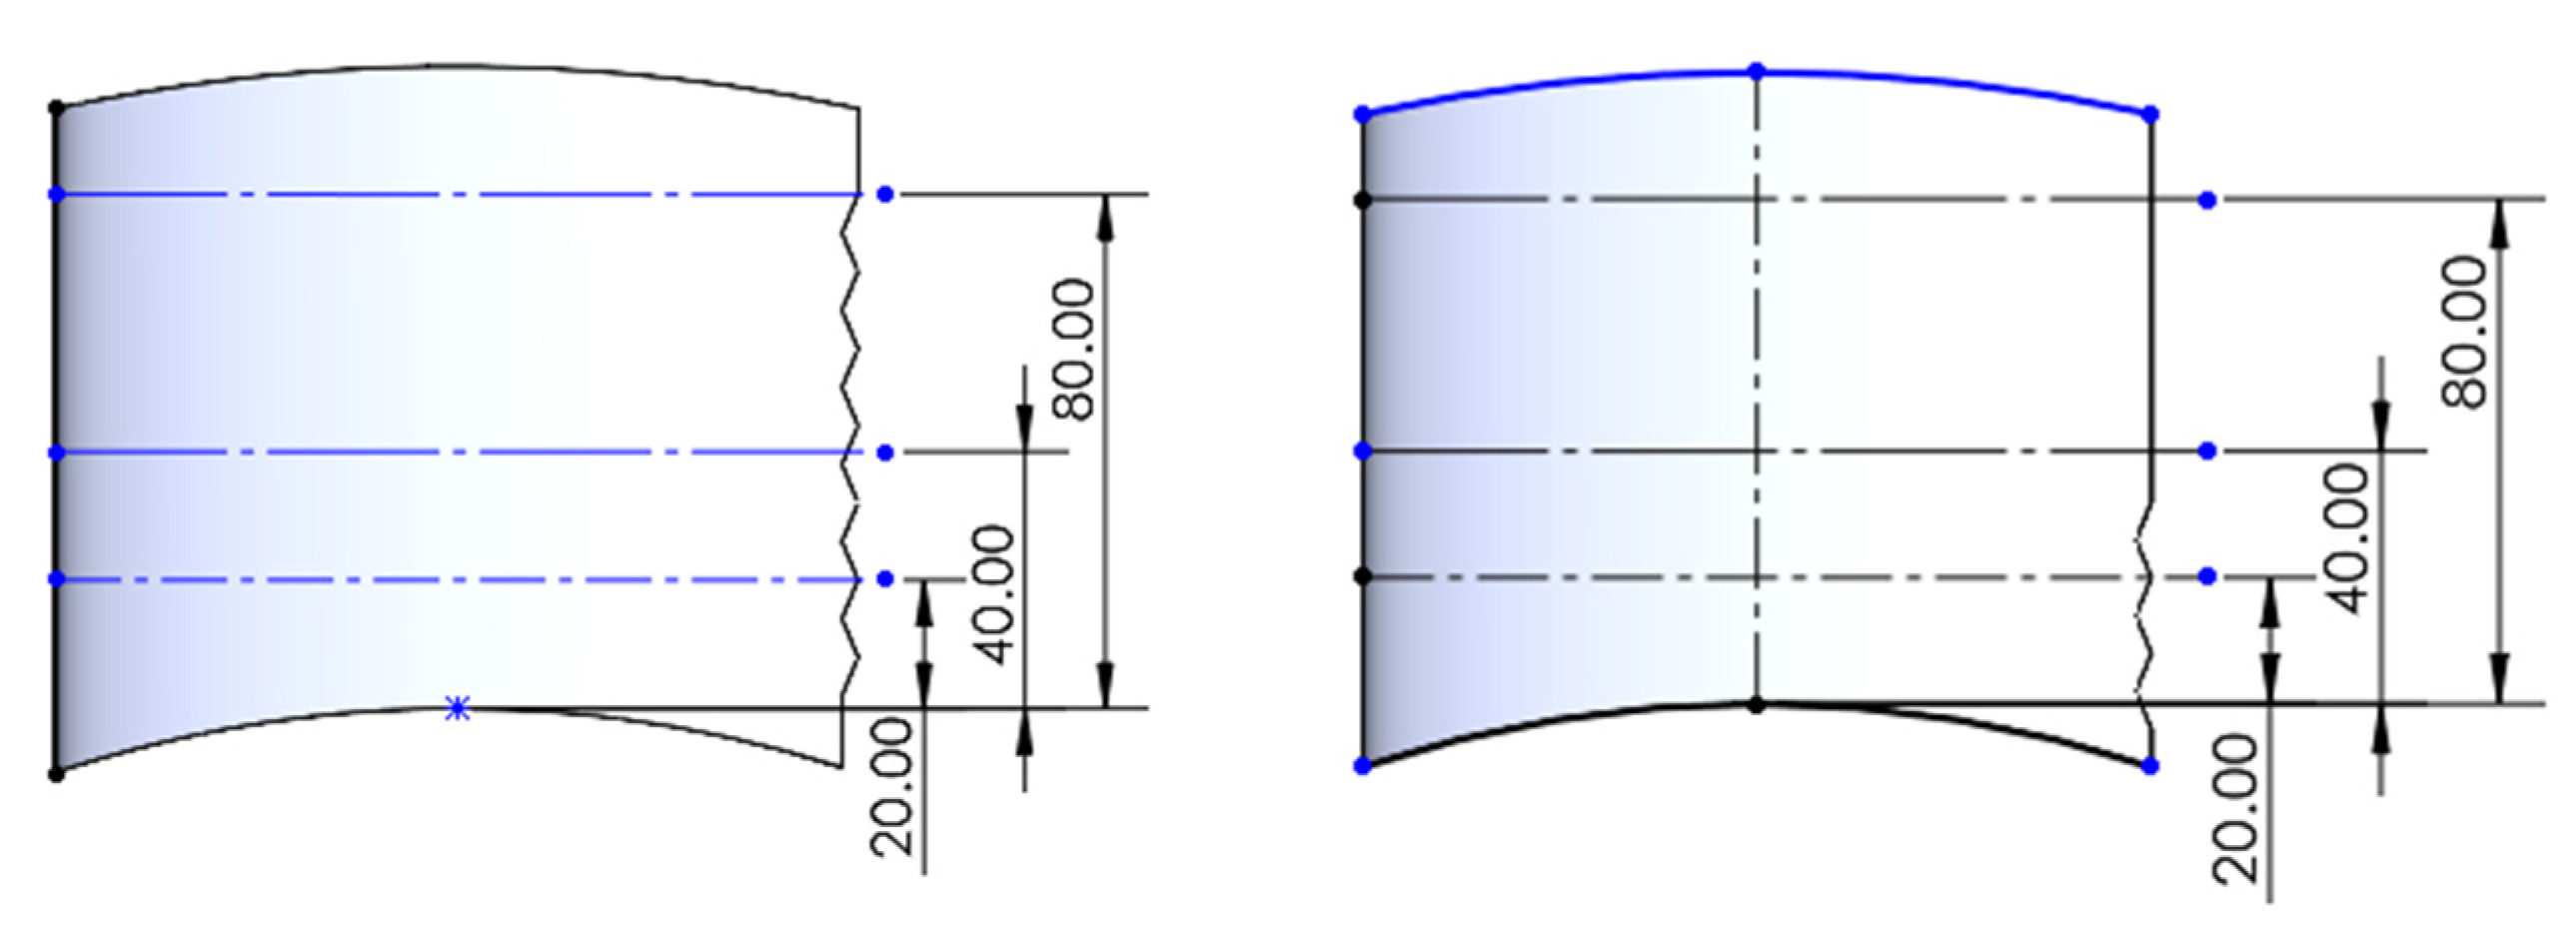
To obtain an optimal design of the TE serration. The first model consisted of a fully serrated trailing edge (FSTE), shown in
Figure 9.
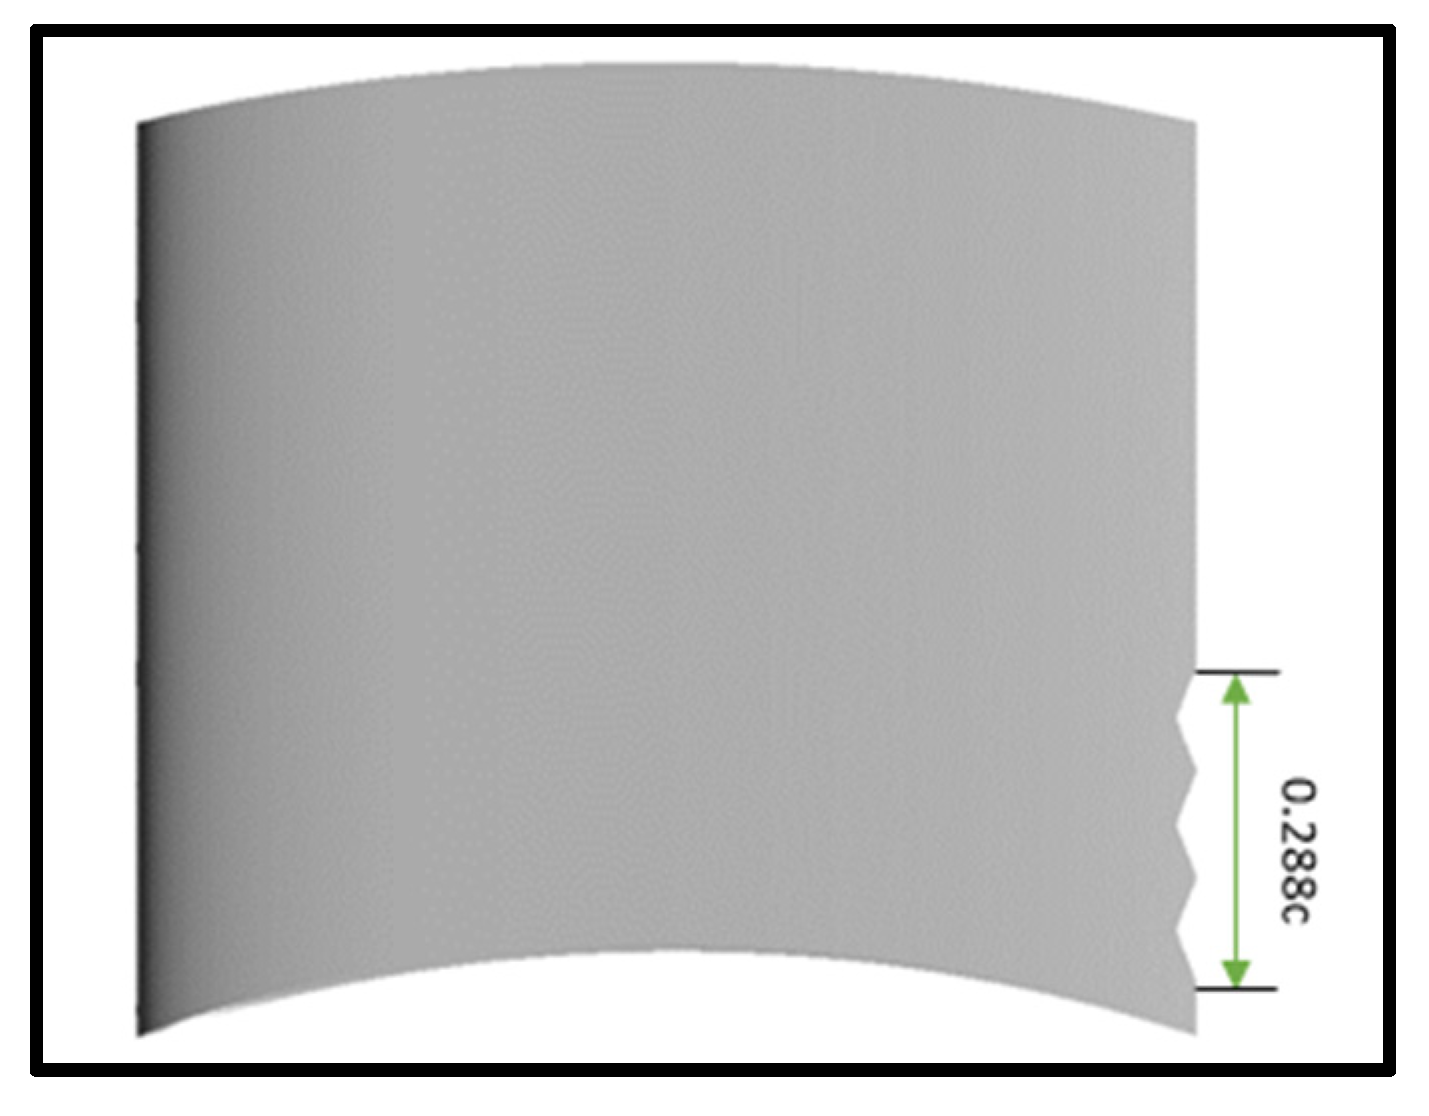
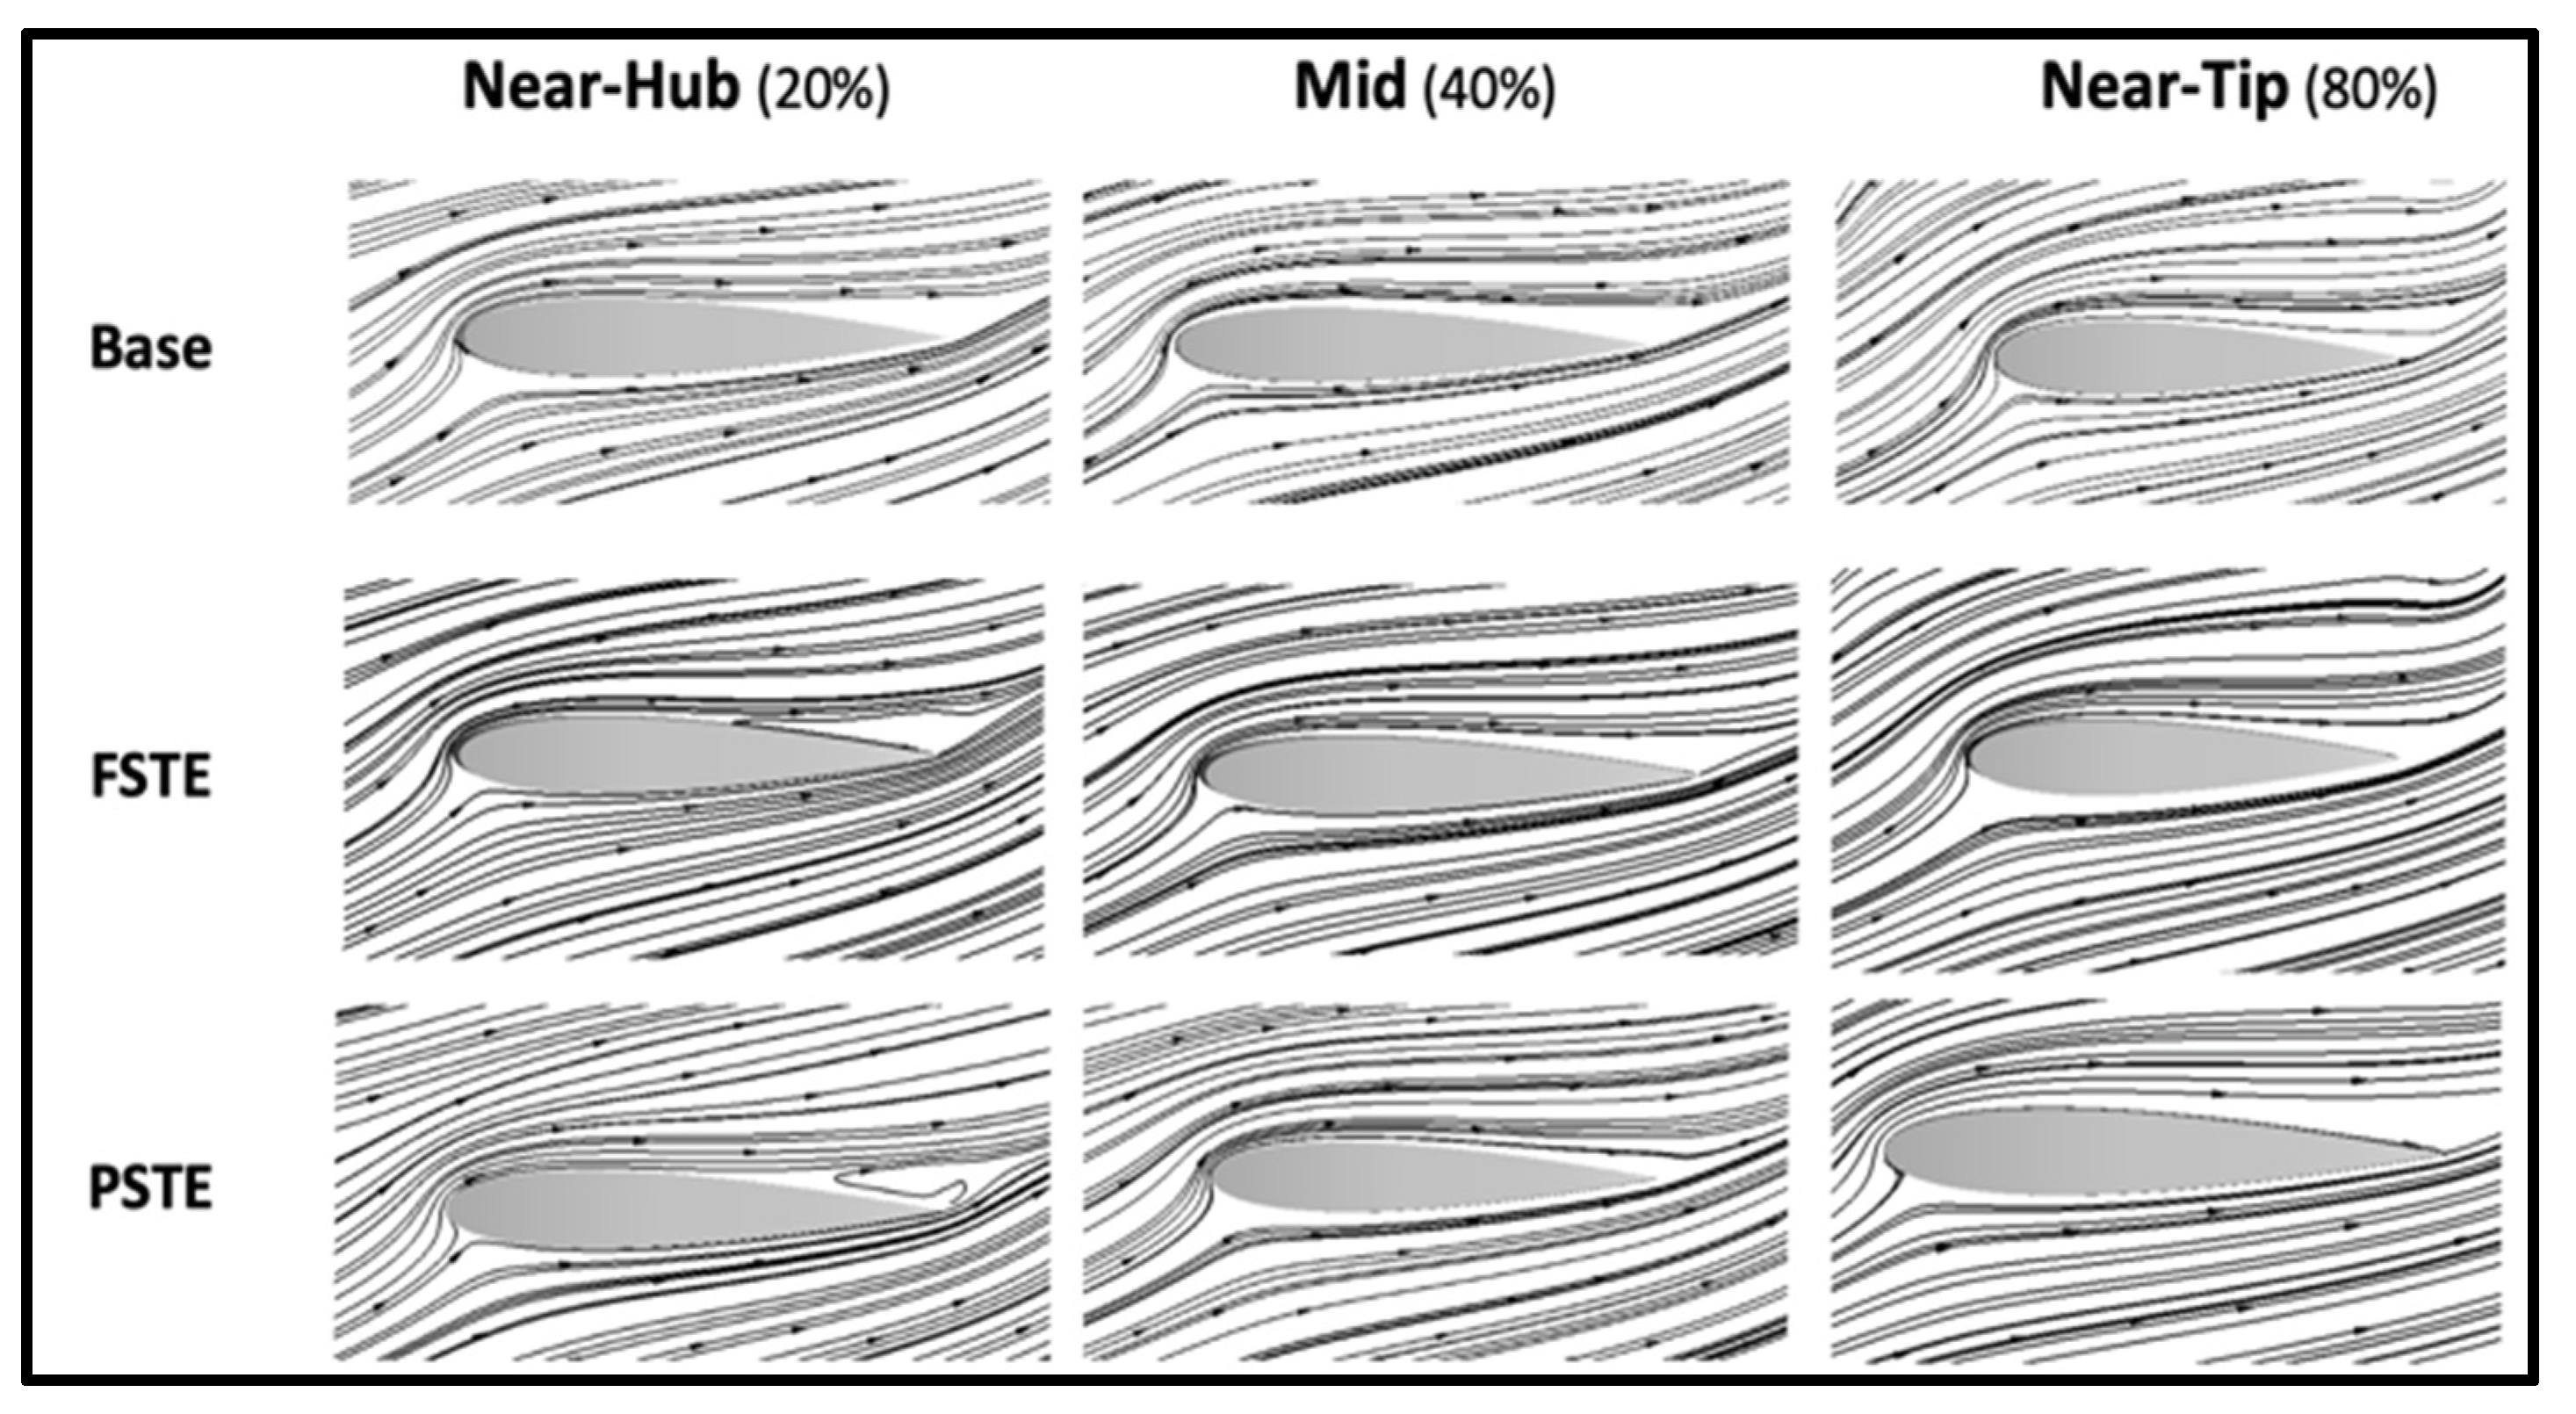
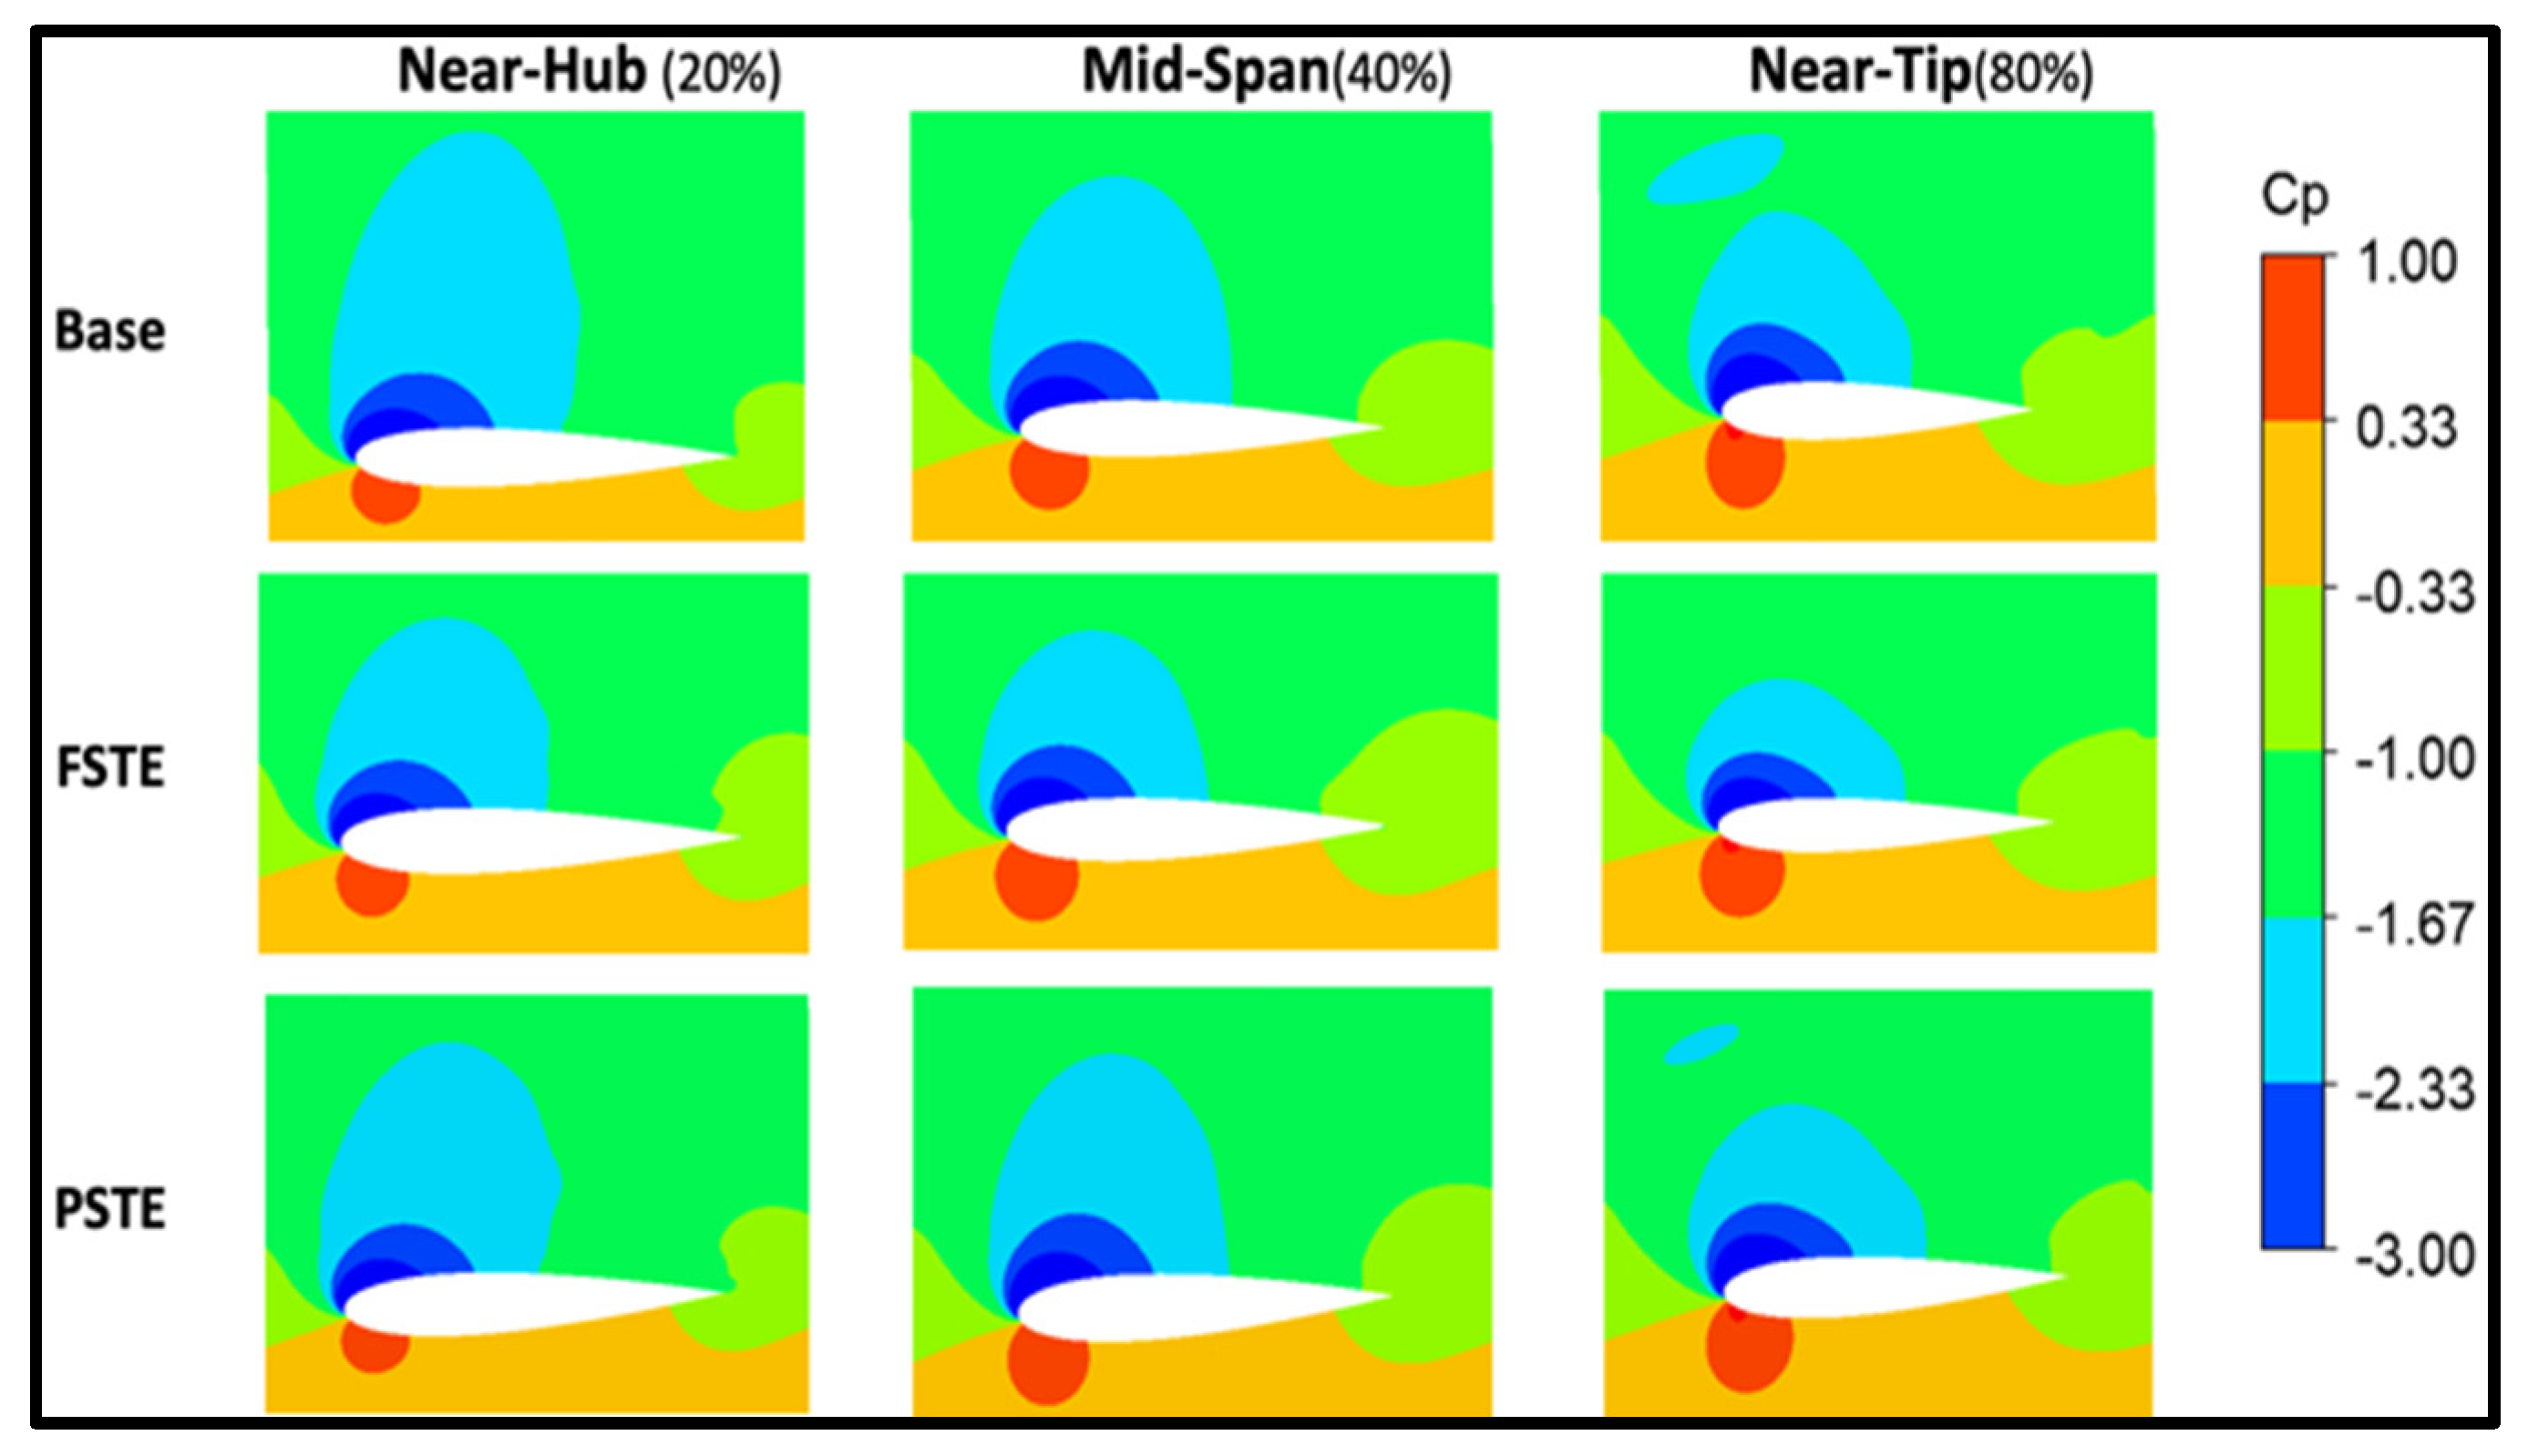
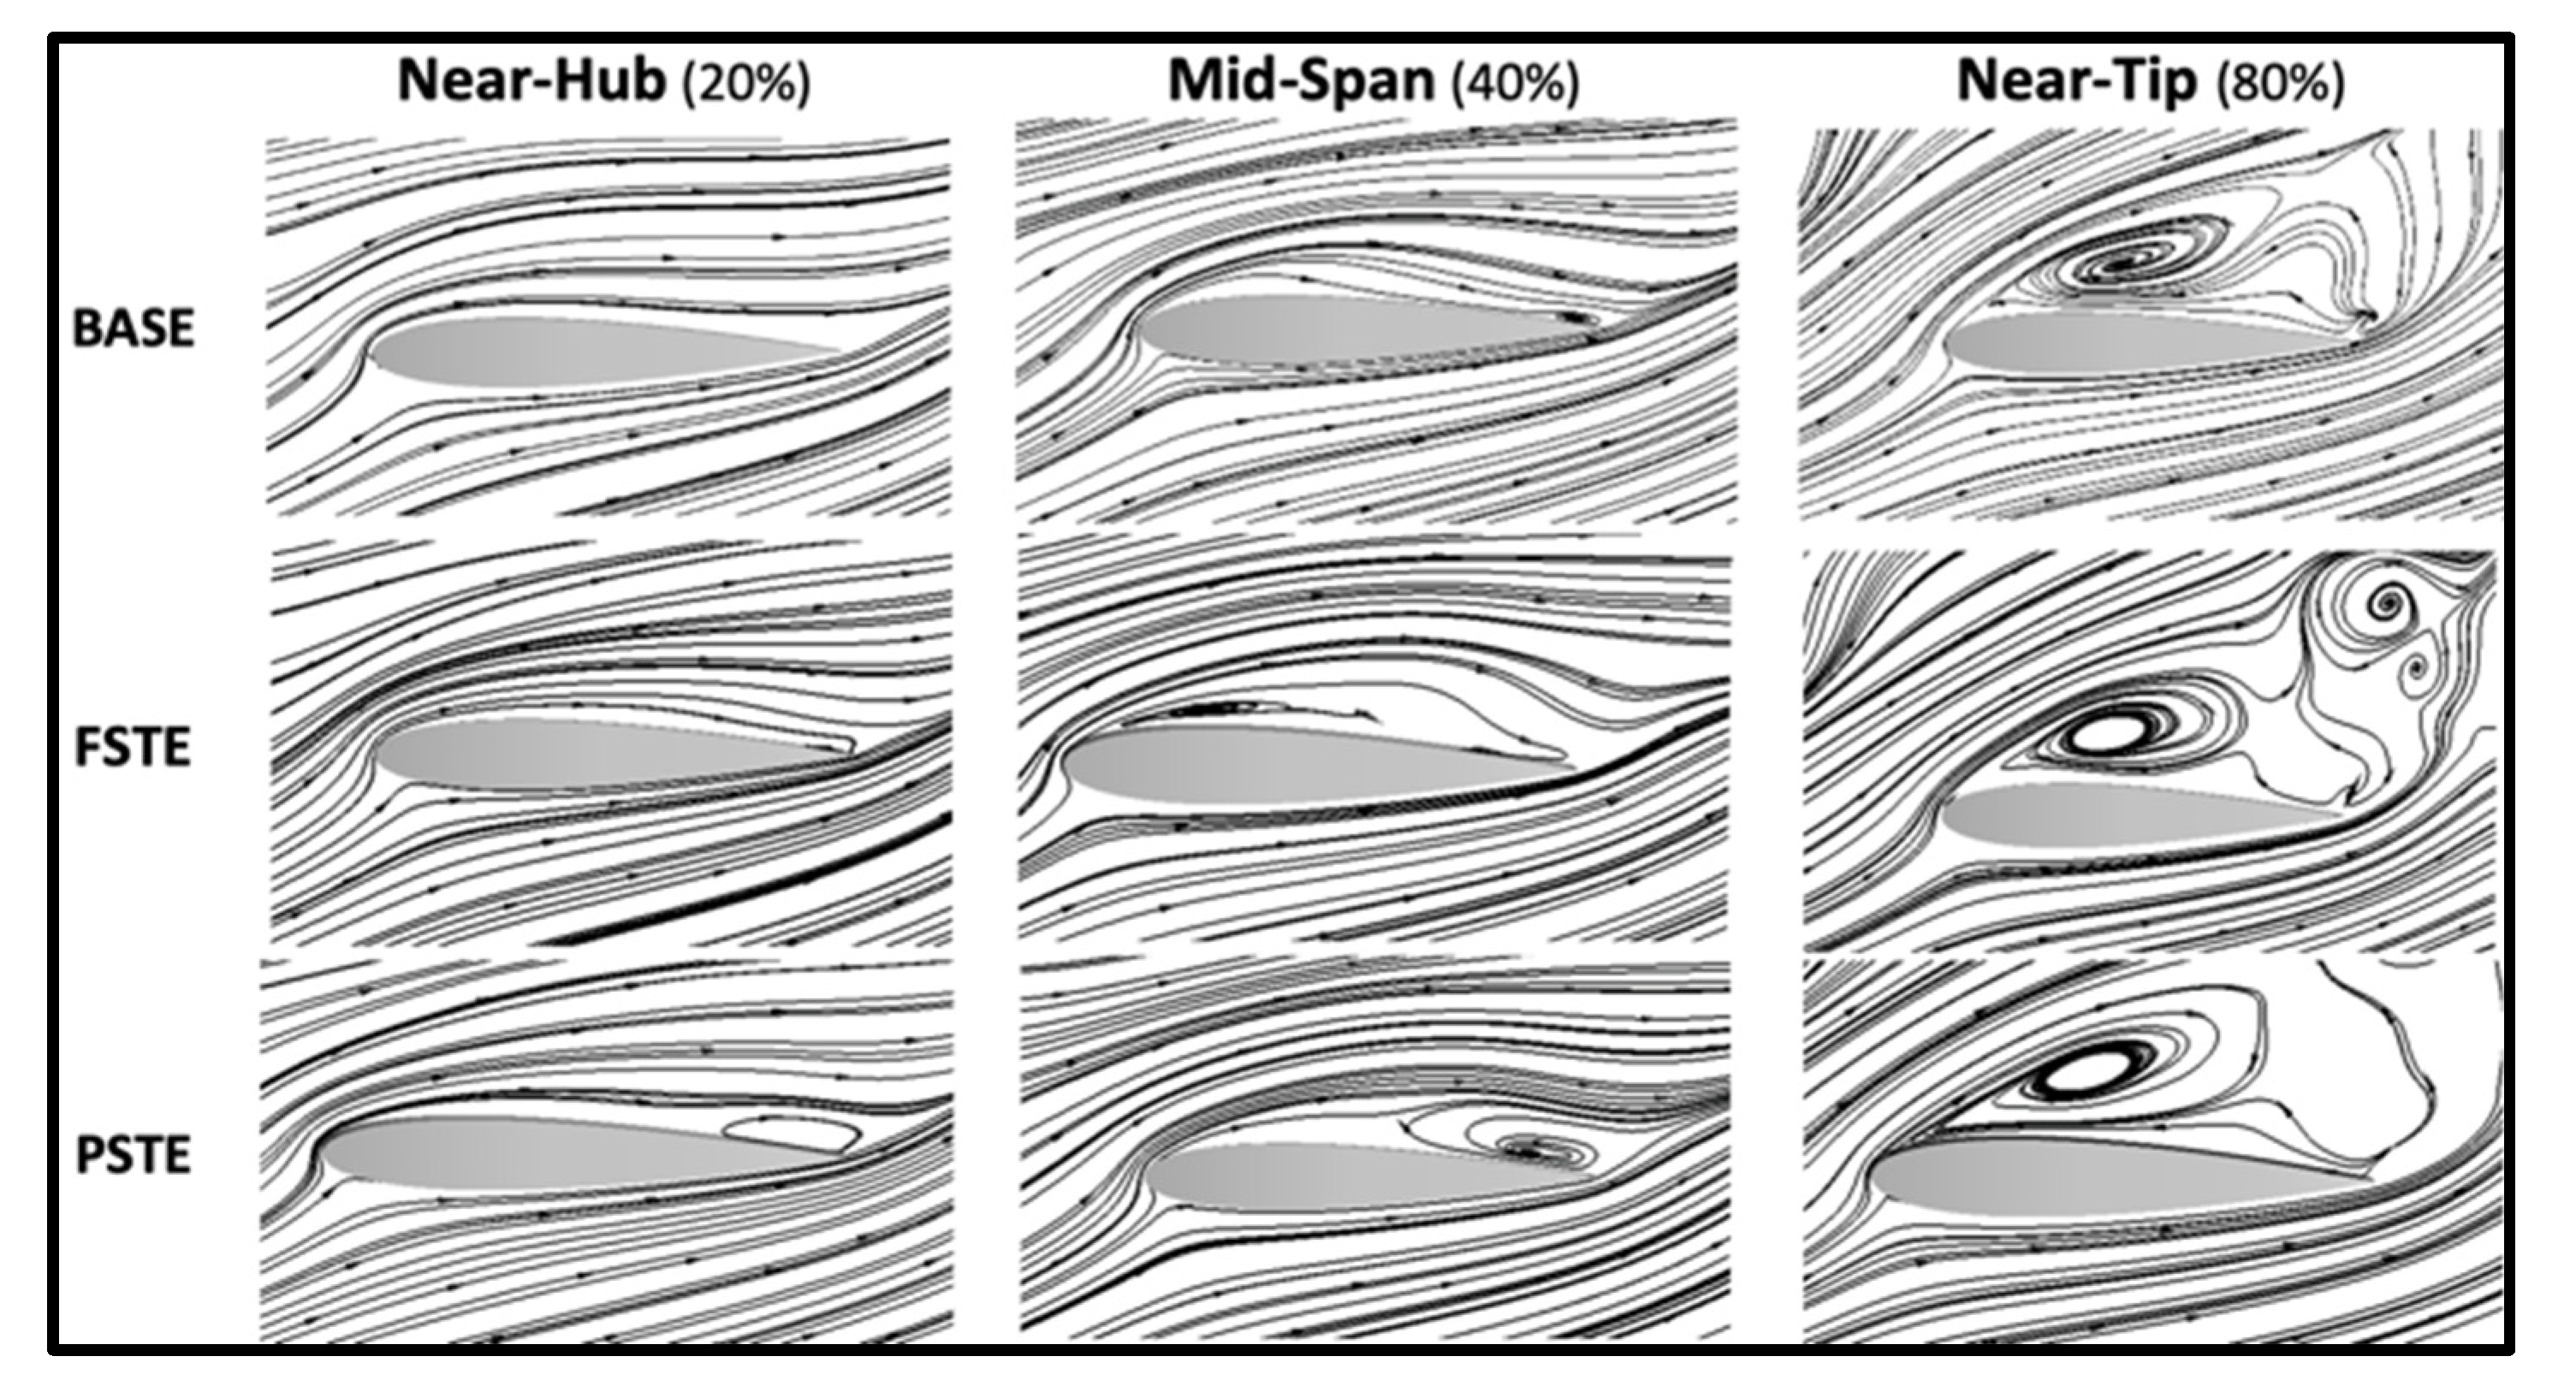
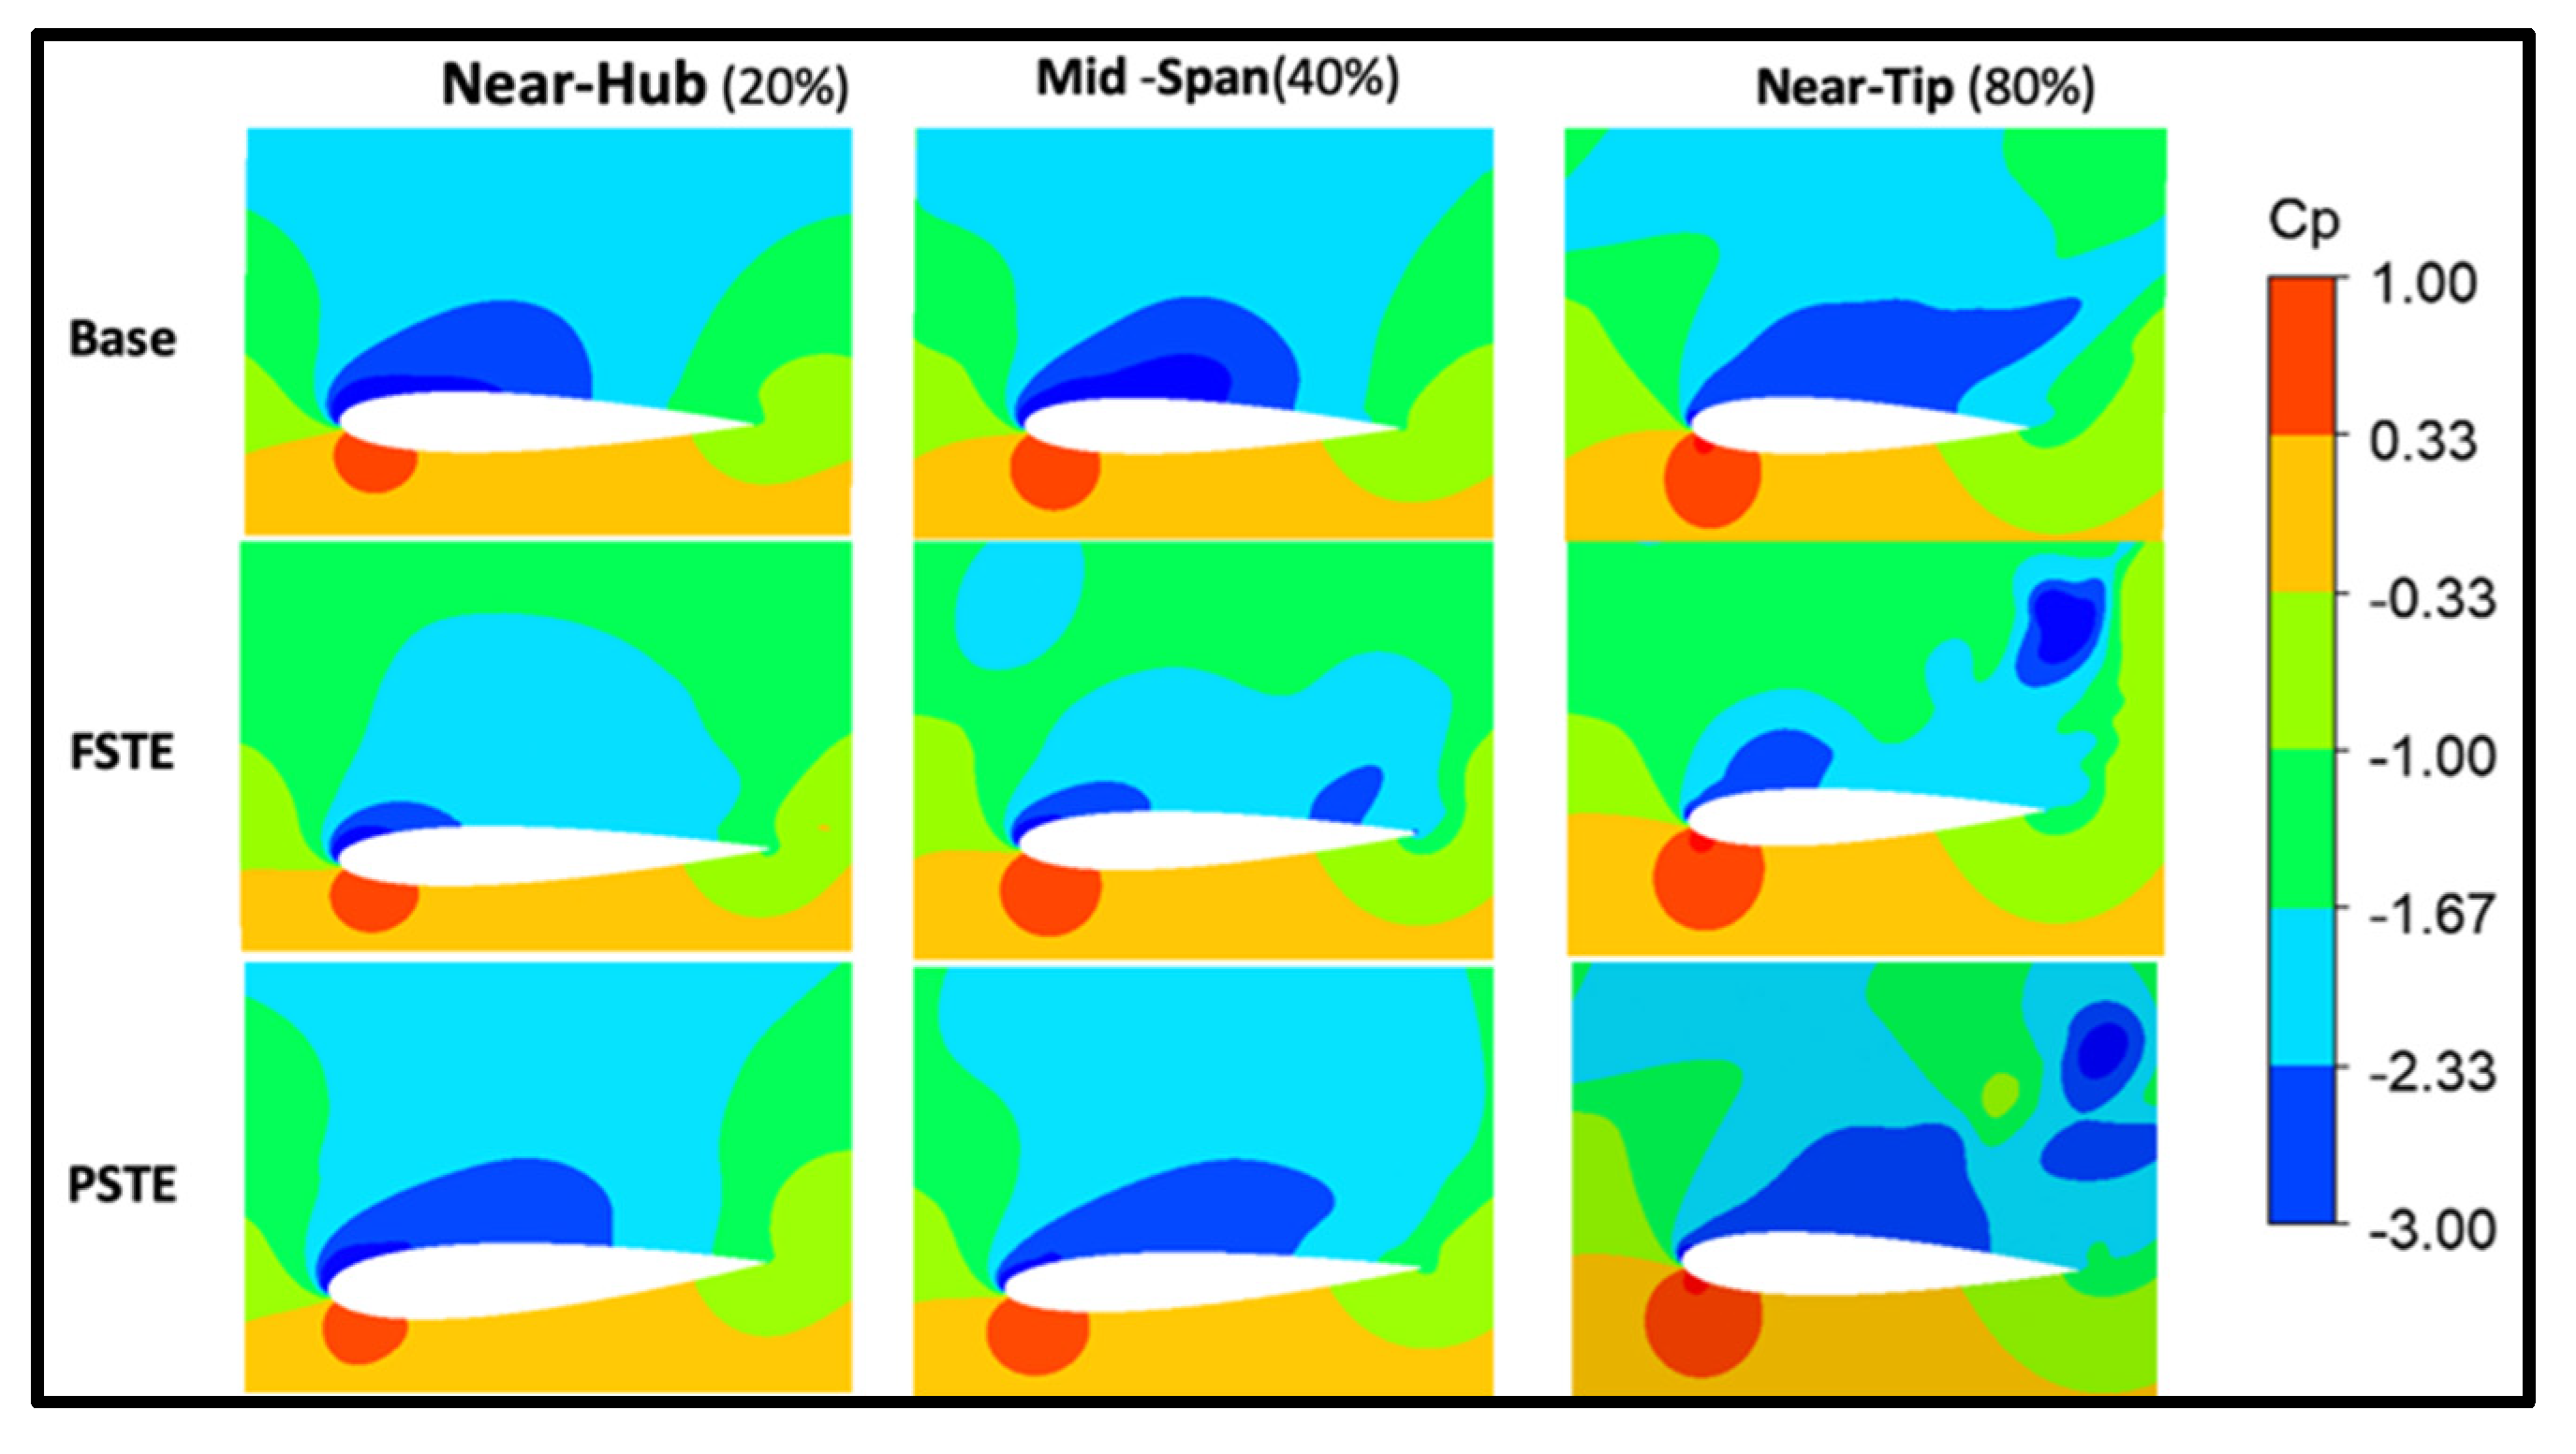
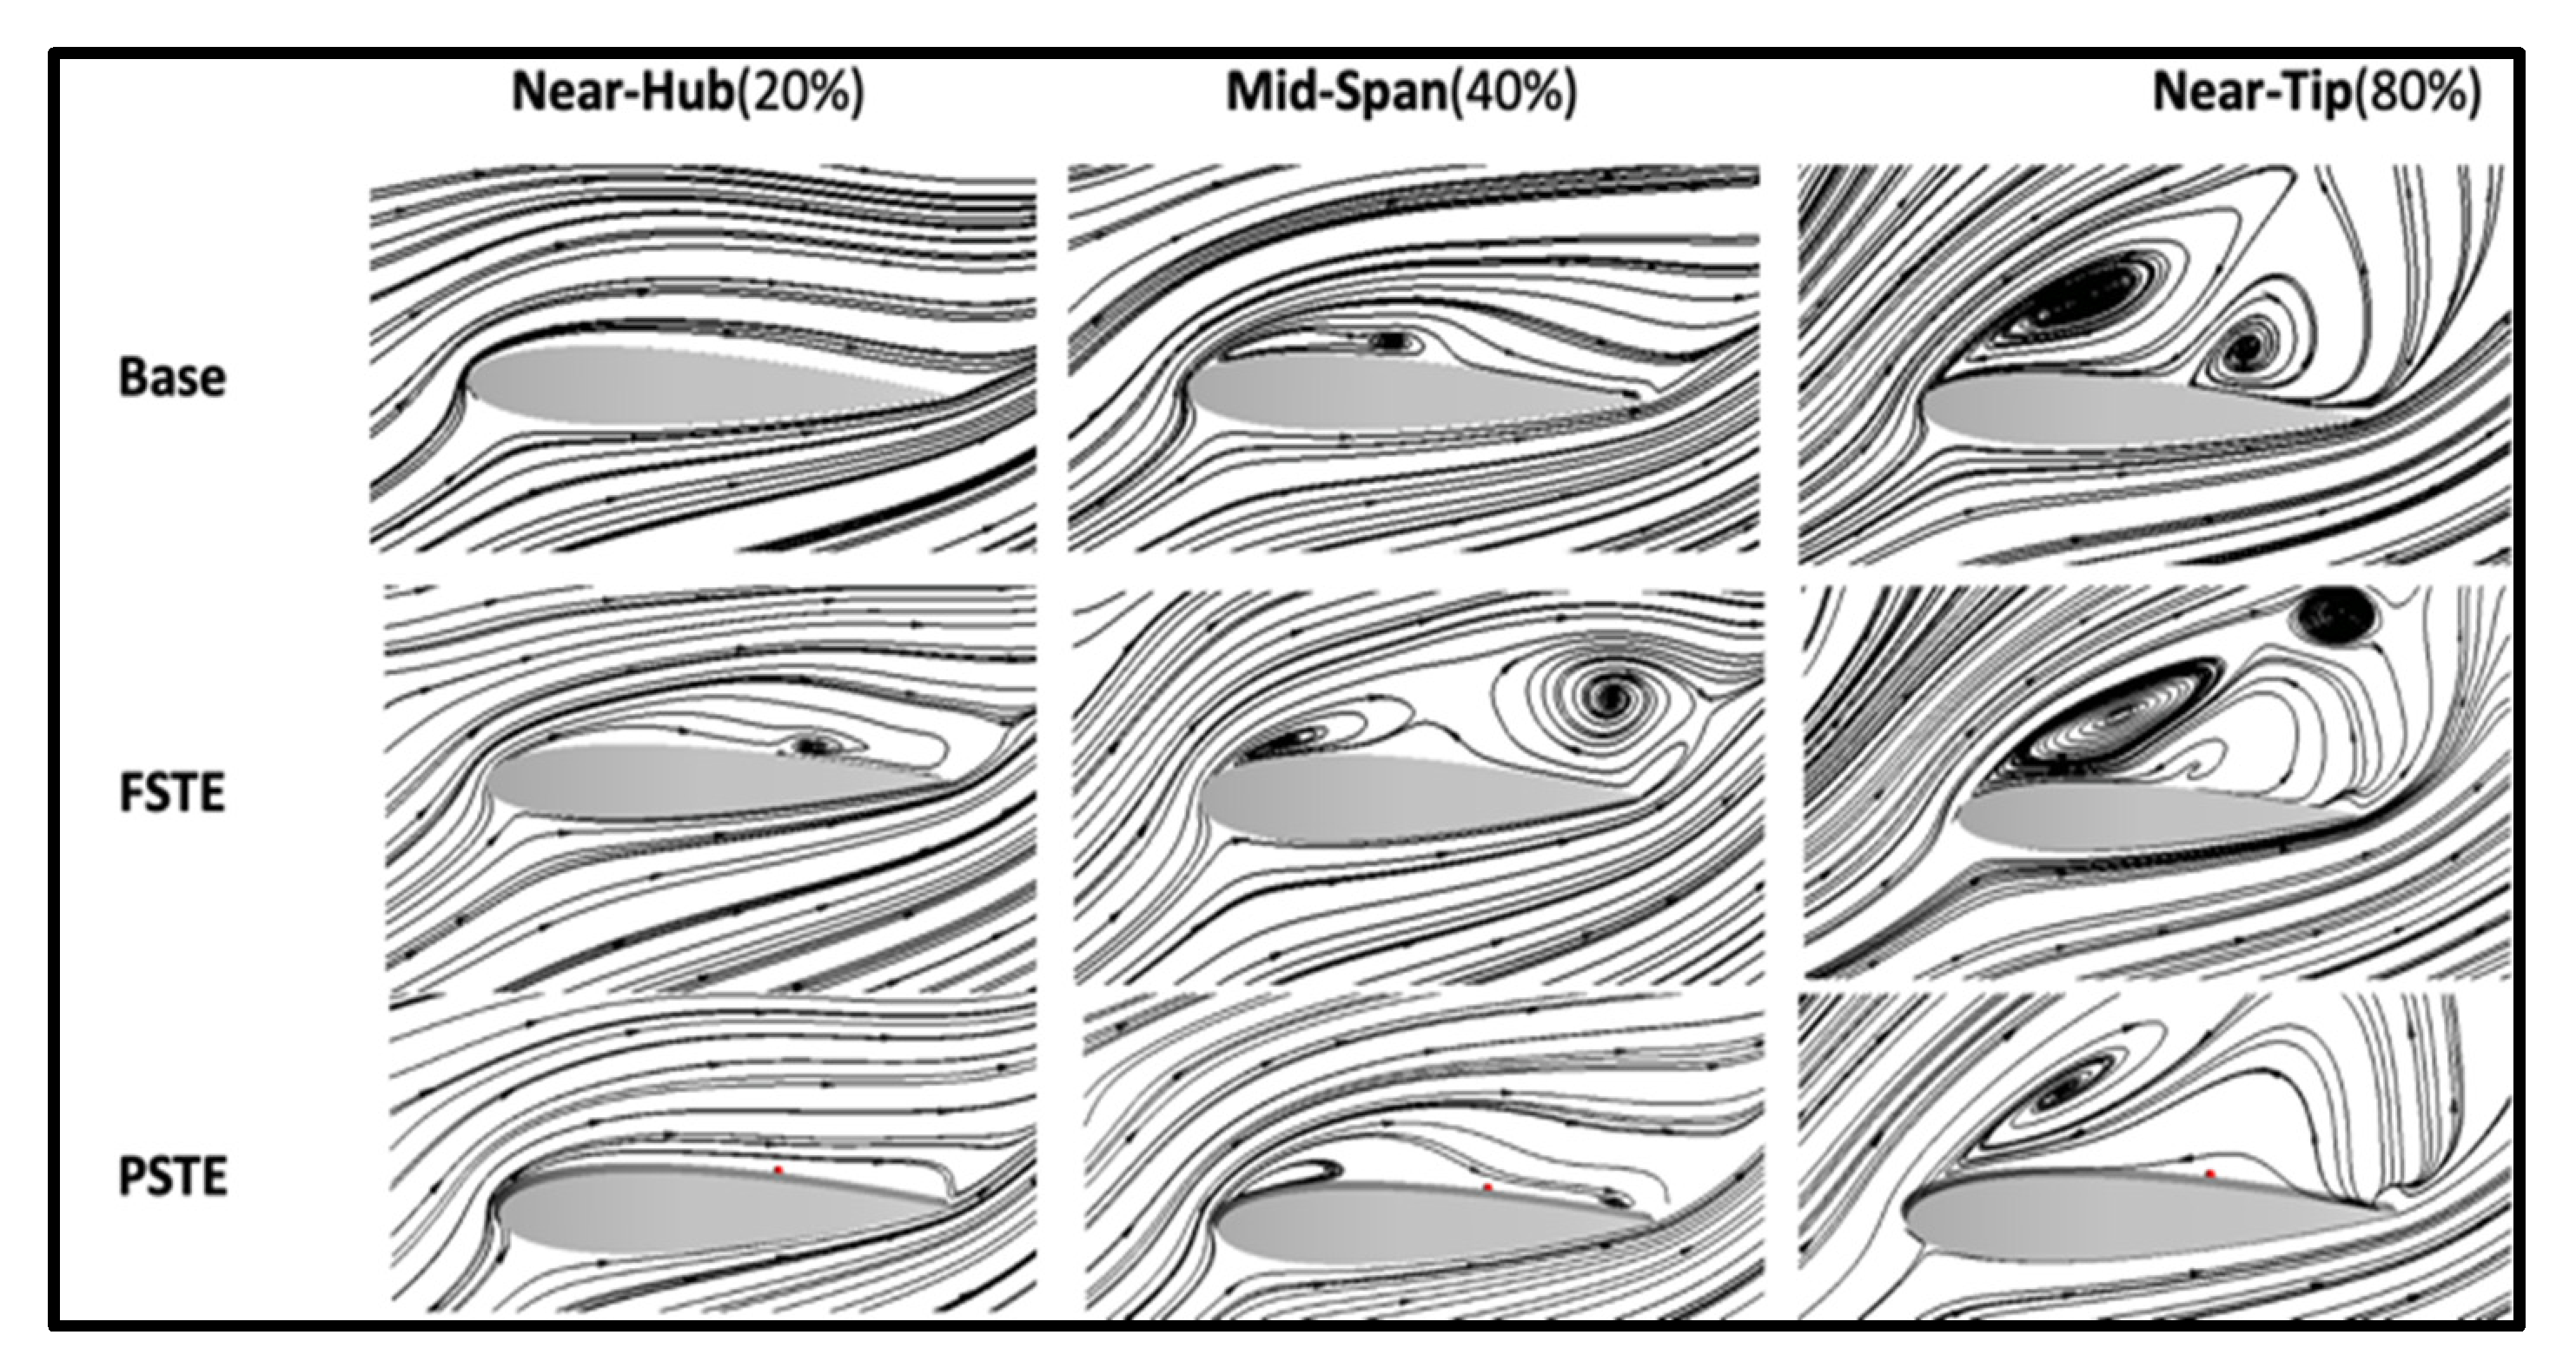
While observing the baseline turbine flow field, through range of 0.075 ≤ ϕ ≤ 0.275, it was observed that a small area of recirculation region begins in near hub location of the span. Therefore, we designed a second model which is a partially serrated trailing edge (PSTE), where the serration pattern covers 0.288c (
) of the trailing edge as shown in
Figure 10. Since, the serrations attenuate the noise level by mitigating the vortex shedding at the trailing edge we introduced the partial trailing edge serrations close to hub [
34].
After creating the serration models, the meshes were generated using ANSYS meshing by specifying same criterion as the baseline model face sizing and inflation layers. In addition, the boundary conditions remain constant for all three models.
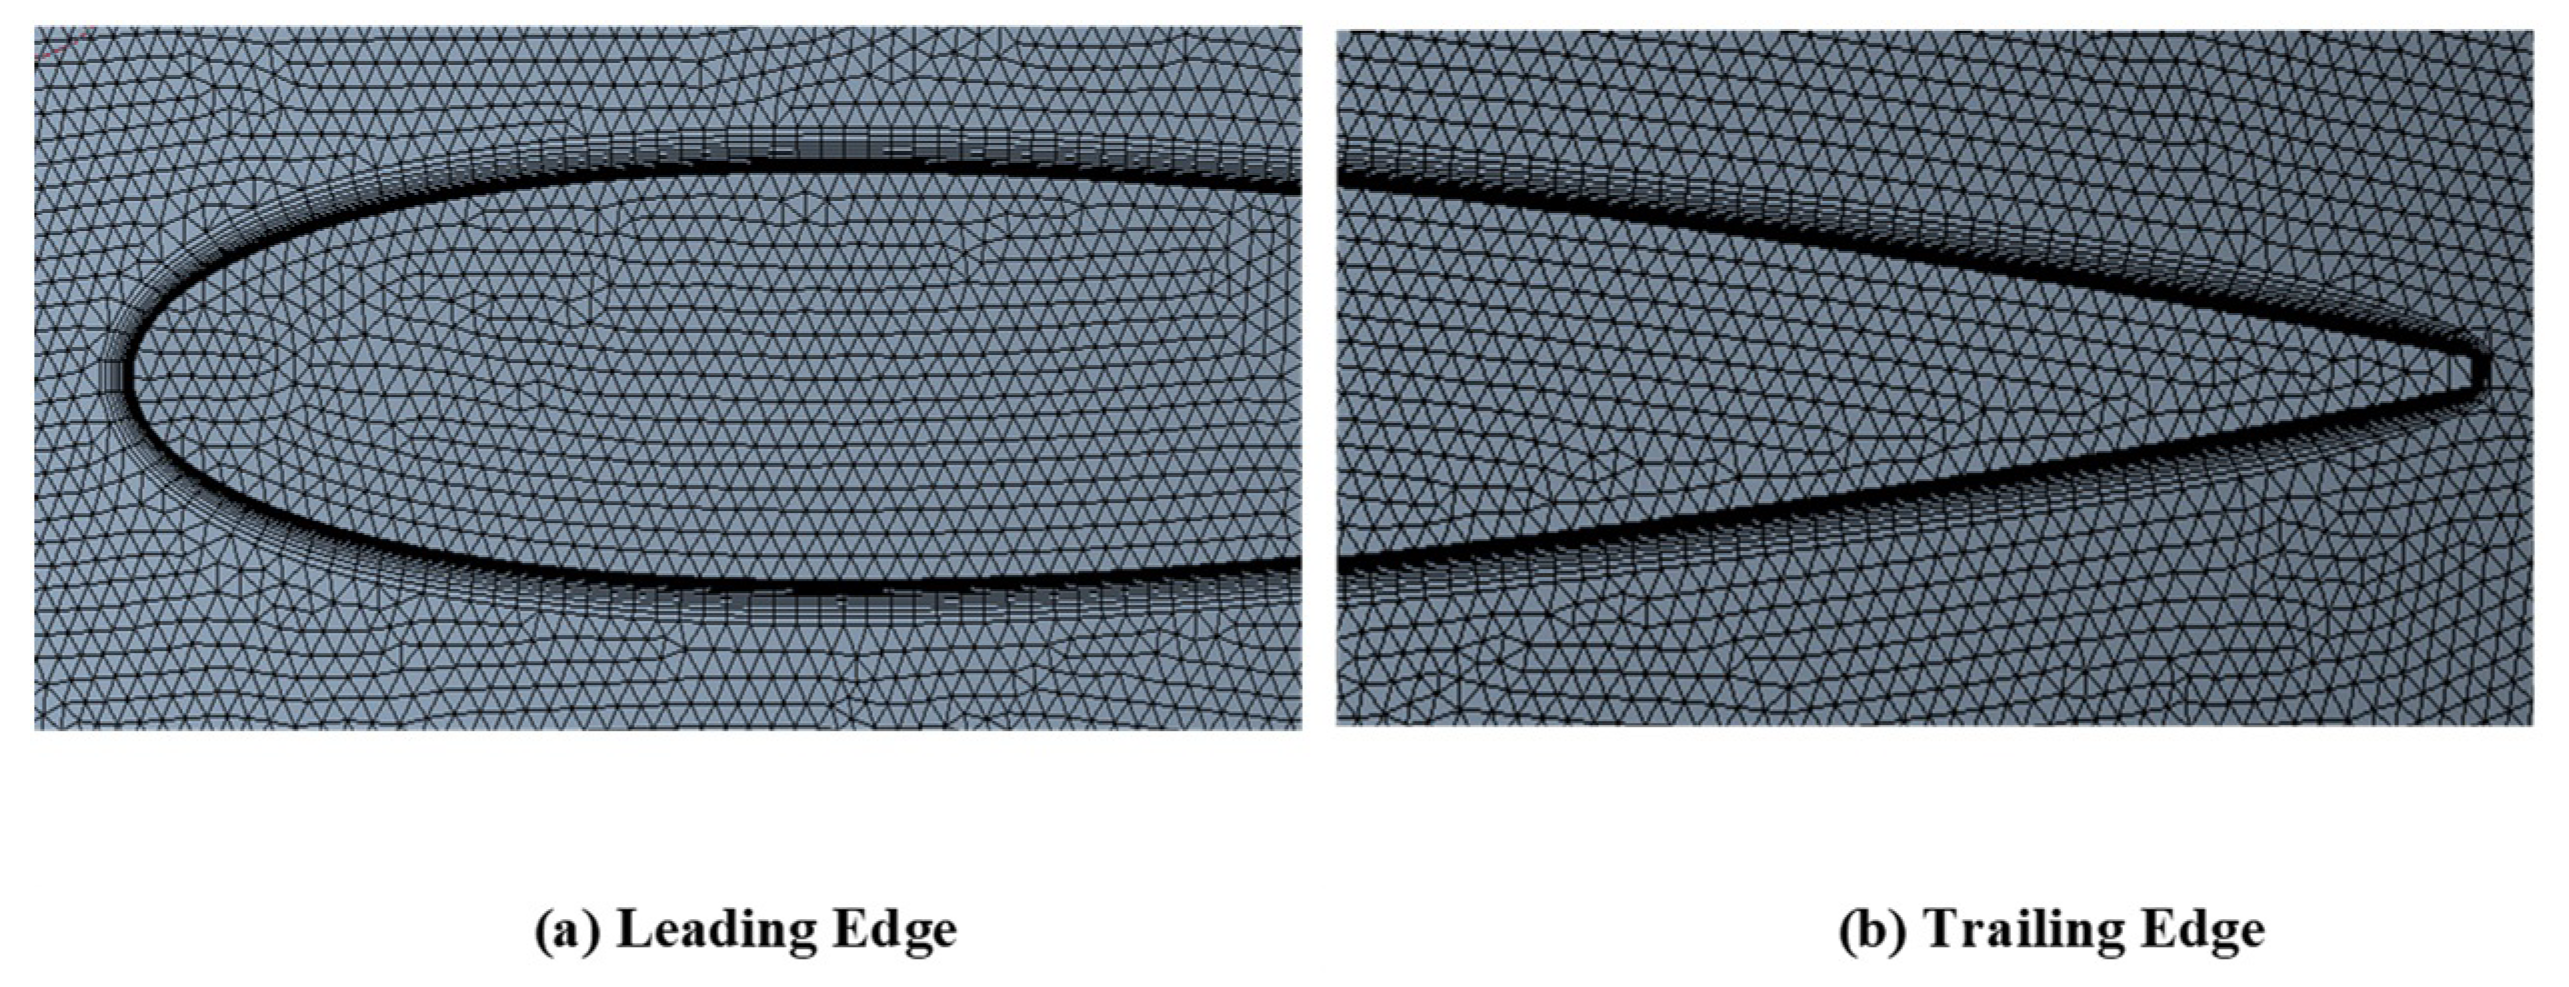
Figure 11 show the final meshing results for the fully serrated blade model.
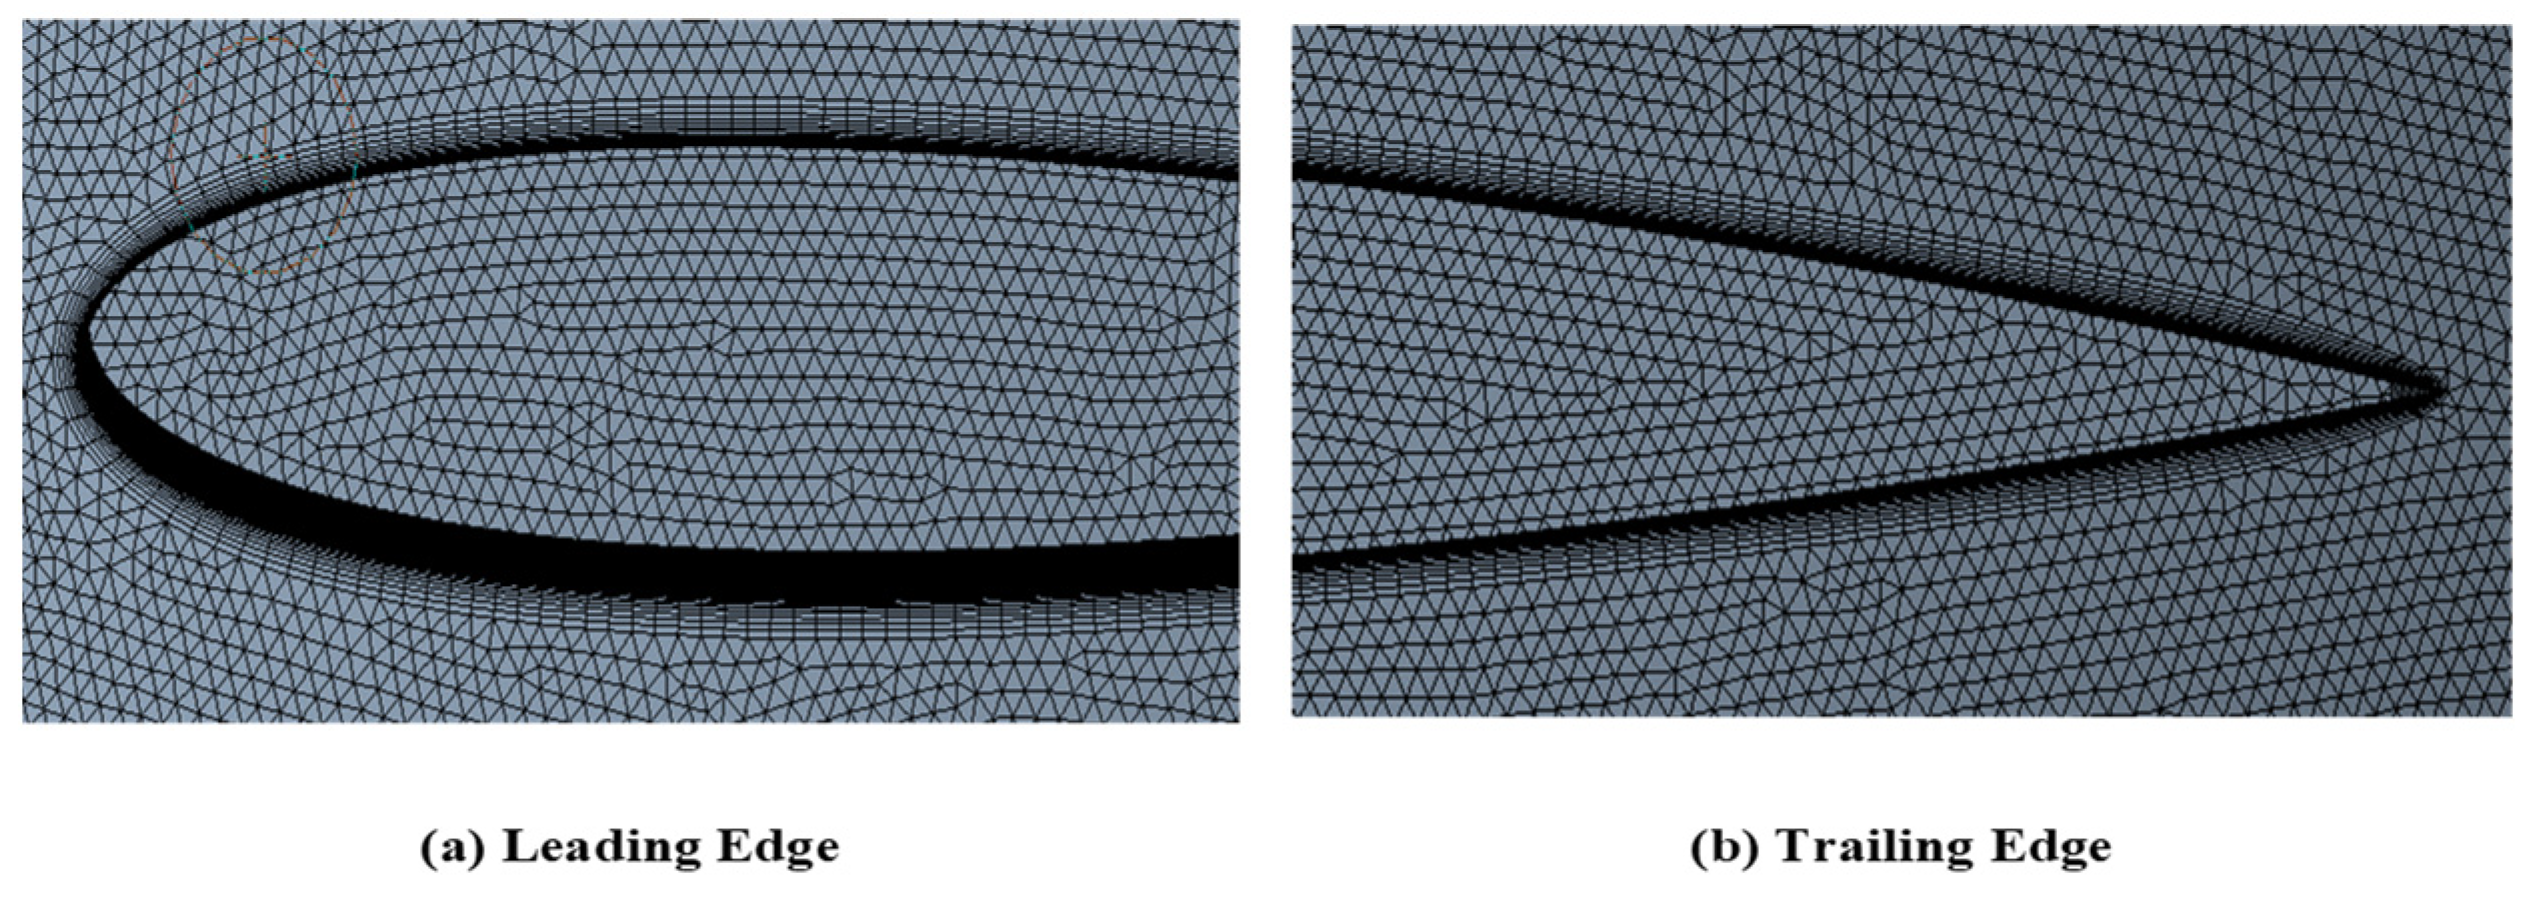
Figure 12 shows the generated mesh around the partially serrated trailing edge.
Figure 11.
ANSYS Meshing Generated Around the Fully Serrated Blade.
Figure 11.
ANSYS Meshing Generated Around the Fully Serrated Blade.
- 2.
Partially Serrated Trailing Edge:
Figure 12.
ANSYS Meshing Generated Around the Partially Serrated Blade.
Figure 12.
ANSYS Meshing Generated Around the Partially Serrated Blade.


