1. Introduction
Energy is an essential asset for the economic growth and social development of any country. The production system, the consumption of goods and services, the constant seeking for comfort, among other aspects of human existence, implies a continuous growth in energy demand worldwide. This growth, associated with the complexity of producing, storing, transporting, converting, and commercializing energy, results in a huge challenge for public managers. Therefore, energy data and models are essential in planning the strategic guidelines of the sector in order to guarantee secure supply, quality, efficiency, and reasonable tariffs, among many other aspects. For example, the role that the access or lack of access to energy can produce in indicators related to poverty reduction in a society is evident. Additionally, from a sustainability standpoint, it is necessary to consider the externalities of the different production chains that compose the energy industry [
1]. The impacts that involve the entire life cycle in each of the sector’s chains must be computed and, in some cases, it must be considered the process of decommissioning and proper disposal of possible residues and waste.
Under these circumstances, the United Nations General Assembly included a specific goal when establishing an agreement in 2015 on 17 Challengers for the year 2030, called Sustainable Development Goals (SDG). SDG 7 specifically deals with the need to guarantee the security of clean and affordable energy, while also ensuring access to low-cost, reliable, sustainable and renewable energy for everyone [
1,
2].
This brief discussion has shown the relevance of energy statistics. In other words, it is energy data and information that constitute a powerful management instrument for allowing diagnoses, insights into the challenges of maintaining a quality, regular and reliable supply, promoting sustainability, as well as economic and social development. Additionally, it is because of this that one can consider that there are many, directly or indirectly, interests in energy information and data under any of its aspects (economic, social and environmental). To name a few, the stakeholders are government entities, whether public policy planners, regulatory agencies, researchers, technology developers, international organizations, or market agents, such as investors, producers, traders, and consumers.
Accordingly, it is understood that the energy sector must provide accurate and reliable statistical data, which are published regularly and obtained with the appropriate methodology. Energy data are generally collected independently across different commodities; however, energy products can be either used for their energy content or converted into one another through a number of transformation processes. Thus, there is a need to combine commodity balances and their use to get an overview of the energy system, i.e., the development of an energy balance [
3]. The energy balance (EB) is the most important and well-known publication in the sector that aims to disclosure the energy outlook. Corroborating, the United Nations Statistical Commission—UNSC—argues that the official system of energy statistics corresponds to a public good and that the responsible entities must guarantee access to this information [
4].
It is through publications such as the EB that information can be obtained on energy flows along the different production chains, giving an overview of production, conversion, import, export, and final consumption activities. The EB also provides a better understanding of the evolutionary process of segments through historical series, and hence to establish analysis of the past, of the present, as well as to infer about the future throughout projections [
3].
Brazil has more than half a century of publication of the national energy balance (NEB) and many federative units (FUs) also elaborate a similar report under the name of state energy balance (SEB). However, rare cases of annually released SEB publications have been noted. The reasons for the non-existence of these publications might be a combination of factors, for instance, lack of resources, lack of adequate institutional space, and the complexity surrounding the topic, in addition to the lack of qualified professionals. At this point, it is worthwhile to highlight that, in Brazil, the concessions in the electricity, oil and natural gas sectors, as well as economic and tariff regulation, are under the responsibility of the federative entity. Nonetheless, such circumstances do not imply the impossibility of the FUs acting in the development of the sector, especially concerning distributed generation (DG) thermoelectricity by biomass, production of biofuels, biogas, geothermal and photovoltaic generation [
5].
On the other hand, the elaboration and implementation of consistent regional public policies for the energy sector lack consistent energy statistics. Although NEB brings relevant information about the situation in the FUs, such references are not enough to detail each of the local realities, either due to the omission of specific data or the absence of a total disaggregation. For example, through the NEB, it is not possible to assess the level of the energy dependence of each of the FUs.
In the current state of the art, there are different types of energy models, such as energy planning models, forecasting models, renewable energy models, and emission reduction models as well as computer tools that can be used by public/private managers to evaluate different scenarios and make a decision [
6]. However, the energy balance is the primary accounting framework of energy and is the basis of energy statistics used to obtain data to run a more specific energy model. Therefore, considering the situation of the FUs in Brazil related to the elaboration of state-level energy statistics (SEBs), this work is focused on presenting a state energy balance model in line with the best international practices. The proposed model has been implemented in a user-friendly software, so non-specialist users can easily prepare and generate the energy balance report. The main contributions of this work are (i) to discuss the importance of energy balance and the problem of lack of information about energy statistics in many Brazilian states and (ii) to present a solution for such a problem by developing a tool that can be adopted by the Brazilian states to facilitate the periodical publication of the local energy balance. An annually released report aids the state government to discuss and formulate energy policies. In order to demonstrate the applicability of such a tool, the proposed software was successfully used by the authors in the elaboration of the SEB of Mato do Grosso do Sul state.
The following sections discuss the energy balance elaboration methodologies in Brazil and in other countries. Afterward, a comparative analysis between regional (FUs) and national energy balances is presented, considering international parameters as a reference. Likewise, it was compared the institutional apparatus available, as well as the existing energy policies in the analyzed federative units. The proposed system model is presented in
Section 5 and the main conclusions are drawn in
Section 6.
2. Materials and Methods
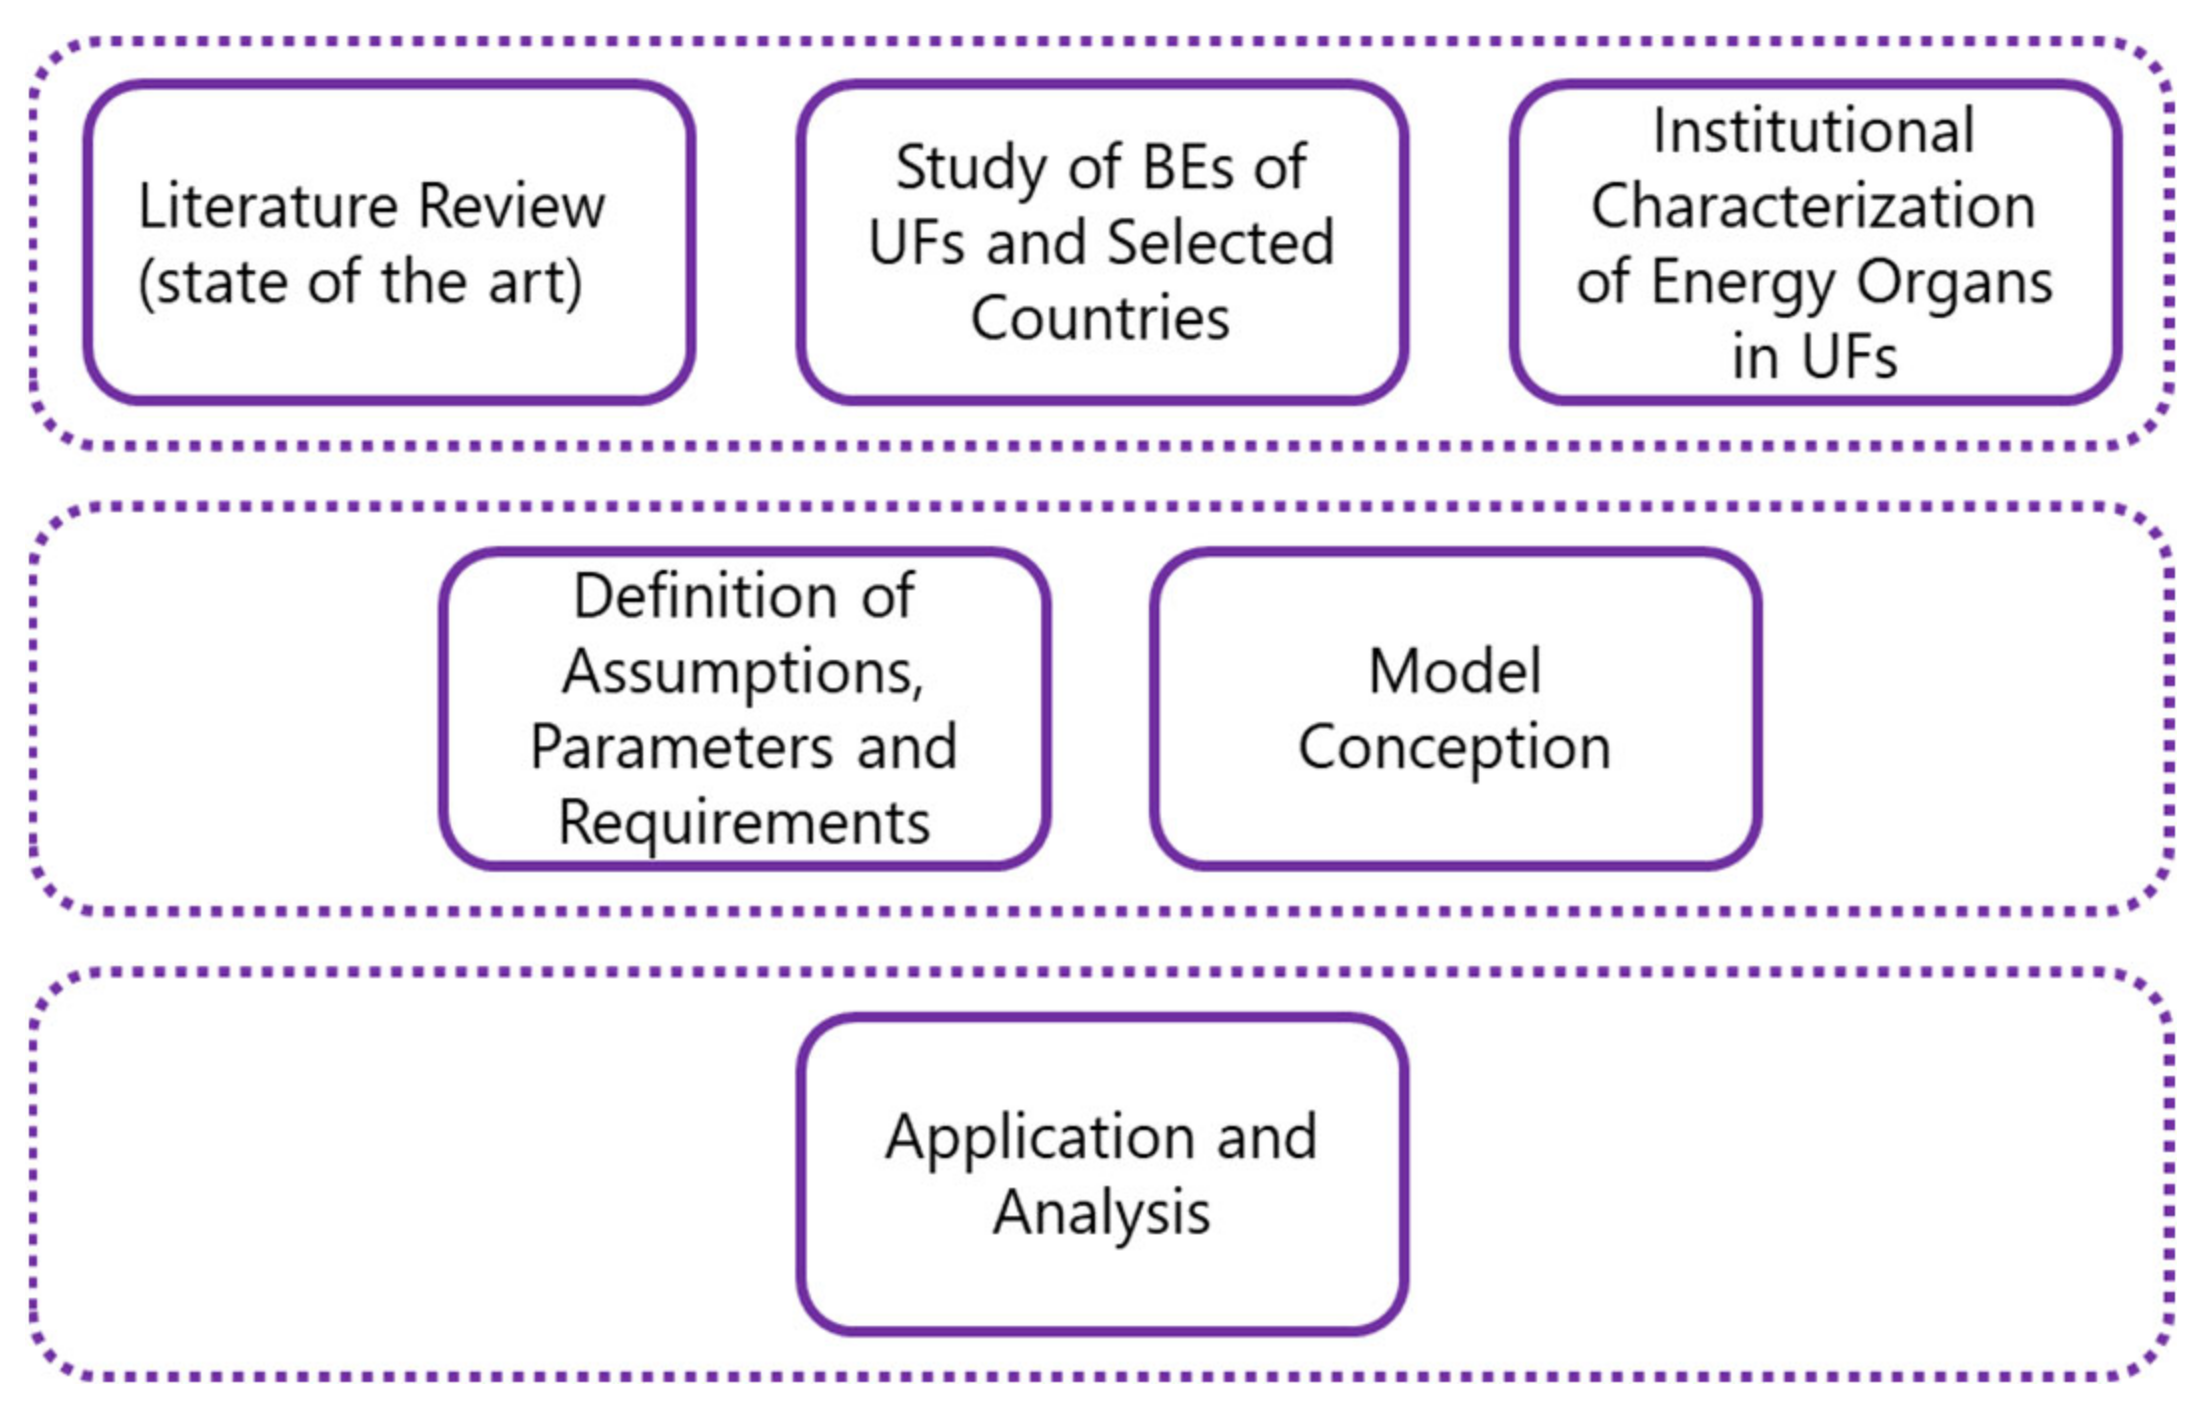
The starting point of the proposed study was a literature review through a bibliographic survey in scientific bases and selective searches in specific governmental and international organizations, among others related to the theme. The second step consisted of the comparative analysis of the EBs, and the establishment of premises aimed at the construction of a model for the elaboration of the document. The third phase is the implementation and analysis of the model applied to the Mato Grosso do Sul state, Brazil.
Figure 1 describes the three phases.
Essentially, the literature review aimed to establish the state of the art in the elaboration of energy balance in Brazil and in other selected countries. The bibliographic search procedure was carried out on 3 April 2021, through the Google Scholar and Scopus databases. The keyword entered was “energy statistics”, which resulted in 272 hits in Google Scholar and 87 in Scopus, totaling 359. After elimination of duplicate results, 302 articles remained to be analyzed. Eligibility analysis was performed by reading the abstracts based on the approach to EB preparation practices, which resulted in 28 articles.
In addition, searches were also conducted in international organizations, public energy management agencies, and in the bases of some Brazilian universities, namely, United Nations Statistical Commission—UNSC; United Nations Statistical Division—UNSD; International Energy Agency—IEA, Latin American Energy Organization—OLADE; Department of Mines and Energy, Energy Research Office—EPE; University of São Paulo—USP, Federal University of Rio de Janeiro—UFRJ and Federal University of Itajubá—UNIFEI.
The selected works were analyzed, including the understanding of international parameters, the structure of recently published SEBs, and the understanding of organizational structures and institutional platforms for the management of the energy sector in the FUs. With the proper analysis, the appropriate model was discussed as a result of the second phase. The third phase consisted of the analysis of the model applied to the state of Mato Grosso do Sul in 2014 from the perspectives and conceptual parameters established in the literature.
3. Energy Statistics
The establishment of common parameters for energy statistics in different countries has been the focus of many international organizations. The perception is that the production of energy statistics differs substantially from one country (or region) to another, making it difficult to disseminate information to different groups of users, especially in terms of comparability. Another aspect concerns the quality and accuracy of the information.
Several studies have pointed to the difficulties concerning the information or lack of it. In 1980, authors in [
7] addressed problems in this regard. Considering China, many authors have analyzed the country’s energy statistics using terms such as consistency, uncertainties, precision, and reliability [
8,
9,
10,
11,
12]. In [
13], the authors discussed the consistency and reliability of the Netherlands’ energy statistics, considering data from the chemical industry. In [
14], the EBs from autonomous communities in Spain were compared, and the author reported the country’s need to harmonize its energy statistics with international standards. Additionally, in [
15], the authors highlighted the importance of robust energy statistics when analyzing the energy efficiency of the German chemical industry.
Therefore, it is necessary to understand what are the foundations, criteria, and recommendations that are consolidated, either in the literature or in the documents of international organizations related to the best practices of elaboration of EBs. At the international scope, there is a significant effort by organizations that, for some time, have sought to establish a standardization process aiming at comparability between national EBs. In 2004, the IEA published the ESM—Energy Statistics Manual, which was prepared in collaboration with the Statistical Office of the European Union—Eurostat. Likewise, in 2015, the UNSC published the IRES—International Recommendations for Energy Statistics, and in 2016 the UNSD published the ESCM—Energy Statistics Compilers Manual. In 2017, OLADE published the MES—Manual of Energy Statistics. In Brazil, the EPE published in 2021 the EBMM—National Energy Balance: Methodological Manual.
The IRES can be considered the main reference among all manuals as it is the consolidation of a process accumulated since the 1970s. It brings the purpose of harmonizing concepts and definitions, guidance on data sources, discussion on the compilation method, guidance on the appropriate institutional arrangement for the production of an EB, the definition of data and metadata quality parameters and what would be the best dissemination policies [
16]. Conceptually, the guide addresses the relevance of producing energy statistics, discusses the potentially interested public, the general principles that should govern the process, the scope of the data, the parameters for classifying energy products, units of measurement and conversion factors, among others. The design concerns the development of relationships between data and information using table models. As for the method, there is a concern with the legal framework, with the institutional arrangement, with the detailing of sources, with data processing, metadata and quality control.
Table 1 compares each of the references considered in this study according to selected themes and scored under the criterion of the scope and depth in which they were treated.
The Energy Balance
The IEA deems that the EB expresses the production, supply, and end-use of energy in common units [
17]. The OLADE definition establishes that the EB expresses energy flows in the stages of the production chains in order to relate supply and demand, considering a certain territory and reference period [
18]. The UNSC also considers flow accounting and adds terms for compiling and reconciling data on overall energy.
Similarly, the EPE in Brazil defines the EB as accounting for the supply and consumption of energy in the country, considering conversion processes and foreign trade, including other information such as historical series, installed energy capacity and socioeconomic data [
19]. In the EBMM publication, the company brings a slightly more complete approach by establishing a context of temporality and territoriality, reinforcing the concept of accounting of a state, region, or country in a reference period. The EBMM report details primary and secondary forms of energy, discriminating the productive activities, storages, foreign trade, conversion and distribution plants, and consumption in the sectors of the economy [
20].
The Structure and Process of Energy Balance
Considering the Brazilian case, by analyzing the annual publications of the NEB and the EBMM, it is possible to verify great adhesion and consonance with the recommendations of the UNSC, UNSD, IEA, and OLADE.
The Brazilian NEB has been published annually for more than half a century by the Ministry of Mines and Energy—MME, the government body responsible for fostering energy-related activities and setting out the national energy policies. In 2004, with the creation of Energy Research Office (EPE in its Portuguese acronym), the activities involving elaboration of studies and research aimed at supporting the planning of the energy sector have been under the responsibility of the EPE [
19].
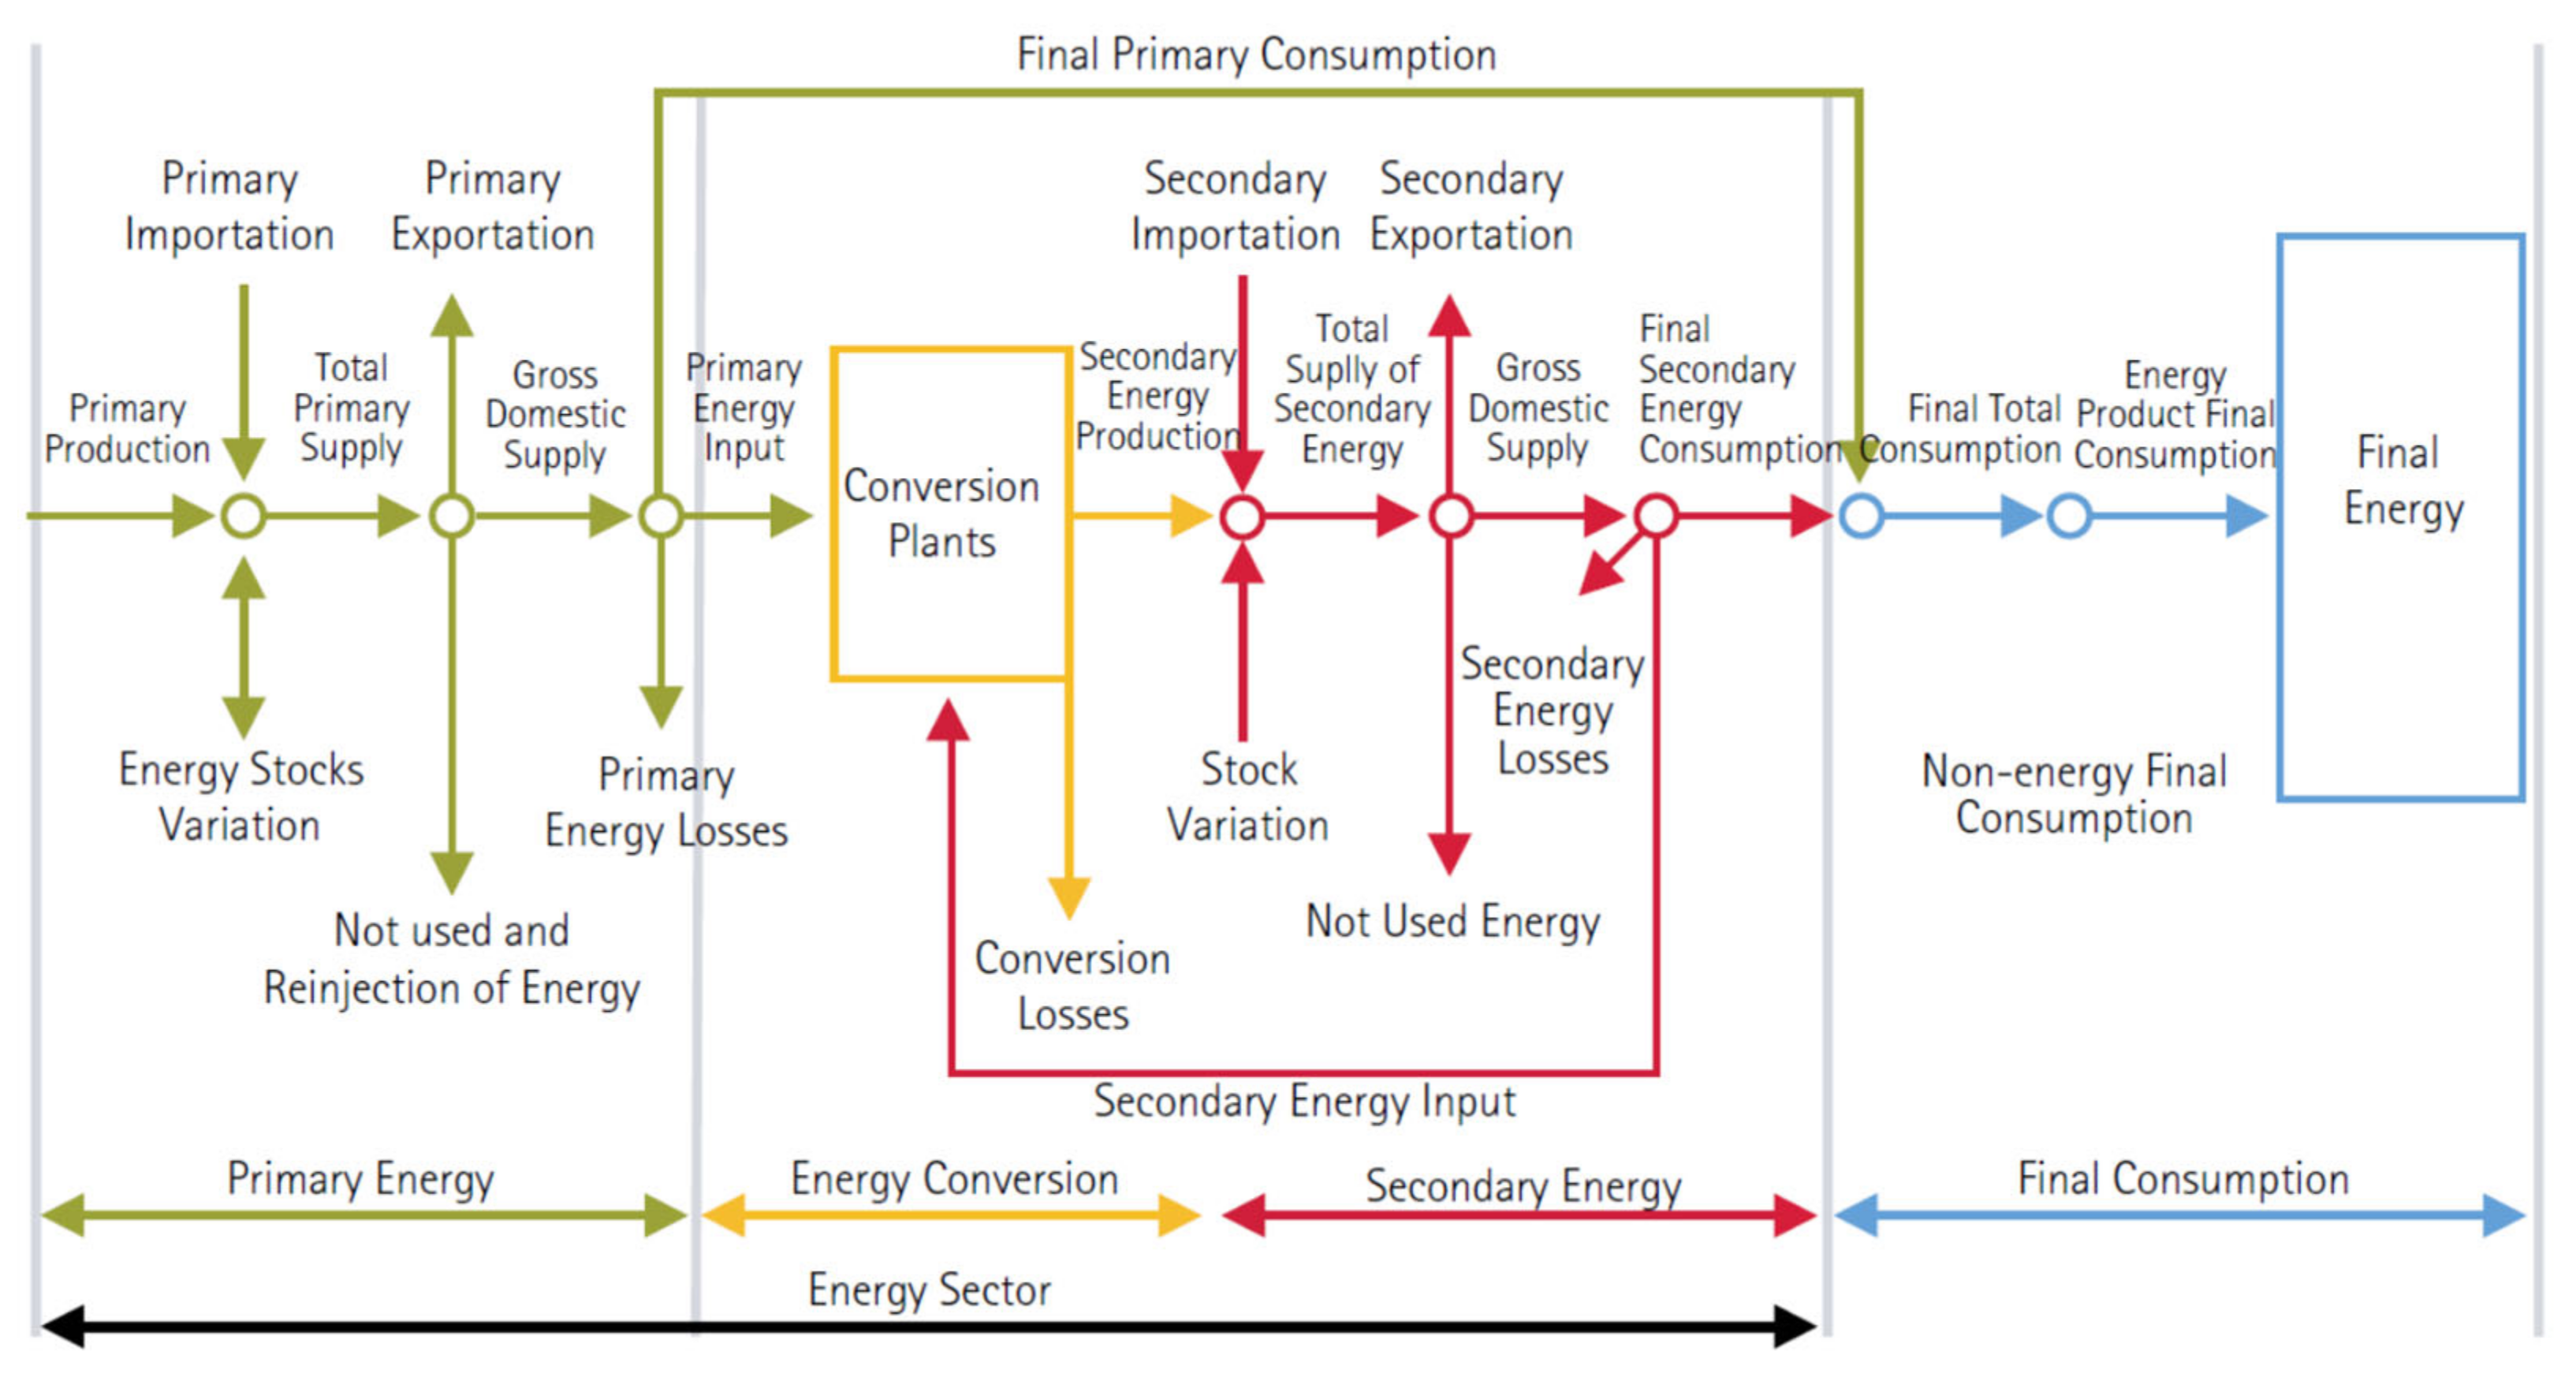
Aligned with international standards, the NEB is the result of a systemic approach that considers four parts: primary energy, energy conversion, secondary energy and final consumption, as aforementioned [
20].
Figure 2 shows a schematic representation of the NEB energy flow.
The main input is the primary energy available in its raw form, which includes oil, natural gas, coal, uranium, hydraulic energy, firewood, sugarcane products as well as rural and industrial residues. This calculation also considers imports and exports, losses and non-use or reinjection, resulting in the gross domestic supply of primary energy. The primary energy destined to the conversion plants is obtained from the gross domestic supply after deducting the amount of primary energy consumed and the losses. The conversion plants are the refineries, thermoelectric and hydroelectric power plants, nuclear power plants, self-producers, biogas plants, ethanol plants, biodiesel plants, gasification plants, coke, coal and other processes such as chemical industry that generates flue gases.
Subsequently, deducting the conversion losses, the secondary energy stocks, the balance of foreign trade, and deducting secondary losses (gas pipelines, transmission lines, etc.) the final total consumption is obtained which includes final non-energy consumption. Then, the final consumption is analyzed by different sectors.
Four specific phases throughout the year usually accomplish the process of preparing the NEB, namely data acquisition, accounting, publication and sectoral studies [
20]. The data collection involves registering data providers, reviewing questionnaires and forms, requesting information, monitoring collection, verifying data received, identifying problems, and corrections and adjustments actions. Contacts occur through different means such as online forms, emails, phone calls to public bodies, and direct relationship with approximately 750 energy-use industries [
20].
The accounting stage consists in the analysis of the obtained data consistency based on the existing historical series, on the typical consumption of the economic sector, on the parameters of efficiency, mass, and energy balance. Then, the data are input into a spreadsheet and analyzed in extracts by the energy and economic sector. This process normally takes place between April and June [
20].
The publication consists of the elaboration of descriptive texts and the entire set of editorial actions until availability in physical and electronic media. It takes place between July and September [
20]. Finally, the studies by sector are carried out during the second half of the year, when it might occur sectorial meetings to disseminate and review data, concepts, and the data access procedure [
20].
4. The Brazilian SEB Situation
Brazil is a Federative Republic, where the economic regulation, tariffs, and the enterprises’ concessions of oil and gas, electricity, and other activities of the energy branch are under the control of the federal entity. As well as the planning and coordination, which is conducted by the Department of Energy and its institutional branches, such as regulatory agencies and corporations controlled by the government.
Nonetheless, there is plenty of space for the federative units (FUs) to act, focusing on economic and social development. For example, the FUs may promote activities important to jobs creation, technological innovation and development, the reduction in greenhouse gas emissions, mitigation of environmental impacts, and in the efficiency increase and reliability of the energetic systems. Moreover, it is essential to consider the influence of the public policies, mainly related to biofuel production and distributed electrical energy generation.
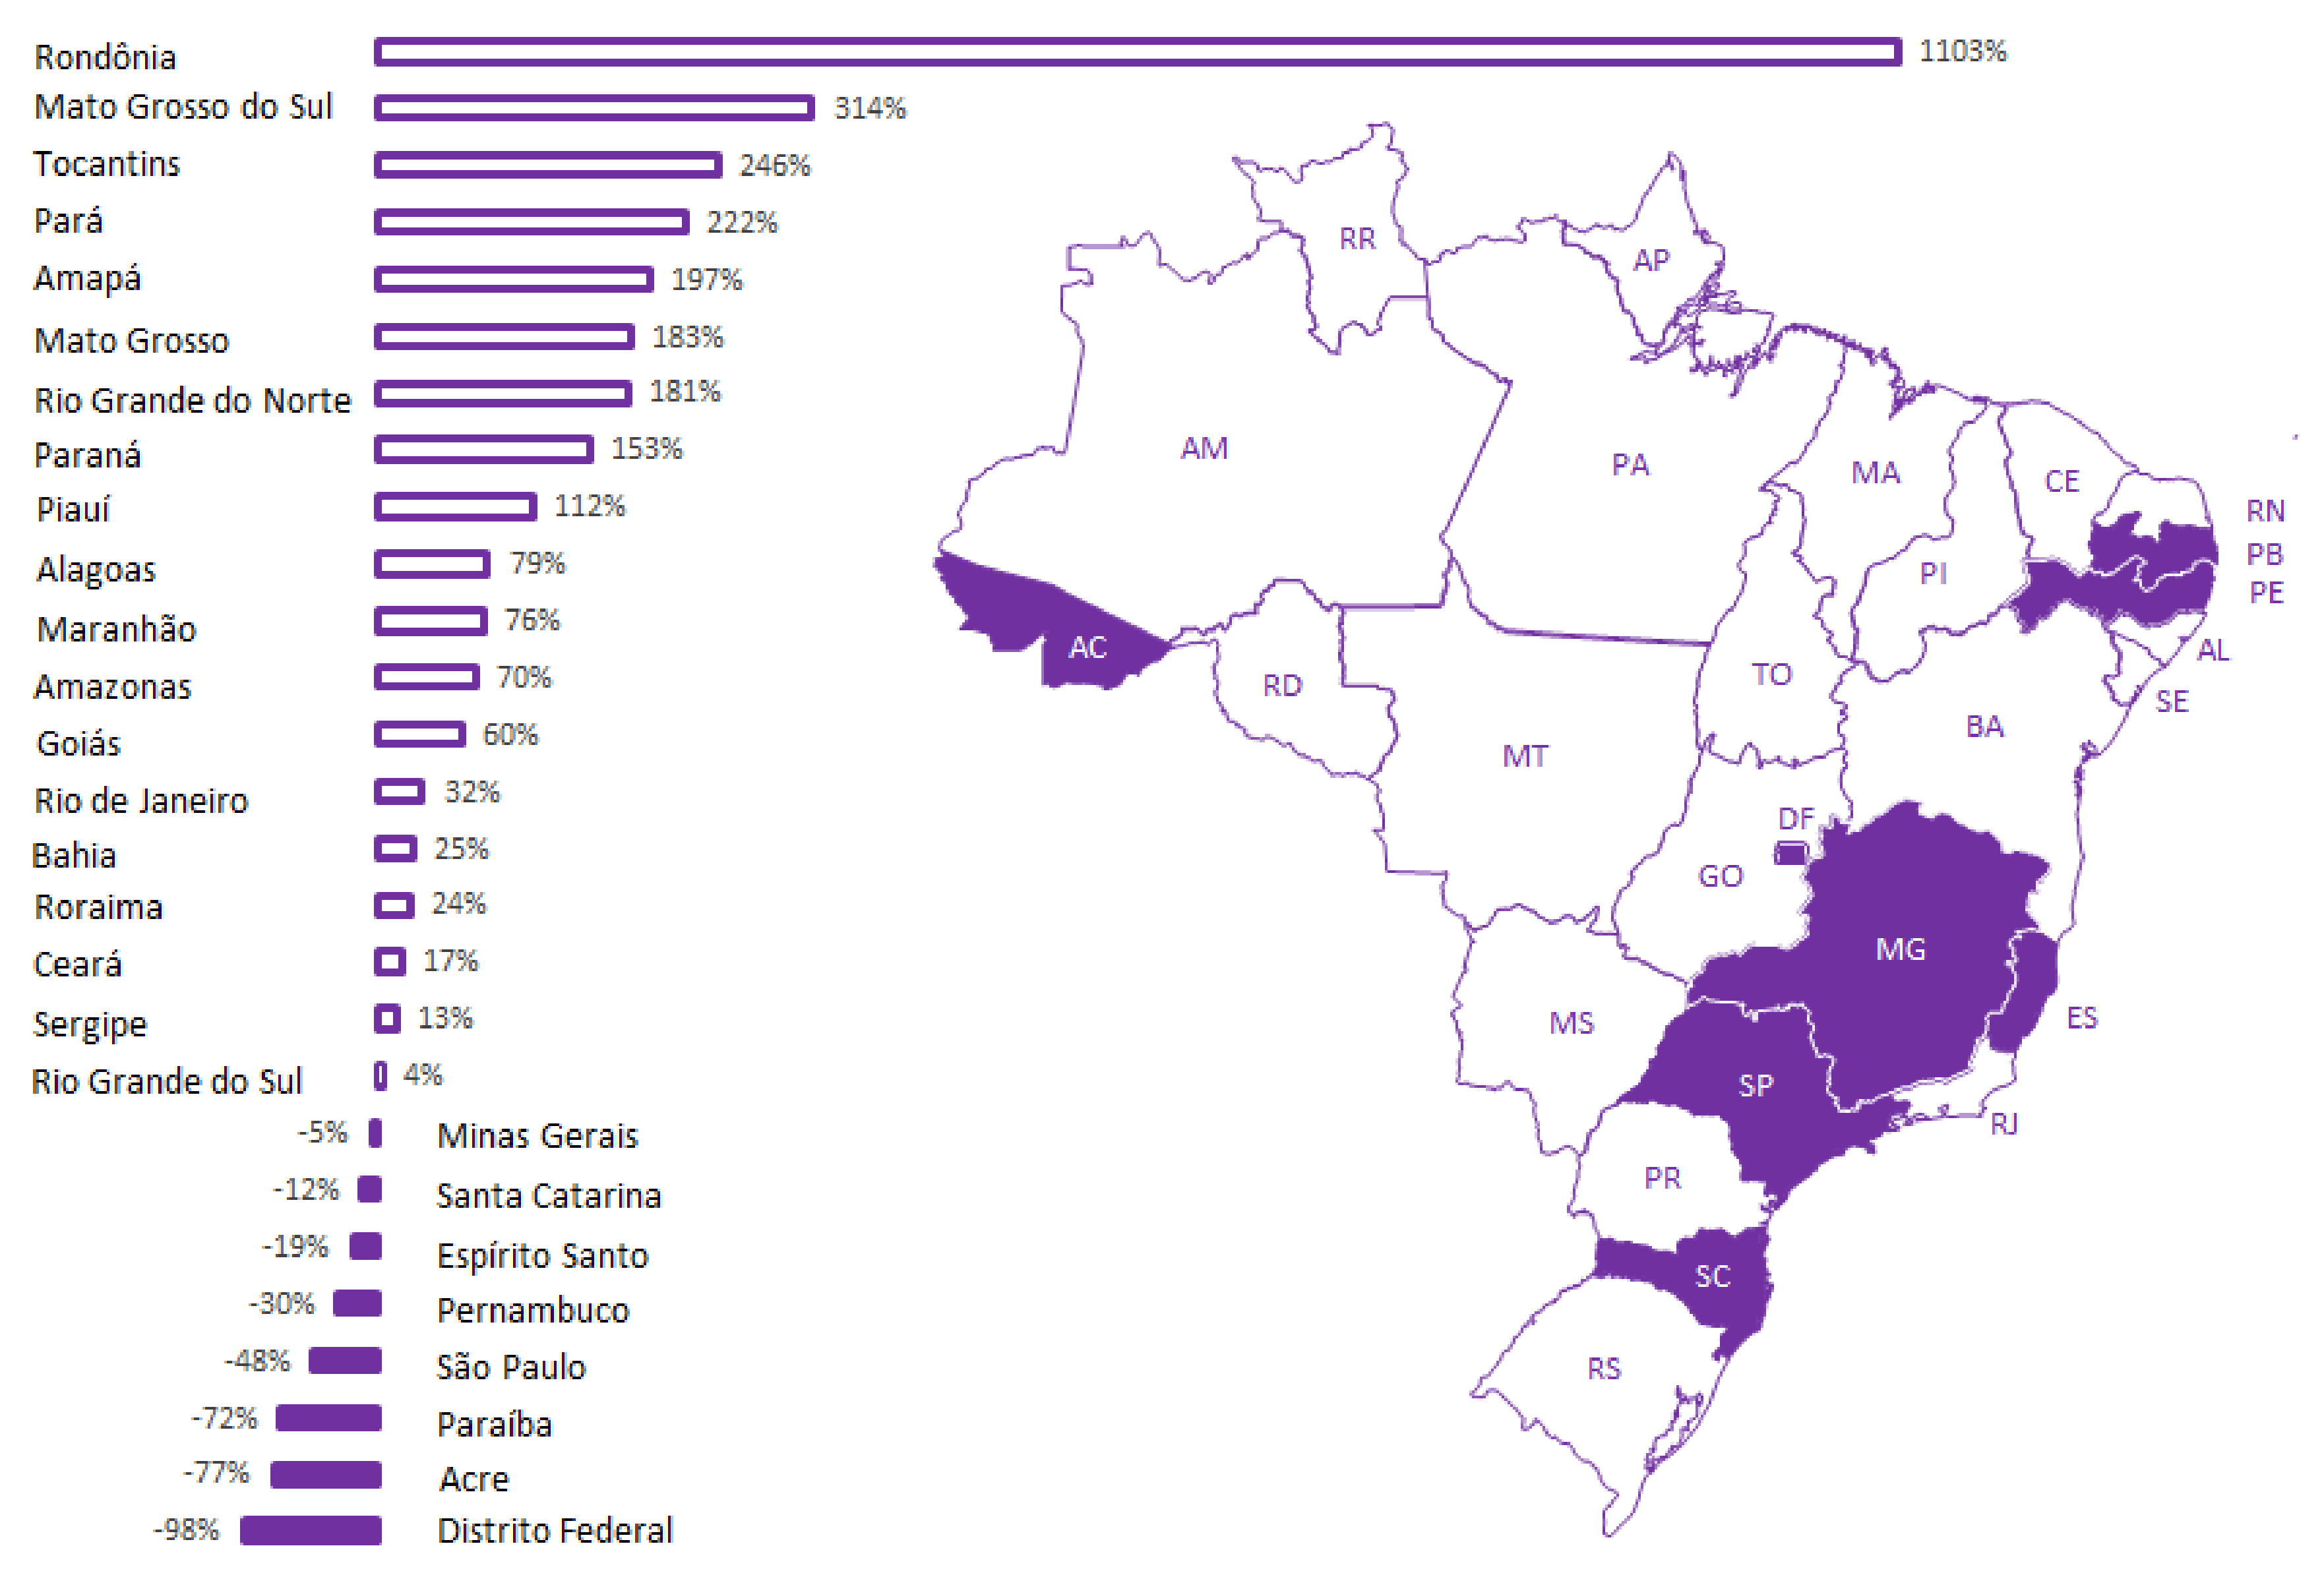
As mentioned previously, although the NEB provides specific information about the states and Federal District, that information is not sufficient to support the analysis of each FU to formulate public policies for the sector or its branches at the state level of government. For example,
Figure 3 shows the self-sufficiency of electric energy of each FU considering the year 2019 published in the NEB; however, the overall energetic self-sufficiency was not analyzed due to the lack of data.
The Brazilian FUs could remedy this shortcoming of data and help the establishment of public policies, enhancing the development of the energy sector in their territory. However, it is noted that just a small fraction of the FUs present some initiatives in this regard. The reasons for such absence are many; however, one should consider the notable inequity in a variety of aspects when comparing different FU in Brazil.
Table 2 shows GDP and population size for the year 2018, along with the year of the latest SEB publication.
As can be noticed, more than half of the FUs do not or did not publish the SEB report. Furthermore, among the FUs with the SEB published, only the states of São Paulo, Alagoas, and Espírito Santo usually keep the report updated.
4.1. Institutional Arrangement
Based on the studies carried out, it was noticed that the traditional Energy Secretary, which was common in the FUs until the beginning of the electrical sector privatization process in the 1990s, has now become extinct. For example, the São Paulo state owned a powerful Energy Secretary, which held control over four companies of generation, transmission, and distribution of electrical energy, including natural gas, being: Companhia Energética de São Paulo—CESP, Companhia Paulista de Força e Luz—CPFL, Eletricidade de São Paulo—ELETROPAULO, and the Companhia de Gás de São Paulo—Comgás. Nowadays, the energy sector in the states (including São Paulo) is located at the third level of management in the government, with an oversight or coordination role.
As a result, when comparing the FUs organization related to the energy sector, different patterns of management can be observed. For instance, in São Paulo state, the sector is the responsibility of the Sub-Secretariat for Infrastructure, under the Environment and Infrastructure Secretary. In Alagoas state, there is an Oversight for Energy and Mining, which is subordinated to the Sub-Secretariat for Development and Tourism. There is also an atypical case involving the Espírito Santo state, which does not have a specific governmental stance on the energy sector, however, publishes the SEB by its Public Services Regulatory Agency. In addition, some FUs hire researchers or research centers to elaborate their SEBs for a specific year. Situations as mentioned were observed in Mato Grosso and Mato Grosso do Sul states.
In that context, it is worth remarking that almost all FUs have Public Service Regulatory Agencies, except for Minas Gerais state, which does not have an agency dealing with energy, and Roraima, which closed its agency in 2019. With the survey carried out through this study, a significant variability among the competences of the state agencies for inspection and regulation of public services has been noted. Among the differences are the competences of sanitation, water resources, mineral resources, transportation, telecommunications, electric energy, oil and derivatives, inspection vehicles, solid waste, wind generation and piped gas. However, considering the purpose of this work, it must be pointed out that, among all the agencies existing in the FUs, only one, in the state of Tocantins, does not have at least one Public Energy Service among its competences, which allows inferring that the institutional arrangement of Espírito Santo state might be reproduced.
4.2. Energy Policies
As previously stated, the privatization process of Brazilian energy gave rise to a new meaning for the role of FUs related to the energy sector. In addition, the analysis of the institutional arrangement corroborates this fact. As a consequence, an integrated energy policy is partially established in the Brazilian FUs.
Based on the prospective presented in this study, an integrated energy policy is a set of minimum elements which include a diagnosis of the current situation. The maintenance or adjustment of this diagnosis depends on specific results that should be compared with actions and goals based on an institutional legal framework, with predictability of allocation of resources.
Considering the 27 Brazilian states, there are a significant number of isolated programs with budget and link with SDG 7. Nonetheless, those programs incorporate actions related, mostly, to the efficiency and rationalization of energy use. The programs that establish some type of stimulus to the DG, especially solar and wind energy, including, in Bahia state for example, a Plan for the Green Hydrogen Economy. However, there are no publications that dialogue with challenges and diagnoses presented in the national plans, such as the ten-year energy expansion plan (2031) and the national energy plan (2050).
Despite the fact that Amazonas state has an updated chapter in its Constitution that deals with a specific energy policy, there are no record or a set of integrated programs of the government about an energy planning in the state level.
In this context, the state of São Paulo presents an energy plan (2030). Although the São Paulo plan is focused on the oil and gas segment, and consequently absent in other segments, it is well articulated with the national diagnosis and presents important projections. However, it does not point out specific actions and goals for the sector, a fact that can be confirmed in the state’s multiannual plan. This plan has a single program for the sector linked to the local public services regulatory agency, named: Regulatory Evolution in Electric Energy, Piped Gas and Sanitation.
4.3. Comparison among the EBs
In this section, the SEBs of the states São Paulo, Alagoas, Espírito Santo and Mato Grosso do Sul, were analyzed. These four FUs were chosen based on the criteria of maintenance of annual publications in recent years. The exception to this criterion is the state of Mato Grosso do Sul, which is the reference for the model discussed in this study.
Regarding the comparison, considering the structure of the NEB, it was noted that, with no exception, all FUs analyzed have adequate coverage of the contents and fundamental data, for instance:
- -
Production of primary energy;
- -
Internal energy supply;
- -
Final consumption by source;
- -
Energy flow (only São Paulo and Mato Grosso do Sul);
- -
Total primary sources;
- -
Total secondary sources;
- -
Non-energy products;
- -
Consumption by sector;
- -
External dependence on energy;
- -
Transformation centers;
- -
Methodology;
- -
Previous years—consolidated.
In the case of Mato Grosso do Sul, additionally, there is a chapter on estimates of greenhouse gas emissions by the sector in the state and a chapter with projections for energy supply and demand.
5. The Scientific SISMODEN Model
In 2014, the Government of the Mato Grosso do Sul state (MS), in Brazil, implemented an Energy Data Modeling System—called SISMODEN. The purpose of the system was to facilitate the elaboration of the SEB, including future projections, in order to support the energy planning of the state. The system should also have a user-friendly interface, a mechanism for data auditing, and the functionality of automatic generation of reports from the integration with a text editor module.
To develop a system with all the required functionalities, five goals were established: the reviewing of existing methodologies; data collection, modeling and processing of data related to the energy demand; the collection, modeling and processing of data related to the energy offer; the integration of energy supply and demand sub-models; source code development; and the knowledge transfer related to the operation and maintenance of the system for the staff of the government.
The model developed for SISMODEN followed the international standards and practices described by the EPE. Regarding the methodology used to elaborate the MS-SEB, Equation (1) corresponds to the amount of energy (mass, volume or direct energy) in the timescale (annual) for each type of energy, having as standard unit the ton of oil equivalent (tOE).
The derivative term in Equation (1) represents the variation of the energy stock on the annual timescale, with zero average. The accumulated stock will be the integral part of the difference between the energy that goes in and that goes out, and, because it is limited, the stock should tend to a minimum constant. This principle provides validation and reconciliation of data and allows for the estimation of losses. The amount of energy that comes in (
corresponds to the energy production (
added to the quantity imported (
. The amount of energy that leaves (
is the sum of consumption (
, exports (
, and losses (
[
25].
For the net domestic supply (NDS) and gross domestic supply (GDS), equations 2 and 3 compare the both quantities, explaining that in order to obtain the NDS, the energy production and the result of foreign trade should be added, in addition to the subtraction of the losses [
25].
This concept subtly alters the NEB methodology with the intention of simplifying data collection and analysis, without prejudice to adequate quantification.
The variable
direct includes the energy consumption of that destined for processing centers, that is, consumption of the energy sector itself. The conversion process will result in the production of secondary energy (
), where the sum with the losses included is equal to the consumption of the conversion plant (
), as shown in Equations (4) and (5) [
25].
Equation (5) is the efficiency of the
process of conversion
5.1. The Design of the Model
The classification of energy sources can be established by different criteria, for example, by renewability, by the need for conversion before use, or by application. There is also a large set of conversion processes according to the type of source, as well as different energy products available for final use, which can occur in different segments of economic activity.
All this variability will imply defining a presentation design that meets the information requirements of different stakeholders.
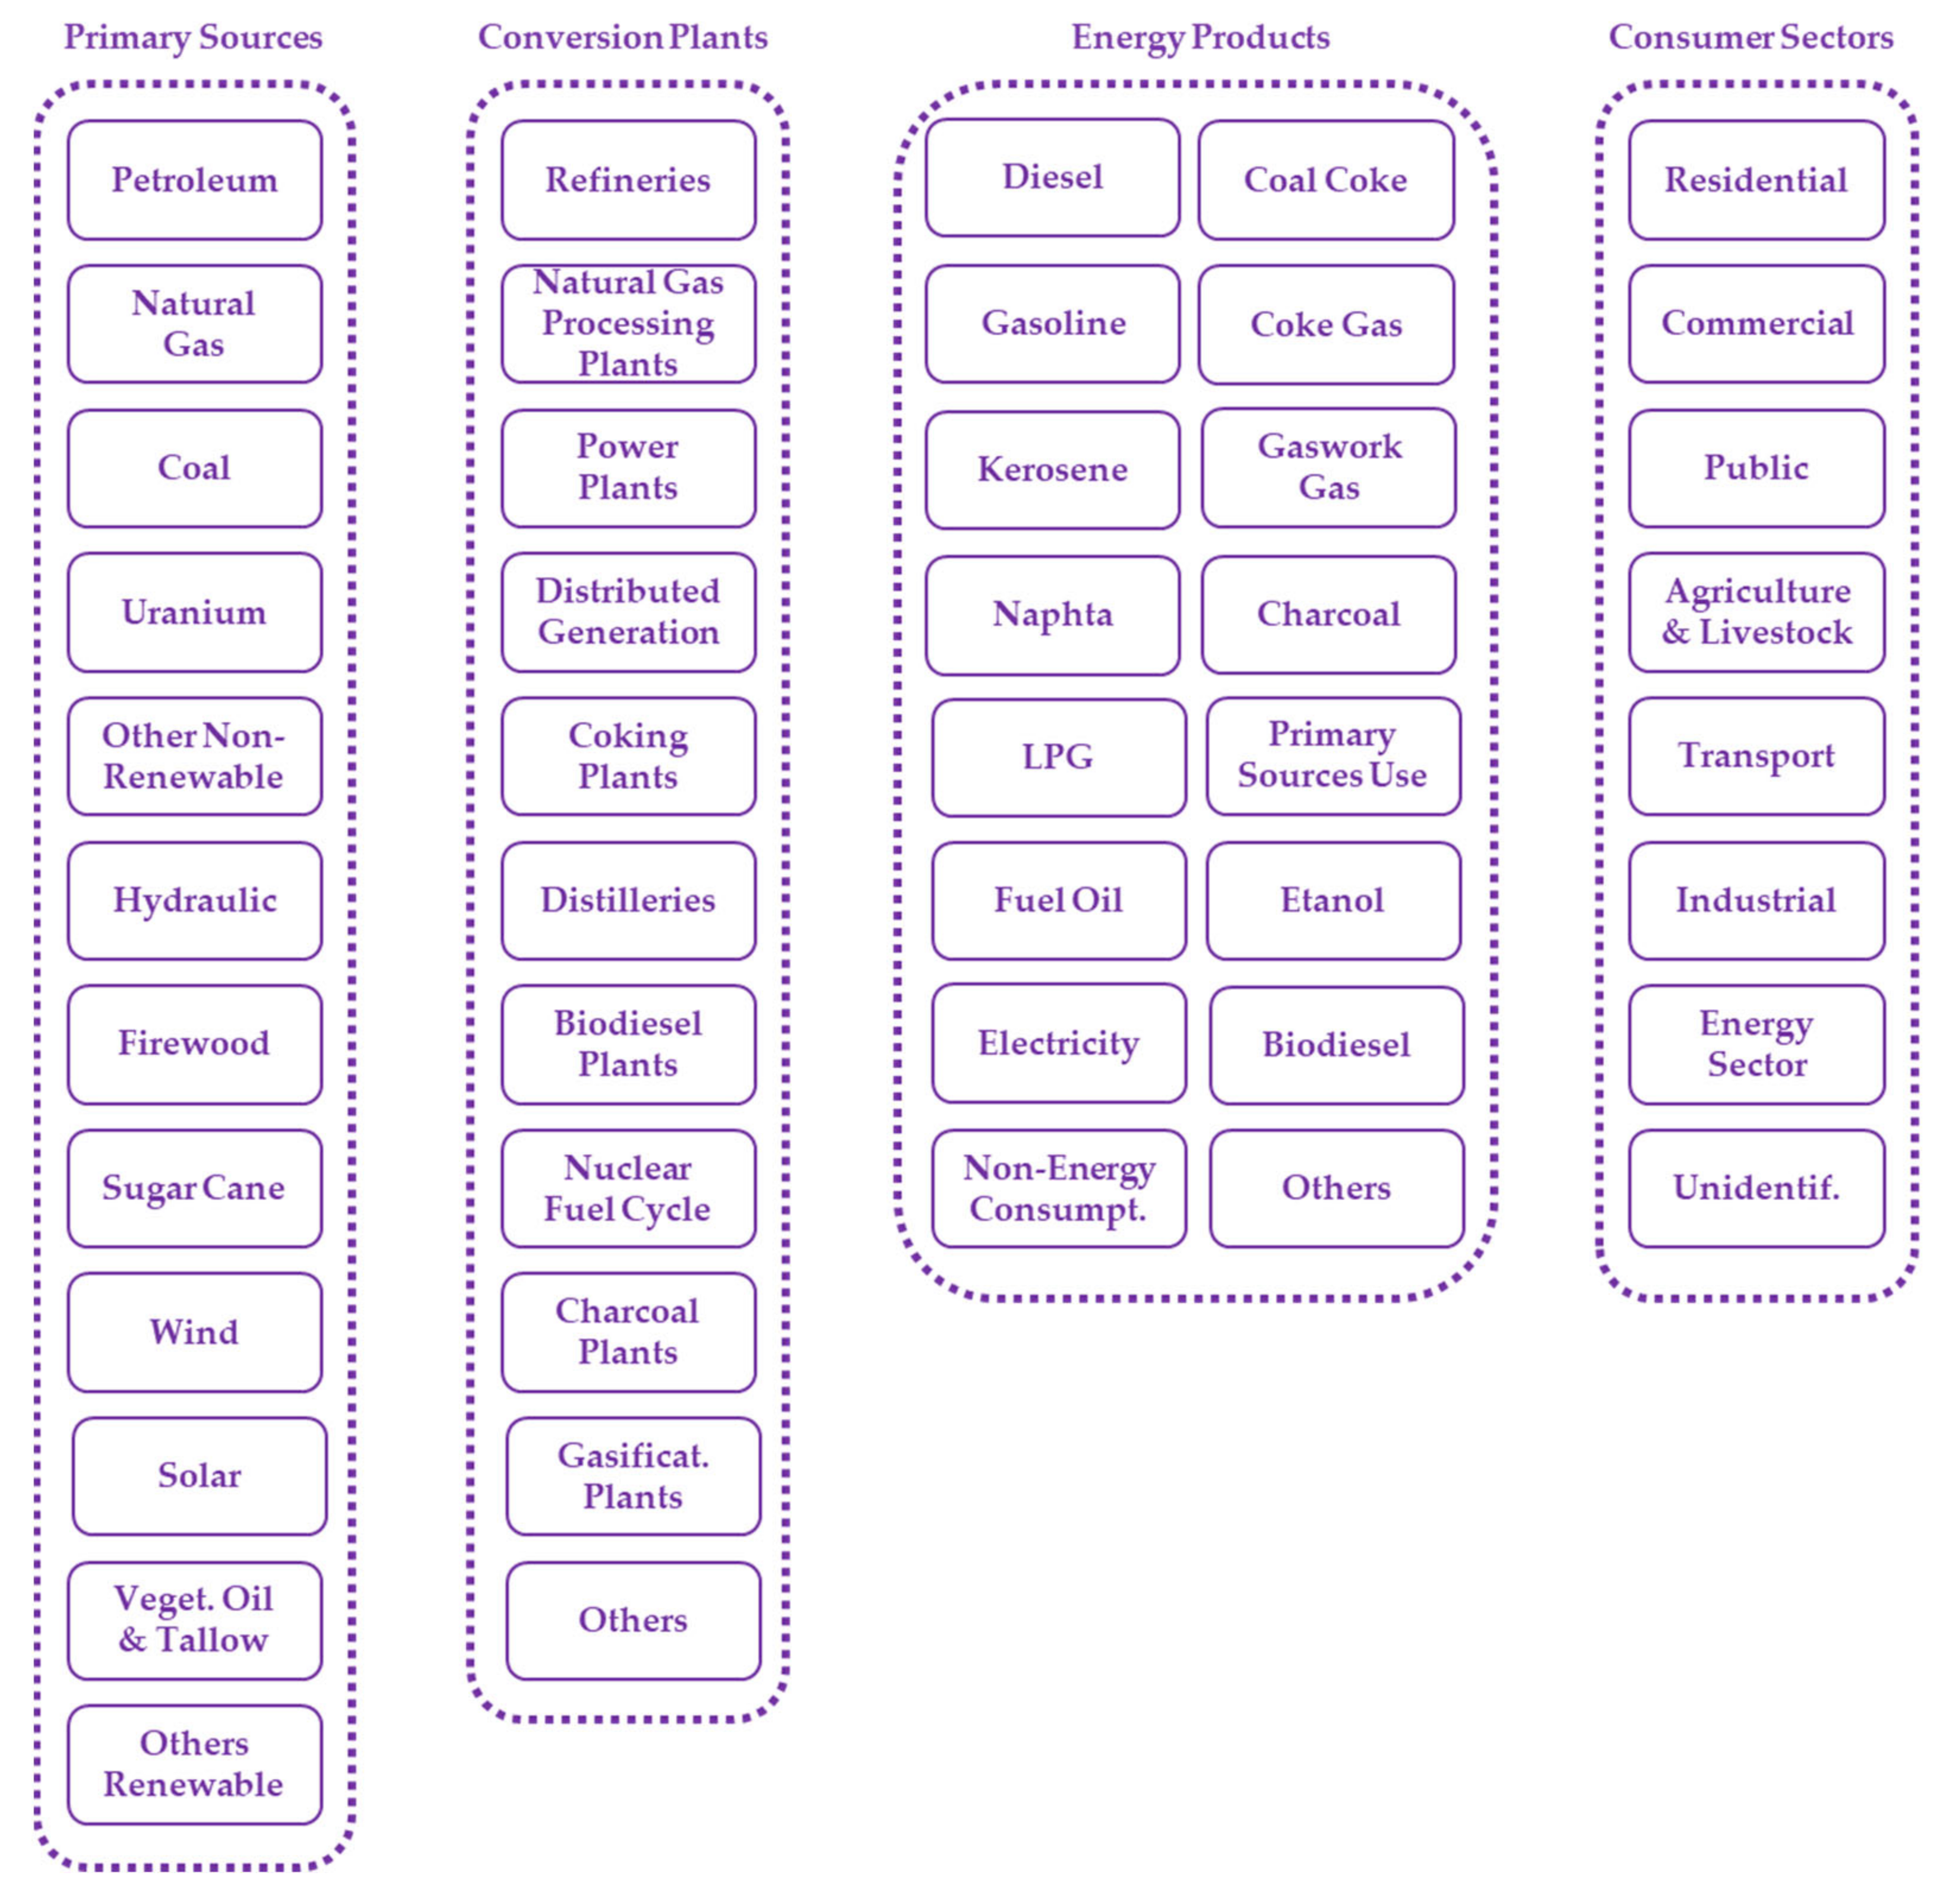
Figure 4 gives a panoramic view of this context, and it is important to consider the accumulation of knowledge already.
Consolidated in the best practices’ manuals published by international organizations. The classification process used in SISMODEN was based on the parameters and recommendations of the NEB, which also agrees with IRES. It is significant to notice that, in the case of sugarcane, three types of primary sources are obtained: juice, molasses and bagasse. Moreover, other primary sources include waste from renewable and non-renewable sources from rural and industrial activities.
Among the secondary sources, ethanol (in the NEB called alcohol) is divided between anhydrous (for blending with gasoline) and hydrated (direct consumption in dedicated engines or flex fuel). There are other specific situations, such as the uranium contained in the UO2 and the tar resulting from the transformation of coal into coke, which are also counted as a secondary source.
There are products with some energy content in the non-energy use category but used for another purpose, such as greases, solvents, lubricants, paraffin, and medicinal alcohol.
The list of energy products is in accordance with the International Standard Classification of Energy Products (SIEC) which enables comparability between regional and international balances. In this regard, it should be highlighted that the process of creating the SIEC considered the standardization with other international production classifications, specifically with the Harmonized Commodity Description and Coding System (HS), and Central Product Classification (CPC) [
4].
The consumer sectors in SISMODEN are disaggregated according to the National Classification of Economic Activities—CNAE. In Brazil, the CNAE agrees with version 4 of the International Standard Industrial Classification of all Economic Activities (ISIC 4) of the UNSD. Additionally, the list of national goods and services—PRODLIST—corresponding to the aforementioned CPC, on which the Mercosur Common Nomenclature (MCN) is also based, which in turn is also in conformity with the HS [
26,
27].
As mentioned, the consumption sectors were divided considering the CNAE and correspond to the residential, commercial, public, energy sector, agriculture and livestock, transport, and industrial sectors. In the case of transport, it is subcategorized into road, air, rail, and waterway. In the industrial sector, the following segments are considered: cement; pig iron and steel; iron; mining and pelletizing; non-ferrous and other metallurgical; chemicals; food and drinks; textiles; cellulose and paper; ceramics; and other industries.
5.2. The Software SISMODEN
The software was developed capable of generating the tables and graphs that composes the SEB of Mato Grosso do Sul, automating most of the process. It considers the efficiency parameters, measurement units and conversion factors, the classification of energy products, particularities of the conversion processes, existing flows, uses and their processes, and the generation and consumption specificities.
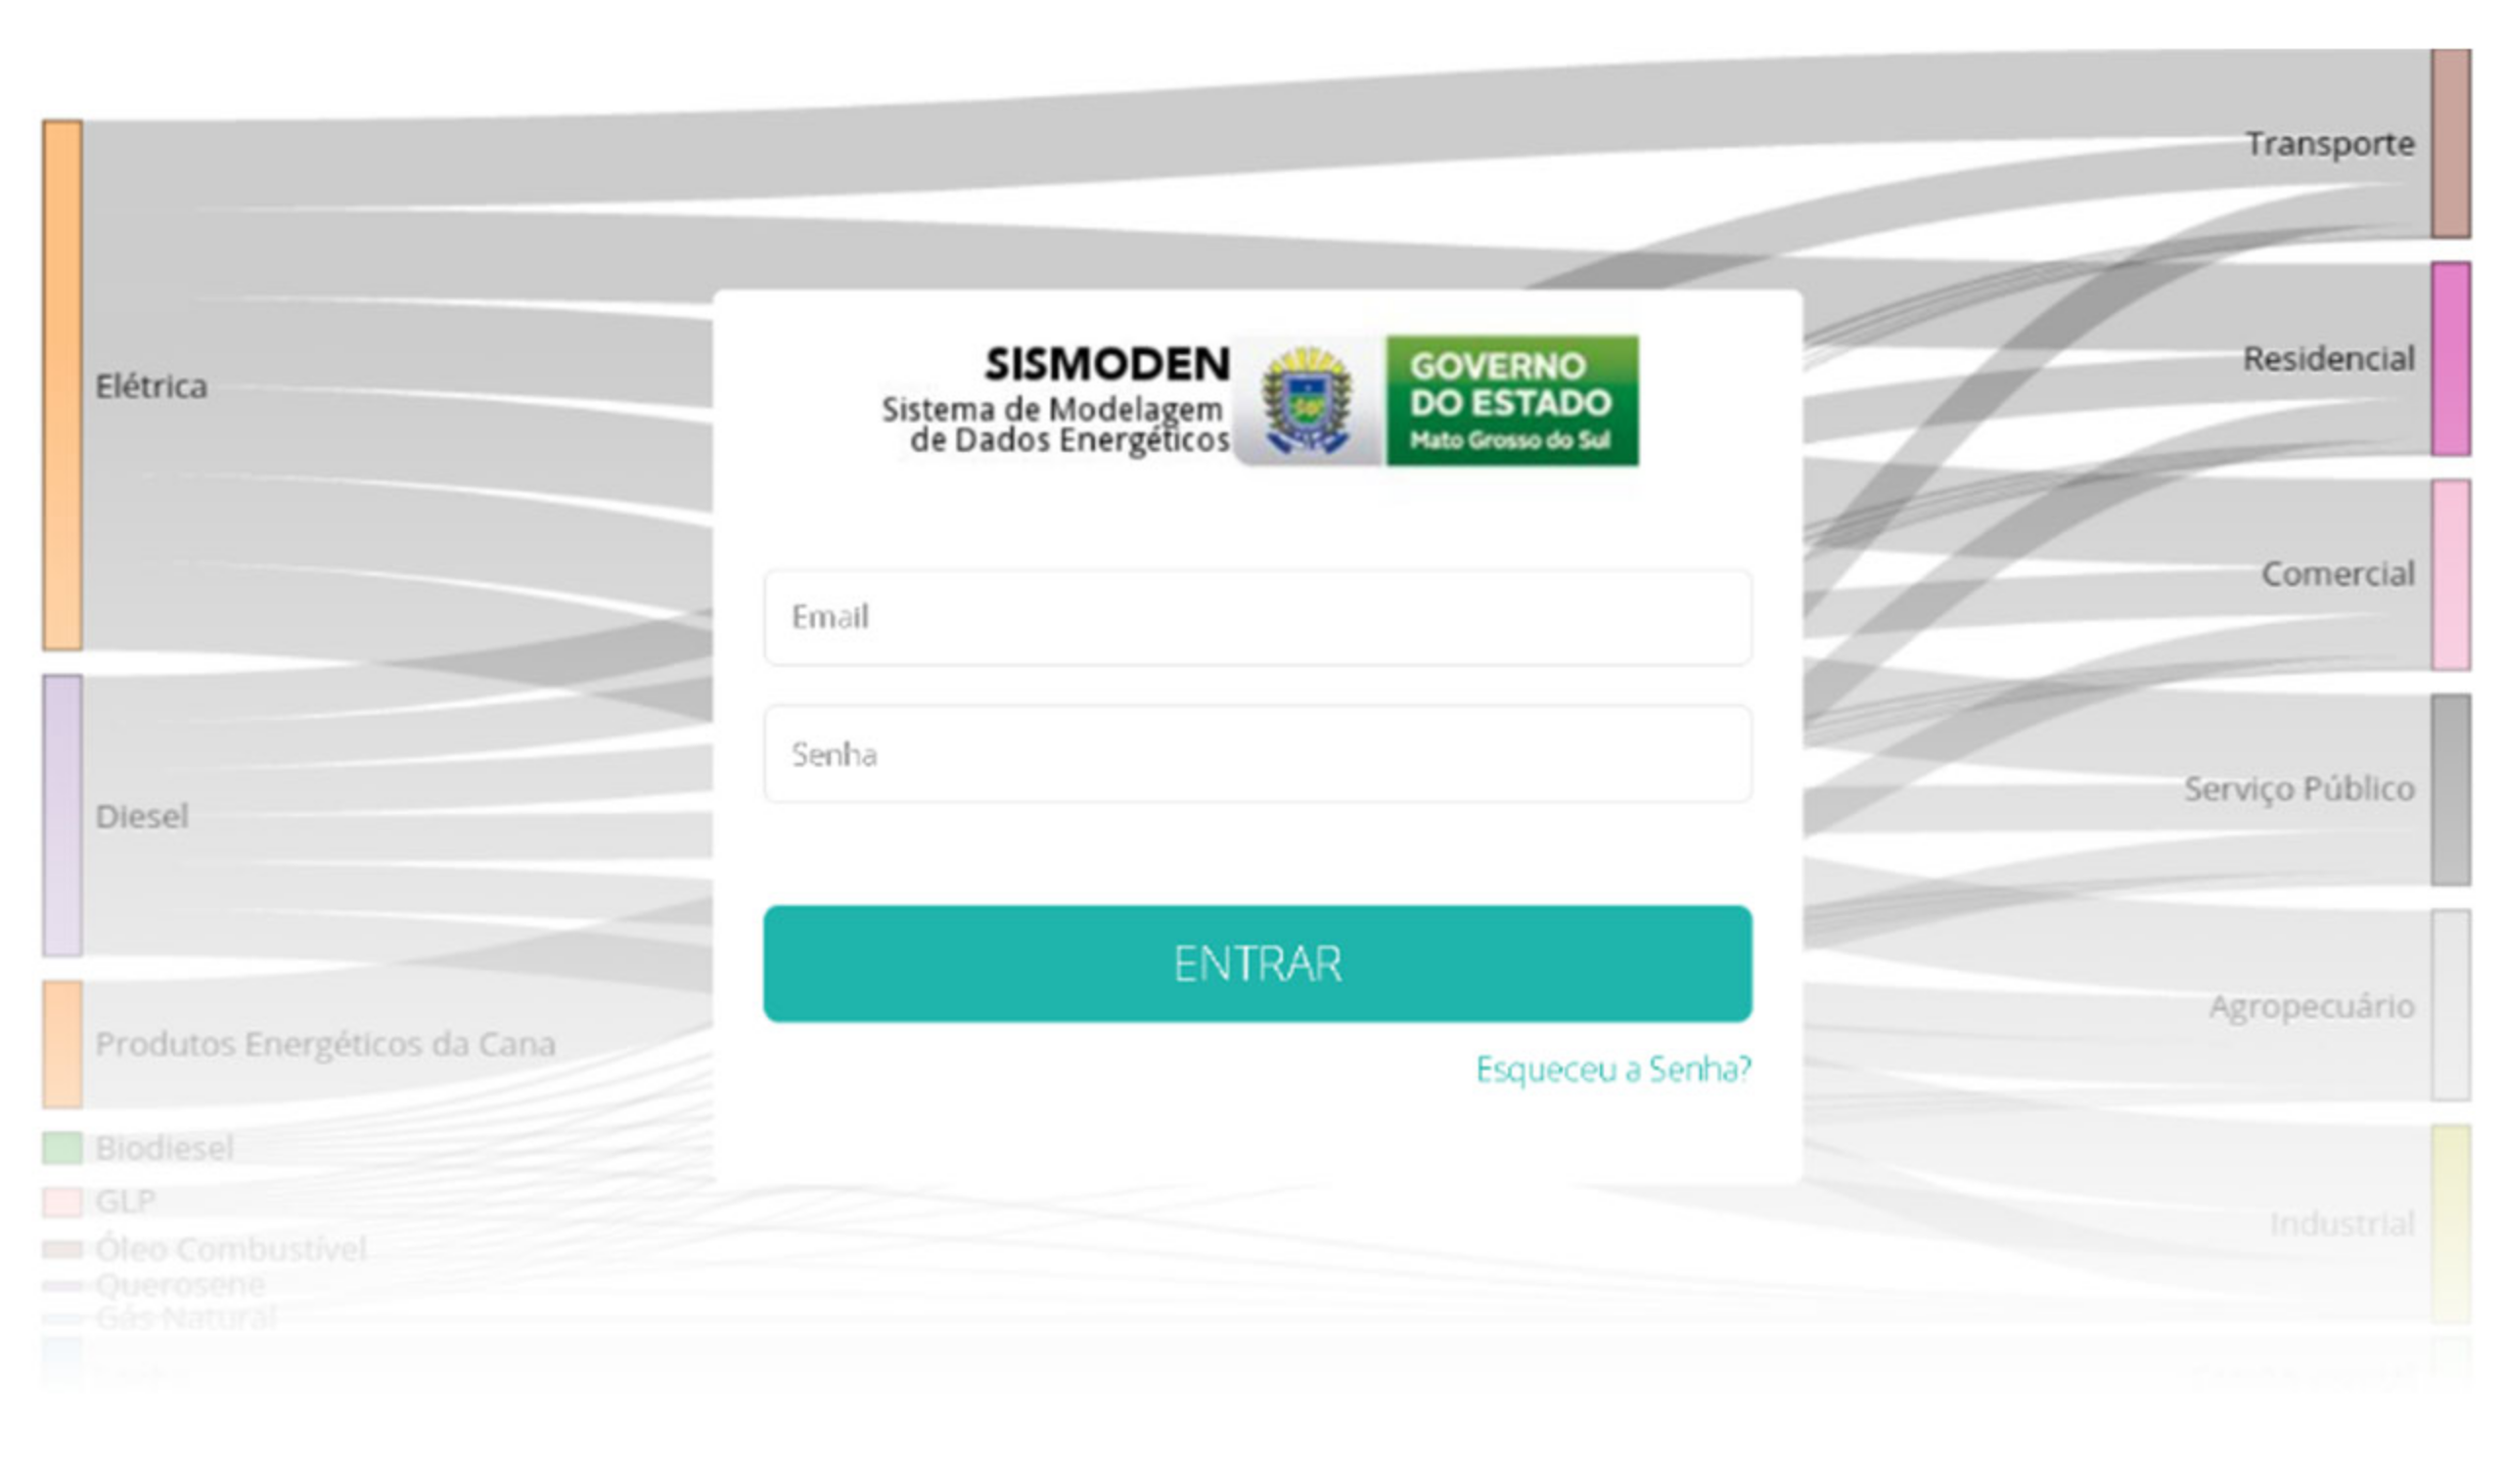
Figure 5 shows the login interface of the software.
The access to the software was divided into different permission levels, notably: data feeders; external or internal to the government; verifiers, Energy Coordination team (Energy Planning Management/Infrastructure Secretariat) and; administrators who have permission to change main settings. The input of raw data into the system, that is, unprocessed initial data, are obtained from pre-registered feeders. These data do not need to be consolidated separately and manually, where each feeder can fill in the energy information independently using the most appropriate unit of measure. This is due to the software capability to guarantee the organization of the data, conversion of units and processing.
Raw data releases occur separately in four modalities: consumption, generation of electric energy; primary resources; and secondary resources, aiming to better organize and easily audit the procedure. The reliability of the data is given through an audit test established by the comparison between different suppliers for the same data, considering a hierarchy between feeders. In this context, it is also possible to fill gaps through interpolations and estimation. For example, the production of firewood between the years 2005 and 2009 was filled with data generated through a locally weighted kernel regression.
The entire interface was designed to be user-friendly and allow multiple users with different permissions, maximum flexibility in configurations and ease generation of a report for the energy balance. There is significant variability for the fundamental configurations: types of energy, consumption sectors, units and conversions, transformations (for validation of the entered data), energy equivalents for conversion into tEP (standard unit adopted, equivalent to tOE), registration of electric power plants, companies that provide data (feeders), and users.
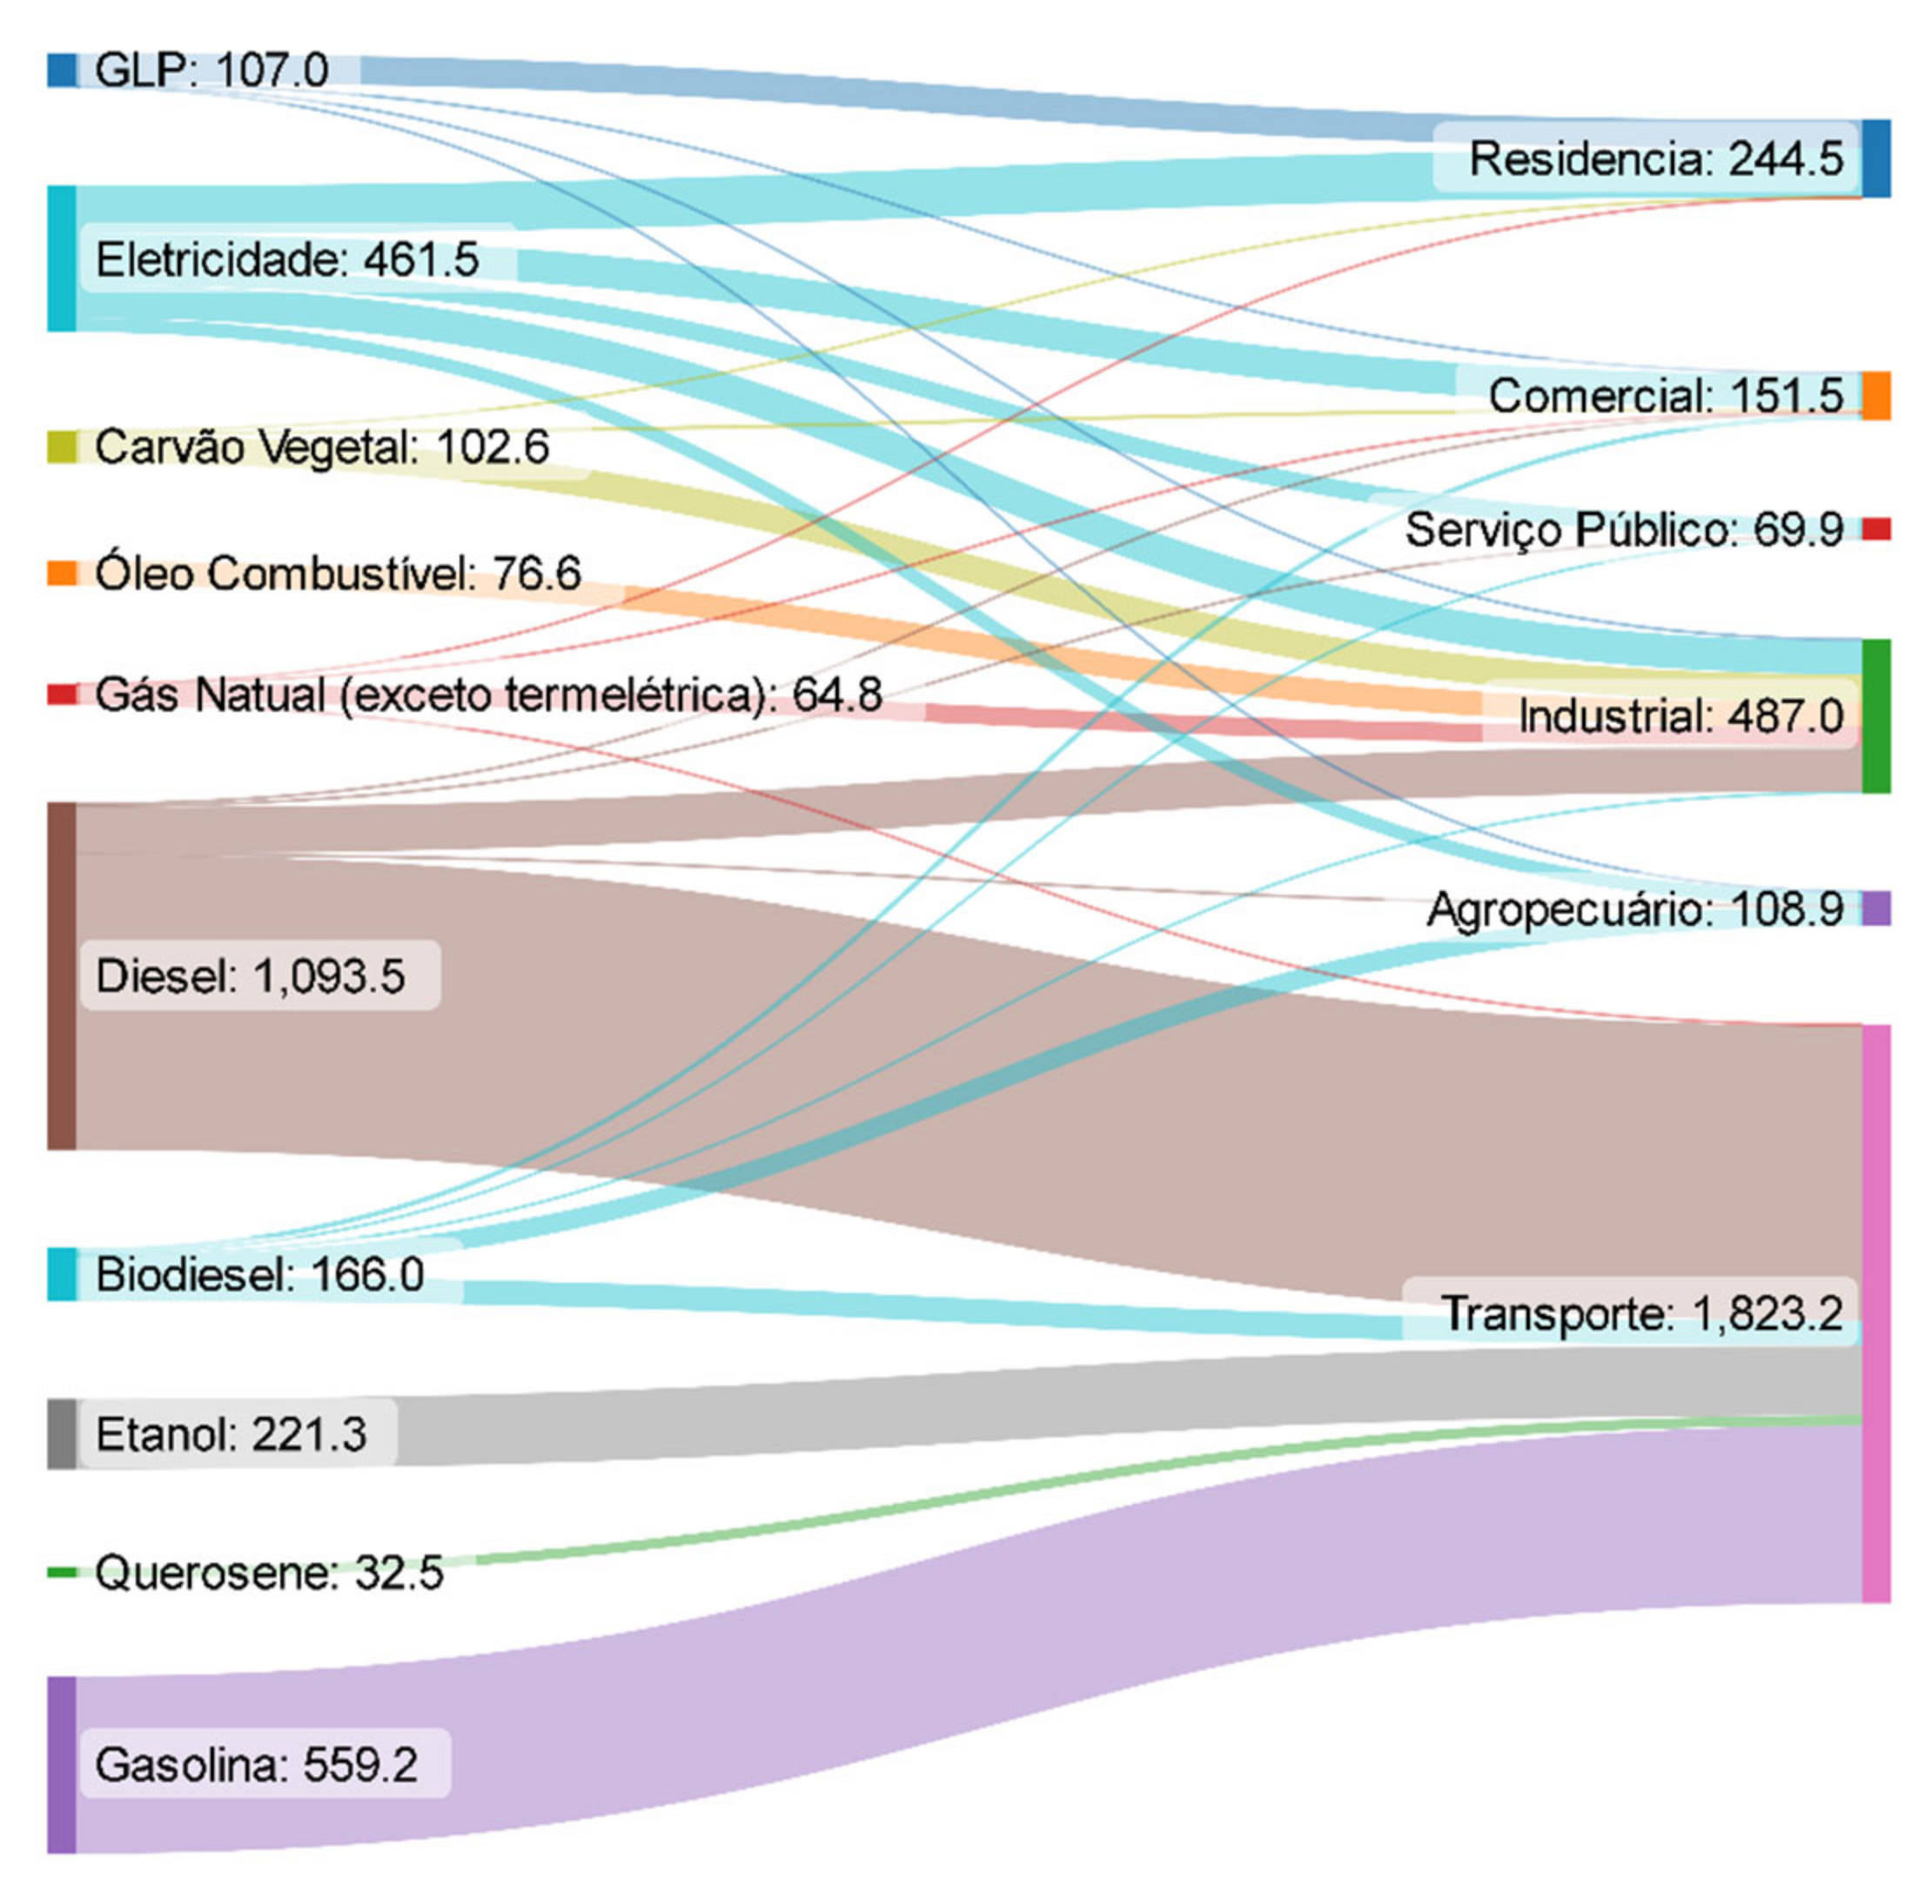
Figure 6 shows the dynamic Sankey diagram integrated into the system.
For the automatic generation of the final report (SEB), there is integration with a text editor. In the energy plan module, the reports for each year can be registered in the program, with the possibility of altering or preserving past contents if necessary.
The automated structure for preparing the SEB is shown in
Figure 7. Each chapter of the report communicates directly with Microsoft Word
® or Google Docs
®, where front matter can be edited.
6. Discussion
The Brazilian FUs played a leading role in the energy sector. However, this status changed in the 1990s due to administrative reforms. Since then, local actions related to the energy sector have been reduced. The lack of a relative role of the FUs in one of the most important economic sectors certainly implies potential losses of opportunities related to local development.
The energy sector is directly related with economic, social, and environmental development, whether by producing wealth, generation of jobs, technological development, reduction in pollution and emission of greenhouse gases, or to contribute relevantly to social well-being. The maintenance of an institutional locus, with minimally qualified staff, does not seem to be something out of the reach of states. Although there are few states that have maintained their annual publications of the SEB, these are states in different situations considering GDP per capita, size, populations, and even HDI.
Another relevant aspect to be considered is that all states, even under different circumstances, have institutional bodies that deal with the energy theme. For this reason, the production of local energy statistics will result in knowledge that may be applied to the development of local public policies. It may help to reduce energy dependency, increase energy supply and accessibility, reduce greenhouse gas emissions and promote social inclusion. In this regard, the proposed system contributes to facilitating the elaboration of the energy balance, as it allows for data entry in different units and automatically accounts for the energy flows following international standards.
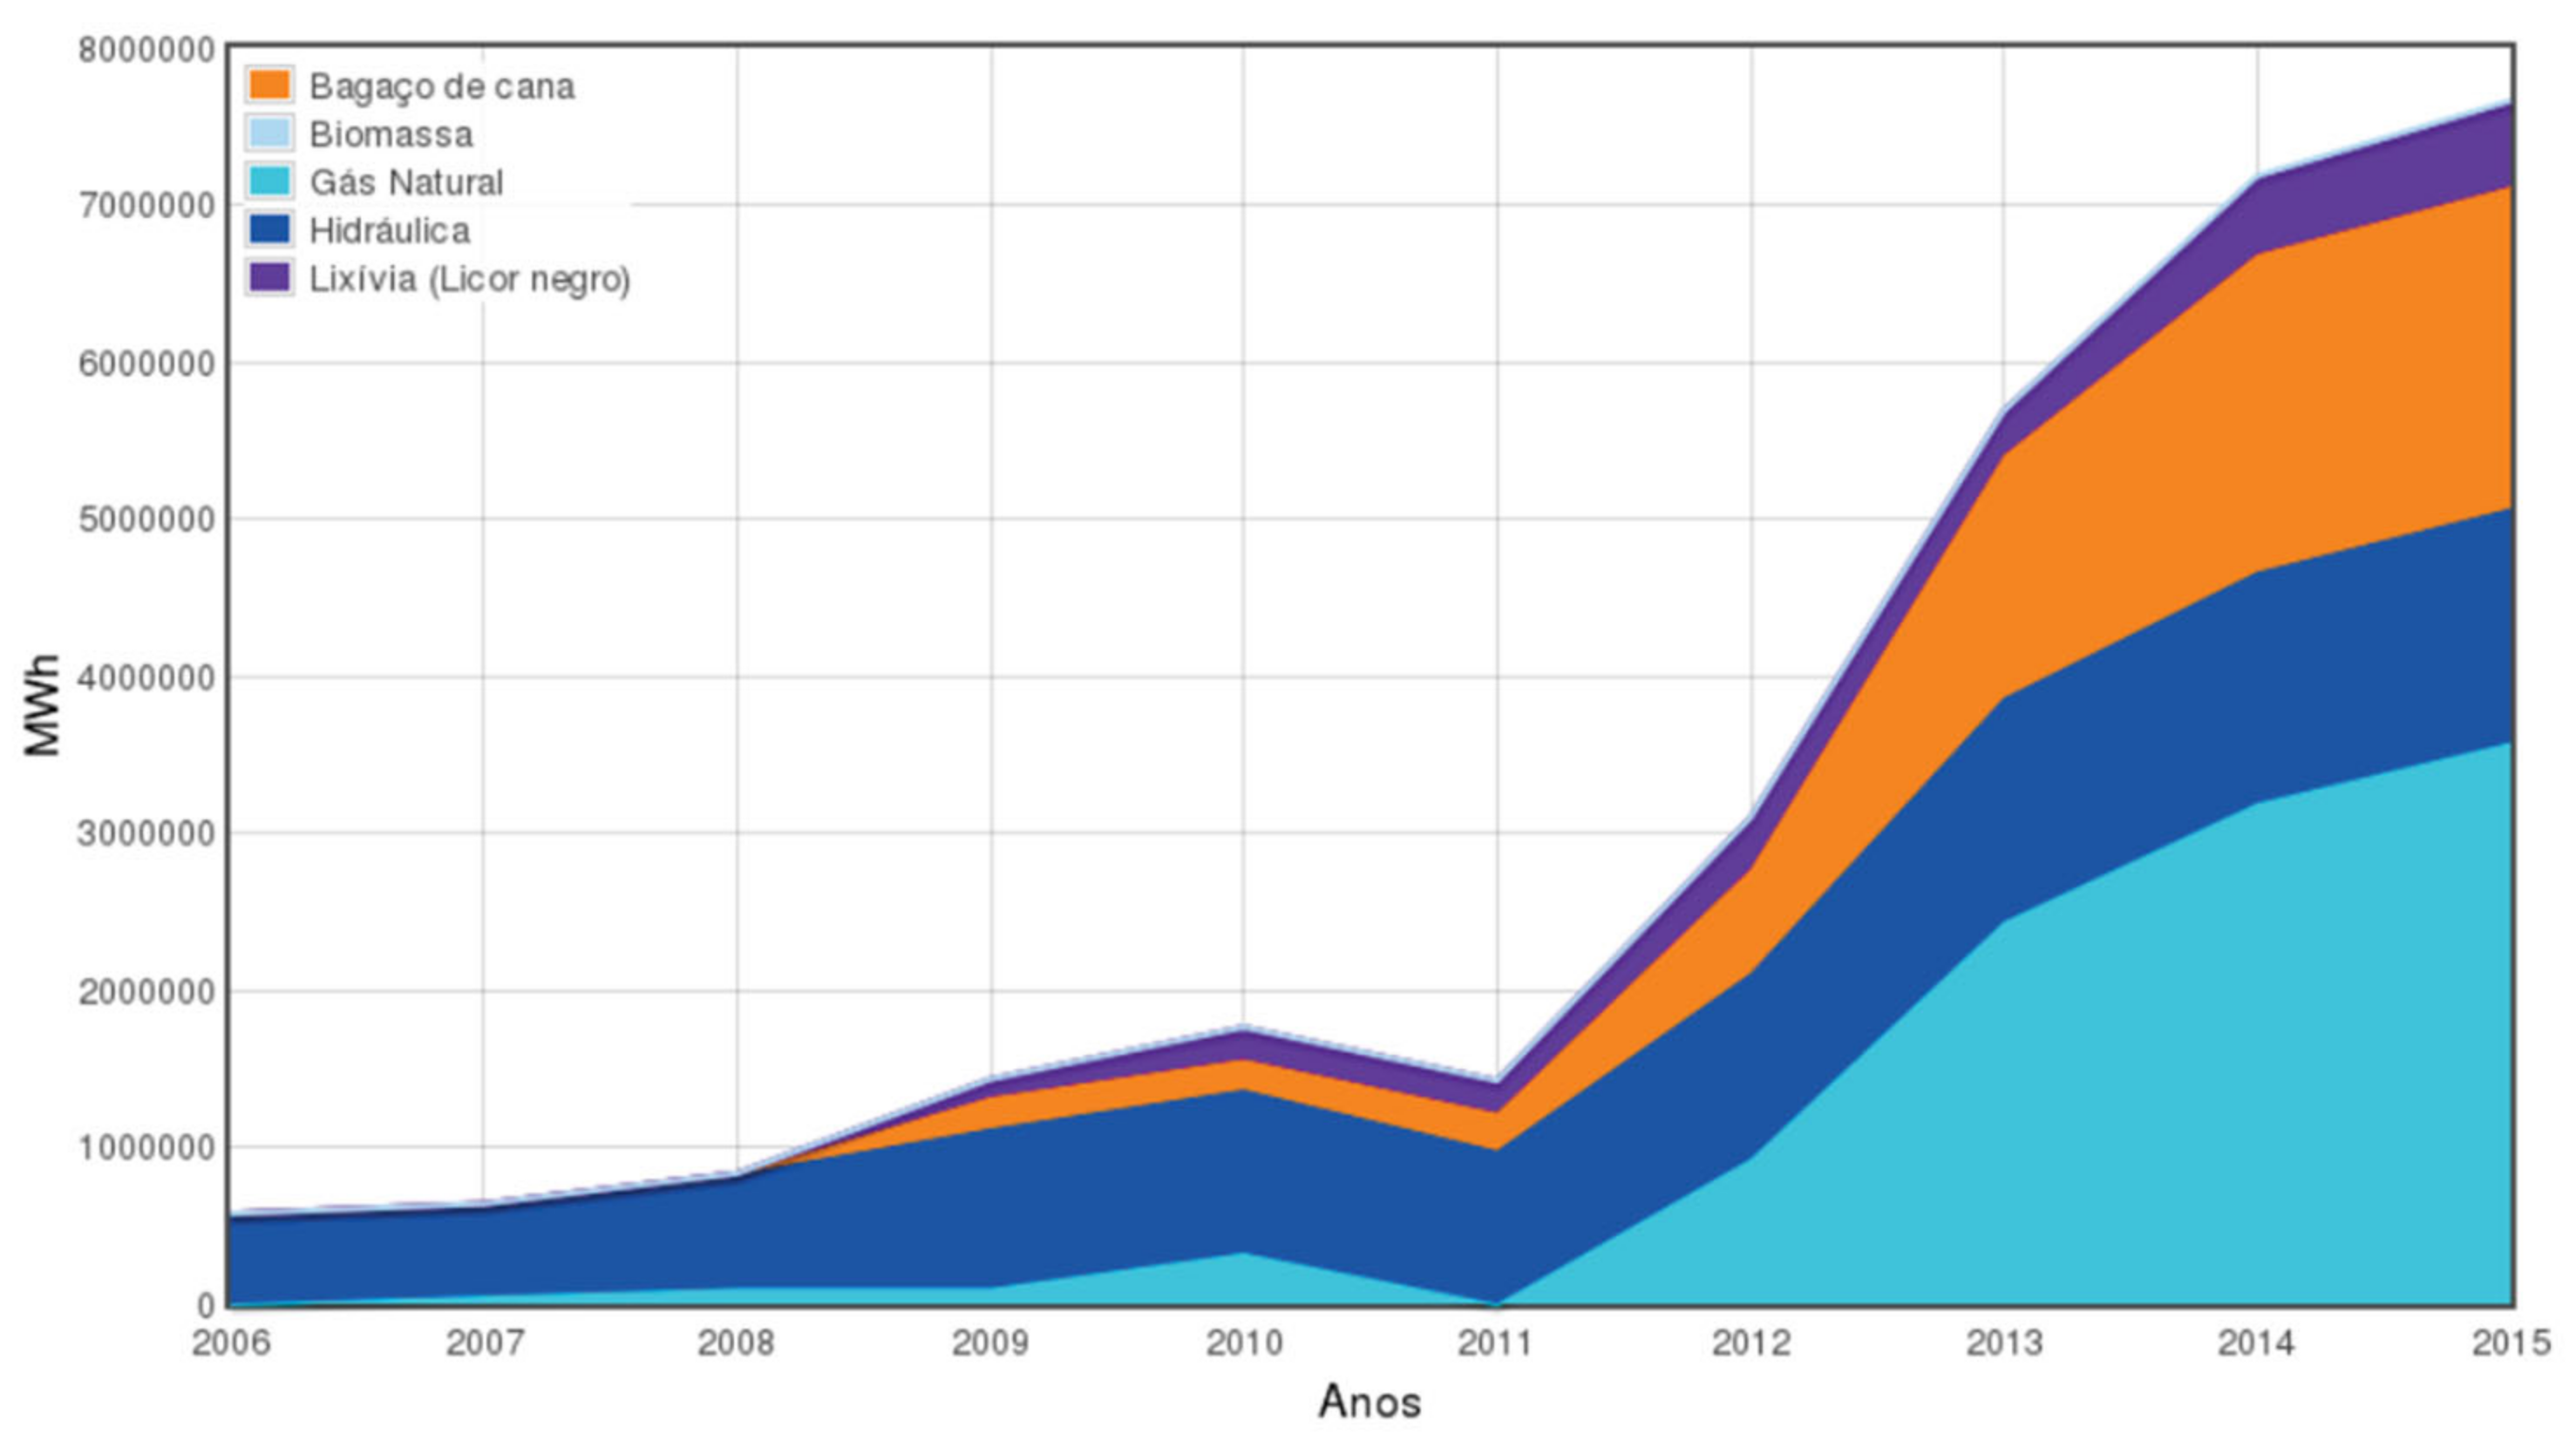
A relevant aspect of the system, in addition to the easy-to-use interface, is a data auditing mechanism, which operates integrated with different sources, ensuring data reliability. This test is performed by comparing different source of information for the same data, considering a given hierarchy between the feeders. The system was deployed in Mato Grosso do Sul state and, as aforementioned, the developed software allowed the generation of tables and graphs that make up the EB of the state, automating most of the process. An example of the resulting energy statistic for Mato Grosso do Sul can be seen in
Figure 8. Using the generated SEB, it was possible to identify that the state has increased its capacity of generating electricity. In addition, it is possible to note that the sources are mostly renewable and the sugarcane bagasse (in orange) plays an important role. This information is not directly available in the national energy balance, which emphasizes the importance of local energy statistics. The analysis of the electricity availability is essential both to attract new investors and to define the strategies to ensure a secure and affordable supply. The model developed for Mato Grosso do Sul state, which can be reproduced to all Brazilian states, is a demonstration that it is possible to publish SEBs annually, with the data conditions existing in the FUs. Nonetheless, it is fundamental to reinforce the relevance of the topic, to increase the political will to maintain the publication in each state.
7. Conclusions
The periodic publication of the EB allows the understanding of behavior and trends related to energy flows along the different production chains, giving an overview of production, conversion, import, export and final consumption activities. The information and data contained in an EB are of direct interest to a wide range of stakeholders, in addition to being of public interest due to the very relevance of the sector on people’s lives.
Most FUs in Brazil are in a situation in which they have never published or stopped publishing their respective local EBs in the last decade. The reasons for such a situation are unknown; however, it is known that accomplishing the publication of the energy report demands adequate institutional space with qualified people supported by a minimum of resources, in addition to the interest in developing public policies for the sector.
The present work was framed in this context with the purpose of providing a friendly interface and practical model to FUs in Brazil in order to support and facilitate the elaboration and publication of their EBs. The model developed was guided by international best practices, resulting in an easy-to-use software, which includes automatic conversions of energy units, different graphics styles, high-level data organization and Sankey diagrams. As a result, the software can be adopted by local governments as a tool to maintain the publication of the state’s energy balance periodically, and hence obtain the detailed information needed to manage and formulate energy policies. The generation of the energy balance of the Mato Grosso do Sul state through the software confirmed the feasibility of the model.

 ,
, 


