Article

Occurrence and Migration Mechanisms of Methane in Marine Shale Reservoirs

1
PetroChina Research Institute of Petroleum Exploration and Development, Beijing 100083, China
2
Institute of Porous Flow and Fluid Mechanics, Chinese Academy of Sciences, Langfang 065007, China
3
School of Earth and Space Sciences, Peking University, Beijing 100871, China
*
Authors to whom correspondence should be addressed.
Energies 2022, 15(23), 9043; https://doi.org/10.3390/en15239043
Submission received: 29 September 2022 / Revised: 14 November 2022 / Accepted: 17 November 2022 / Published: 29 November 2022

Abstract

:
The occurrence mechanism of methane is very important as evaluating the gas-bearing properties of marine shale reservoirs, and the evaluation of the development effect of shale gas wells need to focus on the migration mechanism of methane. In this study, LTNA technology and NMR technology were used to analyze the pores and methane of shale. The results show that inorganic pores have better connectivity, larger pore size, and micro–nano cracks between pores compared to organic pores. Most of the pores in shale are micropores and mesopores, which provide most of the specific surface area, but the contribution of macropores to pore volume cannot be ignored. Adsorbed gas volume depends on the pore surface area and gas pressure, while free gas volume depends on pore volume and gas pressure. The pore structure of micropores and mesopores is complex, and the specific surface area is large. The dispersion force between pore surface molecules and methane molecules is firm, which makes the pore wall an ideal enrichment space for adsorbed gas. Macropores have larger pore volumes and can store more free gas. In the process of gas well development, free gas is first discharged from pores under the action of the pressure gradient. As the pore pressure is lower than the critical desorption pressure, adsorbed gas begins to desorb in large quantities. It should be noted that the desorption process of adsorbed gas is slow and persistent, which makes it impossible for gas wells to achieve higher recovery in a shorter production cycle. Therefore, improving the recovery rate of adsorbed gas is the key to future research on shale gas development effects. This study is helpful in clarifying the occurrence and migration mechanism of methane in marine shale reservoirs and guiding the development of gas wells.

1. Introduction

Studying shale gas’s adsorption and migration mechanism in marine shale reservoirs is of great significance for guiding shale gas development. The rock skeleton of marine shale includes organic matter, clay minerals, and brittle minerals, and the pore structure is composed of a complex micro–nano pore network [1]. Methane (CH4) is the major component of shale gas, but there are also small amounts of CO2, N2, ethane (C2H6), and other gases in shale gas [2,3]. Biogenic CH4 in marine shale is produced by anaerobic biodegradation of organic matter [4]. Shale gas takes shale pores as the occurrence space. In these pores, part of the gas exists in the free space of the pores as a free state to form free gas, and part of the gas occupies the adsorption site on the pore surface as an adsorption state to form adsorption gas [5,6]. The occurrence mechanism of adsorbed methane in shale reservoirs is determined by the fundamental properties of the micro–nano pore-fracture system and the adsorbed gas is concentrated on the surface of micropores and mesopores. The amount of adsorbed gas mainly depends on the specific surface area of the pores and is also affected by TOC content, temperature, pressure, and water content. Free methane accumulates in mesopores and macropores with high density in the supercritical state. The free gas content is affected by reservoir space, pore structure, burial depth, formation temperature and pressure, supercritical fluid properties, and shale water content. As the storage space of shale gas, pores also play the role of the gas migration channel. The migration mechanism of methane in marine shale reservoirs is the basis for studying the development effect of gas wells. It is of great significance to clarify the mobilization characteristics of methane in pores–fractures–wellbores to guide the development of shale gas wells. The permeability of marine shale is generally in the range of 10−18~10−21 m2, and the pore scale is distributed between a few nanometers and hundreds of nanometers. The average free path of gas molecules is close to the pore scale. The collision between gas molecules and pore walls has a significant impact on gas flow, and the traditional Darcy’s law is no longer applicable. Methane migration in marine shale results from multiple mechanisms (viscous flow, molecular diffusion, Knudsen diffusion, and desorption of adsorbed gas) [7,8]. Gas flow in shale reservoirs is driven by a pressure gradient between macropores and hydraulically fractured macrofractures. Free gas is expelled from the pores by viscous flow and Knudsen diffusion, and as the pressure in the pores decreases, the gas adsorbed in the shale matrix is gradually desorbed to recharge the free gas in the pores [9]. Due to the deep burial of shale reservoirs (hundreds of meters to thousands of meters), the overlying pressure is large; the attenuation of reservoir pressure causes the compression of shale reservoirs, the pore size decreases, and the inherent permeability of shale also decreases.
Many scholars have found a positive correlation between shale porosity and total gas content [10,11]. The micro–nano pore structure characteristics of marine shale can be analyzed by low-temperature nitrogen adsorption (LTNA) and high-pressure mercury injection technology. It can be found that the nanopore structure of shale is complex and mainly composed of flat pores. The pore size is concentrated between 2~30 nm. Pore volume is mainly controlled by mesopores, and specific surface area is mainly controlled by micropores and mesopores [12]. The volume and pore size distribution of rock pores can significantly affect the occurrence of shale gas, especially free gas [13]. Laminar infiltration and capillary condensation of gas mainly occur in mesopores and macropores, which are conducive to the storage of free gas. The content of free gas is positively correlated with pore volume and gas pressure. Adsorption is an important mechanism of shale gas accumulation, which determines the enrichment characteristics of shale gas to some extent [14]. According to different reservoir characteristics, absorbed gas accounts for 20~85% of the total gas volume [15,16,17]. Compared with macropores, micropores and mesopores have a larger specific surface area. Microporous and mesoporous wall spacing is small, with high adsorption potential. Therefore, the interaction between the pore surface and the adsorbate molecules is stronger, and the adsorption capacity of the gas molecules is stronger [18]. The pore size of shale pores ranges from several nanometers to hundreds of nanometers. The pore shapes are divided into flat and cylindrical and other irregular shapes [19,20]. The complexity of the pore structure and unique occurrence mechanism of shale gas leads to the complexity of gas migration [21,22]. Conventional gas flow equations are not ready to describe gas migration in micro/nanopores of shale reservoirs due to adsorption–desorption and microscale effects [23]. In terms of adsorption, the desorption of adsorbed gas contributes a lot to gas well production. A large amount of adsorbed gas occupies the pore surface and diffuses on the pore surface under the action of the concentration gradient, which contributes to the slip and diffusion of free gas in the seepage channel [24,25,26].
The mechanism of methane occurrence is an important basis for evaluating reservoir gas content. The evaluation of the shale gas well development effect must pay attention to the methane migration mechanism. A core scale simulation experiment is an effective means to understand the development law of shale gas. Therefore, this study analyzes the pore size distribution characteristics of shale through the LTNA experiment and then uses NMR technology to monitor the saturated gas production process of shale to quantitative analysis of methane. Clarifying the occurrence mechanism of shale gas is helpful in accurately evaluating the gas content of marine shale and calculating the reserves of target reservoirs. In order to assess the law of gas production in the development process of shale gas wells and then build development strategies, researchers must understand the migration mechanism of shale gas. This study considers methane occurrence and migration characteristics in pores of different scales. Introducing NMR technology allows quantitative analysis of methane, which provides theoretical support for the selection and efficient development of shale gas wells.

2. Theory

2.1. Nuclear Magnetic Resonance Technology

NMR analysis of shale reservoir properties and fluid characteristics is based on a study of the response of hydrogen nuclei in media such as water and methane in a magnetic field [27,28,29]. A hydrogen nucleus spins in a magnetic field, producing a measurable signal reflected in different amplitudes, called a relaxation time spectrum [30]. NMR relaxation time is divided into longitudinal relaxation time (T1) and transverse relaxation time (T2) [31]. T1 and T2 measurements can obtain approximate sample information, and the consistency between them is good. However, compared with T1 measurement, T2 measurement has the advantages of a simple measurement process and short measurement time, so it is widely used in the study of physical reservoir properties [32].
The transverse relaxation phenomenon is affected by three different relaxation mechanisms: free relaxation (T2B), surface relaxation (T2S), and diffusion relaxation (T2D).
1 T 2 = 1 T 2 B + 1 T 2 S + 1 T 2 D .
The mechanisms of the three relaxation times are different [33,34]. Free relaxation is determined by the physical properties (such as viscosity) of the fluid, which are caused by local magnetic field fluctuations because of the random motion of the spins of adjacent hydrogen nuclei. Diffusion relaxation is caused by the self-diffusion of molecules in a gradient magnetic field. Surface relaxation is caused by the contact between the fluid and the surface of porous media. Because the pore size of shale is nanoscale, surface relaxation plays a major role.
In this study, no gradient field was applied. The experiment attempted to maintain a low internal gradient and a uniform magnetic field environment. CPMG pulse sequence measurement can minimize the influence of diffusion relaxation, so diffusion relaxation can also be ignored. Equation (1) can be simplified as
1 T 2 = 1 T 2 B + 1 T 2 S .
The free relaxation can be expressed as
1 T 2 B = D ( γ G T E ) 2 12 .
D is the methane diffusion coefficient, μm2/ms, G is the magnetic field gradient, gauss/cm, γ is the gyromagnetic ratio, rad·s−1·T−1, and TE is the echo interval, ms.
Surface relaxation is controlled by the specific surface area of shale pores (the ratio of rock pore-specific surface area to pore volume) [35]. The pore-specific surface area is positively correlated with surface relaxation. Surface relaxation time can be expressed as
1 T 2 S = ρ 2 S V .
ρ2 is the surface relaxation rate, S is the shale pore surface area, and V is the pore volume of shale.
T2 of shale pore fluids can be expressed as
1 T 2 = D ( γ G T E ) 2 12 + ρ 2 S V .
It can be seen from the above formula that the essence of studying shale reservoir characteristics based on nuclear magnetic resonance technology is to use the free relaxation characteristics and surface relaxation characteristics of hydrogen-containing fluids in shale pores and fissures to analyze the occurrence state of fluids in shale and explore the interaction mechanism between fluids and shale to reveal the comprehensive dynamic development effect of shale gas wells.

2.2. Marine Shale Reservoir Characteristics

The geological characteristics of marine shale reservoirs can be summarized as self-generation and self-accumulation, large-area continuous accumulation, low porosity, low permeability, rich in organic matter, the natural fracture development of structure and hydrocarbon generation, and four aspects of coexistence of adsorbed and free shale gas [36,37]. The composition of shale includes organic and inorganic components. Organic ingredients mainly include organic carbon, kerogen, and asphalt [38]. Organic matter will reduce the density of shale, increase the porosity of shale, provide a place for the occurrence of shale gas, increase the anisotropy of shale, change the wettability of shale, and promote gas adsorption. The microstructure and mineral content of marine shale were analyzed by SEM and XRD. It was found that the shale matrix was composed of argillaceous particles and non-argillaceous particles [39]. Muddy particles are composed of thin slices of various clay minerals such as illite, kaolinite, and chlorite. Non-mud particles are composed of quartz, calcite, and other particles. There are various kinds of pores between particles and between slices [40]. Clay minerals increase the proportion of adsorbed shale gas due to their large surface area and microscopic pores [41]. Inorganic minerals can affect the microscopic pore-fracture structure in shale, which in turn affects the gas adsorption capacity of the reservoir. Macroscopic anisotropy determines the basic physical and mechanical properties of shale reservoirs.
Pores in shale can be divided into organic pores, inorganic pores, and fracture pores [38]. According to the pore size, the pores in shale can be divided into micropores (D < 2 nm), mesopores (2 < D < 50 nm), and macropores (D > 50 nm) [42]. According to the different locations of pores, the micro–nano pores in shale reservoirs can be divided into intragranular dissolved pores, intergranular dissolved pores, interlayer micropores, matrix dissolved pores, and organic pores [43]. In this study, the pores and fractures of shale reservoirs were classified by scanning electron microscope. Pores can be divided into organic matter (bitumen/kerogen) pores, mineral pores (intragranular pores, intercrystalline pores, dissolution pores, etc.), and pores between organic matter and various minerals. According to the scale of cracks, cracks can be divided into micro cracks, small cracks, medium cracks, large cracks, and giant cracks [44]. Pores and fractures are the storage space of methane in shale reservoirs, which largely determines the shale gas reserves. In addition, pores and fractures with good connectivity are the main channels for shale gas seepage, which determines the productivity of gas wells.
Pore and fracture structure characteristics of marine shale were obtained by FIB-SEM (Figure 1). Organic matter contains many relatively isolated pores, showing poor connectivity of organic pores in shale (Figure 1a). Most organic pores have a pore size of less than 500 nm, mostly micropores and mesopores, with a diameter of less than 50 nm. These small organic pores are cylindrical or spherical and are isolated. The number of cylindrical macropores is small, and the connectivity is good. The pore size of the inorganic pores is obviously larger than that of organic pores (Figure 1b). Inorganic pores are mostly irregular cylindrical or fractured, and their distribution is relatively concentrated. Micro–nano cracks make their connectivity better than organic pores. Expanding the field of vision, it can be found that the matrix is mostly clay minerals and brittle minerals. In addition to certain organic matter, pyrite is also dispersed (Figure 1c). Further expanding the field of vision, shale organic matter distribution is relatively dispersed. Clay minerals are mixed with organic matter and brittle minerals. There are many micro–nano cracks in brittle minerals. In addition, pores and cracks are distributed in the mineral cementation (Figure 1d).

3. Samples and Methods

The marine shale of the Longmaxi Formation in the Sichuan Basin, China, was selected as the experimental sample. The experimental sample was a standard columnar sample with D = 25 mm. First, a part of the sample was pulverized into 200 mesh powder, and then LTAN was carried out to obtain the pore size distribution characteristics of shale. Then, a part of the shale sample was taken for the methane saturation–gas production experiment. The basic parameters of the sample are shown in Table 1. The sample was dried (105 °C, 48 h) before the experiment’s commencement in order to extract as much liquid water from it as possible. The methane saturation–gas production experiment was then conducted. In order to make sure that the water did not interfere with the NMR signal of methane, we first assessed the sample’s NMR base signal and then adjusted the following NMR signal based on this. The main frequency of the NMR rock sample analyzer was set to 4.520 MHz, half of the interval between the two echoes was 70 μs, the number of echoes was 512, and the average number of times was 64.
The LTNA method is suitable for studying the distribution of solid nanometer pores [45]. The LTNA of shale was carried out using the Micromeritics ASAP2420 specific surface analyzer. Firstly, the sample was vacuumized at 120 °C for 3 h, and the vacuum degree was 1.0 × 10⁻³ Pa. Then, high-purity nitrogen with a purity greater than 99.999% was used as the adsorbate, and the nitrogen adsorption amount under different relative pressures was measured at −195.8 °C. The operation process was conducted in accordance with GB/T 21650.2-2008. The nitrogen adsorption–desorption curve was plotted according to the relationship between the relative pressure and the adsorbed gas volume per unit mass sample (Figure 2a). The specific surface area of the sample was obtained according to the BET two-constant formula, the desorption curve of nitrogen was calculated using the BJH method, and the pore size distribution of the sample was finally obtained (Figure 2b).
As the relative pressure is small, the adsorption curve and desorption curve of shale rise steadily, and the desorption curve has an inflection point near P/P0 = 0.5. The adsorption curve and the desorption curve overlap, and the hysteresis loop gradually closes as the relative pressure is close to 1. According to the theory of adsorption and condensation, it shows that pores with a diameter of over 100 nm are mainly impermeable pores with one end closed. The pores with a diameter of 10–100 nm are mainly slit capillary pores and cylindrical open pores. The pores with a diameter of less than 10 nm are mainly ink bottle pores and impermeable pores with one end closed [46].
The test results show that the average pore diameter is 13.05 nm, BET specific surface area is 8.46 m2/g, and BJH total pore volume is 0.0267 mL/g. Micropores and mesopores with a pore size less than 50 nm contributed 72.86% of the pore volume and 96.66% of the specific surface area. Macropores with pore size greater than 50 nm contributed 27.14% of the pore volume and 3.34% of the specific surface area. This indicates that the pores in shale are mainly micropores and mesopores. In comparison, micropores and mesopores provide the vast majority of specific surface area, and the contribution of macropores to pore volume cannot be ignored.

4. Results

Pore structure and pore size are the major controlling factors of reserves and production [47]. Researchers usually combine mercury intrusion, liquid nitrogen, SEM, X-CT, NMR, and other test methods to characterize the full pore size distribution [48,49]. NMR also can characterize the full pore size of shale [50]. NMR is a non-destructive testing method that characterizes the pore characteristics of shale based on the information of hydrogen nuclear signals in relaxation time spectra [32]. According to Equation (3), there is a certain internal relationship between NMR T2 distribution and pore size distribution (S/V). Therefore, many researchers have used different mathematical methods or other auxiliary experimental methods to obtain the conversion coefficient between the two and realized the characterization of pore size distribution based on NMR [51,52].
In Equation (3), S/V is the reciprocal of the pore radius. The pore shape factor FS is introduced into Equation (3). Assuming that the rock is a single pore type, the expression of pore radius r of rock can be obtained by conversion.
r = ρ 2 F S T 2 .
It can be seen from Equation (6) that as long as the surface relaxation rate coefficient (ρ2) and pore shape factor (FS) of a specific shale sample are obtained, they can be converted into pore size distribution according to NMR T2 distribution of the sample. Shale pores are mostly connected cylindrical pores, so FS usually takes 2 [53]. The surface relaxation rate coefficient of shale samples can be obtained by the experimental method, which, measured by Sondergeld et al., is 0.501 μm/ms [54]. Therefore, the NMR T2 distribution of shale can be transformed into pore size distribution (Figure 3).
The relaxation time of adsorbed gas and free gas is different. This feature can distinguish the type of shale gas and then analyze the content and proportion of adsorbed gas and free gas, respectively. The transverse relaxation time T2 has a corresponding relationship with the pore size. According to this relationship, shale gas can be divided into adsorbed gas, mesoporous-free gas, and macroporous-free gas.
The T2 spectrum of shale samples in the process of saturated methane shows obvious three-peak distribution characteristics (Figure 4a). The first peak is called the adsorbed gas peak. The part between 0.01 ms < T2 < 1.00 ms, the peak at T2 = 0.10 ms, shows that the adsorbed gas distributes in the pores of 0.02 nm < D < 2.00 nm and is most enriched in the pores of 0.20 nm. The second peak is called the mesoporous free gas peak. This is the part between 5.78 ms < T2 < 21.54 ms and the peak appears at approximately T2 = 11.16 ms, showing that the free gas in the mesoporous is distributed in the pores of 11.56 nm < D < 43.08 nm and is most enriched in the pores with a diameter of 22.32 nm. The third peak is called the macropore-free gas peak. This part is between T2 > 21.54 ms, showing that the free gas in the macropore is distributed in pores and fractures with D > 43.08 nm.
The formation mechanisms of shale gas are in situ retention accumulation and continuous distribution [55]. Adsorbed gas not only exists in micropores but also adsorbs on the walls of mesopores and macropores [56]. Adsorbed gas shows a hydrogen nucleus signal with a low relaxation time on the NMR relaxation map. At the beginning of saturation, methane quickly enters the shale, and most of the gas exists as adsorbed gas and macropore-free gas (Figure 4b). Macropores with better connectivity and larger volume are ideal storage spaces for free gas [57]. The methane outside the shale enters the shale through the macropores and cracks with good connectivity and then fills into the pore-free space until the pressure is stable. In this process, methane will adsorb on the wall of the pores and cracks it passes to form adsorbed gas. Saturated for 1h, the saturated gas volume reached 74.31% of the saturated 25 h gas volume, and the proportions of adsorbed gas, mesoporous-free gas, and macropore-free gas were 49.26%, 7.27%, and 43.47%, respectively. At this time, adsorbed gas and macropore-free gas were the main types of methane in the sample. After 25 h of saturation, the proportions of adsorbed gas, mesoporous-free gas, and macropore-free gas were 50.64%, 7.34% and 42.02%, respectively, and the three remained basically unchanged. The content of adsorbed gas and free gas in shale samples increased simultaneously during the process of saturated methane.
At the beginning of the gas production process, the signal attenuation of the ad-sorbed gas peak and the mesoporous free gas peak was not large (Figure 5a). After 5 h of gas production, the total gas content of shale samples decreased by 32.65%, and the contents of adsorbed gas, mesoporous-free gas, and macropore-free gas decreased by 4.13%, 29.13%, and 67.89%, respectively. This shows that the adsorbed gas on the pore surface is difficult to desorb at the initial stage of gas production, and its content is relatively stable. Mesoporous free gas is partially used passively by the dual effects of capillary pressure and pressure gradient. In contrast, the signal of the macropore-free gas peak decays rapidly, showing that the free gas in macropores with good connectivity and large pore size is the major force in the initial stage of shale gas production. With the increase in gas production time, the signals of adsorbed gas peak and free gas peak in mesopores gradually decay (Figure 5b). After 50 h of gas production, the total gas content of shale samples decreased by 72.43%, and the contents of adsorbed gas, mesoporous-free gas, and macropore-free gas decreased by 46.91%, 100.00%, and 98.36%, respectively, indicating that with the decrease of pore pressure, the adsorbed gas on the pore surface began to desorb, and the free gas continued to discharge under the action of the pressure gradient.

5. Discussion

5.1. Shale Gas Occurrence Mechanism

Marine shale has a rich and complex organic–inorganic pore-fracture system (Figure 1). Adsorption is a physical process in which methane molecules combine with wall molecules of porous media under van der Waals force [58]. There are also microscopic forces between methane molecules. As the adsorption potential energy on the pore surface increases, methane molecules adsorb on the pore surface. As the kinetic energy of methane molecules increases, methane leaves the pore surface. Methane molecules are non-polar molecules, and the polarity of matrix molecules has little effect on the adsorption of methane. Therefore, the adsorption capacity of porous media to methane depends on the surface area of pores.
After saturation for 1 h (total saturation time 25 h), the total volume of saturated gas reached 74.31% of the final saturated gas volume, of which adsorbed gas accounted for 49.26% and free gas accounted for 50.74% (Figure 6). Under the action of pressure gradient, methane quickly enters the pores with good connectivity and occupies the adsorption sites on the surface of these pores. After 5 h of saturation, the saturated gas volume reached 89.29% of the final saturated gas volume, the free gas volume reached 96.32% of the final free gas volume, the adsorbed gas volume reached 82.43% of the final adsorbed gas volume, and the free gas volume accounted for 53.25% of the total gas volume. This shows that the pressure gradient is the major driving force of saturated methane in the early stage of the shale saturation process, and the free gas content increases rapidly. With the increase in saturation time, the pressure inside and outside the shale pores gradually balances, the growth rate of free gas decreases, and the adsorbed gas continues to increase. After 25 h of saturation, the adsorbed gas accounted for 50.64%, and the free gas accounted for 49.36%. Adsorbed gas becames the major form of methane in shale. This shows that the saturation capacity of shale to free gas decreases with the decrease of pressure difference inside and outside the pore, but methane can diffuse into other pore spaces and adsorb on the pore surface under the action of the concentration gradient.
The adsorbed gas in shale is dominated by monolayer adsorption and accumulation (Figure 7a). The high-density aggregation of methane molecules in the first layer is controlled by the dispersion force between the molecules on the surface of organic matter or minerals and methane molecules. As the distance between the two increases, the dispersion force decreases while the interaction between methane molecules increases, which makes the methane molecules in the outer layer (or from the second layer) gradually dissociate away from the pore wall and aggregate in a free state. The micropores and mesopores with smaller pores have a larger specific surface area, which plays a decisive role in the adsorption capacity of shale gas. The size of pore-free space and gas pressure determine the bulk density of free gas. Free gas volume is positively correlated with gas pressure and pore volume. The unit number of macropores has a larger pore volume. This is conducive to the accumulation of free gas. Molecular dynamics numerical simulation also shows that most of the methane in mesopores and macropores with a diameter greater than 5 nm is free gas, the formation pressure of deep shale reservoirs is greater, and the free gas content is higher (Figure 7b).
The dispersion force between porous media molecules and methane molecules enables methane to adsorb on the pore surface. Complex micropores and mesopores have a larger specific surface area, which provides more adsorption sites for methane, so small pores are the main enrichment space for adsorbed gas. Controlled by pore space, macropores can store more free gas. In a certain pressure range, with the increase in pressure, the amount of adsorbed gas in shale increases. After reaching adsorption saturation, the increase in pressure has little effect on the amount of adsorbed gas. The gas content of the reservoir is affected by the pore structure, buried depth, temperature and pressure, water saturation, and other factors.

5.2. Shale Gas Migration Mechanism

After 5 h of gas production, 32.65% of the gas was discharged from the shale, of which 93.59% was free gas and 6.41% was adsorbed gas; in total, 61.90% of the free gas was produced, but only 4.13% of the adsorbed gas was produced (Figure 8). This shows that at the beginning of shale gas production, free gas was the dominant type of shale gas produced, and only a small amount of adsorbed gas was produced. Therefore, the internal and external pressure difference of shale pores is the major driving force behind gas production.
Under constant temperature and pressure, the adsorption–desorption of methane on the shale pore surface is in dynamic equilibrium. When there is a pressure difference inside and outside the pore, the free gas in the free space enters the low-pressure zone from the high-pressure zone under the action of the pressure gradient, which drives the shale gas in the matrix into the wellbore to discharge the reservoir (Figure 9). The output of free gas reduces the gas pressure of pores, and the adsorption–desorption equilibrium of methane is broken. The researchers found that only when the pore pressure was less than the critical desorption pressure (12.0~18.5 MPa) did the adsorbed gas begin to desorb in large quantities [59]. Therefore, a large amount of free gas was produced in the early stage of shale gas production. When the pore pressure dropped below the critical desorption pressure, the adsorbed gas gradually desorbed into the pore-free space and continued to produce under the action of the concentration gradient.
It should be noted that the desorption of adsorbed gas was slow and persistent. After 50 h, 53.09% of adsorbed gas was not produced, and adsorbed gas was more difficult to use than free gas. Wellsite production data indicate that shale gas wells have the characteristics of early high yield, fast decay rate, and long production cycle. The characteristics of low desorption rate of adsorbed gas affect the development effect of gas wells. Therefore, improving the recovery of adsorbed gas is the key to future shale gas development research.

6. Conclusions

In this study, the pore size distribution characteristics of shale were analyzed using a low-temperature nitrogen adsorption experiment, and then the saturated methane-gas production process of shale was monitored by nuclear magnetic resonance technology to quantify the methane in shale. Finally, we obtained the occurrence and migration mechanism of methane in marine shale. The conclusions of this study are as follows.
(1)
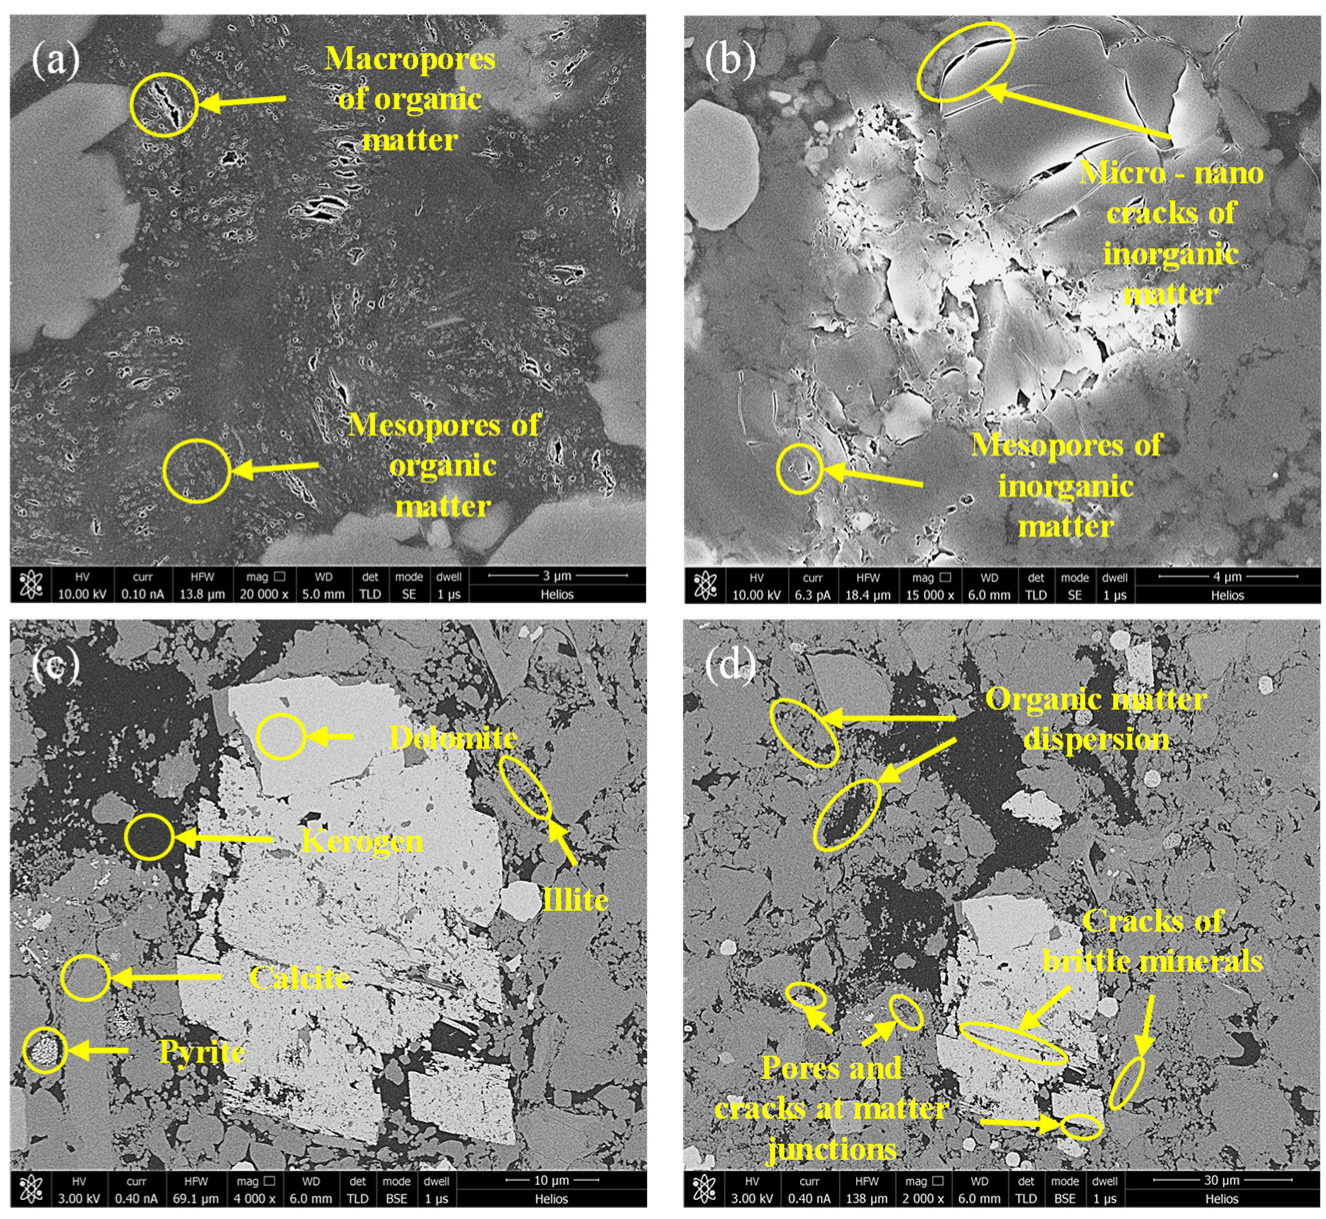
Marine shale reservoirs have many organic matter pores and poor connectivity. Most organic pores are cylindrical or spherical micropores and mesopores (less than 50 nm in diameter). The pore size of inorganic pores is obviously larger, and the connectivity is better, mostly irregular cylindrical or flat. There are many micro–nano cracks in brittle minerals. In addition, there are many pores and cracks in the mineral cementation. According to the LTNA test results, most of the shale pores are micropores and mesopores, which provide the vast majority of specific surface areas. In addition, the contribution of macropores to pore volume cannot be ignored.
(2)
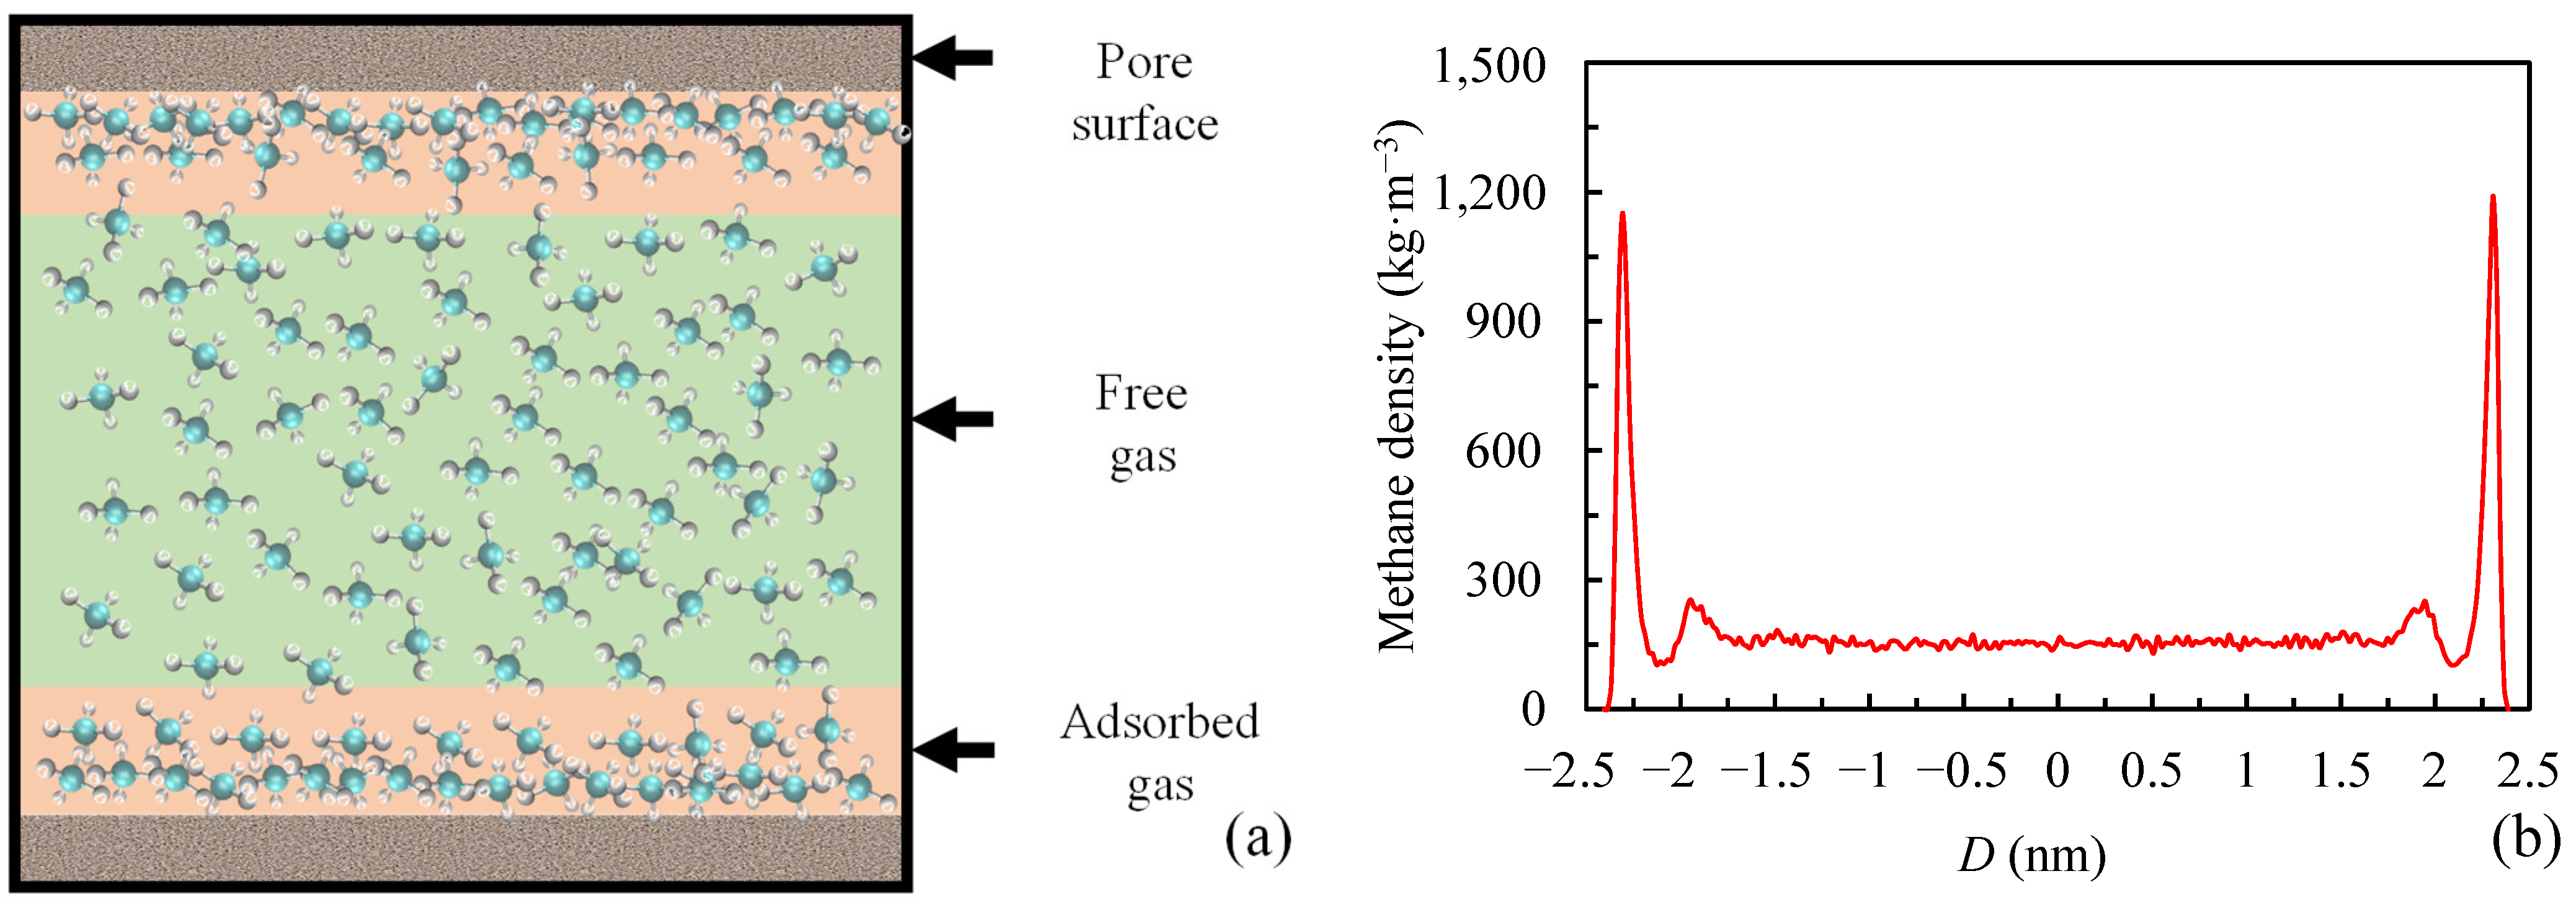
The adsorption of methane is controlled by dispersion force between pore surface molecules and methane molecules. Dispersion force is negatively correlated with distance. The binding effect of the outer methane is weakened, and free gas is gradually separated from the hole wall. Adsorbed gas volume depends on the pore surface area and gas pressure, and the free gas volume depends on the pore volume and gas pressure. Micropores and mesopores with complex structures and large specific surface areas can provide more adsorption sites for methane, which are the major enrichment spaces of adsorbed gas. Macropores with large pore volumes are the ideal space for free gas.
(3)
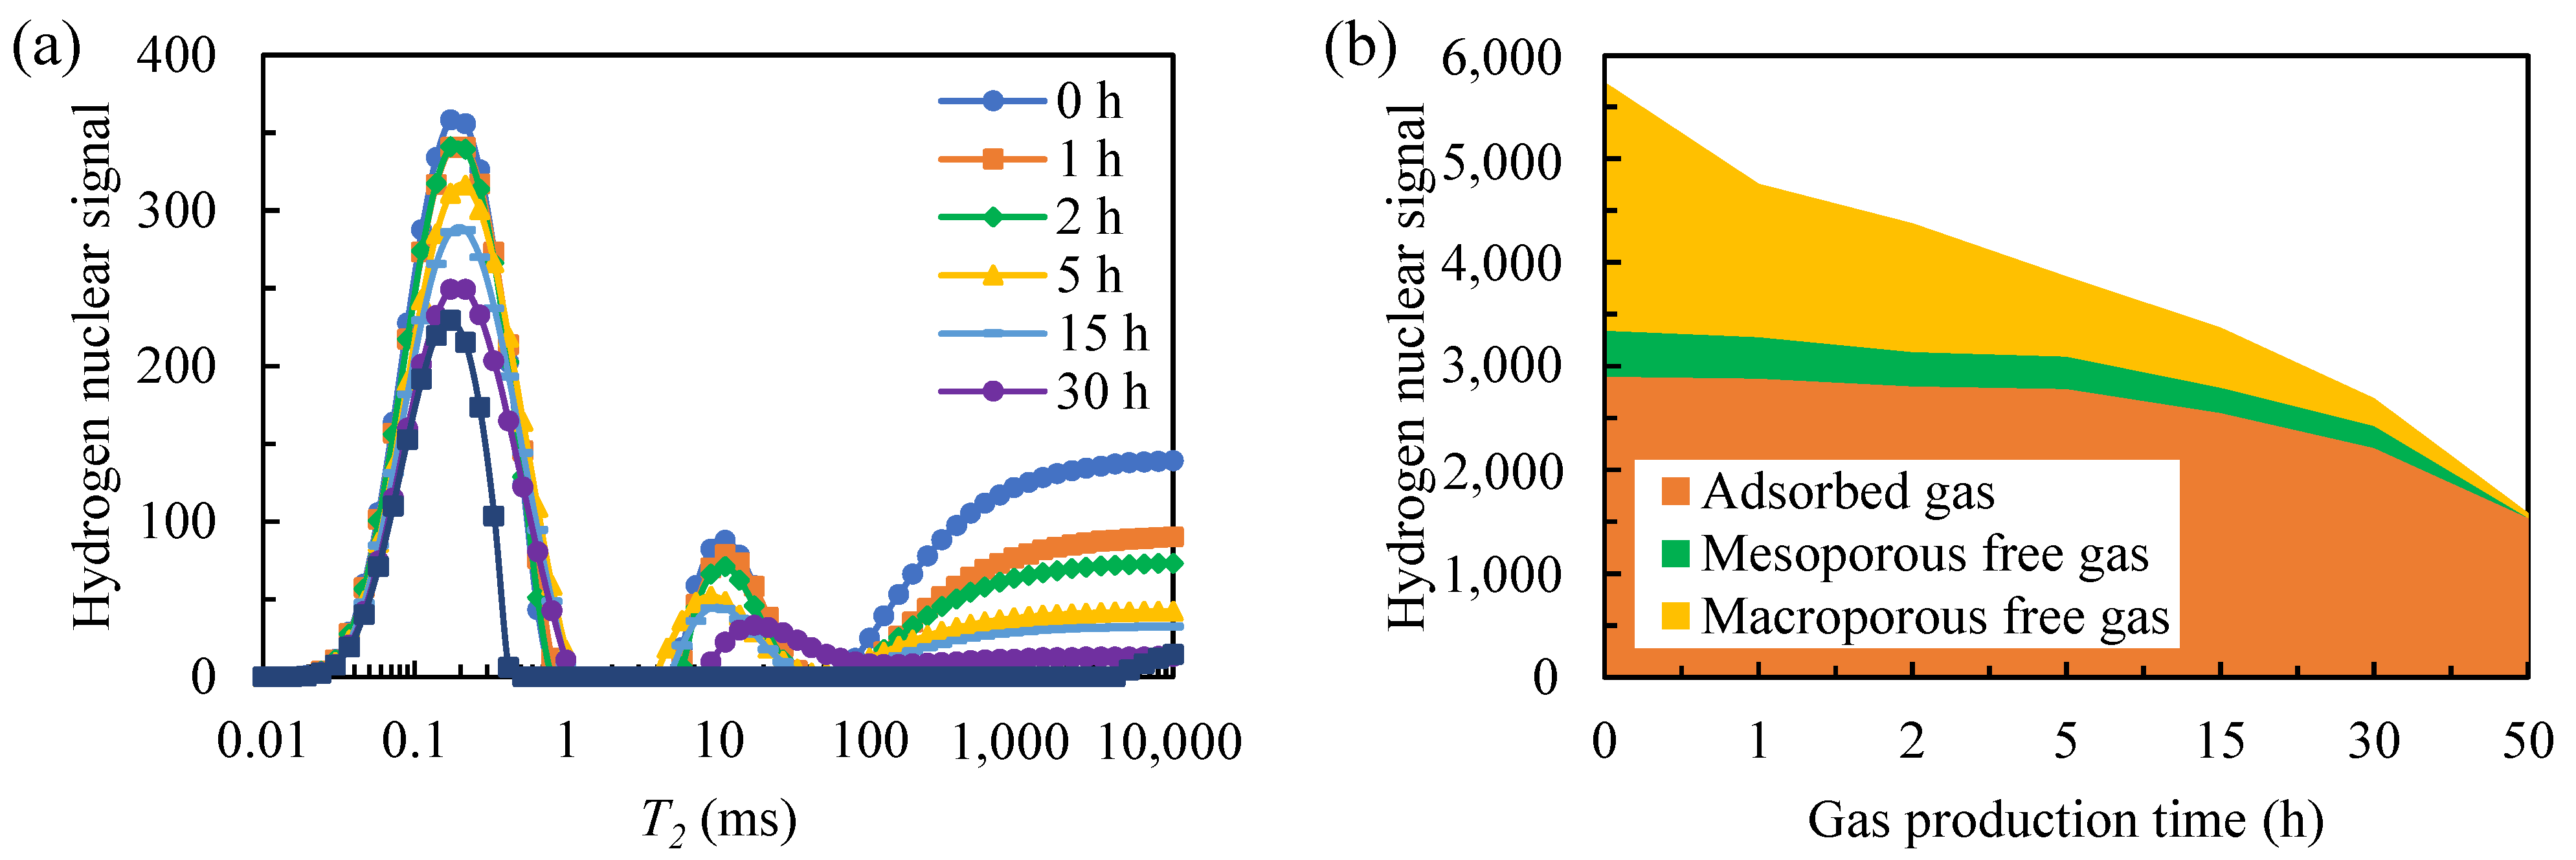
Under constant temperature and pressure conditions, the adsorption–desorption of methane is in a dynamic equilibrium state. The free gas first enters the low-pressure zone from the high-pressure zone under the action of the pressure difference inside and outside the pore. When the pore pressure is lower than the critical desorption pressure, the adsorption–desorption equilibrium of methane is broken, and the adsorbed gas begins to desorb. Therefore, a large amount of free gas is produced in the early stage of shale gas reservoir development. In the later period, adsorption gas replaces free gas to become the main gas. This makes shale gas wells generally have the characteristics of early high yield, fast decay rate and long production cycle. It should be noted that the desorption process of adsorbed gas is slow and persistent, and improving the recovery rate of shale gas adsorbed gas is the key to future shale gas development research.

Author Contributions

Conceptualization, Z.H. and Y.M.; methodology, Z.H. and Y.M.; validation, Y.M. and Q.G.; formal analysis, W.N.; investigation, X.D. and Z.W.; resources, X.D. and J.C.; data curation, Y.M.; writing—original draft preparation, Z.H. and Y.M.; writing—review and editing, Y.M. and Q.G.; project administration, Z.H.; funding acquisition, Z.H. and J.C. All authors have read and agreed to the published version of the manuscript.

Funding

This research was funded by the Prospective Basic Scientific and Technological Research Projects in the “14th Five-Year” Upstream Field of CNPC, grant number 2021DJ1905, and the Research Fund for Basic Research and Strategic Reserve Technology of Institutions directly under CNPC, grant number 2019D-500810.

Data Availability Statement

Not applicable.

Conflicts of Interest

The authors declare no conflict of interest.

References

  1. Chandra, D.; Vishal, V. A Critical Review on Pore to Continuum Scale Imaging Techniques for Enhanced Shale Gas Recovery. Earth Sci. Rev. 2021, 217, 103638. [Google Scholar] [CrossRef]
  2. Dasani, D.; Wang, Y.; Tsotsis, T.T.; Jessen, K. Laboratory-Scale Investigation of Sorption Kinetics of Methane/Ethane Mixtures in Shale. Ind. Eng. Chem. Res. 2017, 56, 9953–9963. [Google Scholar] [CrossRef]
  3. Dang, W.; Zhang, J.C.; Tang, X.; Wei, X.L.; Li, Z.M.; Wang, C.H.; Chen, Q.; Liu, C. Investigation of Gas Content of Organic-Rich Shale: A Case Study from Lower Permian Shale in Southern North China Basin, Central China. Geosci. Front. 2018, 9, 559–575. [Google Scholar] [CrossRef]
  4. Colosimo, F.; Thomas, R.; Lloyd, J.R.; Taylor, K.G.; Boothman, C.; Smith, A.D.; Lord, R.; Kalin, R.M. Biogenic Methane in Shale Gas and Coal Bed Methane: A Review of Current Knowledge and Gaps. Int. J. Coal Geol. 2016, 165, 106–120. [Google Scholar] [CrossRef] [Green Version]
  5. Javadpour, F.; Fisher, D.; Unsworth, M. Nanoscale Gas Flow in Shale Gas Sediments. J. Can. Pet. Technol. 2007, 46, 55–61. [Google Scholar] [CrossRef]
  6. Yin, Y.; Qu, Z.G.; Zhang, J.F. An Analytical Model for Shale Gas Transport in Kerogen Nanopores Coupled with Real Gas Effect and Surface Diffusion. Fuel 2017, 210, 569–577. [Google Scholar] [CrossRef]
  7. Guo, C.; Xu, J.; Wu, K.; Wei, M.; Liu, S. Study on Gas Flow through Nano Pores of Shale Gas Reservoirs. Fuel 2015, 143, 107–117. [Google Scholar] [CrossRef]
  8. Zhang, R.H.; Zhang, L.H.; Wang, R.H.; Zhao, Y.L.; Zhang, D. liang Research on Transient Flow Theory of a Multiple Fractured Horizontal Well in a Composite Shale Gas Reservoir Based on the Finite-Element Method. J. Nat. Gas Sci. Eng. 2016, 33, 587–598. [Google Scholar] [CrossRef]
  9. Kaiser, M.J. Profitability Assessment of Haynesville Shale Gas Wells. Energy 2012, 38, 315–330. [Google Scholar] [CrossRef]
  10. Ross, D.J.K.; Bustin, R.M. Shale Gas Potential of the Lower Jurassic Gordondale Member, Northeastern British Columbia, Canada. Bull. Can. Pet. Geol. 2007, 55, 51–75. [Google Scholar] [CrossRef]
  11. Chalmers, G.R.L.; Bustin, R.M. Lower Cretaceous Gas Shales in Northeastern British Columbia, Part II: Evaluation of Regional Potential Gas Resources. Bull. Can. Pet. Geol. 2008, 56, 22–61. [Google Scholar] [CrossRef]
  12. Liu, S.; Sang, S.; Wang, G.; Ma, J.; Wang, X.; Wang, W.; Du, Y.; Wang, T. FIB-SEM and X-Ray CT Characterization of Interconnected Pores in High-Rank Coal Formed from Regional Metamorphism. J. Pet. Sci. Eng. 2017, 148, 21–31. [Google Scholar] [CrossRef] [Green Version]
  13. Raut, U.; Famá, M.; Teolis, B.D.; Baragiola, R.A. Characterization of Porosity in Vapor-Deposited Amorphous Solid Water from Methane Adsorption. J. Chem. Phys. 2007, 127, 204713. [Google Scholar] [CrossRef] [PubMed] [Green Version]
  14. Loucks, R.G.; Reed, R.M.; Ruppel, S.C.; Jarvie, D.M. Morphology, Genesis, and Distribution of Nanometer-Scale Pores in Siliceous Mudstones of the Mississippian Barnett Shale. J. Sediment. Res. 2009, 79, 848–861. [Google Scholar] [CrossRef] [Green Version]
  15. Martini, A.M.; Walter, L.M.; Ku, T.C.W.; Budai, J.M.; McIntosh, J.C.; Schoell, M. Microbial Production and Modification of Gases in Sedimentary Basins: A Geochemical Case Study from a Devonian Shale Gas Play, Michigan Basin. Am. Assoc. Pet. Geol. Bull. 2003, 87, 1355–1375. [Google Scholar] [CrossRef]
  16. Montgomery, S.L.; Jarvie, D.M.; Bowker, K.A.; Pollastro, R.M. Mississippian Barnett Shale, Fort Worth Basin, North-Central Texas: Gas-Shale Play with Multi–Trillion Cubic Foot Potential. Am. Assoc. Pet. Geol. Bull. 2005, 89, 155–175. [Google Scholar] [CrossRef]
  17. Bowker, K.A. Barnett Shale Gas Production, Fort Worth Basin: Issues and Discussion. Am. Assoc. Pet. Geol. Bull. 2007, 91, 523–533. [Google Scholar] [CrossRef]
  18. Lozano-Castelló, D.; Alcañiz-Monge, J.; de La Casa-Lillo, M.A.; Cazorla-Amorós, D.; Linares-Solano, A. Advances in the Study of Methane Storage in Porous Carbonaceous Materials. Fuel 2002, 81, 1777–1803. [Google Scholar] [CrossRef]
  19. Wang, Y.; Zhu, Y.; Chen, S.; Li, W. Characteristics of the Nanoscale Pore Structure in Northwestern Hunan Shale Gas Reservoirs Using Field Emission Scanning Electron Microscopy, High-Pressure Mercury Intrusion, and Gas Adsorption. Energy Fuels 2014, 28, 945–955. [Google Scholar] [CrossRef]
  20. Liu, J.; Li, P.; Sun, Z.; Lu, Z.; Du, Z.; Liang, H.; Lu, D. A New Method for Analysis of Dual Pore Size Distributions in Shale Using Nitrogen Adsorption Measurements. Fuel 2017, 210, 446–454. [Google Scholar] [CrossRef]
  21. Moridis, G.J.; Blasingame, T.A.; Freeman, C.M. Analysis of Mechanisms of Flow in Fractured Tight-Gas and Shale-Gas Reservoirs. SPE Lat. Am. Caribb. Pet. Eng. Conf. Proc. 2010, 2, 1310–1331. [Google Scholar] [CrossRef] [Green Version]
  22. Lin, D.; Wang, J.; Yuan, B.; Shen, Y. Review on Gas Flow and Recovery in Unconventional Porous Rocks. Adv. Geo-Energy Res. 2017, 1, 39–53. [Google Scholar] [CrossRef]
  23. Roy, S.; Raju, R.; Chuang, H.F.; Cruden, B.A.; Meyyappan, M. Modeling Gas Flow through Microchannels and Nanopores. J. Appl. Phys. 2003, 93, 4870. [Google Scholar] [CrossRef]
  24. Freeman, C.M.; Moridis, G.J.; Blasingame, T.A. A Numerical Study of Microscale Flow Behavior in Tight Gas and Shale Gas Reservoir Systems. Transp. Porous Media 2011, 90, 253–268. [Google Scholar] [CrossRef]
  25. Sheng, M.; Li, G.; Huang, Z.; Tian, S. Shale Gas Transient Flow Model with Effects of Surface Diffusion. Acta Pet. Sin. 2014, 35, 347. [Google Scholar] [CrossRef]
  26. Wu, K.; Li, X.; Wang, C.; Yu, W.; Chen, Z. A Model for Surface Diffusion of Adsorbed Gas in Nanopores of Shale Gas Reservoirs. Proc. Annu. Offshore Technol. Conf. 2015, 1, 199–221. [Google Scholar] [CrossRef]
  27. Mitchell, J.; Fordham, E.J. Contributed Review: Nuclear Magnetic Resonance Core Analysis at 0.3 T. Rev. Sci. Instrum. 2014, 85, 111502. [Google Scholar] [CrossRef]
  28. Mu, Y.; Hu, Z.; Chang, J.; Duan, X.; Li, Y.; Li, Y.; Niu, W. Effect of Water Occurrence on Shale Seepage Ability. J. Pet. Sci. Eng. 2021, 204, 108725. [Google Scholar] [CrossRef]
  29. Mu, Y.; Hu, Z.; Shen, R.; Chang, J.; Duan, X.; Li, Y.; Guo, Q. Water Occurrence Characteristics of Gas Shale Based on 2D NMR Technology. Energy Fuels 2022, 36, 910–921. [Google Scholar] [CrossRef]
  30. Washburn, K.E.; Birdwell, J.E. Updated Methodology for Nuclear Magnetic Resonance Characterization of Shales. J. Magn. Reson. 2013, 233, 17–28. [Google Scholar] [CrossRef]
  31. Zhang, P.; Lu, S.; Li, J.; Chang, X. 1D and 2D Nuclear Magnetic Resonance (NMR) Relaxation Behaviors of Protons in Clay, Kerogen and Oil-Bearing Shale Rocks. Mar. Pet. Geol. 2020, 114, 104210. [Google Scholar] [CrossRef]
  32. Liu, Z.; Liu, D.; Cai, Y.; Yao, Y.; Pan, Z.; Zhou, Y. Application of Nuclear Magnetic Resonance (NMR) in Coalbed Methane and Shale Reservoirs: A Review. Int. J. Coal Geol. 2020, 218, 103261. [Google Scholar] [CrossRef]
  33. Fleury, M.; Romero-Sarmiento, M. Characterization of Shales Using T1–T2 NMR Maps. J. Pet. Sci. Eng. 2016, 137, 55–62. [Google Scholar] [CrossRef] [Green Version]
  34. Zhang, Z.; Qin, Y.; Zhuang, X.; Li, G.; Wang, X. Poroperm Characteristics of High-Rank Coals from Southern Qinshui Basin by Mercury Intrusion, SEM-EDS, Nuclear Magnetic Resonance and Relative Permeability Analysis. J. Nat. Gas Sci. Eng. 2018, 51, 116–128. [Google Scholar] [CrossRef]
  35. Zheng, S.; Yao, Y.; Liu, D.; Cai, Y.; Liu, Y. Characterizations of Full-Scale Pore Size Distribution, Porosity and Permeability of Coals: A Novel Methodology by Nuclear Magnetic Resonance and Fractal Analysis Theory. Int. J. Coal Geol. 2018, 196, 148–158. [Google Scholar] [CrossRef]
  36. Zou, C.; Dong, D.; Wang, S.; Li, J.; Li, X.; Wang, Y.; Li, D.; Cheng, K. Geological Characteristics and Resource Potential of Shale Gas in China. Pet. Explor. Dev. 2010, 37, 641–653. [Google Scholar] [CrossRef]
  37. Zhao, W.; Li, J.; Yang, T.; Wang, S.; Huang, J. Geological Difference and Its Significance of Marine Shale Gases in South China. Pet. Explor. Dev. 2016, 43, 547–559. [Google Scholar] [CrossRef]
  38. Ji, W.; Song, Y.; Rui, Z.; Meng, M.; Huang, H. Pore Characterization of Isolated Organic Matter from High Matured Gas Shale Reservoir. Int. J. Coal Geol. 2017, 174, 31–40. [Google Scholar] [CrossRef]
  39. Chen, S.; Han, Y.; Fu, C.; Zhang, H.; Zhu, Y.; Zuo, Z. Micro and Nano-Size Pores of Clay Minerals in Shale Reservoirs: Implication for the Accumulation of Shale Gas. Sediment. Geol. 2016, 342, 180–190. [Google Scholar] [CrossRef]
  40. Wilson, M.J.; Shaldybin, M.V.; Wilson, L. Clay Mineralogy and Unconventional Hydrocarbon Shale Reservoirs in the USA. I. Occurrence and Interpretation of Mixed-Layer R3 Ordered Illite/Smectite. Earth Sci. Rev. 2016, 158, 31–50. [Google Scholar] [CrossRef]
  41. Feng, D.; Li, X.; Wang, X.; Li, J.; Sun, F.; Sun, Z.; Zhang, T.; Li, P.; Chen, Y.; Zhang, X. Water Adsorption and Its Impact on the Pore Structure Characteristics of Shale Clay. Appl. Clay Sci. 2018, 155, 126–138. [Google Scholar] [CrossRef]
  42. Davudov, D.; Moghanloo, R.G. Impact of Pore Compressibility and Connectivity Loss on Shale Permeability. Int. J. Coal Geol. 2018, 187, 98–113. [Google Scholar] [CrossRef]
  43. Zou, C.; Dong, D.; Wang, Y.; Li, X.; Huang, J.; Wang, S.; Guan, Q.; Zhang, C.; Wang, H.; Liu, H.; et al. Shale Gas in China: Characteristics, Challenges and Prospects (I). Pet. Explor. Dev. 2015, 42, 753–767. [Google Scholar] [CrossRef]
  44. He, J.; Li, X.; Yin, C.; Zhang, Y.; Lin, C. Propagation and Characterization of the Micro Cracks Induced by Hydraulic Fracturing in Shale. Energy 2020, 191, 116449. [Google Scholar] [CrossRef]
  45. Liu, X.; Xiong, J.; Liang, L. Investigation of Pore Structure and Fractal Characteristics of Organic-Rich Yanchang Formation Shale in Central China by Nitrogen Adsorption/Desorption Analysis. J. Nat. Gas Sci. Eng. 2015, 22, 62–72. [Google Scholar] [CrossRef]
  46. Yang, F.; Ning, Z.; Liu, H. Fractal Characteristics of Shales from a Shale Gas Reservoir in the Sichuan Basin, China. Fuel 2014, 115, 378–384. [Google Scholar] [CrossRef]
  47. Chen, Y.; Jiang, C.; Leung, J.Y.; Wojtanowicz, A.K.; Zhang, D. Multiscale Characterization of Shale Pore-Fracture System: Geological Controls on Gas Transport and Pore Size Classification in Shale Reservoirs. J. Pet. Sci. Eng. 2021, 202, 108442. [Google Scholar] [CrossRef]
  48. Zhang, J.; Tang, Y.; He, D.; Sun, P.; Zou, X. Full-Scale Nanopore System and Fractal Characteristics of Clay-Rich Lacustrine Shale Combining FE-SEM, Nano-CT, Gas Adsorption and Mercury Intrusion Porosimetry. Appl. Clay Sci. 2020, 196, 105758. [Google Scholar] [CrossRef]
  49. Gou, Q.; Xu, S.; Hao, F.; Yang, F.; Zhang, B.; Shu, Z.; Zhang, A.; Wang, Y.; Lu, Y.; Cheng, X.; et al. Full-Scale Pores and Micro-Fractures Characterization Using FE-SEM, Gas Adsorption, Nano-CT and Micro-CT: A Case Study of the Silurian Longmaxi Formation Shale in the Fuling Area, Sichuan Basin, China. Fuel 2019, 253, 167–179. [Google Scholar] [CrossRef]
  50. Liu, Y.; Yao, Y.; Liu, D.; Zheng, S.; Sun, G.; Chang, Y. Shale Pore Size Classification: An NMR Fluid Typing Method. Mar. Pet. Geol. 2018, 96, 591–601. [Google Scholar] [CrossRef]
  51. Sigal, R.F. Pore-Size Distributions for Organic-Shale-Reservoir Rocks From Nuclear-Magnetic-Resonance Spectra Combined With Adsorption Measurements. SPE J. 2015, 20, 824–830. [Google Scholar] [CrossRef]
  52. Hun, L.; Bing, Y.; Xixiang, S.; Xinyi, S.; Lifei, D. Fracturing Fluid Retention in Shale Gas Reservoir from the Perspective of Pore Size Based on Nuclear Magnetic Resonance. J. Hydrol. 2021, 601, 126590. [Google Scholar] [CrossRef]
  53. Tan, M.; Mao, K.; Song, X.; Yang, X.; Xu, J. NMR Petrophysical Interpretation Method of Gas Shale Based on Core NMR Experiment. J. Pet. Sci. Eng. 2015, 136, 100–111. [Google Scholar] [CrossRef]
  54. Sondergeld, C.; Tinni, A.; Rai, C.; Besov, A. NMR Considerations in Shale Evaluation. In Proceedings of the SPWLA 57th Annual Logging Symposium, Reykjavik, Iceland, 25–29 June 2016. [Google Scholar]
  55. Zou, C.; Dong, D.; Wang, Y.; Li, X.; Huang, J.; Wang, S.; Guan, Q.; Zhang, C.; Wang, H.; Liu, H.; et al. Shale Gas in China: Characteristics, Challenges and Prospects (II). Pet. Explor. Dev. 2016, 43, 182–196. [Google Scholar] [CrossRef]
  56. Li, Y.; Hu, Z.; Liu, X.; Duan, X.; Gao, S.; Wang, W.; Chang, J. Pressure-Dependent Equilibrium Molecular Simulation of Shale Gas and Its Distribution and Motion Characteristics in Organic-Rich Nano-Slit. Fuel 2019, 237, 1040–1049. [Google Scholar] [CrossRef]
  57. Chen, L.; Jiang, Z.; Liu, Q.; Jiang, S.; Liu, K.; Tan, J.; Gao, F. Mechanism of Shale Gas Occurrence: Insights from Comparative Study on Pore Structures of Marine and Lacustrine Shales. Mar. Pet. Geol. 2019, 104, 200–216. [Google Scholar] [CrossRef]
  58. Chen, L.; Zuo, L.; Jiang, Z.; Jiang, S.; Liu, K.; Tan, J.; Zhang, L. Mechanisms of Shale Gas Adsorption: Evidence from Thermodynamics and Kinetics Study of Methane Adsorption on Shale. Chem. Eng. J. 2019, 361, 559–570. [Google Scholar] [CrossRef]
  59. Duan, X.; Hu, Z.; Gao, S.; Shen, R.; Liu, H.; Chang, J.; Wang, L. Shale High Pressure Isothermal Adsorption Curve and the Production Dynamic Experiments of Gas Well. Pet. Explor. Dev. 2018, 45, 127–135. [Google Scholar] [CrossRef]
Figure 1. Pore and fracture structure characteristics of marine shale. (a) Organic matter contains many pores with poor connectivity. Most organic pores are micropores and mesopores with a diameter of less than 50 nm, and the number of macropores is relatively small. (b) The connectivity of inorganic pores is better than organic pores, most of which are macropores, and there are some micro–nano cracks. (c) The matrix of marine shale is mostly clay minerals and brittle minerals. In addition to a certain amount of organic matter, pyrite is scattered. (d) Organic matter wrapped by clay minerals is scattered in shale, and micro–nano cracks connect the pores in brittle minerals. In addition, there are many pores and cracks in mineral cementation.
Energies 15 09043 g001
Figure 2. (a) Adsorption–desorption curve and (b) pore size distribution characteristics of experimental samples.
Energies 15 09043 g002
Figure 3. Relationship between T2 distribution and pore size distribution of shale. According to Equation (6), the T2 spectrum of shale can be divided into three parts: T2 < 1 ms, 1 ms < T2 < 25 ms, and T2 > 25 ms, representing the fluids containing hydrogen in micropores, mesopores, and macropores, respectively.
Energies 15 09043 g003
Figure 4. (a) T2 spectra of shale samples and (b) signals of different types of methane during methane saturation. The ranges of the adsorbed gas peak, mesopore-free gas peak, and macropore-free gas peak in the T2 spectrum are (0.01ms < T2 < 1 ms), (1ms < T2 < 25 ms), and (T2 > 25 ms), respectively.
Energies 15 09043 g004
Figure 5. (a) T2 spectrum of shale samples and (b) signals of different methane during gas production. Most of the gas produced early in gas production is the free gas in the macropores. At the late stage of gas production, the free gas in the mesopores and the adsorbed gas on the pore wall are produced.
Energies 15 09043 g005
Figure 6. The trend of (a) NMR signal and (b) proportion of different methane during saturation. In the early stage of saturation, methane enters the shale pores under the action of pressure gradient and forms adsorbed gas and free gas. With the increase in saturation time, the continuous adsorption of methane makes the proportion of adsorbed gas in shale gradually increase, and the concentration gradient becomes the major driving force for shale-saturated methane.
Energies 15 09043 g006
Figure 7. (a) Diagram of methane distribution in shale pores and (b) molecular dynamics simulation of methane density distribution curve in 5 nm graphite pore. Methane adheres to the adsorption sites on the pore surface to form adsorbed gas, which can be adsorbed by a single layer or multilayers. The high-density area at the pore wall is adsorbed methane, and the low-density area in the pore-free space is free methane. The amount of adsorbed gas depends on the surface area of the pore and the gas pressure. In the free space in the middle of the pores, methane occurs in the form of free gas, and the amount of free gas depends on the pore volume and gas pressure.
Energies 15 09043 g007
Figure 8. The changing trend of (a) NMR signal and (b) the ratio of different methane in the process of gas production. The pressure difference inside and outside the pore first drives the free gas in the large pore to produce. With the decrease in the pressure difference, adsorbed gas begins to desorb into the seepage channel and becomes the dominant type of methane produced by gas wells.
Energies 15 09043 g008
Figure 9. Shale gas production process (a) early and (b) late methane distribution and migration process diagram. Free gas first migrates from the high-pressure zone to the low-pressure zone under the action of the pressure gradient. When the pore pressure is lower than the critical desorption pressure, the adsorbed gas gradually desorbs and diffuses from the high-concentration region to the low-concentration region through the seepage channel.
Energies 15 09043 g009
Table 1. Basic parameters of the saturated–gas producing experimental samples.
Length
(mm)
Diameter
(mm)
Mass
(g)
Posity (Helium)
(%)
Pulse-Decay Permeability
(mD)
57.7925.0773.143.103.54 × 10−3
Publisher’s Note: MDPI stays neutral with regard to jurisdictional claims in published maps and institutional affiliations.

