Article

Study on the Tight Gas Accumulation Process and Model in the Transition Zone at the Margin of the Basin: A Case Study on the Permian Lower Shihezi Formation, Duguijiahan Block, Ordos Basin, Northern China

1
Key Laboratory of Tectonics and Petroleum Resources, China University of Geoscience, Ministry of Education, Wuhan 430074, China
2
Exploration and Development Research Institute, SINOPEC North China Company, Zhengzhou 450006, China
*
Author to whom correspondence should be addressed.
Energies 2023, 16(3), 1493; https://doi.org/10.3390/en16031493
Submission received: 9 December 2022 / Revised: 28 January 2023 / Accepted: 1 February 2023 / Published: 2 February 2023

Abstract

:
Recent discoveries of oil and gas have principally been located in the central part of the Ordos Basin, which is a petroliferous basin with the largest discovered reserves and annual production of tight sandstone gas in China. For tight sandstone gas reservoirs in the transition zone of the basin margin, the process of natural gas accumulation has remained relatively vaguely understood, because of the transitional accumulation of geological conditions such as structure, sedimentation, and preservation. In this study, thin-section identification and scanning electron microscopic observations of the reservoir core, measurement of the physical properties of the reservoir, microscopic petrography research and measurement of the homogenization temperature of fluid inclusions, digital simulations, and laser Raman spectroscopy analysis were combined to analyze the process of natural gas accumulation of the Permian Lower Shihezi Formation in Duguijiahan block, Hangjinqi area, northern Ordos Basin. The results showed that the Lower Shihezi Formation reservoir in the Duguijiahan block began gas charging in the southern part as early as the Early Cretaceous (130–128 Ma), and then gradually charged in the northern part. Three stages were identified in the digital simulations of gas charging, i.e., the breakthrough, rapid, and fully saturated stages. The initial porosity of the Lower Shihezi Formation reservoir ranged between 28% and 40%. Later, because of strong compaction and interstitial filling during burial, the sandstone porosity decreased rapidly, and densification (porosity < 10%) occurred in the mid–late Jurassic. This late tectonic uplift caused a continuous reduction in ground temperature, and diagenesis had a weak effect on pore transformation. The present porosity of the Lower Shihezi Formation reservoir basically inherited its characteristics in the late Early Cretaceous. The current average porosity of the reservoir is 8.58%, and the average permeability is 0.88 mD, and it can thus be characterized as a tight reservoir. The gas accumulation process of the Lower Shihezi Formation has three stages: (1) the depositional stage (C–P), corresponding to the depositional stage of the source-reservoir-cap combination in gas reservoir; (2) the natural gas accumulation stage (T–K1), corresponding to the period of rapid source rock maturation and natural gas charging step-by-step; and (3) the gas reservoir adjustment stage (K2–present), corresponding to the period of uplift and natural gas charging in the early stage that gradually migrated and accumulated northward along the fracture zone. Finally, the gas accumulation model in the transition zone at the margin of basin was established.

1. Introduction

With the continual growth of global oil and gas demand and the ceaseless decline of conventional oil and gas production, the exploration and development of oil and gas resources has gradually changed from conventional to unconventional fields. Unconventional resources, including tight oil and gas, shale oil and gas, and gas hydrate, have attracted widespread attention and resulted in the innovation of petroleum geology theory [1,2,3]. As an important form of unconventional energy with considerable recoverable reserves and good exploitability, tight gas accounts for an increasing proportion of global oil and gas production [4,5,6]. Most of the tight sandstone gas reservoirs that have been successfully developed at present, however, are located in the interior or deep depression of basins such as in the Alberta Basin in Canada [7]; the San Juan Basin and the Appalachian Basin in the United States [8,9]; and the Tarim Basin [10,11], Ordos Basin [12,13,14,15], Songliao Basin [16], Sichuan Basin [17], Bohai Bay Basin [18], and East China Sea Shelf Basin in China [19]. The research on the mechanism and process of tight sandstone gas accumulation has concentrated primarily on the inner or deep depression of the basin. In recent years, researchers have gradually begun to pay attention to tight oil reservoirs at the margin of the basin, such as Mahu Sag in Junggar basin [20,21], and Honghe Oilfield in the south margin of Ordos Basin [22], whereas less attention has been paid to the tight gas reservoirs. According to the theory of Total Petroleum System, the discovery of unconventional oil and gas implies that there may be associated conventional resources in the outer space [23]. However, previous exploration has always focused on conventional oil and gas in outer space, and ignored the transition zone between conventional and unconventional oil and gas reservoirs. This study would focus on the natural gas accumulation process and the model of tight gas reservoirs in transition zone at the margin of the basin.
The Ordos Basin is a petroliferous basin with the largest discovered reserves and annual production of tight sandstone gas in China [24] (Figure 1a). Today, several tight sandstone gas fields have been found in the Ordos Basin, including Sulige, Yulin, Wushenqi, Zizhou, and Daniudi [24,25,26,27] (Figure 1b). However, most of these gas fields are located in the interior of the basin, and most of the production comes from the tight sandstone of the Permian Lower Shihezi Formation of the upper Paleozoic. Research on the tight gas accumulation process has similarly been concentrated on the interior of the basin. Hangjinqi area, located in the northern margin of the Ordos Basin, is an inherited paleo-uplift and is considered to be a favorable oil and gas accumulation area [28,29] (Figure 1b). Unfortunately, the early oil and gas exploration results in this area were not ideal. Regardless of whether conventional oil and gas exploration methods were used to search for structural traps at high positions [30,31], or whether unconventional deep basin gas exploration methods were used to search for lithologic traps [32], they had a minimal effect. Researchers have gradually come to understand the characteristics of vertical multilayer stacking and horizontal continuous enrichment of the upper Paleozoic gas reservoirs in the Hangjinqi area [33]. As a result, a novel exploration concept of the transition zone at the margin of the basin has gradually emerged. The Hangjinqi area is situated in the junction of the Tianhuan Depression, Yishan Slope, and Yimeng Uplift in the Ordos Basin (Figure 1b). The accumulation geological conditions of gas reservoir in the Hangjinqi area have distinctive transition zone characteristics: The structures are characterized by the transition from a gentle sloping area in the interior of basin to an uplift area in the northern margin [34]; the sedimentation is characterized by the transition from alluvial fan deposition in the northern near-provenance steeply sloping area to the braided river deposition in the far-provenance gentle sloping area in the south [35]; the distribution of source rocks is characterized by a gradual thinning from the interior to the northern margin of the basin; and most importantly, the gas reservoir is characterized by the transition from tight gas in the interior of basin to conventional gas in the northern margin. The Duguijiahan block is located in the southwest of the Hangjinqi area and is structurally situated at the transition zone between two first-order faults (Porjianghaizi Fault and Wulanjilinmiao Fault) (Figure 1c). Duguijiahan is the first block in the Hangjinqi area to submit proved reserves and to move into development. This block is a typical representation of the transition zone at the margin of the Ordos Basin.
In this study, the representative cross-well profile of Duguijiahan block was selected (Figure 1c), and the core samples of tight sandstone reservoir of the Lower Shihezi Formation of the upper Paleozoic were collected for thin-section identification and scanning electron microscopic (SEM) investigation of the tight sandstone core, petrographic observation, homogenization temperature measurement, and laser Raman spectrum analysis of fluid inclusions to reconstruct the reservoir evolution, burial history and hydrocarbon charging timing of single wells. Based on the results of drilling, the digital core model, Computed Tomography (CT) scanning of core samples, and gas test data, the process of tight gas charging and migration was reconstructed. Finally, the natural gas accumulation process in the transition zone of the basin margin was analyzed in combination with reservoir evolution and tight gas charging and migration.
This study clarifies the mechanism of differential enrichment of natural gas in the transitional zone of the basin margin. Thus, it holds guiding significance for tight gas exploration in the Ordos Basin and other cratonic basins with similar tectonic backgrounds.

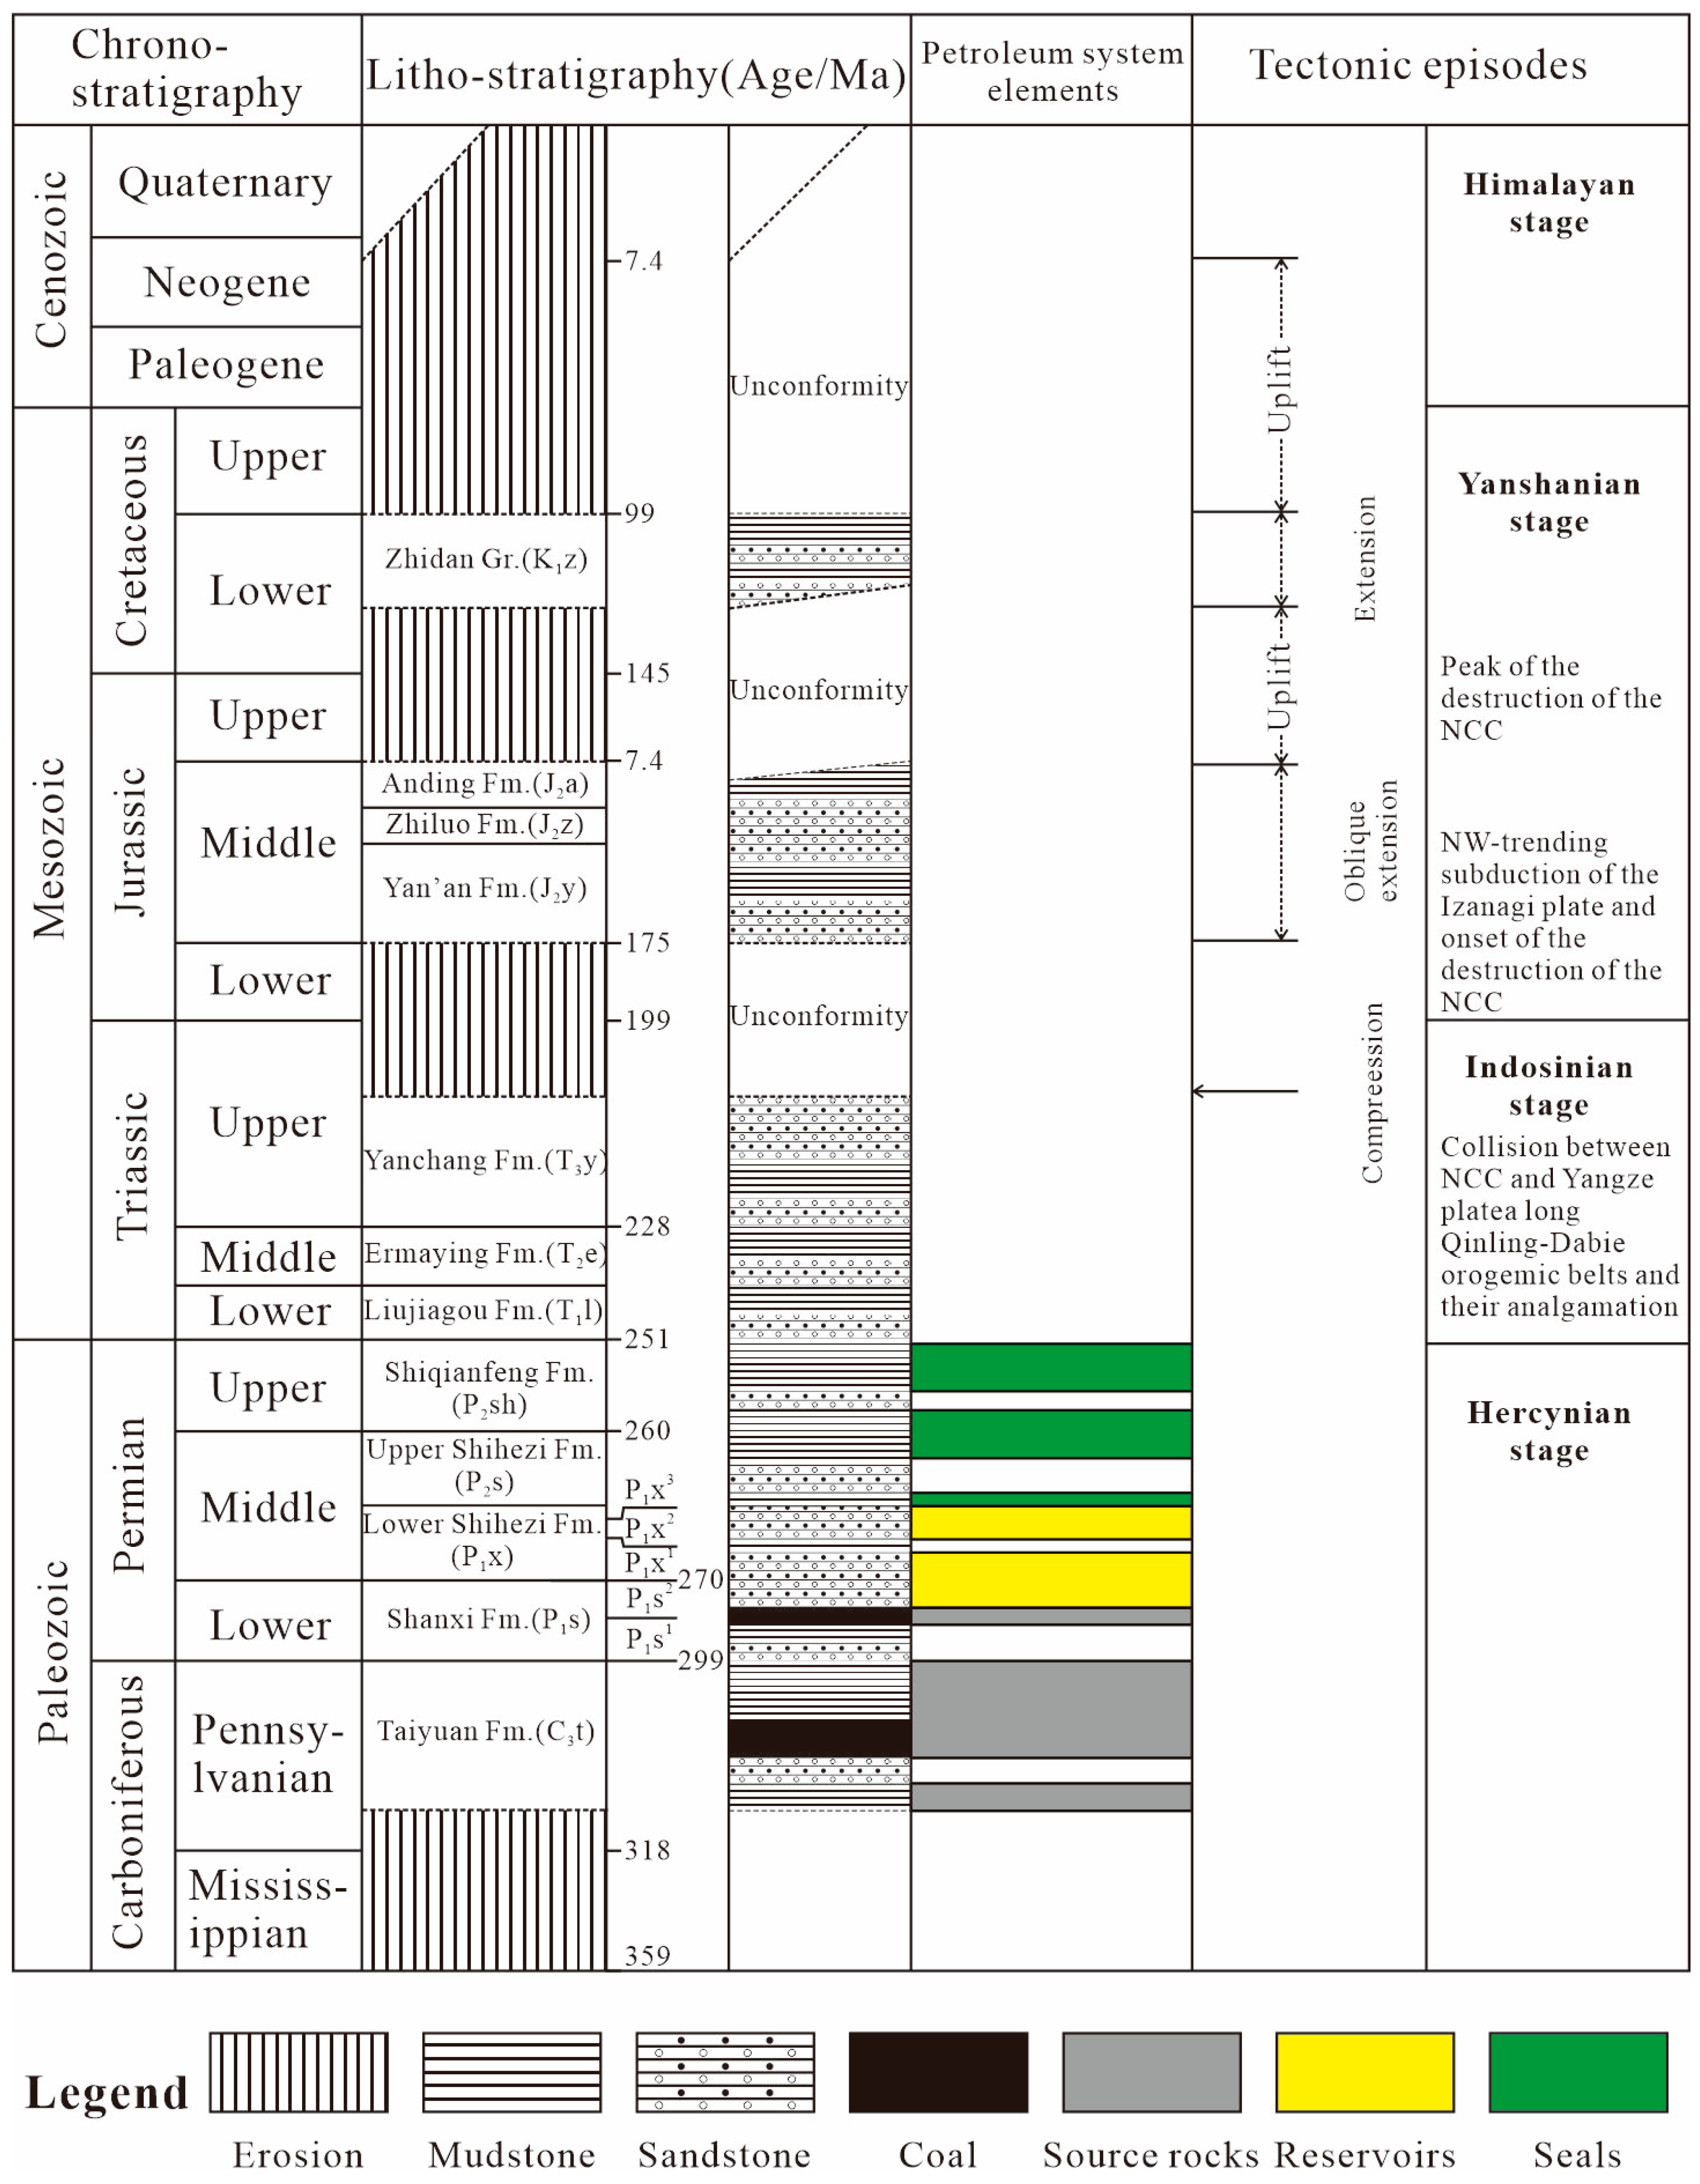
2. Geological Setting

The Ordos Basin is a typical cratonic basin located at the junction of central and Western China with an area of 25 × 104 km2. This basin is the second largest sedimentary basin in China [38,39,40] (Figure 1a). The overall shape of the basin is nearly rectangular, showing an east–west orientation asymmetric syncline, with stable structural properties [41,42]. After the formation of the Paleo-proterozoic basement, the Ordos Basin experienced multistage superimposed evolution controlled by the regional tectonic background and variable tectonic stress over a long geological period [37,43,44]. The evolution of the basin had six main stages: (1) the formation stage of the basement of the North China platform from the Archean to the Paleo-Proterozoic era; (2) the depression trough rifted basin stage during the Middle–Late Proterozoic era; (3) the marginal sea basin formation stage during the early Paleozoic era; (4) the inner craton formation stage from the Late Carboniferous to Middle Triassic epoch; (5) the development stage of the foreland basin from the Late Triassic to the Early Cretaceous epoch; and (6) the formation stage of peripheral faulted basins during the Cenozoic era [43,44]. The internal structural units of this basin include the Yimeng Uplift, the Weibei Uplift, the Western Thrust Belt, the Tianhuan Depression, the Yishan Slope, and the Jinxi Folding Belt [25,45,46] (Figure 1b).
The main sedimentary bodies of the Ordos Basin are the upper Paleozoic and Mesozoic strata overlying the Ordovician paleo-weathering crust. The Quaternary loess unconformably covers the Lower Cretaceous Zhidan Group [47] (Figure 2). During the Cambrian and Ordovician periods, the Ordos Basin was connected with the Helan rift trough in the west, and a set of marine carbonate rocks were deposited. By the Late Ordovician, because of changes in the surrounding sea areas and tectonism (i.e., the Caledonian movement), the North China Craton was uplifted regionally, and its sedimentation was interrupted and weathered for more than 100 Ma. The strata from the Upper Ordovician to the Lower Carboniferous were absented [48,49]. During the depositional period of the Upper Carboniferous Taiyuan Formation, with the subsidence of the basin, the sea water rose from the east and west sides to the central paleo-uplift and expanded northward. Then, the tidal flat, lagoon, and shore deposits gradually overlapped the Ordovician paleo-erosion surface of the central paleo-uplift, pushing the central paleo-uplift underwater and forming a unified sea area [50]. In this period, the Taiyuan Formation in the coastal delta-tidal flat-barrier island sedimentary system developed in the Hangjinqi area. Its lithology is mainly coarse sandstone, silty mudstone, mudstone, and coal seam, which gradually thins to pinch out in the north [47]. During the sedimentary period of the Shanxi Formation in the early Permian, because of the overall uplift of the North China platform, the sea water retreated rapidly from the east and west sides of the Ordos Basin, and the sedimentary environment changed from marine to continental. The northern margin of the basin features a river-swamp sedimentary system on the alluvial plain, and the lithology is mainly sandy conglomerate, silty mudstone, mudstone, and coal seams [51]. The Shanxi Formation has two members; from bottom to top: Shan-1 (P1s1) and Shan-2 (P1s2). P1s1 is a swamp-delta sedimentary system, with developed dark mudstone and coal seams, which gradually thins to pinch out to the north, and P1s2 is a river-delta sedimentary system with sandstone, mudstone, and a small amount of coal deposit [52]. The coal seams of the Taiyuan and Shanxi Formations are the main source rocks in the Hangjinqi area [47,51,53]. During the sedimentary period of the Lower Shihezi Formation in the Middle Permian, the climate changed from warm and humid to arid and hot, and the vegetation decreased significantly. Thus, the lithology was transformed from dark coal-bearing clastic rock into pure gray–yellow–green terrestrial clastic rock [52]. In this period, the Hangjinqi area as a whole formed an alluvial plain–river sedimentary system. Its lithology features coarse clastic rocks, such as sandy conglomerate and coarse sandstone, and is intercalated with a small amount of mudstone. According to lithology combination and sedimentary cycle, its three members can be classified from bottom to top as He-1 (P1x1), He-2 (P1x2), and He-3 (P1x3). Among them, the channel-fill sandstones of P1x1 is the most developed, its river characteristics are the most obvious, and it is considered to be the best reservoir in this area [54,55]. The Upper Shihezi Formation and Shiqianfeng Formation in the upper part of the upper Paleozoic are mainly brownish-brown, purple-brown, and gray-black thick mudstone, silty mudstone, and fine sandstone, which include regional caprocks [37,56].

3. Materials and Methods

3.1. Samples and Data

A total of 21 representative core plugs (2.5 cm in diameter and 5 cm in length) were collected from 8 wells in the Lower Shihezi Formation in the Duguijiahan block, Hangjin area (Figure 1c). The lithology of the samples featured medium-grained sandstone and coarse-grained sandstone. A total of 42 thin sections were prepared, of which 38 thin sections were used for rock structure, composition, diagenesis, and pore type. The other 4 ordinary thin sections from the Lower Shihezi Formation of the wells on the cross-well profile AB (Figure 1c) were used to observe the characteristics of fluid inclusions, including the micropetrography, fluorescence color, and homogenization temperature (Th) of the fluid inclusions. In addition, the drilling and gas testing data, and experimental data (e.g., physical property test, scanning electron microscopic, source rock pyrolysis, and source rock maturity test) of the Permian reservoir in the study area were collected from the China Petrochemical Corporation (Sinopec) North China Petroleum Bureau database for reservoir characteristic analysis and thermal evolution simulation.

3.2. Methods

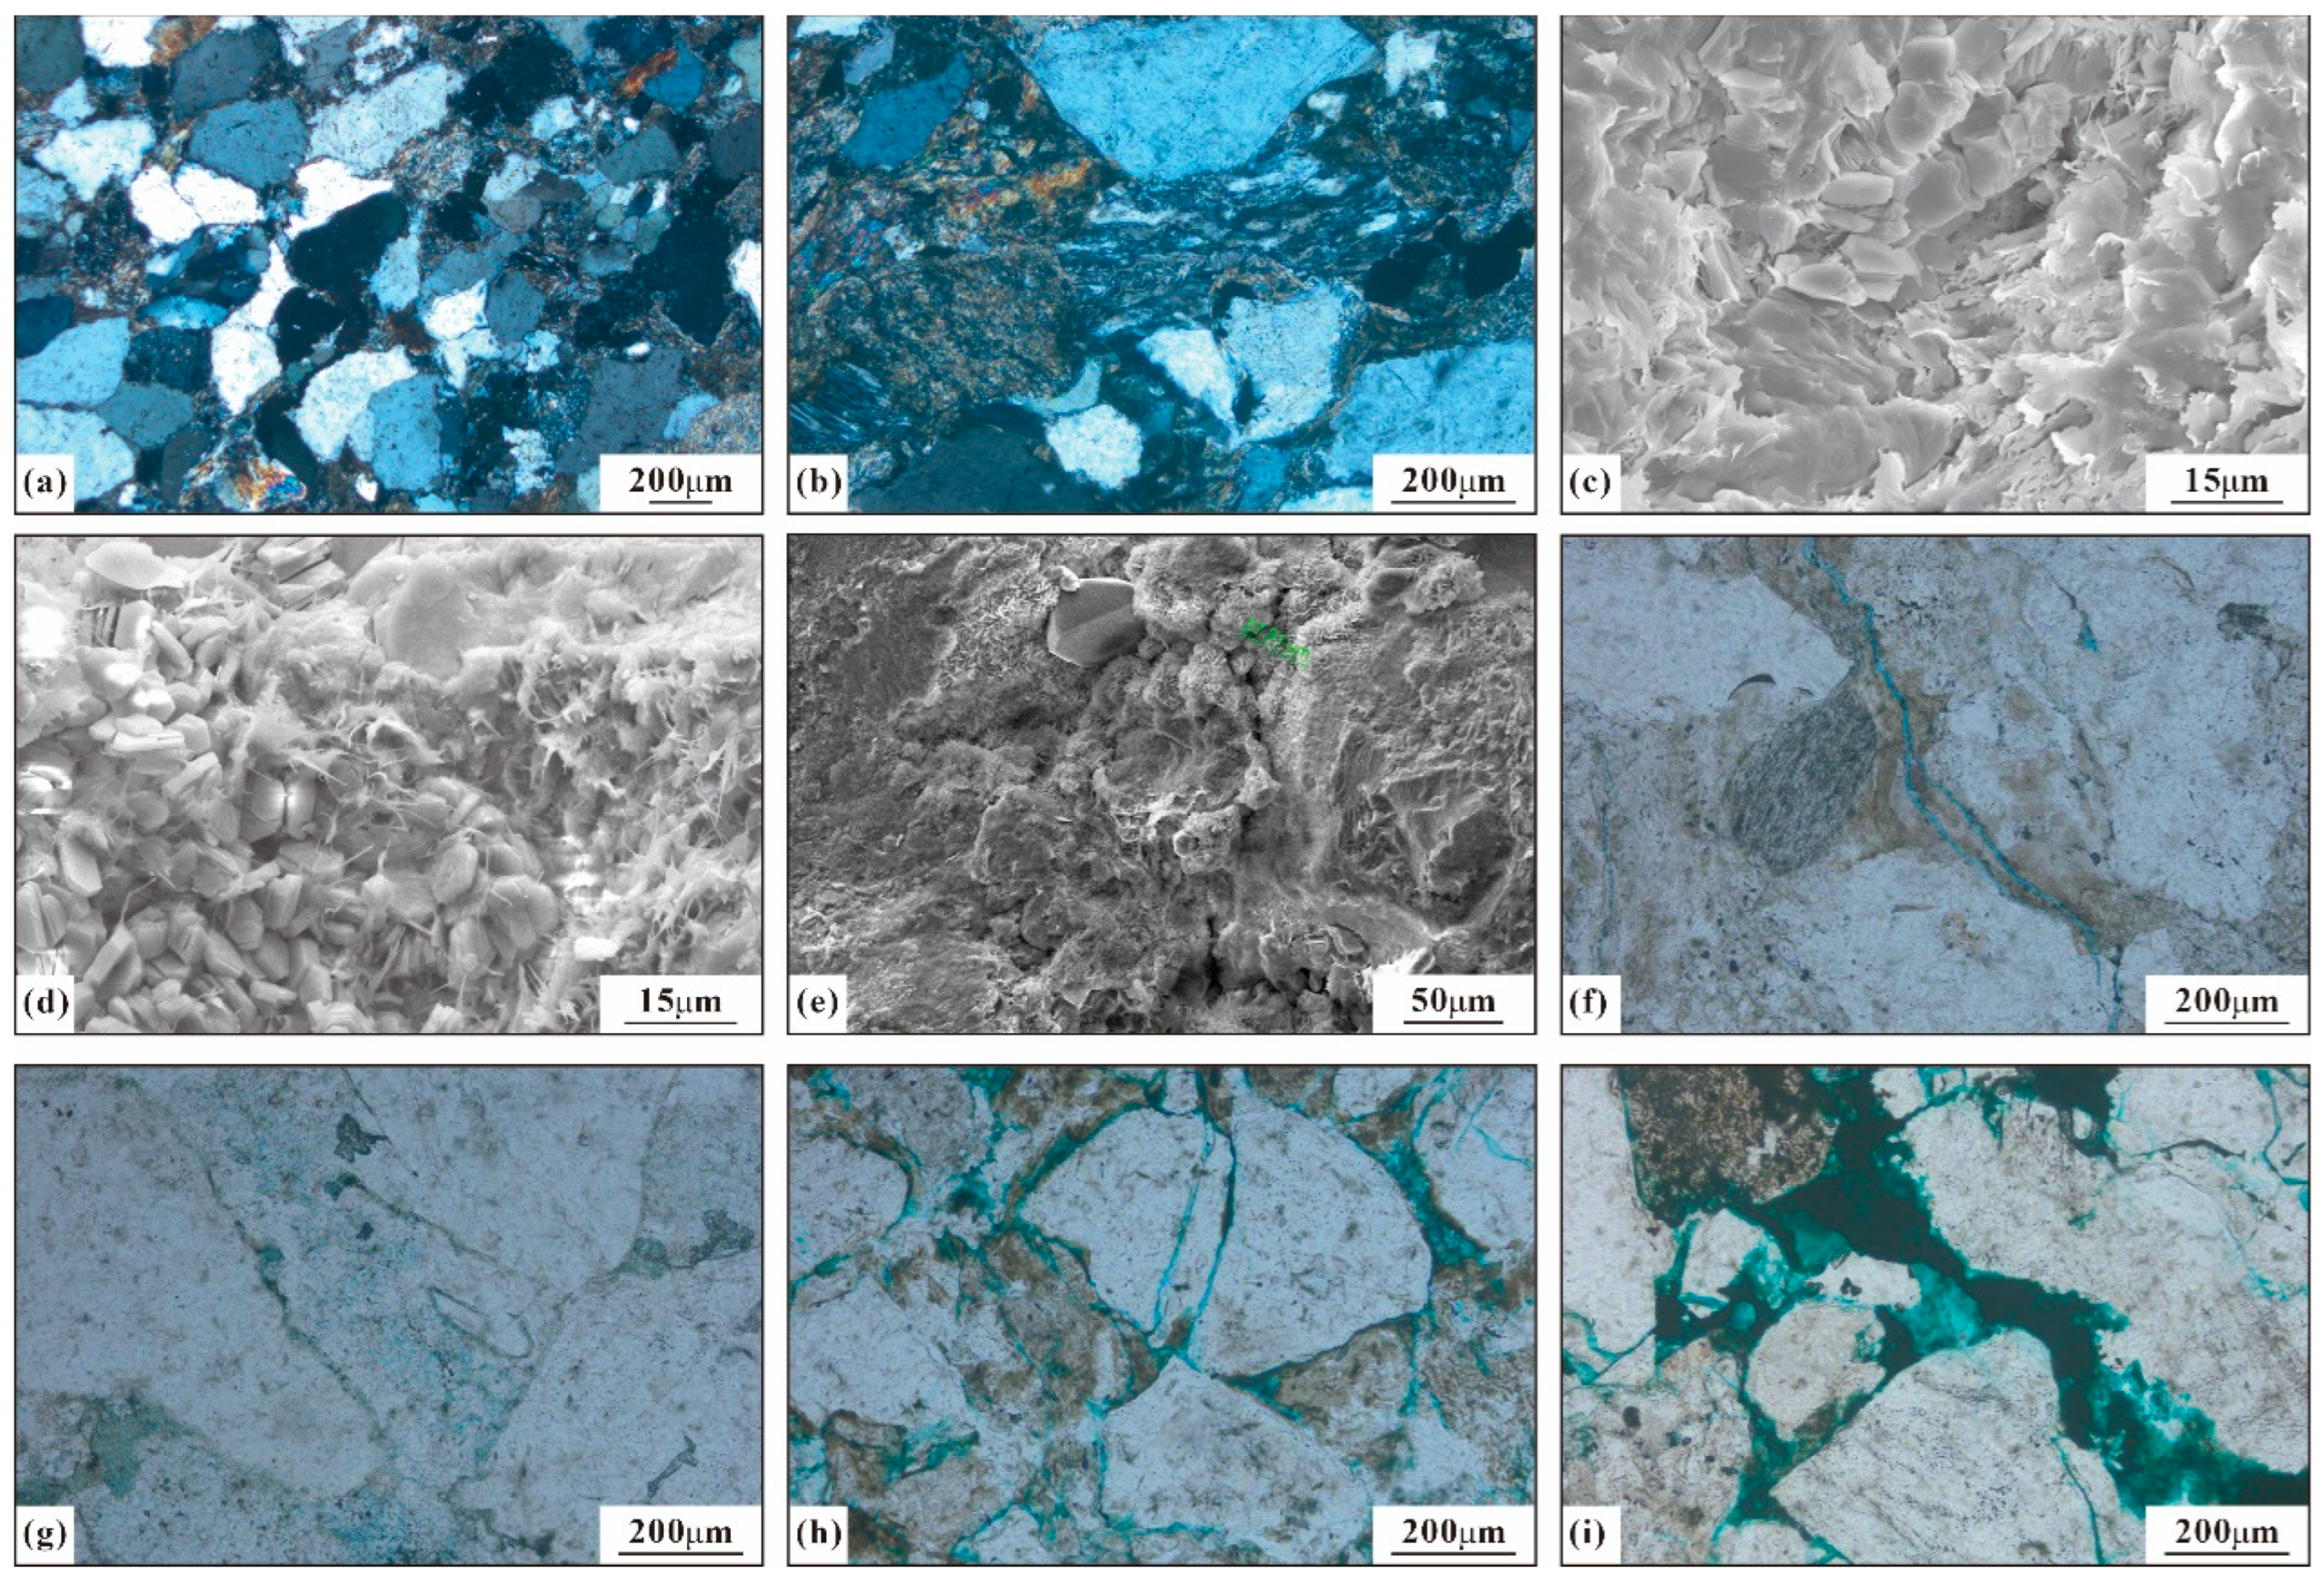
3.2.1. Identification for Thin Section of Rocks

Identification of the thin section, including ordinary and cast thin sections, was completed in the Key Laboratory of Tectonics and Petroleum Resources, Ministry of Education, China University of Geosciences (Wuhan, China). Ordinary thin-section identification was used to determine the basic information of the reservoir structure, components, and diagenesis, and the cast thin section was used to visually observe the reservoir space and assist in the analysis of reservoir diagenesis evolution. Furthermore, the evolution process of reservoir porosity was determined based on the conversion of actual porosity and areal porosity of different diagenetic minerals. A total of 19 core samples were collected from 8 wells shown in Figure 1c in this study and 19 ordinary thin sections and 19 cast thin sections were made, respectively. The cast thin sections were impregnated with blue epoxy for observation of reservoir characteristics and the study of porosity evolution. To distinguish dolomite from calcite, all of the thin sections were stained with a mixed dye made of Alizarin Red S- and K-ferricyanide in a volume ratio of 3:2. Point counts were performed on thin sections for the content of detrital grains and carbonate cements with 300–350 points, which provide a standard deviation of 5.5% or less.

3.2.2. Fluid Inclusion Test

Fluid inclusion is the ore-forming fluid wrapped in the lattice defects of minerals during the crystallization and growth of minerals, and it is the original record in the process of oil and gas migration and accumulation. The Th of brine inclusions associated with hydrocarbon inclusions can reflect the temperature of fluid charging, and the charging time of natural gas can be determined by combining the evolution history of single-well geothermal temperature. In this study, the sandstone samples from the Lower Shihezi Formation of the wells J57, J112, J103, and J110 on the cross-well profile AB (Figure 1c) were collected for fluid inclusion analysis. A Nikon-lv100 microscope (Nikon, Tokyo, Japan) equipped with transmission and ultraviolet light sources was used to observe the microscopic petrographic characteristics of the fluid inclusions, including the type, occurrence, and fluorescence characteristics. The excitation light source wavelength was 395–440 nm blue violet light. The Th of oil and gas inclusions and their coeval brine inclusions was measured using a THMSG600 heating–freezing stage (Linkam Scientific, Redhill, UK) with a temperature error of ±0.1 °C. The Th was measured at room temperature (20 °C) with a heating rate of 10 °C/min at the beginning. When the inclusion was close to homogenization, a heating rate of 2 °C/min, for slow heating, was used to record the Th more accurately.
The main source rock in the Hangjinqi area is the coal seams of the Taiyuan and Shanxi Formations, which mainly generate natural gas, but also produce a large amount of CO2 when generating hydrocarbon gas. Thus, it is necessary to distinguish the composition of gas phase inclusions [58]. Laser Raman technology can be used for nondestructive analysis of a single inclusion and for qualitative and semiquantitative analysis of gas-phase components in the fluid inclusions. At room temperature (20 °C) and an air humidity of 30%, the gas composition of the gas inclusions was determined by XploRA PLUS laser Raman spectrometer (Horiba, Kyoto, Japan). A series of fluid inclusion tests, including microscopy, petrography, micro-thermometry, and laser Raman spectroscopy, were completed in the Key Laboratory of Tectonics and Petroleum Resources, Ministry of Education, China University of Geosciences (Wuhan, China).

3.2.3. Basin Modeling

Basin modeling is a vital quantitative analysis technique for petroliferous basins. In this study, PetroMod 1D software (version 2012; Schlumberger, Houston, TX, USA) was used to restore the burial, thermal evolution, and hydrocarbon generation histories of single wells on the transient heat flow model.
Burial history is the basic framework of basin modeling. The formation thickness, lithology, and other data required for the simulation were obtained from the drilling and logging data provided by Sinopec North China Petroleum Bureau (Zhengzhou, China), and the ages of formation sedimentation and uplift were obtained from regional research results. In addition, several parameters had an important impact on the thermal evolution history in this reconstruction, including erosion thickness and paleo-heat flow evolution. Four uplift and erosion events took place in the Late Triassic, the Early Jurassic, the Late Jurassic, and the Early Cretaceous, with erosion thicknesses of 150–200 m, 120–160 m, 120–200 m, and 400–700 m, respectively [59]. For heat flow, we adopted the research results of Ren et al. [60]: the average value of the early Paleozoic terrestrial heat flow was 50 mW/m2, it was 52–55 mW/m2 during the Carboniferous and Permian, was equal to 60–65 mW/m2 during the Triassic, and reached its highest level of 65–70 mW/m2 during the Jurassic and the late Early Cretaceous. The current average value of the terrestrial heat flow is about 50 mW/m2.
Based on the reconstructed burial and thermal evolution history, combined with the organic matter abundance and source rock pyrolysis analysis data of coal samples [61], the Tissot in Waples TIII [62] Crack kinetic model in PetroMod 1D software was used to simulate the hydrocarbon generation history.

3.2.4. Digital Simulations of Gas Charging

Compared with physical experiments related to gas charging, digital simulations have advantages such as lower sample requirements, simpler experimental conditions, and greater efficiency. In this study, the sandstone samples from the Lower Shihezi Formation of the wells J57, J112, J103, and J110 on the cross-well profile AB (Figure 1c) were collected for gas charging simulation combined with computed tomography (CT) and digital core techniques. The gas charging simulations were conducted using a MicroXCT-500 CT instrument (Zeiss, Germany) at the Digital Core Observation of Cooperative Innovation Center of Unconventional Oil and Gas, Yangtze University (Wuhan, China). The pore size distribution was quantitatively calculated based on the results of the CT experiments, and a digital core model was built using the Markov chain Monte Carlo method, which has the advantages of quick modeling and a similar pore space distribution [63,64]. Based on the digital modeling of the core, the lattice Boltzmann model [65] was used to perform seepage simulations under various pressures, adhering to the principle of mass conservation and utilizing the Taylor expansion method.

4. Results

4.1. Reservoir Evolution

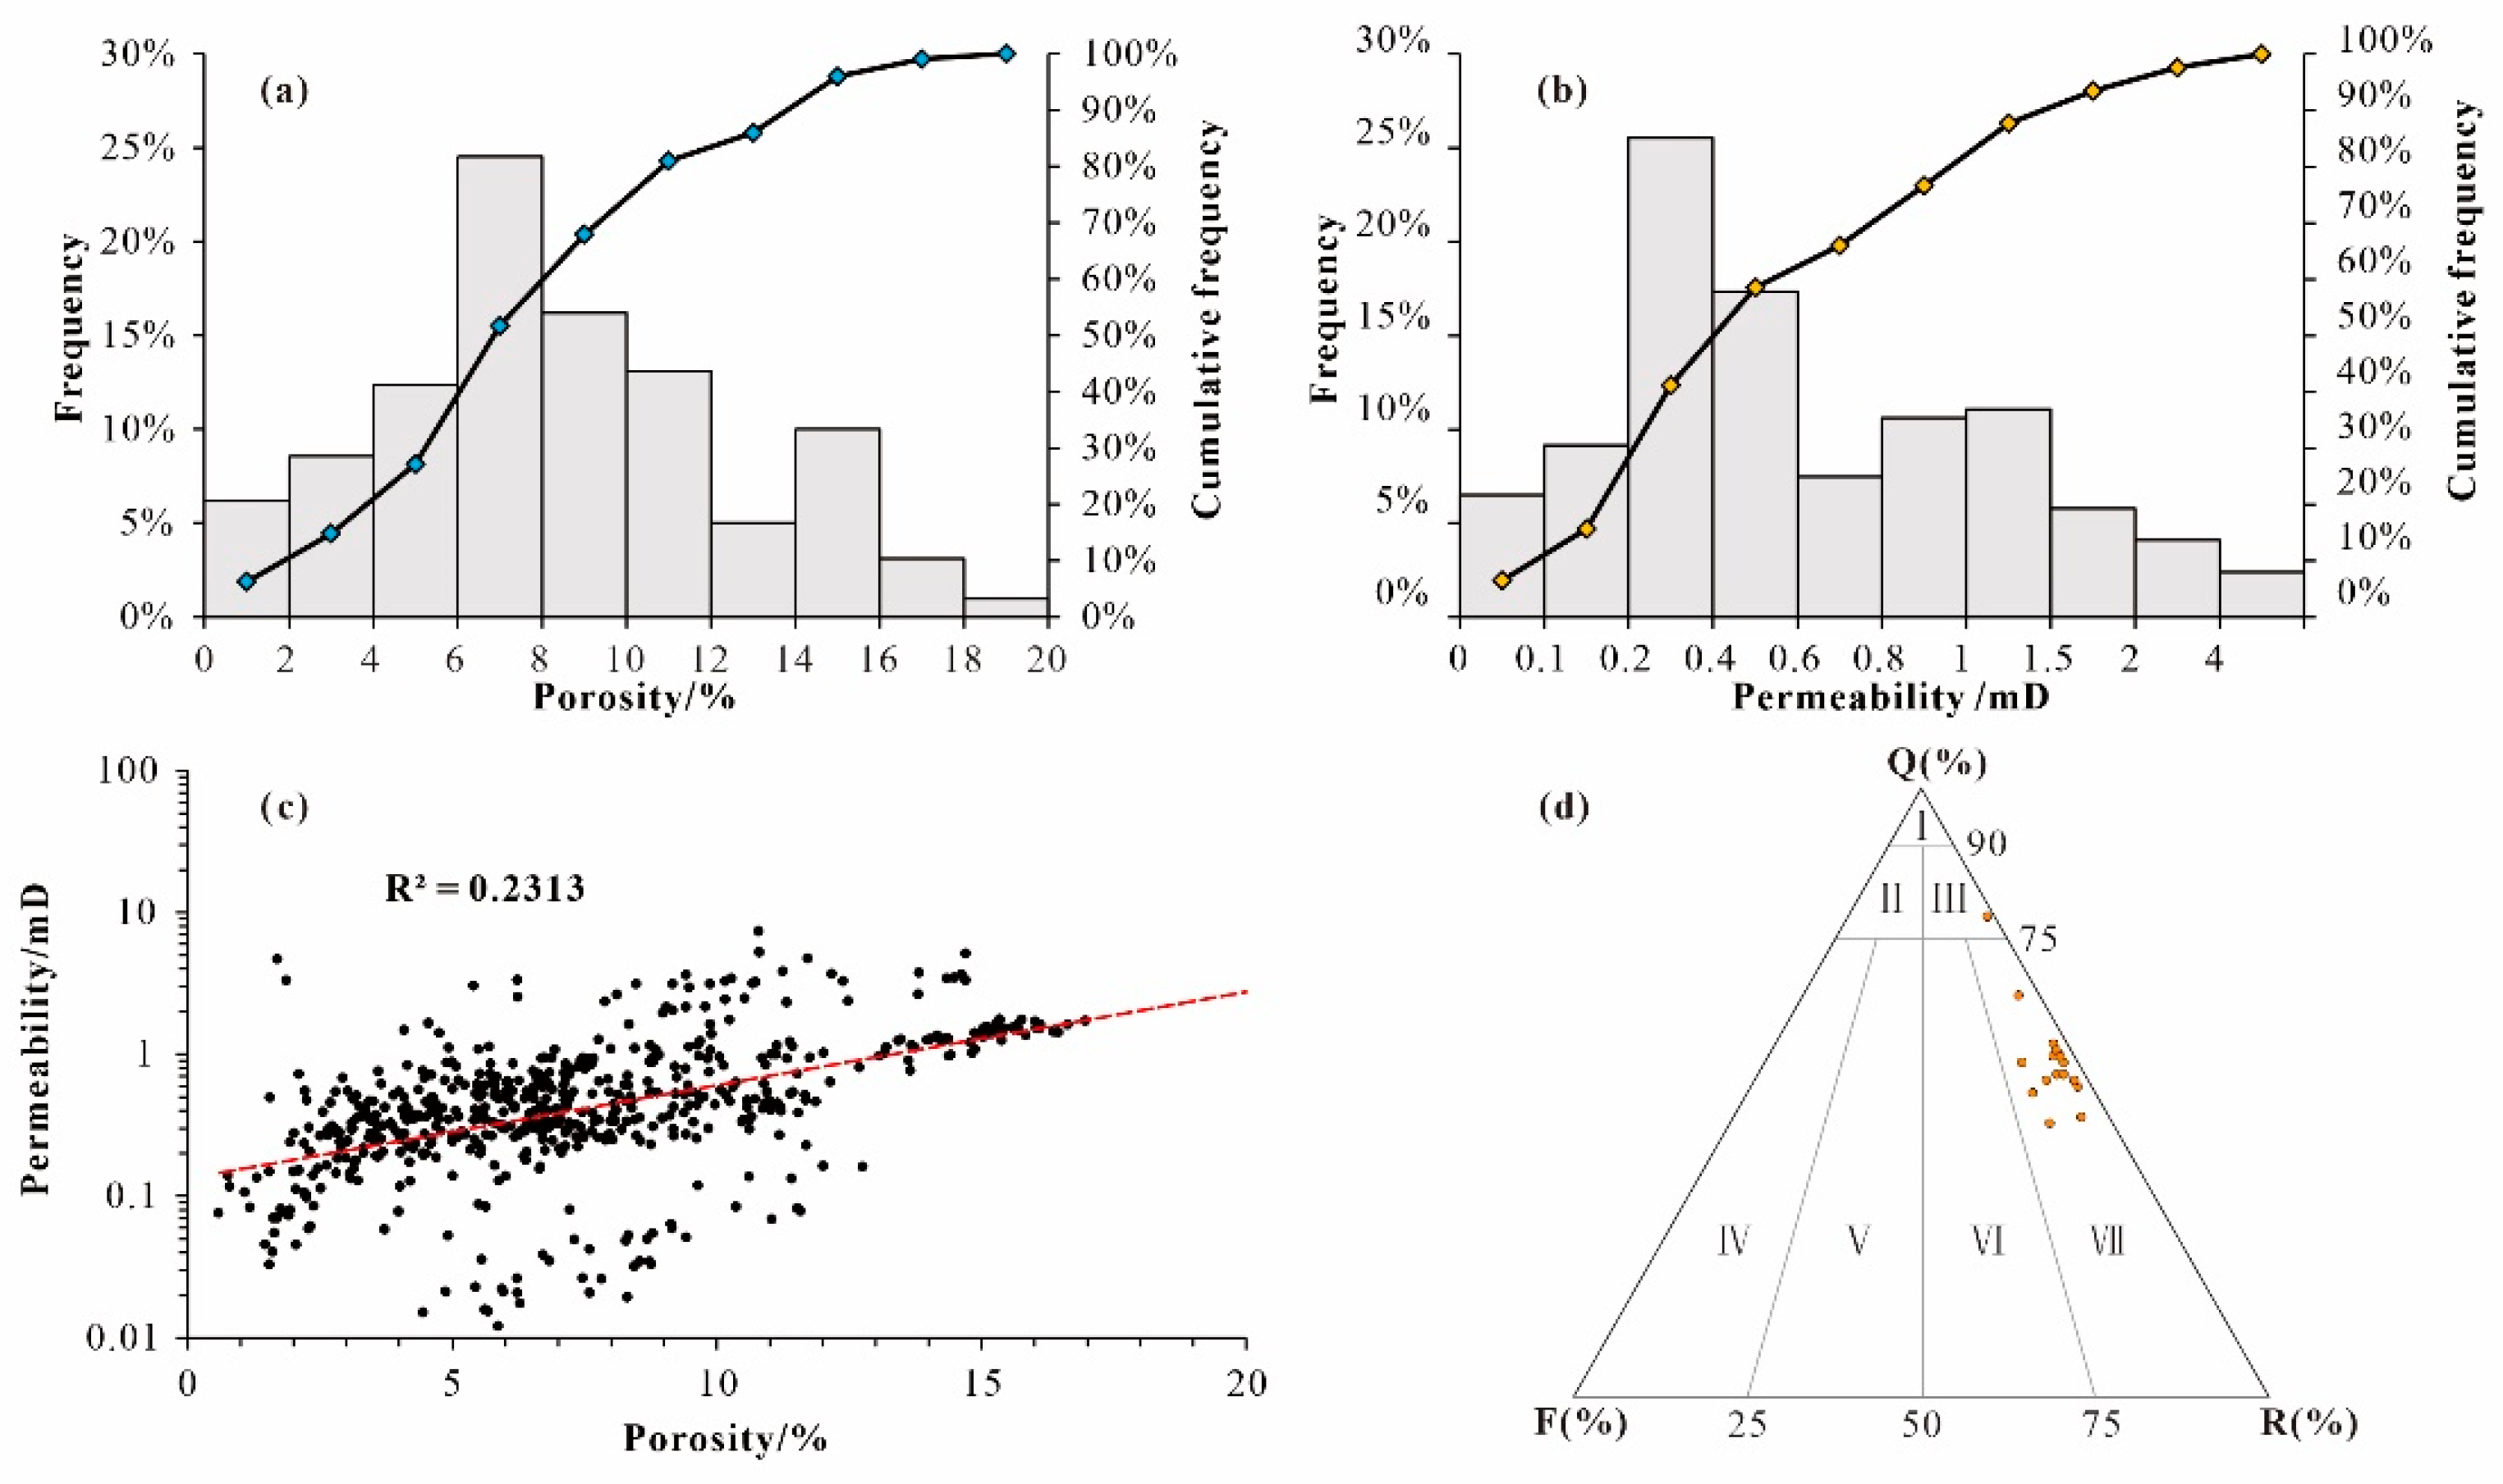
4.1.1. Characteristics of Tight Sandstones Reservoir

According to the statistics of reservoir physical property test data for 604 core samples, the porosity of the sandstone reservoir in the Lower Shihezi Formation ranged from 1.179% to 19.17%, with an average of 8.58%, and with 67.86% being less than 10% (Figure 3a). The permeability ranged between 0.033 and 11.66 mD, with an average of 0.88 mD, and 76.63% of the samples had a permeability lower than 1 mD (Figure 3b). This result indicated that most of the Lower Shihezi Formation sandstones in the study area belonged to the tight reservoir. Local high-porosity and -permeability reservoirs can be used as the “sweet point” for oil and gas, revealing fracture development in the area. The correlation between porosity and permeability was not sufficient, and the correlation coefficient (R2) was only 0.2313 (Figure 3c), which confirmed the presence of microfractures in the reservoir.
The lithologies of the collected core samples of the Lower Shihezi Formation feature medium-grained sandstone and coarse-grained sandstone, with a small amount of conglomeratic sandstone. The identification results of ordinary and cast thin sections showed (Table 1) that the sandstone clastic particles were moderately to well sorted, had subangular roundness, supported by particles and point–line contact, which indicated a high degree of textural maturity. The detrital grains were composed of quartz, feldspar, and rock fragment, in addition to chert, with an average content of less than 2%. The quartz content of sandstone was 44–76%, with an average of 53.79%; the feldspar content was low, and the potassium feldspar content was 18%, with an average of 3.32%; and most samples did not contain plagioclase. The content of rock fragments was 20–50%, with an average of 41.21%. The sandstone type was litharenite. The parent rocks of fragment include magmatic rocks, metamorphic rocks, and sedimentary rocks, and most of them were metamorphic rocks, accounting for 61.29% to 100%, with an average of 78%. The rock fragment was composed of quartz, schist, slate, phyllite, and meta-sandstone, with a small amount of argillaceous, intermediate-acid extrusive rock, sandstone, and occasionally mica (Figure 3d).
With a large burial depth (2896.55–3206.5 m), the primary pore in the reservoir was difficult to preserve because of its mechanical compaction and interstitial filling (Figure 4a,b). The filling materials in sandstone included argillaceous matrix, calcite cementation, and kaolinite, in which argillaceous matrix is considered to be part of the primary texture of the rock; siderite and secondary quartz were occasionally visible. The argillaceous matrix included clay minerals, such as illite and kaolinite, and an illite–smectite mixed layer. Under the scanning electron microscope, it could be seen that the filamentary illite and flaky kaolinite were filling the intergranular pores, and some clastic particles were wrapped with a chlorite film, which were extremely detrimental to the preservation of the primary pore (Figure 4c,d). Secondary porosity by dissolution was formed by the dissolution of feldspar, carbonate rock, and other soluble components in rocks. Some dissolved pores in the calcite particles were visible under the microscope of the cast thin sections, and some dissolution of the micropores produced by the dissolution of flaky kaolinite could be seen under the scanning electron microscope (Figure 4f,g). Thus, the main reservoir spaces were pores caused by dissolution and microfractures (Figure 4e). Dissolution was the main constructive diagenesis of increasing porosity and improving reservoir physical properties. Microfractures can be divided into two kinds of compaction and dissolution according to their genesis (Figure 4h,i). Both kinds of microfractures developed in this area, which effectively improved the pore structure of the tight reservoir.

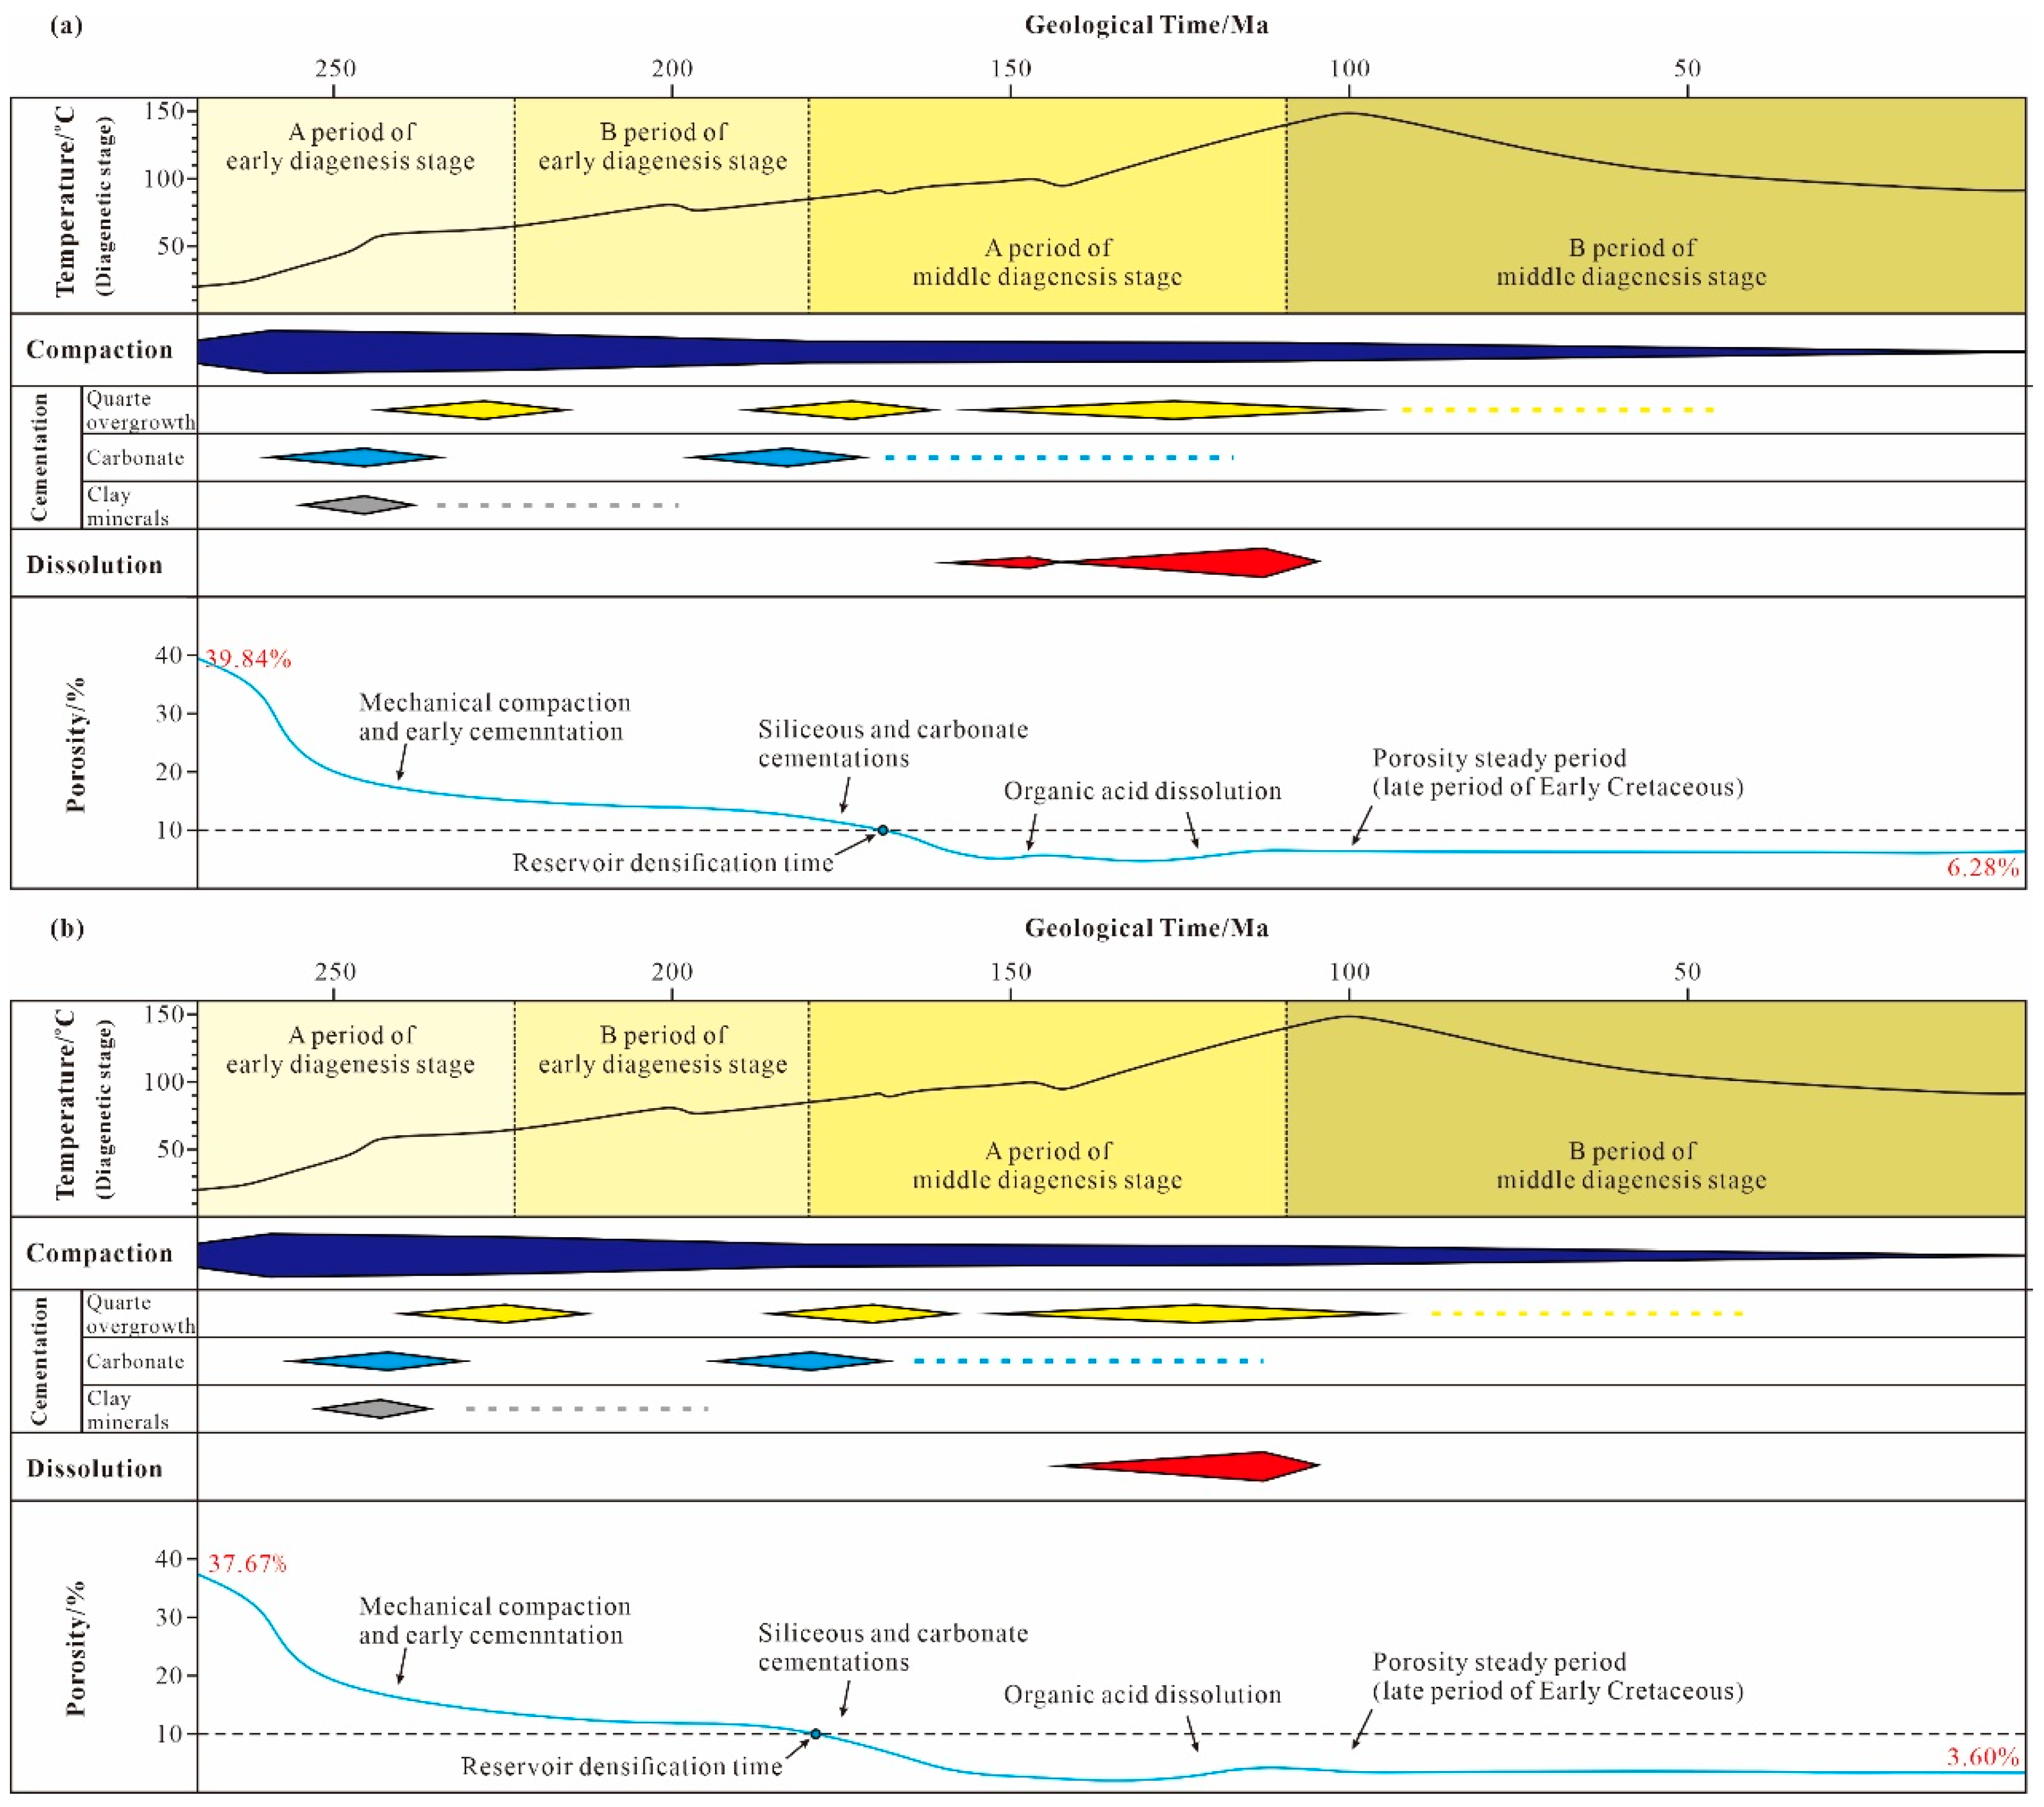
4.1.2. Porosity Evolution and Densification of Reservoirs

Many methods can be used to reconstruct the evolution history of reservoir porosity. The most common method is to divide the evolution of reservoir primary and secondary porosity into four stages—that is, unconsolidated sandstone, compaction, cementation and metasomatism, and secondary pore development—and then to quantitatively calculate the amount of pore increase and decrease in each stage [16,67]. The key aspects of this method include the microscopic recognition of diagenesis, the restoration of initial porosity, and the conversion between volumetric porosity and areal porosity.
Diagenesis plays an important role in the evolution of reservoir pores [68,69]. Microscopic observation of ordinary and cast thin sections of rocks revealed that the diagenesis of the sandstone reservoir of the Lower Shihezi Formation in the Duguijiahan block featured destructive and constructive processes: destructive diagenesis mainly included compaction (Figure 5a) and cementation (Figure 5b–d), while constructive diagenesis mainly included dissolution (Figure 5e–i). In addition, metasomatism has had little influence on pore evolution. The diagenetic stage can be divided according to the characteristics of the stratigraphic paleotemperature and organic matter maturity [70]. The illite–smectite mixed layer showed that the sandstones of the Lower Shihezi Formation in this study were in diagenetic stage B.
Research by Beard and Weyl [71] showed that the initial porosity of sandstone was related to its particle-sorting coefficient. According to their research, Schmoker and Gautier [72] established the following calculation formula of the initial porosity of sandstone:
φ o = 20.91 + 22.9 S o
S o = ϕ 25 ϕ 75
where φo is the initial porosity of unconsolidated sandstone (%); So is the track sorting coefficient of sandstone; and ϕ25 and ϕ75 are the grain diameters at 25% and 75% of the probability cumulative curve (mm), respectively.
According to the probability analysis, the initial porosity of sandstone in the Lower Shihezi Formation of the Duguijiahan block was between 28% and 40%.
The porosity obtained from thin-section observation was plane porosity, rather than true volumetric porosity. According to the porosity statistics for 38 thin sections, corresponding to plane porosity in this study, and the measured porosity data of samples at the same depth collected from physical property test report which corresponds to true volumetric porosity, by fitting their correlation, the plane porosity could be converted into accurate volumetric porosity (Figure 6). The calculation formula is as follows:
φ v = 1.3987 φ p 0.8855
where φp is the plane porosity, and φv is the true volumetric porosity.
Taking well J57 as an example, the identification results of the thin section from the Lower Shihezi Formation at a depth of 2996.3 m showed that, from a total porosity of 6% (Table 1), the plane porosity of cement was 5%, while dissolved pores accounted for 1%. According to the conversion formula between plane porosity and volumetric porosity, the corresponding pore reduction of cement was 5.82%, and the pore increase in dissolution was 1.40%. Based on the probability analysis and rock physical property test data, the initial porosity and current porosity of the sample were 39.84% and 6.28%, respectively. A compaction porosity reduction of 29.14% was deduced, and then the porosity evolution process of the sample was recovered (Table 2).
Notably, this method simplified the evolution process of porosity into four stages, but the actual evolution process did not necessarily follow the fixed sequence of compaction–cementation–dissolution. Taking well J57 as an example (Figure 7a), and based on the systematic analysis and establishment of the diagenetic sequence, the porosity evolution history was restored. Under the early rapid compaction and cementation, the porosity of the Lower Shihezi Formation reservoir decreased rapidly. Subsequently, diagenesis such as calcite cementation and quartz secondary enlargement continued to develop, which was accompanied by continuous compaction and pore reduction, finally becoming densified in the Early Jurassic (porosity < 10%). In period A of the middle diagenetic stage (paleo temperature ranging from 85 to 140 °C), the source rocks in the study area began to mature, the acid fluid produced by hydrocarbon generation entered the reservoir, and dissolution began. At this time, although compaction was weakened, the cementations of carbonate rock and siliceous did not stop, and the pore increase and pore reduction occurred simultaneously. When the reservoir entered period B of the middle diagenetic stage (paleo temperature ranging from 140 to 175 °C), the influence of compaction was minor, and the variation in the range of porosity was also small. In the Late Cretaceous, the tectonic uplift resulted in a continuous reduction in reservoir temperature, and diagenesis had a weak effect on pore transformation. Currently, the porosity of the Lower Shihezi Formation reservoir has inherited the basic characteristics of the late Early Cretaceous.
The porosity evolution process of the Shihezi Formation reservoir in well J110 was similar to that of well J57 (Figure 7b). The difference is that the source rock of well J57 generated gas earlier than that of well J110 (Evidence provided in Section 4.2.2). A small amount of acid fluid entered the reservoir about 150 Ma ago, forming a phase of weak dissolution, which played a certain role in improving reservoir pores.
Generally, the reservoir porosity of Lower Shihezi Formation in the Duguijiahan block has been better in the north than in the south. Based on the statistics of 604 core samples collected from 11 wells, the median and average of porosity distribution of the wells in the north were more than 7% (Figure 8). According to the porosity evolution law of the study area, the porosity distribution of the Lower Shihezi Formation reservoir has maintained this feature since the Early Cretaceous, which has provided conditions for late gas lateral adjustment.

4.2. Process of Hydrocarbon Generation and Charging

4.2.1. Characters of Fluid Inclusions

According to micropetrographic observation, four types of fluid inclusions were identified—that is, gas inclusions, oil inclusions, oil and gas two-phase inclusions, and brine inclusions—in the sandstone reservoir of the Lower Shihezi Formation in the Duguijiahan block. These four types of inclusions were distributed in the quartz overgrowth and healing fracture (Table 3). Among them, the gas inclusions were pure black under transmitted light, and the gas phase boundary had weak yellow fluorescence or no fluorescence. This boundary was generally distributed in the healing cracks of the quartz in strips, and a single block of pure gas inclusions in quartz particles was occasionally visible (Figure 9a,b). Single oil inclusions and oil and gas two-phase inclusions were less developed, and were mostly found in cements, developing in strips that were colorless under transmitted light and that had yellow or yellow green fluorescence (Figure 9c). Brine inclusions were distributed in quartz particles and generally were associated with oil and gas inclusions. Under transmitted light, it was observed that the black edge was wrapped with a transparent bubble, which was elliptical or irregular. The size ranged from 1 × 1.5 μm to 3 × 4 μm, and the gas–liquid ratio was 6–9% (Figure 9d). The laser Raman spectroscopy analysis showed that the main components of gas in the gas inclusions were CH4 and CO2 (Figure 9e,f). Therefore, when calculating the Th of brine inclusions, to determine the hydrocarbon gas charging time, it is necessary to calculate the Th of the brine inclusions associated with the gas-phase inclusions whose gas composition was CH4.

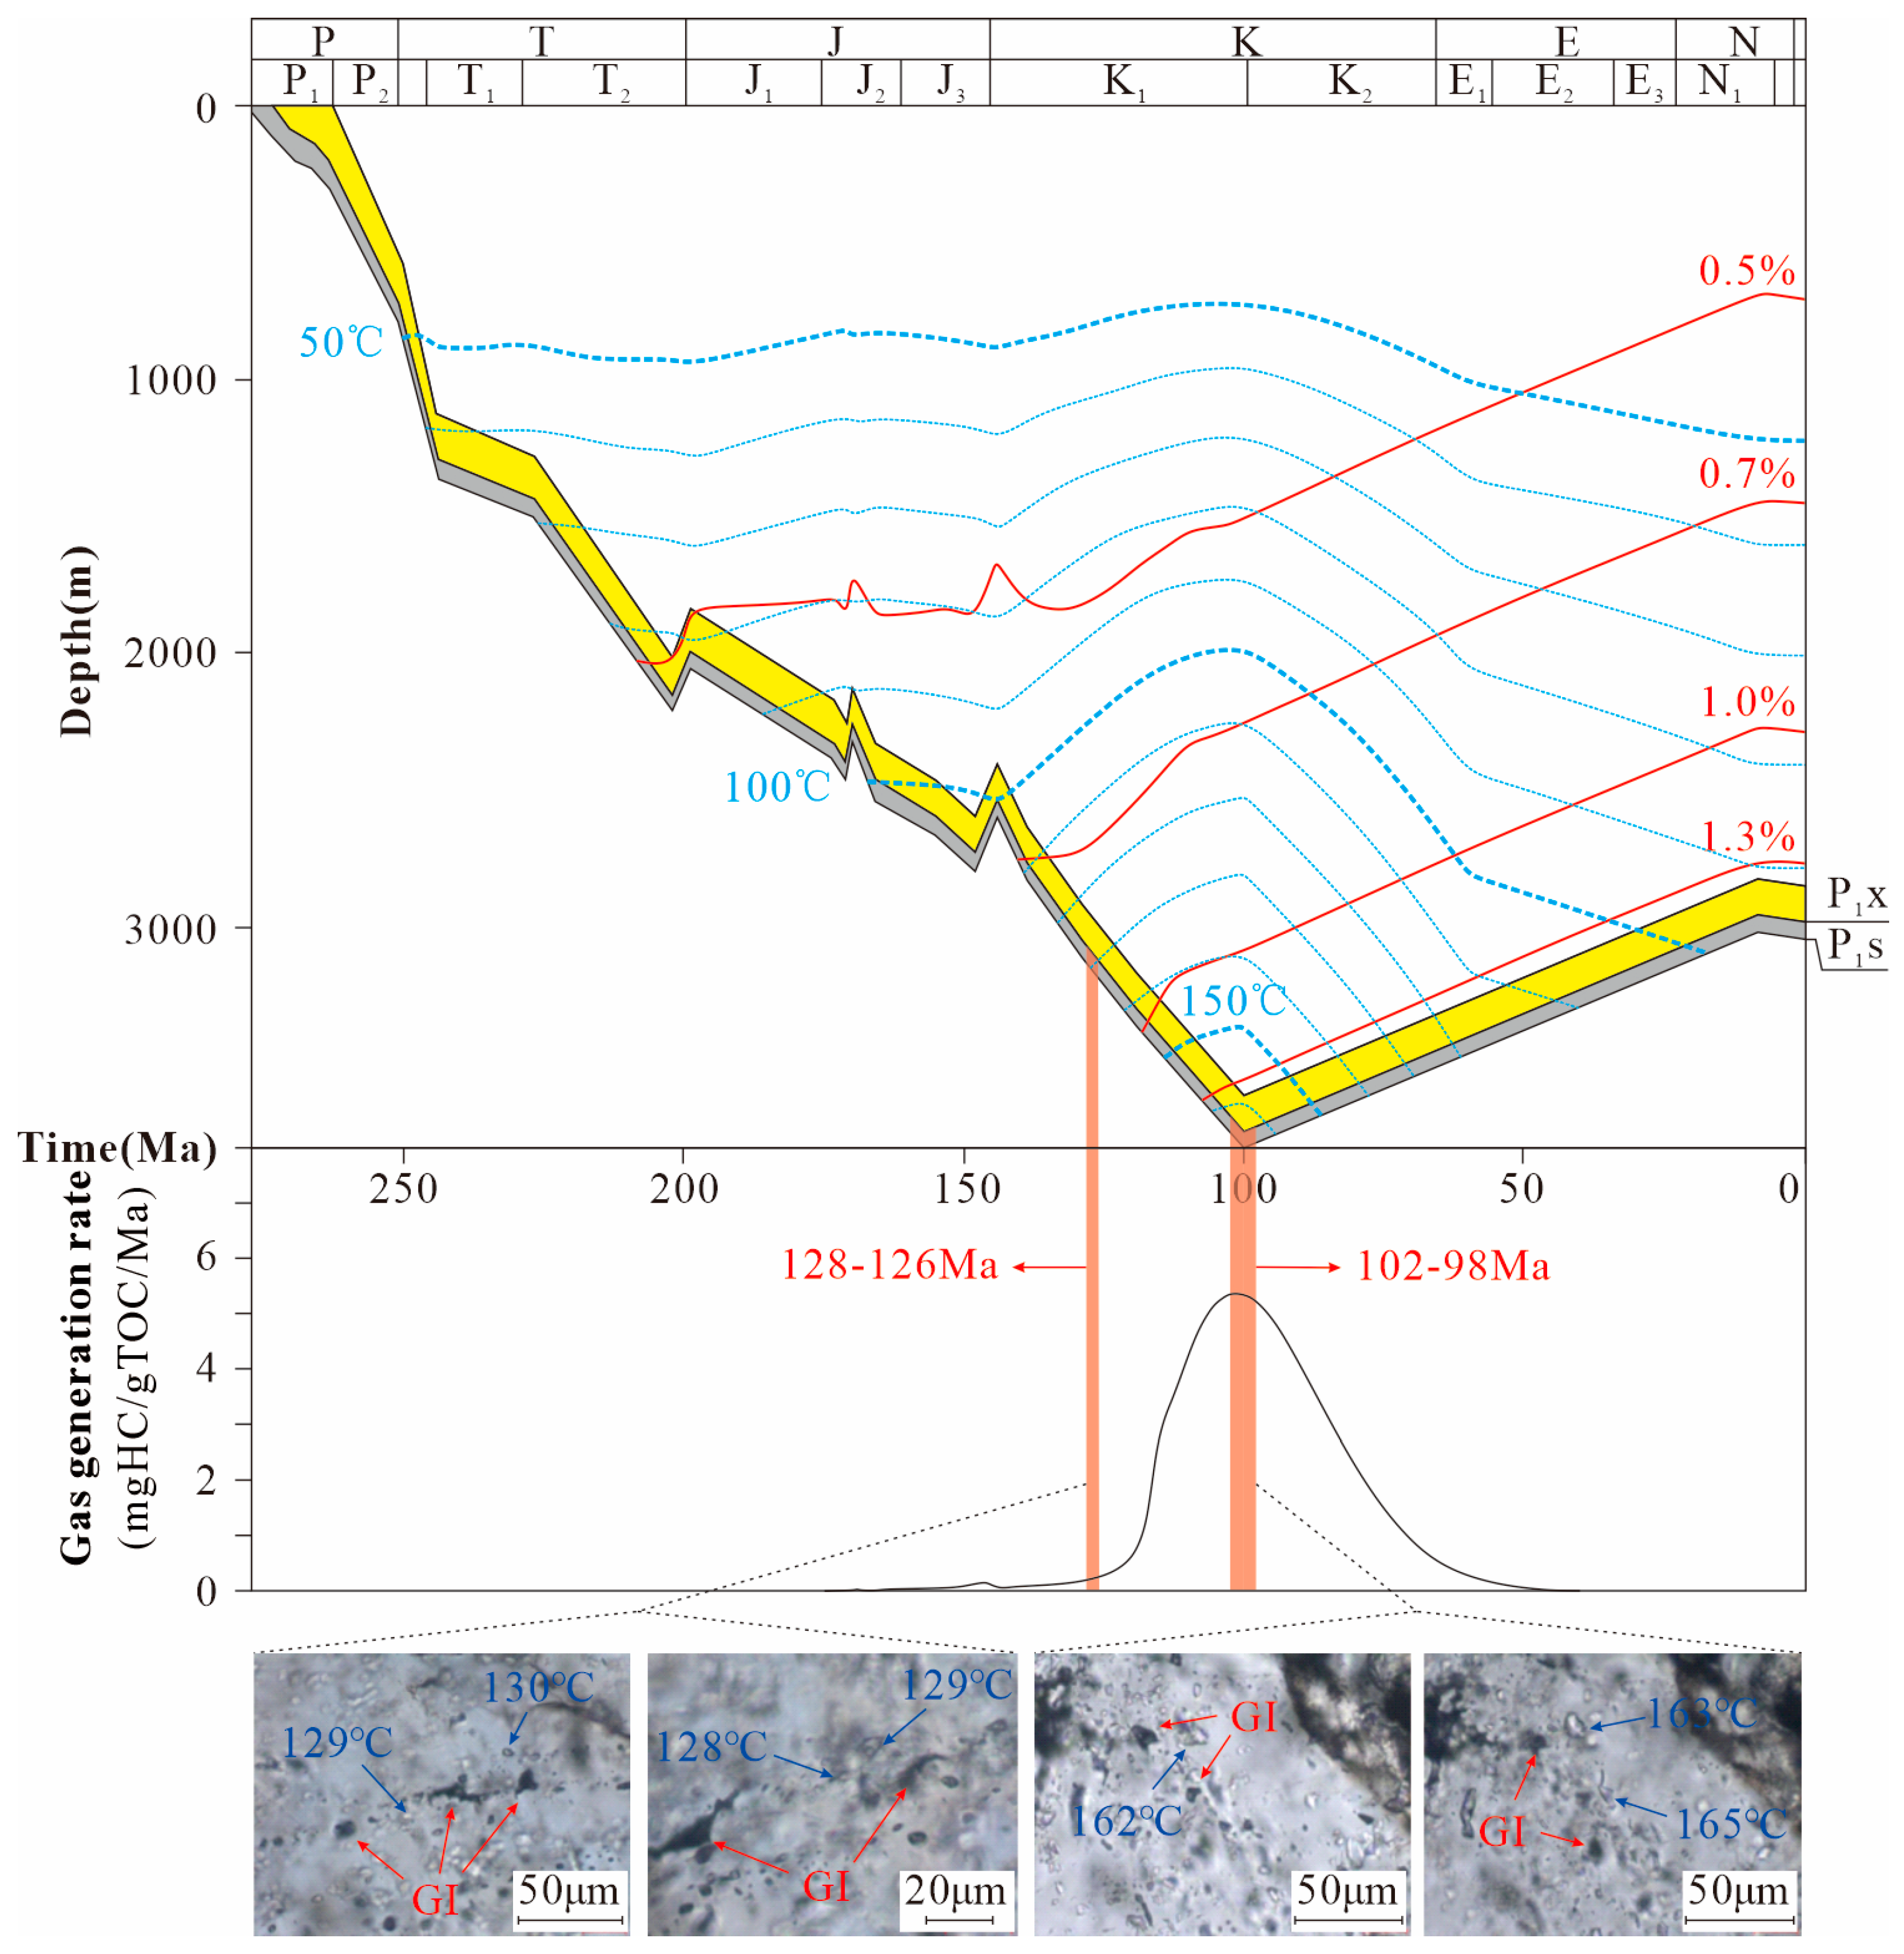
4.2.2. Hydrocarbon Charging Timing

According to this parameter setting and model selection, the formation thermal evolution of single wells with fluid inclusion testing were simulated. To verify the rationality of the simulation results, it is necessary to compare the simulation results with the measured data. Generally, the measured Ro value of source rock was compared with the simulated Ro value. If the two values were similar, this proved that the simulation result was reliable. Because the study area has limited source rock test data, the measured geothermal data of the four wells were selected as the comparison parameters in this study. The results showed that the relative error between the simulation results and the measured data was less than ±3%, which indicated that the simulation results were reliable (Table 4).
Taking wells J57 and J110, located in the south and north of the AB profile, as examples, the burial history, thermal evolution history, hydrocarbon generation history, and natural gas charging history were reconstructed (Figure 10 and Figure 11). The burial and hydrocarbon generation histories of the two wells were similar: the source rocks of the Taiyuan and Shanxi Formations were continuously deposited during the Permian and Triassic, and they entered the hydrocarbon generation threshold (Ro > 0.5%) at the Late Triassic. They later underwent a short period of uplift and erosion at the end of the Late Triassic, subsidence continued in the Jurassic, and they experienced two periods of uplift at the end of the Early Jurassic and the end of the Late Jurassic. The erosion thickness of these three stages of uplift was less than 200 m, which slightly slowed down the thermal evolution of the source rocks in the study area and made them enter the medium-maturity stage (Ro > 0.7%) in the Late Jurassic. At this time, there is a weak hydrocarbon generation peak in the two wells. The hydrocarbon generation rate of well J57 is 1.26 mgHC/gTOC/Ma and that of well J110 is 0.15 mgHC/gTOC/Ma. The difference in the hydrocarbon generation rate of source rock has little influence on reservoir evolution (Figure 7). After that, the strata continued to subside and reached the maximum paleo-burial depth and paleo-geothermal temperature at the end of the Early Cretaceous. The maximum paleotemperature at the bottom of the Taiyuan Formation of well J57 was about 152 °C, and that of Well J110 was slightly higher, reaching 163 °C.
The brine inclusions associated with hydrocarbon inclusions are selected for measurement, as they represent the lowest temperature at which the ore-forming fluid was captured [73]. For well J57, located in the south of the cross-well profile, two measured periods of brine inclusions were associated with the gas inclusions. Its Th values were 93–95 °C and 114–119 °C, indicating the two stage of natural gas charging that occurred in the Lower Shihezi Formation reservoir. The Th of the brine inclusions was projected onto the thermal evolution history of the Shihezi Formation in well J57. This inclusion showed that the corresponding charging time of the 93–95 °C inclusions in the first stage was 186–182 Ma in the Early Jurassic, and the corresponding charging time of the 114–119 °C inclusions in the second stage was 130–128 Ma in the Early Cretaceous. The laser Raman spectrum showed that the gas composition of the gas inclusions that were contemporaneous with the first stage of the brine inclusions was CO2, whereas the gas composition of the gas inclusions that were contemporaneous with the second stage of brine inclusions was a mixture of CO2 and CH4. These results indicated that the hydrocarbon gas charging time of the Lower Shihezi Formation reservoir in well J57 was in the Early Cretaceous period of 137–133 Ma (Figure 10). The well J110 in the north of the cross-well profile also measured two periods of brine inclusions associated with gas inclusions. The values of Th were 128–130 °C and 162–165 °C. Combined with the geotemperature evolution history and laser Raman spectrum, it was concluded that the Lower Shihezi Formation reservoir in well J110 experienced two hydrocarbon gas chargings, with charging times of 128–126 Ma and 102–98 Ma (Figure 11). Similarly, it was determined that the hydrocarbon gas charging time of the Lower Shihezi Formation reservoir in well J112 was 130–128 Ma and 105–103 Ma and that of well J103 was 122–115 Ma.
The history of natural gas charging in the Duguijiahan block can be reconstructed on the basis of this research. As mentioned previously, the coal seam source rocks of the Taiyuan and Shanxi Formations in the study area entered the maturation stage (Ro > 0.7%) at the end of the Jurassic, after three subsidences and three small uplifts. Research has shown that when coal and rock enter the hydrocarbon-generation threshold, the generated natural gas will contain a large amount of CO2, up to 90% (volume percentage) [58]. As the maturity of the source rock increased, the CO2 content gradually decreased. After Ro > 0.7%, the source rock was dominated by hydrocarbon generation. Therefore, the natural gas charging in the early stage (i.e., the Jurassic period) of the Lower Shihezi Formation reservoir was mainly CO2. After entering the Early Cretaceous, the strata subsided and were buried again, the source rocks were generally matured (Ro > 0.7%), and the generated hydrocarbon gas began to charge into the Lower Shihezi Formation reservoir.
By comparing the times between reservoir densification and natural gas charging of the Lower Shihezi Formation in the Duguijiahan block, it was discovered that the time of reservoir densification (the Early Jurassic) occurred before the hydrocarbon gas charging (the Early Cretaceous).

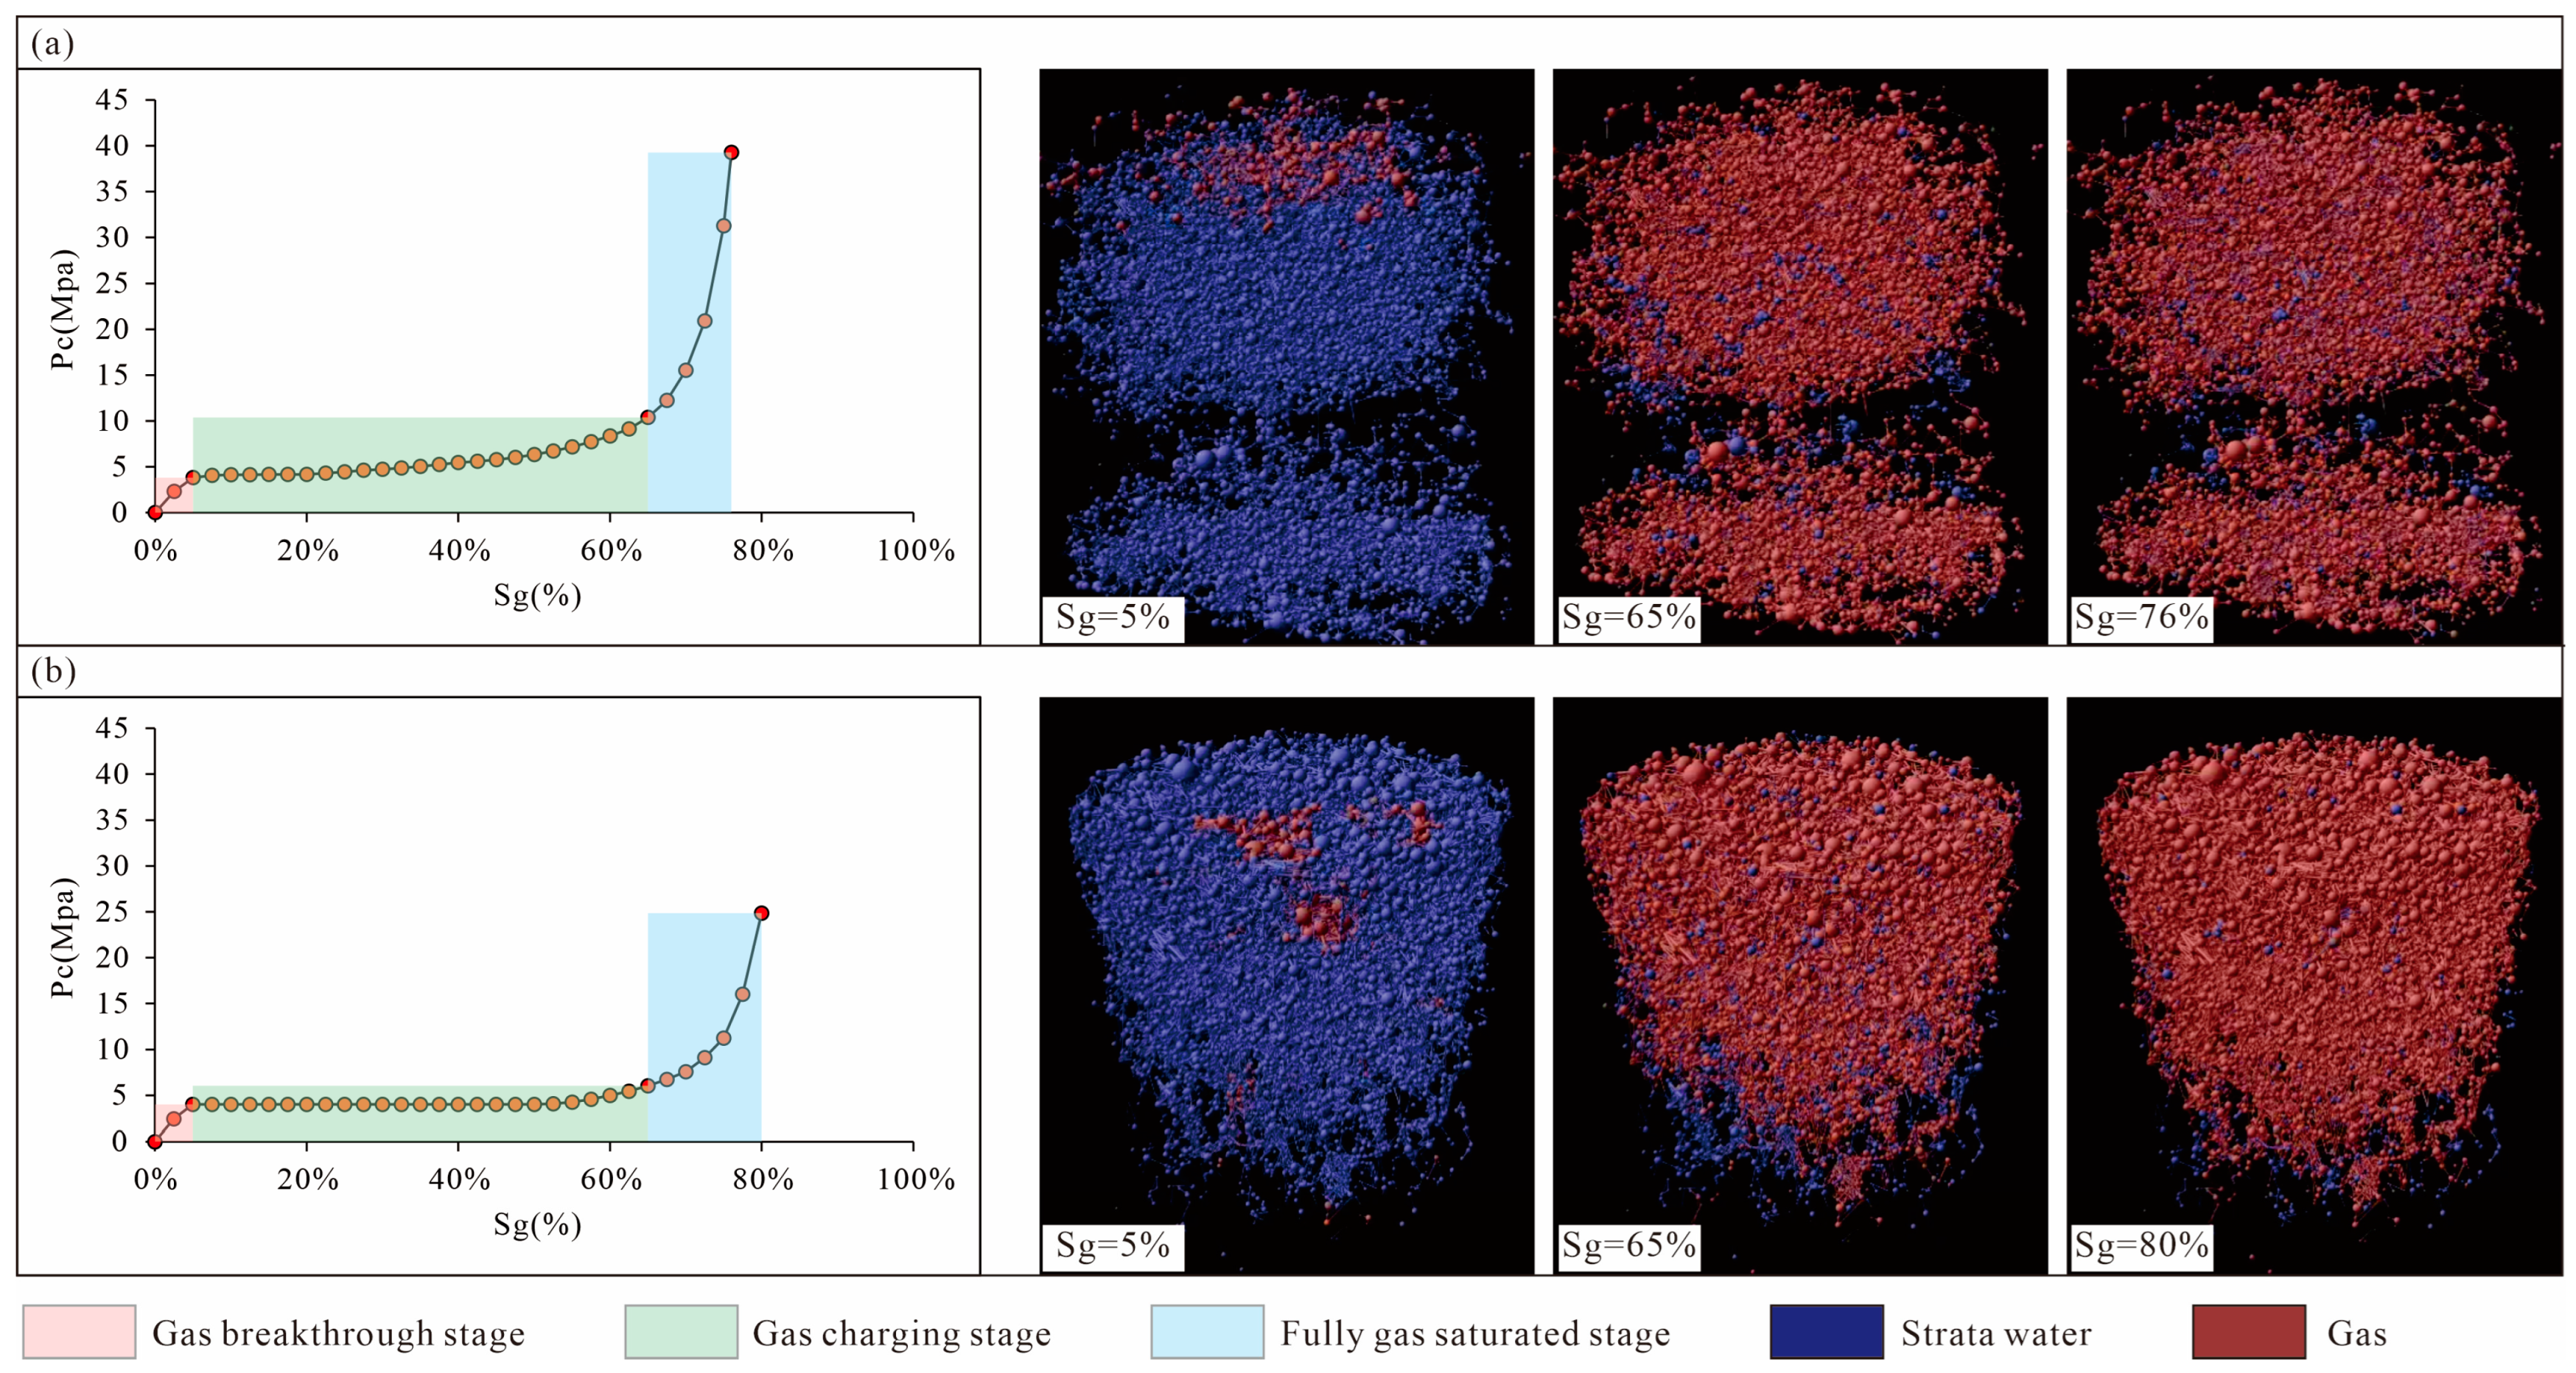
4.2.3. Gas Charging Process

The digital core model of Lower Shihezi Formation was established by CT (Computed Tomography) scanning of four core samples. Furthermore, the gas charging process was reconstructed using a seepage simulation (Figure 12).
The results of digital simulations show that the gas charging process can be divided into three stages. Taking Well J57 as an example, during the first stage of gas charging, i.e., gas breakthrough stage, the gas saturation was less than 5% and the simulated pressure were less than 3.83 MPa. The first stage can be considered as the preparation stage of gas charging. During the second stage, i.e., rapid gas charging stage, the gas saturation was 5–65%, and the simulated pressure were 3.83–10.40 MPa. The second stage is the main stage of gas charging, in which the gas saturation increases rapidly with the increase in simulated pressure. During the third stage, i.e., full gas saturation stage, the natural gas saturation is 65–76%, and the simulation pressure is 10.40–39.28 MPa. In the third stage, the gas saturation increases slowly with the increase in simulated pressure. When the gas saturation reaches 76%, it no longer increases with the increase in simulated pressure (Figure 12a). Due to the difference in reservoir physical properties and pore structure, the dynamic conditions of the gas charging process of well J110 are slightly different from those of well J57, but the overall charging process is similar. For well J110, the simulated pressure was 4.02 MPa in the gas breakthrough stage, it was 4.02–6.02 MPa in the rapid gas charging stage, and it was 6.02–24.86 MPa in the full gas saturation stage. The maximum saturation of natural gas is 80% (Figure 12b).

4.3. Process of Gas Migration

Based on the geochemical compositions of natural gas from 21 wells, the migration and accumulation processes of natural gas in the Duguijiahan block were reconstructed. Compared with other hydrocarbon gases, CH4 has the smallest molecular diameter and the largest solubility in formation water. Therefore, gas reservoirs far away from the source rocks are usually characterized by high CH4 content and high dryness coefficient (C1/C1–5) [13,74,75]. In addition, the molecular diameter of isoparaffin is smaller than that of normal paraffin, resulting in a rapid migration rate in the formation. Therefore, with increasing migration distance, the ratio of isoparaffin to normal paraffin will gradually increase [74].
In general, the natural gas in the Lower Shihezi Formation reservoir of the Duguijiahan block is generally wet gas, with a dryness coefficient ranging from 0.846 to 0.972, with an average value of 0.927. Furthermore, the dryness coefficient in the northern part ranges from 0.892 to 0.972, with an average of 0.932, and it ranges from 0.846 to 0.957 in the southern part, with an average of 0.919 (Table 5). Similarly, the dryness coefficient distribution map also shows a trend of increasing gradually from south to north (Figure 13), indicating that the natural gas in the Lower Shihezi Formation has undergone lateral migration from south to north.
Additionally, the ratio of isoparaffin to normal paraffin, mainly iC4/nC4 and iC5/nC5 values, provides further evidence for gas lateral migration (Figure 13). The iC4/nC4 values of natural gas in the northern part and the southern part range from 0.473 to 1.400 and 0.428 to 0.929, with average values of 0.760 and 0.630, respectively. On the other hand, the iC5/nC5 values of natural gas in the northern part and the southern part range from 0.518 to 2.231 and 1.032 to 1.500, with average values of 1.265 and 1.247, respectively (Table 5). To create the crossplot of iC4/nC4 and iC5/nC5 values, representative wells with thick sandstone in the south and north of the Duguijiahan block were chosen. The results show that the iC4/nC4 and iC5/nC5 of natural gas in the north reservoir are higher than those in the south, indicating that the natural gas has migrated laterally from the south to the north. The fluvial facies sandstone and stratigraphic slope provide conditions for lateral migration of natural gas (Figure 13).
The characteristics of the drilling daily production of natural gas provide evidence for the lateral migration. Recent exploration findings have shown that the Duguijiahan block was gas-rich in the north. According to the drilling gas test results, the daily gas production of wells J110 and J103 in the north of the main river channel was 40,360 m3 and 20,857 m3, respectively, while the daily gas production of wells J57 and J112 in the south was only 9120 m3 and 9822 m3, respectively. This difference in production is the result of natural gas adjustment and migration from the south to the north against the backdrop of better source rock conditions in the south [51,61].

5. Discussion

5.1. Hydrocarbon Accumulation Process

According to the regional tectonic–sedimentary evolution and natural gas charging history, the natural gas accumulation process in the Duguijiahan block can be categorized into three stages.

5.1.1. Depositional Stage

The depositional stage (C–P) refers to the Carboniferous and Permian periods. It is the sedimentary development phase of the upper Paleozoic coal seam source rock, sandstone reservoir, and mudstone caprock in the Duguijiahan block, which established the structural–sedimentary pattern of the upper Paleozoic source–reservoir–cap assemblage (Figure 14a). As noted previously, the Duguijiahan block is located in the transition area from the Yishan slope to the Yimeng uplift in the Ordos Basin (Figure 1). It is also the transition zone between the Porjianghaizi and Wulanjilinmiao Faults, and has a gentle sloping zone that is high in the northeast and low in the southwest. Vertical high-angle normal faults have developed, with a small fault distance (general vertical fault distance 10–20 m), extending upward to the Upper Shihezi Formation [49]. The Lower Paleozoic strata in the study area are missing. The Carboniferous and Permian strata directly overlie the lower Ordovician carbonate strata, and the thickness of the C-P strata gradually decrease northward [51,76]. The sedimentary environment during the Carboniferous and Permian periods experienced the following transition process: shallow shore–lagoon–tidal flat–interactive marine delta–inland river-lake facies [77]. The coal-bearing strata of the Carboniferous Taiyuan Formation and the Permian Shanxi Formation, including 6–20 m coal seams (average TOC = 67.3%) and 30–50 m dark mudstones (average TOC = 2.93%), were the main source rocks in study area. The organic matter type of source rock was gas-prone type III kerogen. Previous studies have shown that the source rocks in the study area have the potential to provide hydrocarbons to the area [35,61].
The Lower Shihezi Formation is the most important reservoir in the study area. A set of braided river sedimentary sandstone has developed, with an initial porosity of 28–40% [78]. During the sedimentary period of the first members of the Lower Shihezi Formation (P1x1), because of the tectonic uplift in the north, the material supply increased, the sedimentary thickness increased, and the alluvial fan and braided river deposits developed. The whole area was basically covered by river sand bodies, and the river sand bodies appeared in succession. During the deposition period of the second and third members of the Lower Shihezi Formation (P1x2 and P1x3), because of the decrease in sediment supply, the thickness of the sand body began to decrease, and the overlapping width of river channel also decreased significantly. Thus, the development of the sand body was relatively limited [79]. The upper Shihezi Formation and Shiqianfeng Formation in the upper Permian constituted the regional capping beds of the Upper Paleozoic gas reservoirs, which were widely distributed and developed stable thick mudstones (thickness 130–160 m) [80].

5.1.2. Natural Gas Accumulation Stage

The natural gas accumulation stage (T–K1) refers to the period from the Triassic to the Early Cretaceous. It is the main period of source rock maturation, reservoir densification, and natural gas charging in the Duguijiahan block, forming the rudiment of the Lower Shihezi Formation gas reservoir (Figure 14b). After entering the Triassic, with the continuous burial of the upper Paleozoic strata, the source rock of the Taiyuan and Shanxi Formations gradually matured, and the reservoir of the Lower Shihezi Formation continued to reduce porosity (Figure 7). During this period, although there were three periods of tectonic uplift and erosion, which occurred at the ends of the Late Triassic, the Early Jurassic, and the Late Jurassic, the source rock’s maturity was slowed only minimally by the uplift’s small amplitude [59,81]. The source rocks entered the hydrocarbon generation threshold (Ro > 0.5%) in the Early Triassic, but mainly generated CO2. The early CO2 and a small amount of CH4 charging occurred as early as 186–183 Ma ago (Figure 10). The primary migration pathways were high-angle, early active faults (including fractures). At this time, the reservoir of the Lower Shihezi Formation was not densified (porosity > 10%), and the resistance of natural gas migration was minor. Buoyancy and gas diffusion may have driven the migration of natural gas in the reservoir. In the Middle Jurassic, most of the Lower Shihezi Formation reservoirs in the area gradually became densified (porosity < 10%). At the end of the Jurassic, the source rocks generally entered the mature stage (Ro > 0.7%), and the gas generation products gradually changed from CO2 to CH4, and hydrocarbon gas charging occurred in the south in the Early Cretaceous of 130–128 Ma. Meanwhile, the Lower Shihezi Formation reservoir was almost densified, and natural gas distribution was controlled by the distribution of the reservoir’s physical properties. Under such conditions, lateral migration was difficult. By the end of the Early Cretaceous, the source rock and reservoir had reached the maximum paleo-burial depth, the natural gas charging had basically finished, and the diagenesis had slowed down. Since then, the reservoir’s porosity has basically been finalized and preserved, and the tight-gas reservoir of the Lower Shihezi Formation in the Duguijiahan block was formed.

5.1.3. Gas Reservoir Adjustment Stage

The gas reservoir adjustment stage (K2–present) refers to the time from the late Cretaceous to the present day. During this period, the Ordos Basin was uplifted as a whole, it has suffered from different degrees of erosion, the geothermal temperature and pressure was reduced, and some of the gas reservoirs that formed in the early stage (J–K1) have adjusted and reformed (Figure 14c). During the Himalayan movement, the continuous subduction of the ancient Pacific plate to the North China plate and the collision of the Indian Ocean plate in the north-northeast direction caused the uplift and extinction of the Ordos Basin, which resulted in it entering the later stage of transformation [50,82]. The Duguijiahan block was also uplifted, and erosion occurred during this period, with an erosion thickness of 600–800 m [81]. At the same time, the geothermal temperature decreased, the hydrocarbon generation of source rocks tended to stop, and the reservoir pressure gradually decreased to negative pressure. Tectonic movement was accompanied by changes in the pressure system, which promoted the development of fractures [83,84,85]. During this period, a series of structural microfractures formed in the upper Paleozoic strata of the Ordos Basin, providing a channel for vertical and lateral migration and adjustment of natural gas. The development of structural microfractures improved the seepage ability of tight sandstone and enhanced communication with high-porosity sand bodies. As a result, the natural gas charged in the early stage could migrate to high parts in the north [55,86,87].

5.2. Hydrocarbon Accumulation Model in the Transition Zone

The transition zone refers to the area between a typical tight sandstone gas reservoir and a typical conventional gas reservoir. The tight gas reservoir in the transition zone combines the characteristics of a typical tight sandstone gas reservoir and a typical conventional gas reservoir, and it is different from them. Typical tight sandstone gas reservoirs generally exist in the interior or deep depressions of basins, characterized by large area contact between source rocks and reservoirs, and are mainly of primary migration. On the contrary, conventional gas reservoirs generally exist in the uplift or shallow layer at the margin of the basin and are characterized by separation of source rocks and reservoirs. The source rock and reservoir are neither in large-area contact nor directly separated in the tight gas reservoir in the transition zone, but are gradually pinched out in one direction (Figure 14). For conventional gas reservoirs, the source rock is far away from the reservoir, and natural gas generated by the source rock needs to travel a long distance through secondary migration [1,4,5]. The tight gas reservoir in the transitional zone can be regarded as a transitional gas reservoir on the migration path of natural gas generated in the interior of the basin (Figure 14c). Compared with the typical tight sandstone gas reservoir, the tight gas reservoir in the transition zone may have a longer distance of secondary migration, and the natural gas accumulates more easily in high positions, which is similar to conventional gas reservoirs. Therefore, these feature makes the exploration of the two types of gas reservoir different. Consideration should be given to lithologic gas reservoirs in the downdip direction for tight gas reservoirs in the transition zone, but more consideration should be given to gas reservoirs with favorable preservation conditions in the updip direction (Figure 15).

6. Conclusions

The following conclusions were reached:
(a) The Lower Shihezi Formation reservoir in the Duguijiahan block started hydrocarbon gas charging in the south as early as the early Cretaceous (130–128 Ma), and then gradually began charging in the north through the end of the early Cretaceous (102–98Ma).
(b) Three stages were identified in the digital gas charging simulations, i.e., the breakthrough, rapid, and fully saturated stages.
(c) The initial porosity of the Lower Shihezi Formation reservoir was between 28% and 40%. During the burial process, because of strong compaction and interstitial filling, the initial porosity decreased rapidly, and it was basically densified in the Late Jurassic. The time of the hydrocarbon gas charging was generally later than that of reservoir densification.
(d) The current physical properties of the Lower Shihezi Formation reservoir have inherited the basic characteristics of the end of the Early Cretaceous. The average porosity of the current reservoir is 8.58%, and the average permeability is 0.88 mD, classifying it as a tight reservoir.
(e) The gas accumulation process of the Lower Shihezi Formation had three stages: (1) the depositional stage (C–P), corresponding to the depositional period of the source–reservoir–cap combination in the gas reservoir; (2) the natural gas accumulation stage (T–K1), corresponding to the period of rapid source rock maturation and natural gas charging; and (3) the gas reservoir adjustment stage (K2–present), corresponding to the period of uplift and natural gas charging in the early stage that gradually migrated and accumulated northward along the fracture zone.
(f) More consideration should be given to gas reservoirs with favorable preservation conditions in the updip direction for tight gas reservoirs in the transition zone.

Author Contributions

The contributions to this manuscript were as follows. Conceptualization, J.Y.; methodology, Q.C. and H.Y.; investigation, H.Y.; data curation, W.Z.; writing—original draft preparation, H.Y.; writing—review and editing, Y.L.; visualization, Y.L. All authors have read and agreed to the published version of the manuscript.

Funding

This research was funded by the Scientific Research and Technology Project of North China Petroleum Bureau, SINOPEC (No. 3455000-17-ZC0609-0006).

Data Availability Statement

The data that support the findings of this study are available from the corresponding author upon reasonable request.

Acknowledgments

We thank Zhi Li of the Department of Petroleum Geology, School of Earth Resources, China University of Geosciences (Wuhan), for his support in collecting and sorting the data. We sincerely thank the SINOPEC North China Petroleum Bureau for providing research data and samples.

Conflicts of Interest

The authors declare no conflict of interest.

References

  1. Zou, C.; Zhu, R.; Wu, S.; Yang, Z.; Tao, S.; Yuan, X. Types, characteristics, genesis and prospects of conventional and unconventional hydrocarbon accumulations:taking tight oil and tight gas in China as an instance. Acta Pet. Sin. 2012, 33, 173–187. [Google Scholar] [CrossRef]
  2. Arthur, M.A.; Cole, D.R. Unconventional Hydrocarbon Resources: Prospects and Problems. Elements 2014, 10, 257–264. [Google Scholar] [CrossRef]
  3. Kang, Y.; Zhou, L. The strategic thinking of unconventional petroleum and gas in China. Earth Sci. Front. 2016, 23, 1–7. (In Chinese) [Google Scholar] [CrossRef]
  4. Dai, J.; Ni, Y.; Wu, X. Tight gas in China and its significance in exploration and exploitation. Pet. Explor. Dev. 2012, 39, 277–284. [Google Scholar] [CrossRef]
  5. Jia, C. Breakthrough and significance of unconventional oil and gas to classical petroleum geology theory. Pet. Explor. Dev. 2017, 44, 1–10. [Google Scholar] [CrossRef]
  6. Zou, C.; Yang, Z.; He, D.; Wei, Y.; Li, J.; Jia, A.; Chen, J.; Zhao, Q.; Li, Y.; Li, J.; et al. Theory, technology and prospects of conventional and unconventional natural gas. Pet. Explor. Dev. 2018, 45, 604–618. [Google Scholar] [CrossRef]
  7. Masters, J.A. Deep Basin Gas Trap, Western Canada. AAPG Bull. 1979, 63, 152–181. [Google Scholar] [CrossRef]
  8. Hart, B.S. Seismic expression of fracture-swarm sweet spots, Upper Cretaceous tight-gas reservoirs, San Juan Basin. AAPG Bull. 2006, 90, 1519–1534. [Google Scholar] [CrossRef]
  9. Ryder, R.T.; Zagorski, W.A. Nature, origin, and production characteristics of the Lower Silurian regional oil and gas accumulation, central Appalachian basin, United States. AAPG Bull. 2003, 87, 847–872. [Google Scholar] [CrossRef]
  10. Guo, X.; Liu, K.; Jia, C.; Song, Y.; Zhao, M.; Zhuo, Q.; Lu, X. Hydrocarbon accumulation processes in the Dabei tight-gas reservoirs, Kuqa Subbasin, Tarim Basin, northwest China. AAPG Bull. 2016, 100, 1501–1521. [Google Scholar] [CrossRef]
  11. Zhao, S.; Chen, W.; Wang, Z.; Li, T.; Wei, H.; Ye, Y. Fluid geochemistry of the Jurassic Ahe Formation and implications for reservoir formation in the Dibei area, Tarim Basin, northwest China. Energy Explor. Exploit. 2018, 36, 801–819. [Google Scholar] [CrossRef]
  12. Yang, Z.; He, S.; Guo, X.; Li, Q.; Chen, Z.; Zhao, Y. Formation of low permeability reservoirs and gas accumulation process in the Daniudi Gas Field, Northeast Ordos Basin, China. Mar. Pet. Geol. 2015, 70, 222–236. [Google Scholar] [CrossRef]
  13. Peng, W.; Guo, F.; Hu, G.; Lyu, Y.; Gong, D.; Liu, J.; Feng, Z.; Guo, J.; Guo, Y.; Han, W. Geochemistry and accumulation process of natural gas in the Shenmu Gas Field, Ordos Basin, central China. J. Pet. Sci. Eng. 2019, 180, 1022–1033. [Google Scholar] [CrossRef]
  14. Wu, H.; Zhao, J.; Wu, W.; Li, J.; Huang, Y.; Chen, M. Formation and diagenetic characteristics of tight sandstones in closed to semi-closed systems: Typical example from the Permian Sulige gas field. J. Pet. Sci. Eng. 2020, 199, 108248. [Google Scholar] [CrossRef]
  15. Hao, L.; Ma, X.; Gao, W.; Ren, Z.; Tao, H.; Huang, W. Geochemical Characteristics of the Chang 7 Source Rocks of the Triassic Yanchang Formation in Ordos Basin, China: Implications for Organic Matter Accumulation and Shale Oil Potential. Energies 2022, 15, 7815. [Google Scholar] [CrossRef]
  16. Xu, Z.; Jiang, S.; Liu, L.; Wu, K.; Li, R.; Liu, Z.; Shao, M.; Jia, K.; Feng, Y. Natural gas accumulation processes of tight sandstone reservoirs in deep formations of Songliao Basin, NE China. J. Nat. Gas Sci. Eng. 2020, 83, 103610. [Google Scholar] [CrossRef]
  17. Wang, Q.; Chen, D.; Wang, F.; Gao, X.; Zou, Y.; Tian, Z.; Li, S.; Chang, S.; Yao, D. Origin and distribution of an under-pressured tight sandstone reservoir: The Shaximiao Formation, Central Sichuan Basin. Mar. Petrol. Geol. 2021, 132, 121–128. [Google Scholar] [CrossRef]
  18. Zhao, X.; Zeng, J.; Han, G.; Feng, S.; Shi, Q.; Liu, Y.; Fu, D.; Wang, Y.; Zong, J.; Lu, Y. Charging characteristics and accumulation process of deep low-permeability (tight) sand gas reservoirs in Banqiao Sag, Huanghua Depression. Oil Gas Geol. 2020, 41, 15. (In Chinese) [Google Scholar] [CrossRef]
  19. Zhou, X.; Xu, G.; Cui, H.; Zhang, W. Fracture development and hydrocarbon accumulation in tight sandstone reservoirs of the Paleogene Huagang Formation in the central reversal tectonic belt of the Xihu Sag, East China Sea. Pet. Explor. Dev. 2020, 47, 499–512. [Google Scholar] [CrossRef]
  20. Yu, Z.; Wang, Z.; Adenutsi, C.D. Genesis of authigenic clay minerals and their impacts on reservoir quality in tight conglomerate reservoirs of the Triassic Baikouquan formation in the Mahu Sag, Junggar Basin, Western China. Mar. Pet. Geol. 2023, 148, 106041. [Google Scholar] [CrossRef]
  21. Xia, L.; Cao, Y.; Bian, B.; Liu, H.; Wang, X.; Zhao, Y.; Yan, M. Genesis of calcite vein in basalt and its effect on reservoir quality: A case study of the Carboniferous in the east slope of Mahu sag, Junggar Basin, NW China. Pet. Explor. Dev. 2021, 48, 864–876. [Google Scholar] [CrossRef]
  22. Jia, J.; Yin, W.; Qiu, N.; Wang, G.; Ma, L.; Liu, Y.; Liu, N. Migration and accumulation of crude oil in Upper Triassic tight sand reservoirs on the southwest margin of Ordos Basin, Central China: A case study of the Honghe Oilfield. Geol. J. 2017, 53, 2280–2300. [Google Scholar] [CrossRef]
  23. Zhi, D.; Tang, Y.; He, W.; Guo, X.; Zheng, M.; Huang, L. Orderly coexistence and accumulation models of conventional and unconventional hydrocarbons in Lower Permian Fengcheng Formation, Mahu sag, Junggar Basin. Pet. Explor. Dev. 2021, 48, 43–59. [Google Scholar] [CrossRef]
  24. Liu, C.; Wang, J.; Zhang, D.; Zhao, H.; Zhao, J.; Huang, L.; Wang, W.; Qin, Y. Genesis of rich hydrocarbon resources and their occurrence andaccumulation characteristics in the Ordos Basin. Oil Gas Geol. 2021, 42, 1011–1029. (In Chinese) [Google Scholar] [CrossRef]
  25. Yang, H.; Fu, J.; Wei, X.; Liu, X. Sulige field in the Ordos Basin: Geological setting, field discovery and tight gas reservoirs. Mar. Pet. Geol. 2008, 25, 387–400. [Google Scholar] [CrossRef]
  26. Liu, Q.; Jin, Z.; Meng, Q.; Wu, X.; Jia, H. Genetic types of natural gas and filling patterns in Daniudi gas field, Ordos Basin, China. J. Asian Earth Sci. 2015, 107, 1–11. [Google Scholar] [CrossRef]
  27. Huang, S.; Fang, X.; Liu, D.; Fang, C.; Huang, T. Natural gas genesis and sources in the Zizhou gas field, Ordos Basin, China. Int. J. Coal Geol. 2015, 152, 132–143. [Google Scholar] [CrossRef]
  28. Min, Q.; Fu, J.; Xi, S.; Liu, X.; Wang, T.; Ji, H.; Li, Y. Characteristics of natural gas migration and accumulation in the Upper Paleozoic of Ordos basin. Pet. Explor. Dev. 2000, 27, 26–29. (In Chinese) [Google Scholar]
  29. Li, L.; Yuan, Z.; Hui, K.; Liu, S. Accumulation regularity of Upper Paleozoic gas in north Ordos Basin. Oil Gas Geol. 2000, 21, 268–271. (In Chinese) [Google Scholar] [CrossRef]
  30. Hong, F.; Song, Y.; Zhao, L. Controlling factors of gas reservoir formation in the north of Ordos Basin. Nat. Gas Ind. 1998, 18, 22–25. (In Chinese) [Google Scholar]
  31. Zhang, J.; Chang, X.; Zhang, J. Deep basin gas trap in the Upper Paleozoic of Ordos basin. Pet. Explor. Dev. 2000, 27, 30–35. (In Chinese) [Google Scholar]
  32. Wang, Z.; Zhang, J. Mechanism of deep basin gas accumulation in the Upper Paleozoic in Ordos Basin. Nat. Gas Ind. 2006, 26, 52–54. (In Chinese) [Google Scholar]
  33. Wang, R.; Liu, K.; Shi, W.; Qin, S.; Zhang, W.; Qi, R.; Xu, L. Reservoir Densification, Pressure Evolution, and Natural Gas Accumulation in the Upper Paleozoic Tight Sandstones in the North Ordos Basin, China. Energies 2022, 15, 1990. [Google Scholar] [CrossRef]
  34. Mingjian, W.; Dengfa, H.; Hongping, B.; Renqi, L.; Baoling, G. Upper Palaeozoic gas accumulations of the Yimeng Uplift, Ordos Basin. Pet. Explor. Dev. 2011, 38, 30–39. [Google Scholar] [CrossRef]
  35. Yang, H.; Fu, J.; Liu, X.; Meng, P. Accumulation conditions and exploration and development of tight gas in the Upper Paleozoic of the Ordos Basin. Pet. Explor. Dev. 2012, 39, 315–324. [Google Scholar] [CrossRef]
  36. Yang, M.; Li, L.; Zhou, J.; Jia, H.; Sun, X.; Qu, X.; Zhou, D.; Gong, T.; Ding, C. Mesozoic structural evolution of the Hangjinqi area in the northern Ordos Basin, North China. Mar. Pet. Geol. 2015, 66, 695–710. [Google Scholar] [CrossRef]
  37. Xu, Q.; Shi, W.; Xie, X.; Busbey, A.B.; Xu, L.; Wu, R.; Liu, K. Inversion and propagation of the Late Paleozoic Porjianghaizi fault (North Ordos Basin, China): Controls on sedimentation and gas accumulations. Mar. Pet. Geol. 2018, 91, 706–722. [Google Scholar] [CrossRef]
  38. Yang, Y.; Li, W.; Ma, L. Tectonic and stratigraphic controls of hydrocarbon systems in the Ordos basin: A multicycle cratonic basin in central China. AAPG Bull. 2005, 89, 255–269. [Google Scholar] [CrossRef]
  39. Hanson, A.D.; Ritts, B.D.; Moldowan, J.M. Organic geochemistry of oil and source rock strata of the Ordos Basin, north-central China. AAPG Bull. 2007, 91, 1273–1293. [Google Scholar] [CrossRef]
  40. Gao, J.; Ma, B.; Lu, Y.; Zhang, W.; Cao, Q. Origin of authigenic kaolinite with implications for Permian tight gas sandstone reservoirs in the northern Ordos Basin, central China. J. Nat. Gas Sci. Eng. 2022, 99, 104429. [Google Scholar] [CrossRef]
  41. Guo, Z.; Zhang, J.; Yu, Z. The evolutional characteristics of structure of the oil and gas bearing areas in Ordos Massif. Pet. Explor. Dev. 1994, 21, 22–29. (In Chinese) [Google Scholar]
  42. Xiao, X.; Zhao, B.; Thu, Z.; Song, Z.; Wilkins, R. Upper Paleozoic petroleum system, Ordos Basin, China. Mar. Pet. Geol. 2005, 22, 945–963. [Google Scholar] [CrossRef]
  43. Yang, H.; Xi, S.; Wei, X.; Li, Z. Evolution and Natural Gas Enrichment of Multicycle Superimposed Basin in Ordos Basin. China Pet. Explor. 2006, 11, 17–24. (In Chinese) [Google Scholar]
  44. Zhang, L.; Liu, C.; Fayek, M.; Wu, B.; Lei, K.; Cun, X.; Sun, L. Hydrothermal mineralization in the sandstone–hosted Hangjinqi uranium deposit, North Ordos Basin, China. Ore Geol. Rev. 2017, 80, 103–115. [Google Scholar] [CrossRef]
  45. Wang, G.; Chang, X.; Yin, W.; Li, Y.; Song, T. Impact of diagenesis on reservoir quality and heterogeneity of the Upper Triassic Chang 8 tight oil sandstones in the Zhenjing area, Ordos Basin, China. Mar. Pet. Geol. 2017, 83, 84–96. [Google Scholar] [CrossRef]
  46. Lai, J.; Wang, S.; Wang, G.; Shi, Y.; Zhao, T.; Pang, X.; Fan, X.; Qin, Z.; Fan, X. Pore structure and fractal characteristics of Ordovician Majiagou carbonate reservoirs in Ordos Basin, China. AAPG Bull. 2019, 103, 2573–2596. [Google Scholar] [CrossRef]
  47. Liu, D.; Li, J.; Liu, J.-Q.; Zhang, L. Modeling hydrocarbon accumulation based on gas origin and source rock distribution in Paleozoic strata of the Ordos Basin, China. Int. J. Coal Geol. 2020, 225, 103486. [Google Scholar] [CrossRef]
  48. Li, H.-Y.; He, B.; Xu, Y.-G.; Huang, X.-L. U–Pb and Hf isotope analyses of detrital zircons from Late Paleozoic sediments: Insights into interactions of the North China Craton with surrounding plates. J. Asian Earth Sci. 2010, 39, 335–346. [Google Scholar] [CrossRef]
  49. Yang, M.; Li, L.; Zhou, J.; Qu, X.; Zhou, D. Segmentation and inversion of the Hangjinqi fault zone, the northern Ordos basin (North China). J. Asian Earth Sci. 2013, 70–71, 64–78. [Google Scholar] [CrossRef]
  50. Yang, H.; Liu, X.; Yan, X. The relationship between tectonic sedimentary evolution and tight sandstone gas reservoir since the late Paleozoic in Ordos Basin. Earth Sci. Front. 2015, 22, 174–183. [Google Scholar] [CrossRef]
  51. Xue, H.; Wang, Y.; Mao, X.; Xu, B.; Xia, H.; Yin, Y.; Guo, H. The timing of gas pooling in the Upper Paleozoic in the northern Ordos Basin: A case study of the Hangjinqi Block. Nat. Gas Ind. 2009, 29, 9–12. (In Chinese) [Google Scholar] [CrossRef]
  52. Dou, W.; Hou, M.; Dong, G. Provenance analysis of the Upper Paleozoic Shanxi to Lower Shihezi formations in north Ordos basin. Nat. Gas Ind. 2009, 29, 25–28. [Google Scholar] [CrossRef]
  53. Guan, Y.; Guo, Q.; Pu, R.; Gao, X.; Chen, S.; Ji, T. Distribution of Upper Paleozoic Coal Seams in the Southeastern Ordos Basin. Energies 2022, 15, 5110. [Google Scholar] [CrossRef]
  54. Wang, R.; Shi, W.; Xie, X.; Zhang, W.; Qin, S.; Liu, K.; Busbey, A.B. Clay mineral content, type, and their effects on pore throat structure and reservoir properties: Insight from the Permian tight sandstones in the Hangjinqi area, north Ordos Basin, China. Mar. Pet. Geol. 2020, 115, 104281. [Google Scholar] [CrossRef]
  55. Qin, S.; Wang, R.; Shi, W.; Liu, K.; Zhang, W.; Xu, X.; Qi, R.; Yi, Z. Diverse effects of intragranular fractures on reservoir properties, diagenesis, and gas migration: Insight from Permian tight sandstone in the Hangjinqi area, north Ordos Basin. Mar. Pet. Geol. 2022, 137, 105526. [Google Scholar] [CrossRef]
  56. Wu, X.; Ni, C.; Liu, Q.; Liu, G.; Zhu, J.; Chen, Y. Genetic Types and Source of the Upper Paleozoic Tight Gas in the Hangjinqi Area, Northern Ordos Basin, China. Geofluids 2017, 2017, 4596273. [Google Scholar] [CrossRef] [Green Version]
  57. Anees, A.; Shi, W.; Ashraf, U.; Xu, Q. Channel identification using 3D seismic attributes and well logging in lower Shihezi Formation of Hangjinqi area, northern Ordos Basin, China. J. Appl. Geophys. 2019, 163, 139–150. [Google Scholar] [CrossRef]
  58. Mao, R.; Mi, J.; Zhang, S.; He, K. Study on the Hydrocarbon Generation Characteristics of Different Coaly Source Rocks by Gold-tube Pyrolysis Experiments. Nat. Gas Geosci. 2012, 23, 1127–1134. (In Chinese) [Google Scholar] [CrossRef]
  59. Zhao, G.P. Characterization of fluid inclusions and timing of gas accumulation in Upper Paleozoic reservoirs of Hangjinqi area, Ordos Basin. Oil Gas Geol. 2017, 38, 905–912. (In Chinese) [Google Scholar] [CrossRef]
  60. Ren, Z.; Qi, K.; Li, J.; Huo, X.; Cui, J.; Yang, P.; Wang, K.; Chen, Z.; Yang, G. Thermodynamic evolution and hydrocarbon accumulation in the Ordos Basin. Oil Gas Geol. 2021, 42, 1030–1042. (In Chinese) [Google Scholar] [CrossRef]
  61. Wang, H.; Zhao, G.; Lu, S.; Li, L.; Zhang, W.; Liu, J. Investigation on hydrocarbon generation and expulsion potential by deep learning and comprehensive evaluation method: A case study of Hangjinqi area, Ordos Basin. Mar. Pet. Geol. 2022, 144, 105841. [Google Scholar] [CrossRef]
  62. Waples, D.W.; Kamata, H.; Suizu, M. The art of maturity modeling. Part 1: Alternative models and sensitivity analysis. AAPG Bull. 1992, 76, 47–66. [Google Scholar]
  63. Liu, Y.; Ye, J.; Zong, J.; Wang, D.; Cao, Q.; Yang, B.; Li, W.; Zhao, J. Analysis of forces during tight oil charging and implications for the oiliness of the tight reservoir: A case study of the third member of the Palaeogene Shahejie Formation, Qibei slope, Qikou sag. Mar. Pet. Geol. 2022, 144, 105819. [Google Scholar] [CrossRef]
  64. Liu, T.; Jin, X.; Wang, M. Critical Resolution and Sample Size of Digital Rock Analysis for Unconventional Reservoirs. Energies 2018, 11, 1798. [Google Scholar] [CrossRef]
  65. Bernaschi, M.; Fatica, M.; Melchionna, S.; Succi, S.; Kaxiras, E. A flexible high-performance Lattice Boltzmann GPU code for the simulations of fluid flows in complex geometries. Concurr. Comput. Pract. Exp. 2009, 22, 1–14. [Google Scholar] [CrossRef]
  66. Folk, R.L.; Andrews, P.B.; Lewis, D.W. Detrital sedimentary rock classification and nomenclature for use in New Zealand. N. Z. J. Geol. Geophys. 1970, 13, 937–968. [Google Scholar] [CrossRef]
  67. Zhang, Y.; Tian, J.; Zhang, X.; Li, J.; Liang, Q.; Zheng, X. Diagenesis Evolution and Pore Types in Tight Sandstone of Shanxi Formation Reservoir in Hangjinqi Area, Ordos Basin, Northern China. Energies 2022, 15, 470. [Google Scholar] [CrossRef]
  68. Qian, W.; Sun, Q.; Jones, S.J.; Yin, T.; Zhang, C.; Xu, G.; Hou, G.; Zhang, B. Diagenesis and controlling factors of Oligocene Huagang Formation tight sandstone reservoir in the south of Xihu sag, the East China Sea Shelf Basin. J. Pet. Sci. Eng. 2022, 215, 110579. [Google Scholar] [CrossRef]
  69. He, Y.; Guo, H.; Lan, H.; Ling, C.; Fu, M. The Effect of Single Sandstone Stacking Pattern on the Sandstone Reservoir Physical Properties—A Case Study from the Shanxi Formation in the Daniudi Area, Northeastern Ordos Basin. Energies 2022, 15, 4740. [Google Scholar] [CrossRef]
  70. Zhao, G.; Li, X.; Liu, M.; Dong, C.; Chen, D.; Zhang, J. Reservoir Characteristics of Tight Sandstone and Sweet Spot Prediction of Dibei Gas Field in Eastern Kuqa Depression, Northwest China. Energies 2022, 15, 3135. [Google Scholar] [CrossRef]
  71. Beard, D.C.; Weyl, P.K. Influence of Texture on Porosity and Permeability of Unconsolidated Sand. AAPG Bull. 1973, 57, 349–369. [Google Scholar] [CrossRef]
  72. Schmoker, J.W.; Gautier, D.L. Sandstone porosity as a function of thermal maturity. Geology 1988, 16, 1007–1010. [Google Scholar] [CrossRef]
  73. Wang, Z.; Wei, L.; Wang, X.; Wang, N.; Fan, C.; Li, Y.; Zhao, X.; Zhao, X.; Ren, L.; Cao, H. Accumulation process and mechanism of Lower Paleozoic gas reservoir in Yan’an area, Ordos Basin. Acta Pet. Sin. 2016, 37, 99–110. (In Chinese) [Google Scholar] [CrossRef]
  74. Li, W.; Qin, S.; Hu, G.; Gong, Y. Accumulation of water-soluble gas by degasification: One of important mechanisms of large gas accumulations in the Xujiahe Formation, Sichuan Basin. Pet. Explor. Dev. 2011, 38, 662–670. [Google Scholar] [CrossRef]
  75. Ni, C.; Bao, J.; Liu, G.; Zhu, J.; Wu, X.; Zhai, C. A discussion on the influence factors of dryness coefficient of coal-derived gas: A case from the Upper Paleozoic reservoir in northern Ordos Basin. Oil Gas Geol. 2017, 38, 1098–1104. (In Chinese) [Google Scholar] [CrossRef]
  76. Bai, D.; Yang, M.; Lei, Z.; Zhang, Y. Effect of tectonic evolution on hydrocarbon charging time: A case study from Lower Shihezi Formation (Guadalupian), the Hangjinqi area, northern Ordos, China. J. Pet. Sci. Eng. 2020, 184, 106465. [Google Scholar] [CrossRef]
  77. He, F.; Wang, F.; Guo, L.; An, C. Evolution of prototype basin and change of tectonic-sedimentary pattern in Paleozoic, Ordos Basin. Pet. Geol. Exper. 2022, 44, 373–384. [Google Scholar] [CrossRef]
  78. Li, Z.; Ye, J.; Cao, Q.; Yu, H.; Zhang, W. Reservoir characteristics and pore evolution of the Lower Shihezi Formation in Duguijiahan zone, Hangjinqi area, Ordos Basin. Bull. Geol. Sci. Technol. 2021, 40, 49–60. (In Chinese) [Google Scholar] [CrossRef]
  79. He, F.; Wang, F.; Zhang, W.; An, C.; Qi, R.; Ma, C.; Chen, Y.; Li, C.; Fan, L.; Gui, P. Transformation of exploration ideas and major breakthrough in natural gas discovery in the northern margin of the Ordos Basin. China Pet. Explor. 2020, 25, 39–49. (In Chinese) [Google Scholar] [CrossRef]
  80. Hao, S.; Li, L.; Zhang, W.; Qi, R.; Ma, C.; Chen, J. Forming conditions of large-scale gas fields in Permo-Carboniferous in the northern Ordos Basin. Oil Gas Geol. 2016, 37, 149–154. (In Chinese) [Google Scholar] [CrossRef]
  81. Chen, R.; Luo, X.; Chen, Z.; Wang, Z.; Zhou, B. Estimation of Denudation Thickness of Mesozoic Stata in the Ordos Basin and Its Geological Significance. Acta Geol. Sin. 2006, 80, 685–693. (In Chinese) [Google Scholar]
  82. Li, R.; Li, Y. Tectonic evolution of the western margin of the Ordos Basin (Central China). Russ. Geol. Geophys. 2008, 49, 23–27. [Google Scholar] [CrossRef]
  83. Ghosh, K.; Mitra, S. Structural controls of fracture orientations, intensity, and connectivity, Teton anticline, Sawtooth Range, Montana. AAPG Bull. 2009, 93, 995–1014. [Google Scholar] [CrossRef]
  84. Smart, K.J.; Ferrill, D.A.; Morris, A.P. Impact of interlayer slip on fracture prediction from geomechanical models of fault-related folds. AAPG Bull. 2009, 93, 1447–1458. [Google Scholar] [CrossRef]
  85. Wang, X. Low permeability tight oil and gas in Yanchang area, Ordos Basin: Advances in accumulation theory and exploration practice. Earth Sci. Front. 2022, 30, 143–155. [Google Scholar] [CrossRef]
  86. Wang, R.; Sun, W. A Study on Micro Cracks in Super Low Permeability Sandstone Reservoir of the Upper Triassic Yanchang Formation in the Ordos Basin. Geol. Rev. 2009, 55, 444–448. (In Chinese) [Google Scholar]
  87. Zhang, X.; Shi, W.; Hu, Q.; Zhai, G.; Wang, R.; Xu, X.; Xu, Z.; Meng, F.; Liu, Y. Pressure–dependent fracture permeability of marine shales in the Northeast Yunnan area, Southern China. Int. J. Coal Geol. 2019, 214, 103237. [Google Scholar] [CrossRef]
Figure 1. Location of (a) the Ordos Basin in China, and (b) major tectonic units of the Ordos Basin and the structural position of the Hangjinqi area in the Ordos Basin. The structural position of (c) the Duguijiahan block in the Hanjinqi area and location of representative cross-well profile. Abbreviations: SF: Sanyanjing Fault; WF: Wulanjilinmiao Fault; PF: Porjianghaizi Fault (modified after [36,37]).
Energies 16 01493 g001
Figure 2. Generalized stratigraphy section of the Hangjinqi area, northern Ordos Basin. Abbreviations: NCC: North China Craton (modified after [57]).
Energies 16 01493 g002
Figure 3. Histogram of (a) porosity and (b) permeability distribution, and (c) their correlation of Lower Shihezi Formation tight sandstones in the Duguijiahan block, Ordos Basin. (d) Quartz–feldspar–rock fragment ternary plot indicates that the lithology is litharenite (classification after [66]). Abbreviations: I: quartz arenite; II: subarkose, III: sublitharenite; IV: arkose; V: lithic arkose; VI: feldspathic litharenite; VII: litharenite.
Energies 16 01493 g003
Figure 4. Thin sections and scanning electron microscopy (SEM) images showing the microscopic characteristics of reservoir space and fillings of tight sandstones in the Lower Shihezi Formation in the Duguijiahan block, Ordos Basin: (a) well J57, 2996.3 m, clastic particles are closely arranged in line contact, ppl; (b) well J95, 3203.7 m, rock fragment of schist, cpl; (c) well J100, 2927.2 m, the particles are filled with authigenic kaolinite and illite, SEM; (d) well J103, 3076.89 m, clastic particles are filled with filamentous illite and flaked kaolinite, micropores of some fillings are interconnected, SEM; (e) well J96, 3062.3 m, clastic particles are wrapped by chlorite films, and the edge of particles is dissolved, SEM; (f) well J108, 3143.7 m, dissolution microcrack, ppl; (g) well J110, 3030.5 m, intergranular micropores in vermiculite-like kaolinite, ppl; (h) well J112, 3130.5 m, intergranular pores are communicated by lamellar throat, ppl; and (i) well J126, 2917 m, intergranular pore and intergranular dissolved pore, ppl. Abbreviations: ppl: plane-polarized light; cpl: cross-polarized light.
Energies 16 01493 g004
Figure 5. Microscopic characteristics of typical diagenesis of the Lower Shihezi Formation tight sandstones in Duguijiahan block, Ordos Basin: (a) well J126, 2901 m, strong compaction results in the close arrangement of clastic particles, cpl; (b) well J108, 3143.7 m, argillaceous cement, ppl; (c) well J112, 3058.9 m, secondary enlargement of quartz particles with intergranular dissolution pores, SEM; (d) well J113, 3069.3 m, argillaceous cement and calcite cement, ppl; (e) well J57, 2990 m, intercrystalline dissolution pores in calcite, ppl; (f) well J95, 3117.08 m, feldspar particles is slightly dissolved, and filamentous illite filled between particles, SEM; (g) well J103, 3072.94 m, the edges of the particles are slightly dissolved, and the particles are filled with filamentous illite, illite–smectite mixed layer, and kaolinite, SEM; (h) well J108, 3153.32 m, the flaked kaolinite is dissolved, and there are dissolution micro pores between clastic particles, SEM; and (i) well J110, 3030.5 m, kaolinite cement, ppl. Abbreviations: ppl: plane-polarized light; cpl: cross-polarized light.
Energies 16 01493 g005
Figure 6. The cross plots of plane porosity versus volumetric porosity for the Lower Shihezi Formation sandstone in the Duguijiahan block.
Energies 16 01493 g006
Figure 7. Porosity evolution process of the Lower Shihezi Formation sandstone reservoir of (a) well J57 and (b) well J110.
Energies 16 01493 g007
Figure 8. Boxplot of porosity of Lower Shihezi Formation tight sandstones in the Duguijiahan block, Ordos Basin.
Energies 16 01493 g008
Figure 9. Photomicrographs and laser Raman spectrum of representative hydrocarbon inclusions from the Lower Shihezi Formation tight sandstones in the Duguijiahan block, Ordos Basin: (a) well J103, 3081.5 m, massive gas inclusions in quartz grains; (b) well J110, 3022.5 m, gas inclusions distributed in fractures that cut across the quartz grain; (c) well J103, 3081.5 m, oil inclusions with yellow-green fluorescence under ultraviolet light; (d) well J110, 3022.5 m, gas–liquid inclusions in quartz grains; (e) well J57, 2996.3 m, the gas–liquid inclusions in quartz grains have characteristic peaks of 1280.97 cm−1 and 1385.87 cm−1, indicating that the gas composition in the inclusions is mainly CO2; and (f) well J110, 3022.5 m, gas–liquid inclusions in quartz grains have characteristic peaks of 1283.55 cm−1, 1387.45 cm−1 and 2915.32 cm−1, indicating that the gas in the inclusions is a mixture of CO2 and CH4.
Energies 16 01493 g009
Figure 10. Plots showing the burial and thermal evolution histories, and gas generation and charging histories of well J57.
Energies 16 01493 g010
Figure 11. Plots showing the burial and thermal evolution histories, and gas generation and charging histories of well J110.
Energies 16 01493 g011
Figure 12. Digital simulation of gas charging: (a) sample from the Lower Shihezi Formation, depth of 3114.9 m in Well J57, medium-grained sandstone, porosity = 8.7%, permeability = 0.466 × 10⁻³ μm2; and (b) sample from the Lower Shihezi Formation, depth of 3035.35 m in Well J110, gravel-bearing coarse-grained sandstone, porosity = 11.1%, permeability = 1.15 × 10⁻³ μm2. Abbreviations: Pc: digital simulation pressure; Sg: gas saturation.
Energies 16 01493 g012
Figure 13. Composite map of tight gas dryness coefficient and sandstone thickness distribution of Lower Shihezi Formation with the iC4/nC4 vs. iC5/nC5 relation of tight gas in the northern and southern parts, respectively.
Energies 16 01493 g013
Figure 14. Gas accumulation process of the Lower Shihezi Formation tight sandstone gas reservoir in the Duguijiahan block, northern Ordos Basin, China: (a) depositional stage (C–P), (b) natural gas accumulation stage (T–K1), and (c) gas reservoir adjustment stage (K2–Nowadays). Abbreviations: Pave.: average porosity.
Energies 16 01493 g014
Figure 15. Tight gas accumulation model in the transition zone at the margin of the basin.
Energies 16 01493 g015
Table 1. Statistical for identification of casting thin section of sandstone of the Lower Shihezi Formation in the Duguijiahan block.
WellDepth
(m)
Terrigenous DebrisFillings Thin-Section
Porosity (%)
QCh. K-FPla. Rock FragmentTotalHeterobaseCementsTotal
Ig. Me. Se.MG. TotalAr. Ca.Cal.Kao. Sid.QSE.
J5729905562428537862/63113
J572996.35081434341884/1166
J953113441815363246963/14/
J953203.751151435342927///18
J953206.55012/637447916/219
J1033081.56513/819431853/81123
J1033087.34514/43862508612/2/14
J1083143.75153/6314418911////11
J1083151.55214/5326438613/1/14
J1103022.55512/433542893/6211
J1103030.55712/529640862/56131
J1123130.55112/437546917/119
J1123136.15232/532643898/11101
J1133069.35522/433441926/118
J1133074.785522/530641844/12/16/
J1262896.555213/4355448911//11
J12629015112/637346941/1242
J1262917.237631//20//20901//1/28
J1262938.785512/632442893/1483
Abbreviations: Q: quartz (including monocrystalline and polycrystalline quartz); Ch.: chert; K-F: K-feldspar; Pla.: plagioclase; Ig.: igneous rock; Me.: metamorphic rock; Se.: sedimentary rock; MG.: mica group; Ar.: argillaceous; Ca.: calcareous; Cal.: calcite; Kao.: kaolinite; Sid.: siderite; QSE.: quartz secondary enlargement; “√” indicates that the content is less than 1%.
Table 2. The porosity evolution of the Lower Shihezi Formation sandstones.
WellDepth/mStrataφoφcompφcemtφdissφp
J1103030.5P1x137.6720.99 14.48 1.40 3.60
J1103022.5P1x138.5124.35 11.22 0.76 3.70
J572990P1x338.6315.88 12.63 1.40 11.52
J572996.3P1x339.8429.14 5.82 1.40 6.28
φo is the primary porosity of sandstone (%); φp is the present porosity of sandstone; φcomp is the porosity decreasing of compaction (%); φcemt is the porosity decreasing of cementation (%); and φdiss is the porosity increasing of dissolution (%).
Table 3. Typical fluid inclusions characteristic of the Lower Shihezi Formation sandstones.
WellDepth
(m)
Host MineralsPositionTypeFluorescence ColorHomogenization Temperatures (°C)Gas
Composition
HC InclusionCoeval Brine Inclusion
J572996.3Quartzhealed microfracturesGI//107–108CO2
J572996.3QuartzovergrowthOIyellow<60.093.0/118–119/
J572996.3Quartz overgrowth GI//93.0/118–119CO2/CH4
J572996.3Quartz overgrowth O&Gyellow-green102–104.3114CO2/CH4
J572996.3Quartz overgrowth OIweak yellow/114/
J572996.3Quartz overgrowth GI//94.0–95.0CO2
J1033085.1Quartzhealed microfracturesO&Gyellow-green110.4101CO2
J1033085.1Quartzhealed microfracturesO&Gyellow-green111.8101CO2
J1033085.1Quartzhealed microfracturesO&Gyellow-green112101CO2
J1033085.1Quartzhealed microfracturesO&Gyellow-green119101CO2
J1033085.1Quartzhealed microfracturesO&Gyellow-green148101CO2
J1033085.1Quartzhealed microfracturesO&Gyellow-green>200.096CO2
J1033085.1Quartzhealed microfracturesO&Gyellow-green10696CO2
J1033085.1Quartzhealed microfracturesO&Gyellow-green9996CO2
J1033085.1Quartzhealed microfracturesO&Gyellow-green101131–134CH4
J1033085.1Quartzhealed microfracturesGI//124–129CH4
J1103030.3Quartz overgrowth GI //128–130CH4
J1103030.3Quartz overgrowth GI //128–129CH4
J1103030.3Quartz overgrowth GI //162–165CH4
J1123130.5Quartz overgrowth GI //99–101/117–119CO2/CH4
J1123130.5Quartz overgrowth OI weak yellow/99–101/117–119/
J1123130.5Quartz overgrowth GI//148–149CH4
Abbreviations: GI: gas inclusion; OI: oil inclusion; O&G: oil and gas two-phase inclusion.
Table 4. Comparison of Ro and temperature between measured values and simulation results of PetroMod 1D.
Comparison ParametersWellDepth
(m)
StrataMeasured ValueSimulation ValueError Rate
Ro (%)J783160.4C3t1.341.36−1.49%
J783161.6C3t1.351.36−0.74%
J893169.4C3t1.171.160.85%
J893167.5C3t1.161.160.00%
Temperature (°C)J573055P1x91.24692.55−1.43%
J1033075.75P1x93.55291.512.18%
J1103021P1x94.64696.21−1.65%
J1123113.75P1x87.27687.93−0.75%
Error rate = (measured value − simulation value)/measured value.
Table 5. Hydrocarbon composition of Lower Shihezi Formation tight gas in the Duguijiahan block.
ZoneWellC1C2C3iC4nC4iC5nC5Relatively DensityC1/C1–5
Southern partJ3110.7740.8580.2030.0290.0410.0160.0110.92790.903
J5787.0734.3781.9420.3840.5980.2250.1750.6390.919
J5878.3892.3110.9380.1240.2370.0770.0630.6580.954
J7832.5181.1240.2050.128 0.8540.957
J8555.6697.7421.6010.2010.2990.1450.1350.7630.846
J9587.5719.0832.2080.3070.5180.1590.1540.6370.876
J9693.4393.1840.50.1370.320.0520.0440.6050.957
J10794.9433.180.6950.2230.240.0810.0660.5910.955
J11589.7136.5811.8340.2980.5440.2340.1560.6290.903
Northern partJ8694.8452.0750.4470.070.050.0290.0560.5840.972
J9892.5285.50.9350.1370.2010.0850.0660.6030.930
J9987.4347.1581.620.230.3740.1020.1040.6320.901
J10089.1727.4641.7870.3060.6470.2490.3780.6330.892
J10191.2655.3941.4760.2180.3590.1260.1160.6140.922
J10387.6126.8211.4890.220.3440.1450.1180.6290.906
J10892.3184.1351.1310.1550.2450.1130.0820.6120.940
J11093.8212.9470.6680.2530.2290.0580.0260.6030.957
J11184.2622.720.5520.0910.140.0620.0490.630.959
J11292.0972.2640.4680.122 4.2150.5970.929
J11490.9977.0521.1460.140.1890.0690.0530.610.913
J10996.0342.7550.3190.0410.050.1050.0530.5810.967
Disclaimer/Publisher’s Note: The statements, opinions and data contained in all publications are solely those of the individual author(s) and contributor(s) and not of MDPI and/or the editor(s). MDPI and/or the editor(s) disclaim responsibility for any injury to people or property resulting from any ideas, methods, instructions or products referred to in the content.

