
Potential of Producing Green Hydrogen in Jordan

 , ,
, ,  , ,
, , 
Abstract
:
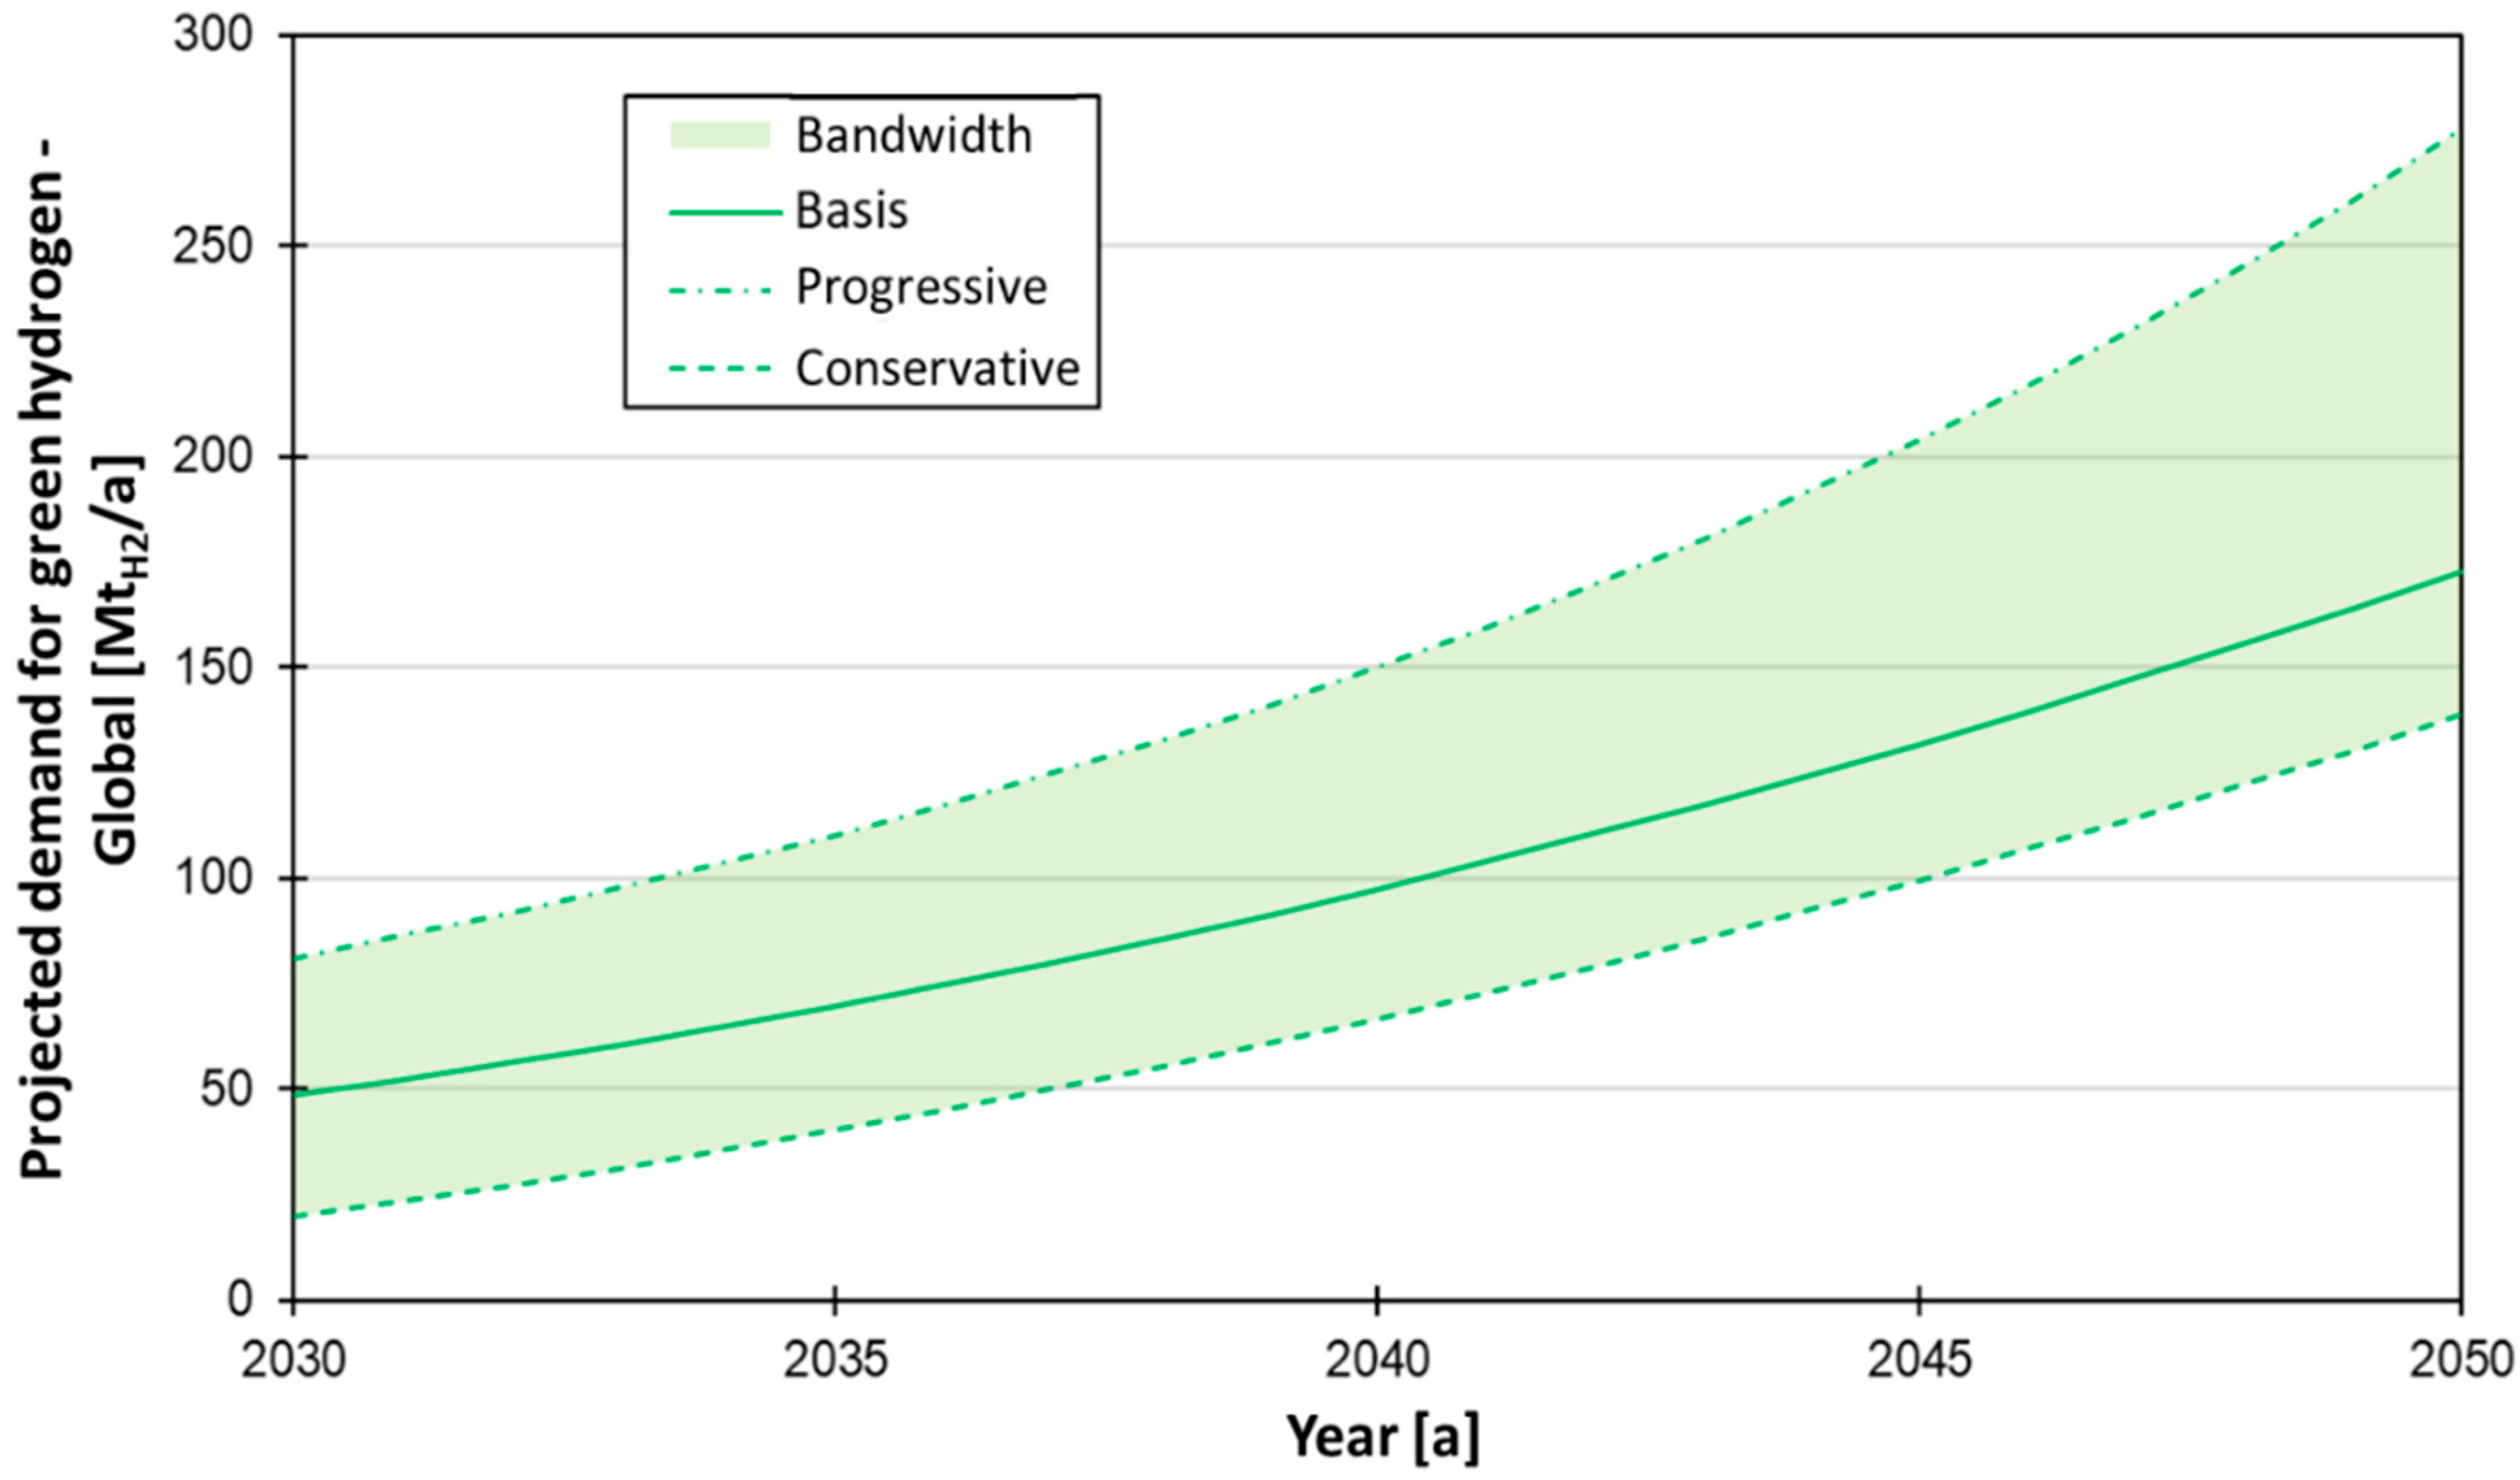
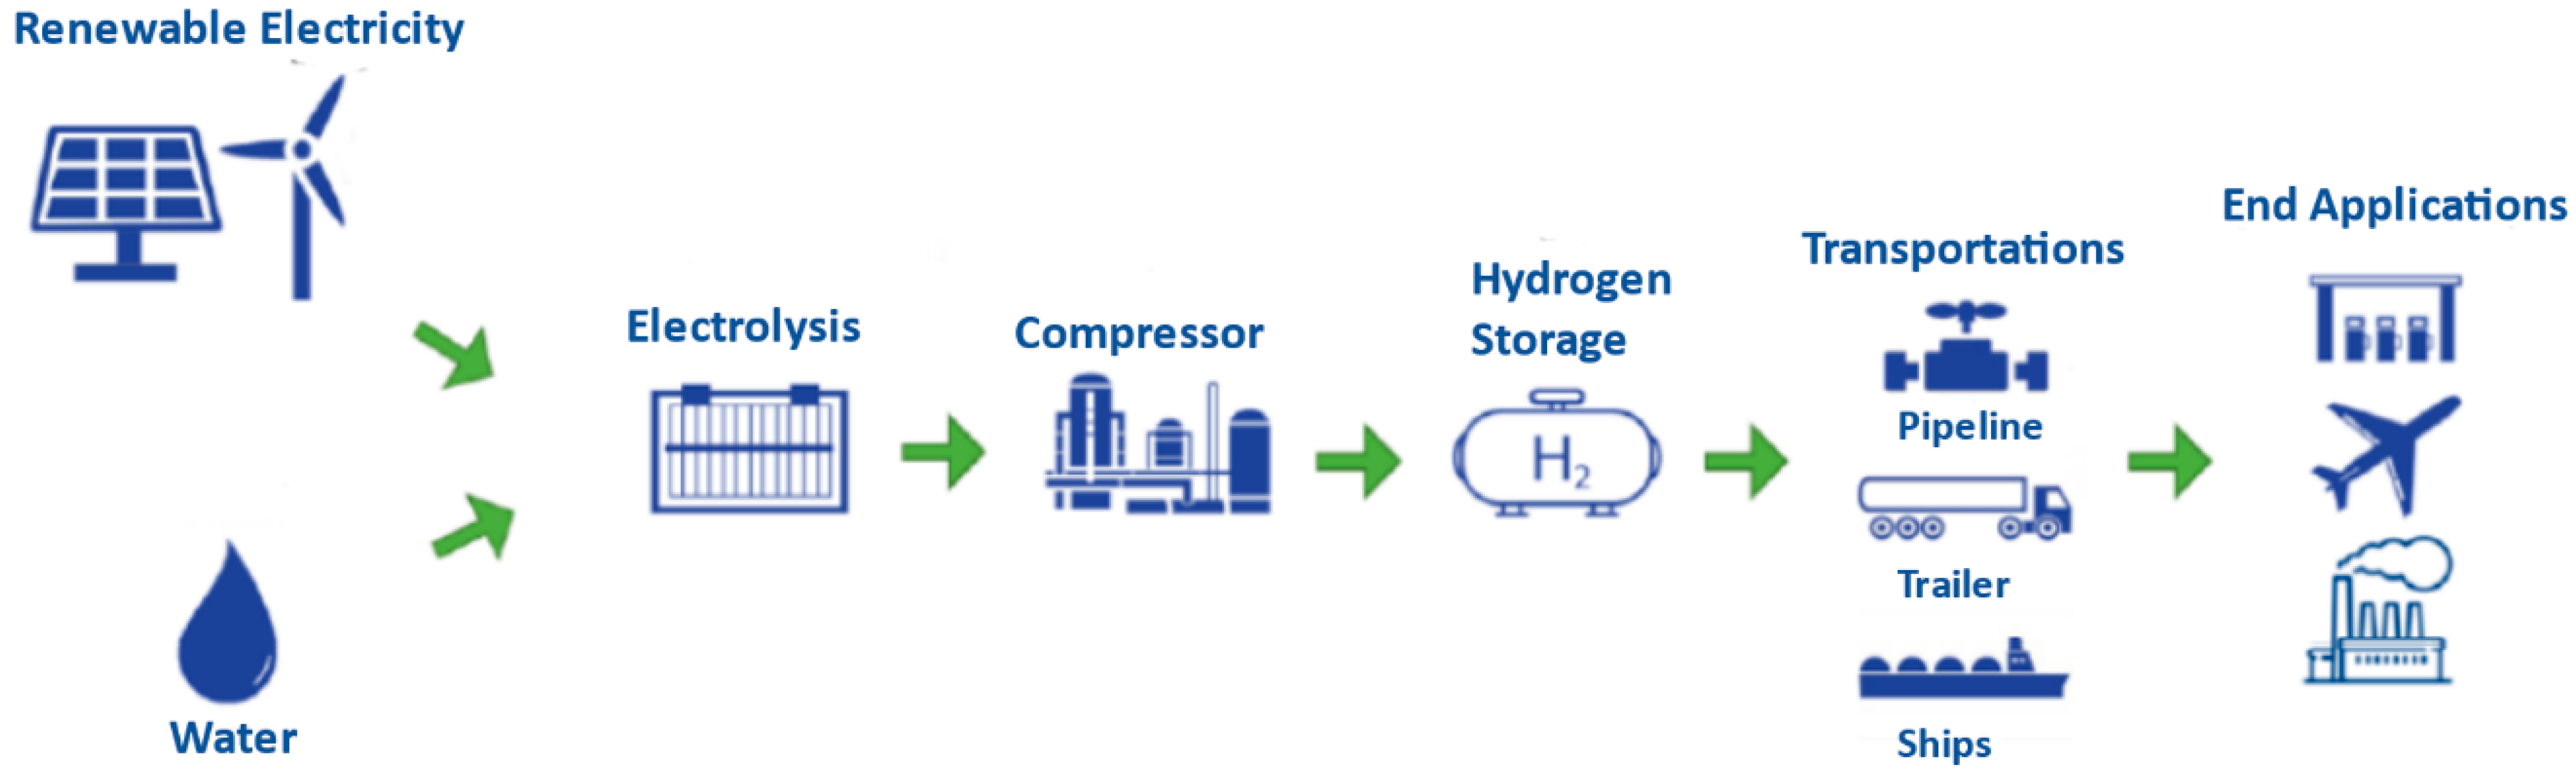
1. Introduction
2. Hydrogen Production in Jordan
2.1. Availability of Renewable Energy Resources in Jordan

2.2. Site Selection
3. Methodology
3.1. Model Description
3.1.1. Solar PV System Model
- Latitude of the site (Aqaba, 29.5476°), symbol: L;
- Julian date, symbol: N;
- Hour angle (h);
- Tilt angle (β = 10°);
- PV efficiency (20%).
3.1.2. Electrolyzer System Model
3.1.3. Compression System
- The inlet pressure to the electrolyzer (Table 2);
- Maximum pressure needed to feed the demand (fixed at 200 bar);
- γ (the specific heat ratio of hydrogen) = 1.4;
- Ideal gas constant (R) = 4.1243 kJ/kg × K;
- T: temperature of inlet water = 300 K;
- Isentropic efficiency of the compressor = 70%.
3.1.4. Models Output and Constraints
3.2. Model Code Using MATLAB
3.3. Techno-Economical Study
3.3.1. Non-Renewable Energy Sources for Hydrogen Production
3.3.2. Renewable Energy Source for Hydrogen Production
3.3.3. Water Consumption Cost
3.3.4. Revenue
3.4. CO2 Emissions Reduction
4. Results and Discussion
4.1. PV Solar System Capacity
4.1.1. PV Solar Capacity Using ALK
4.1.2. PV Solar Capacity Using PEM
4.1.3. PV Solar Capacity for ALK Versus PEM Technologies
4.2. Hydrogen Production Rate
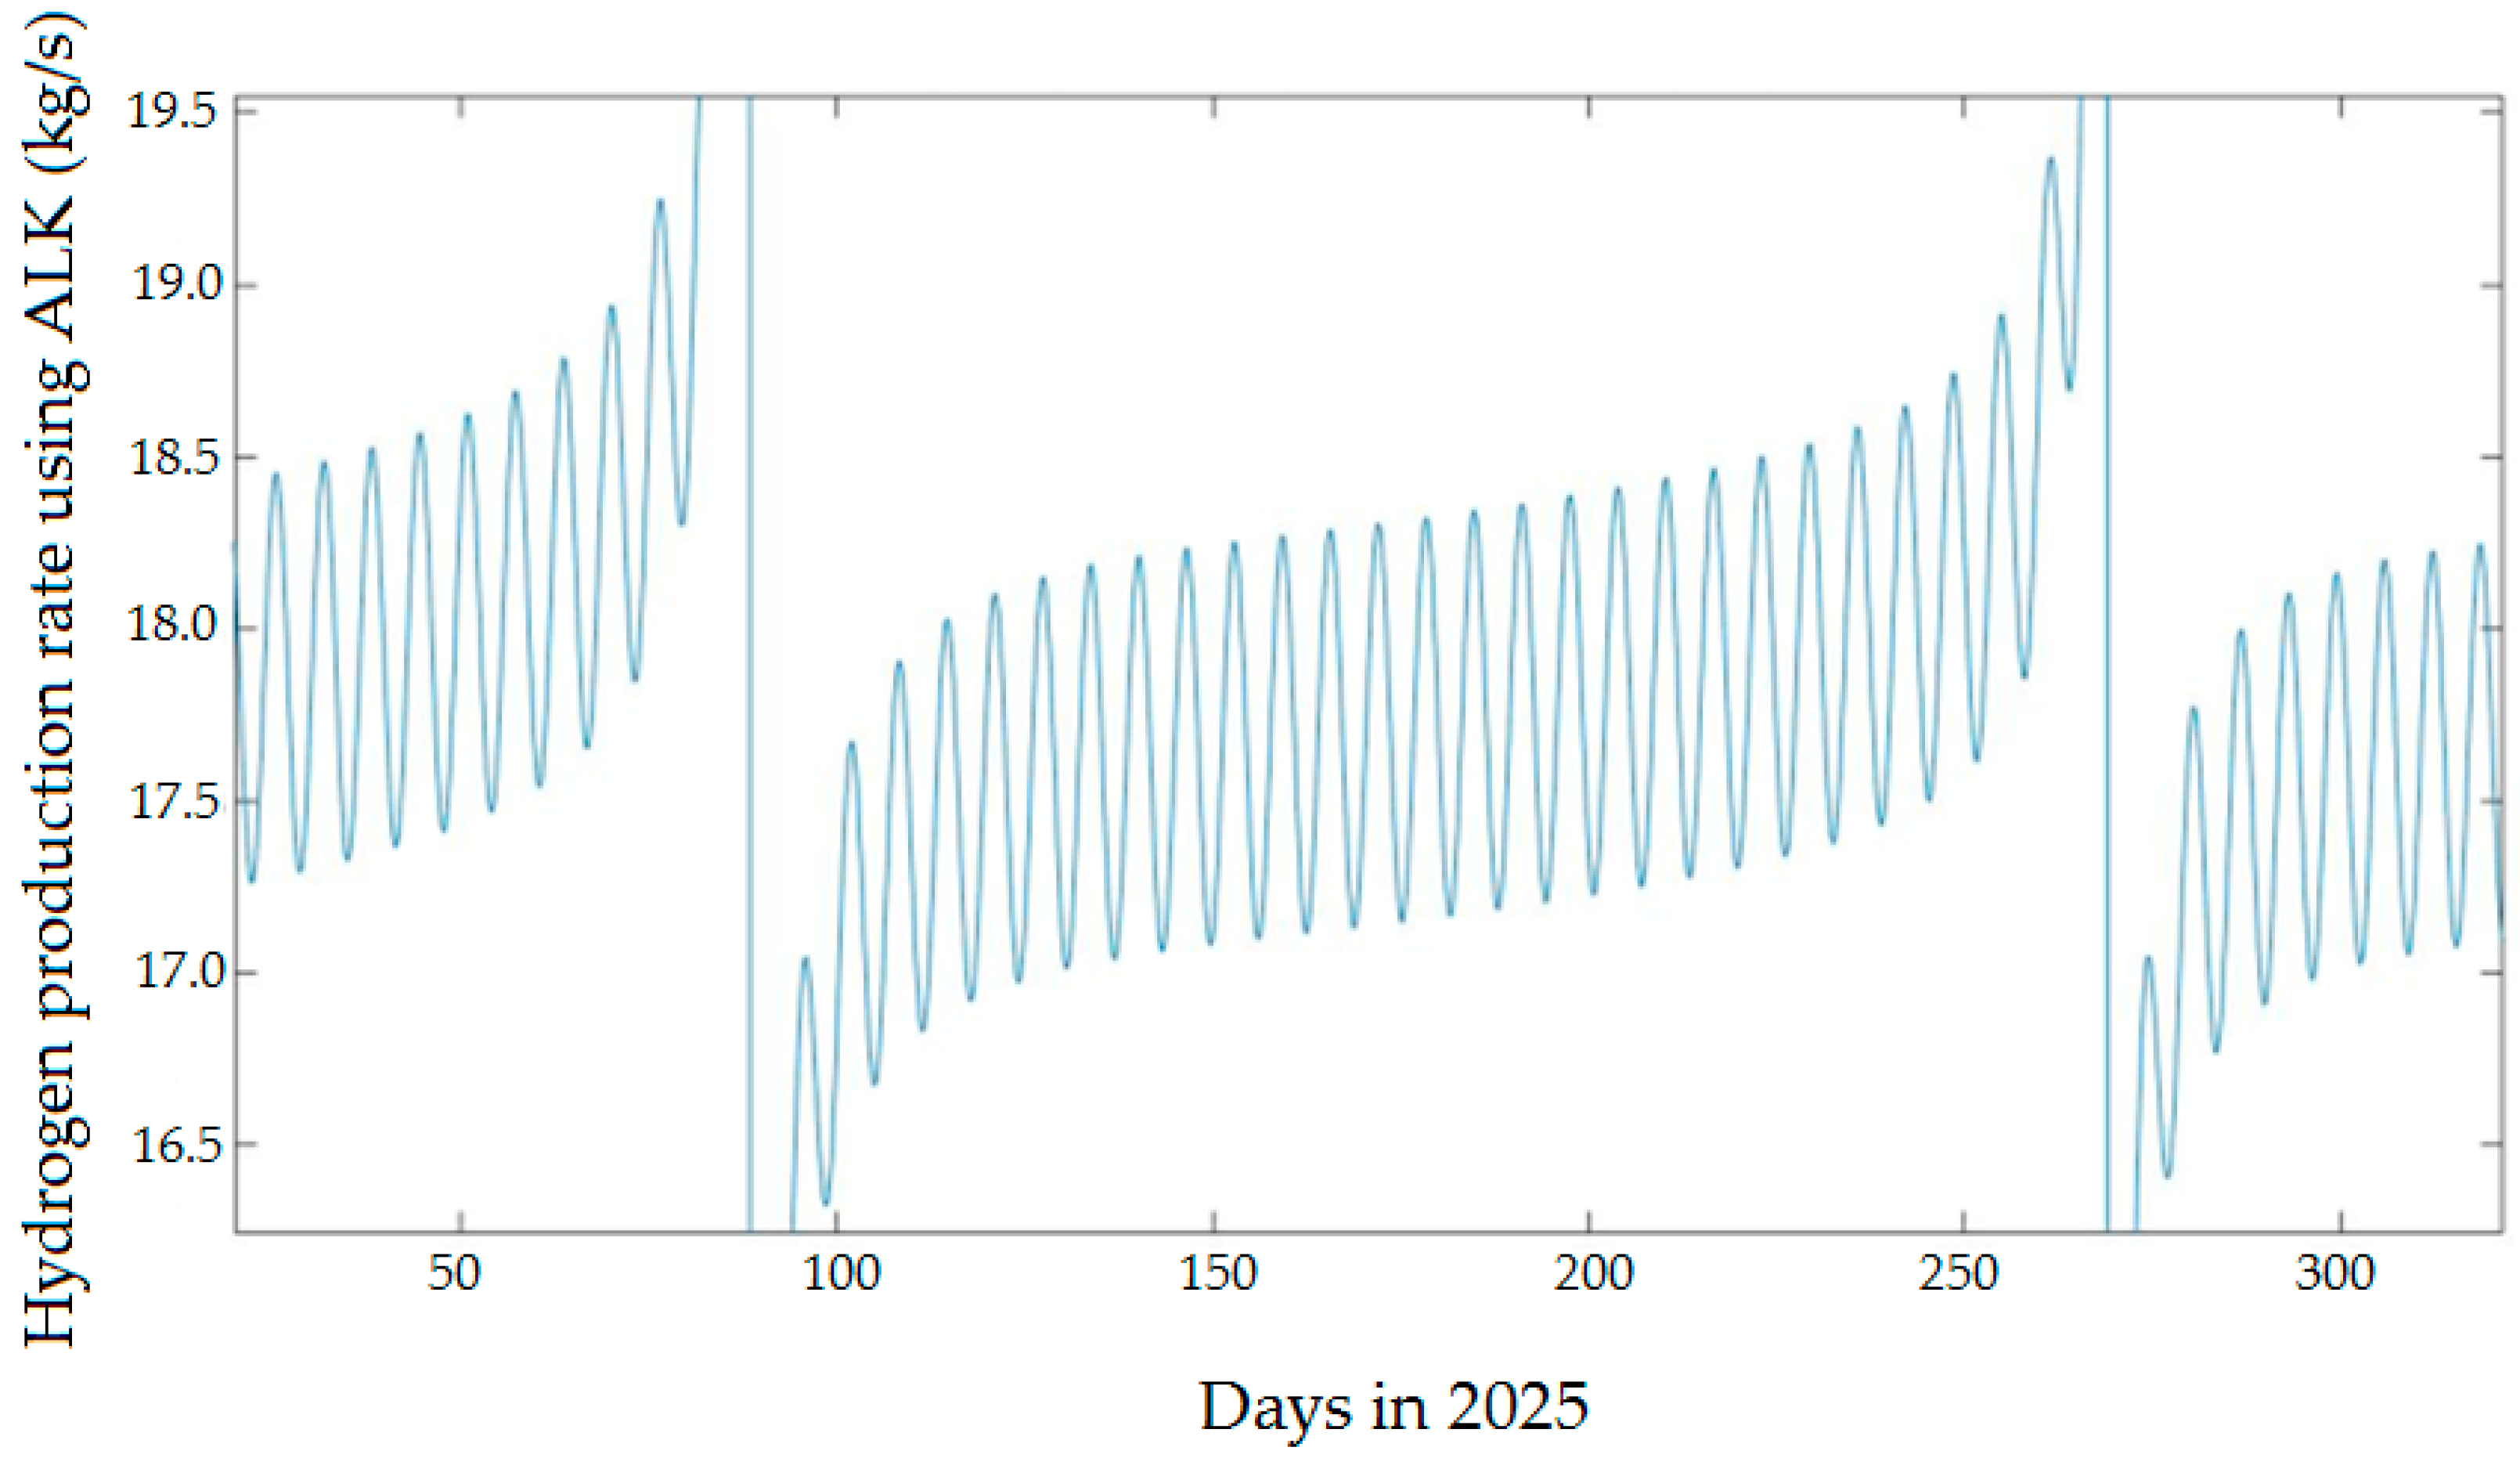
4.2.1. Hydrogen Production Rate Using ALK
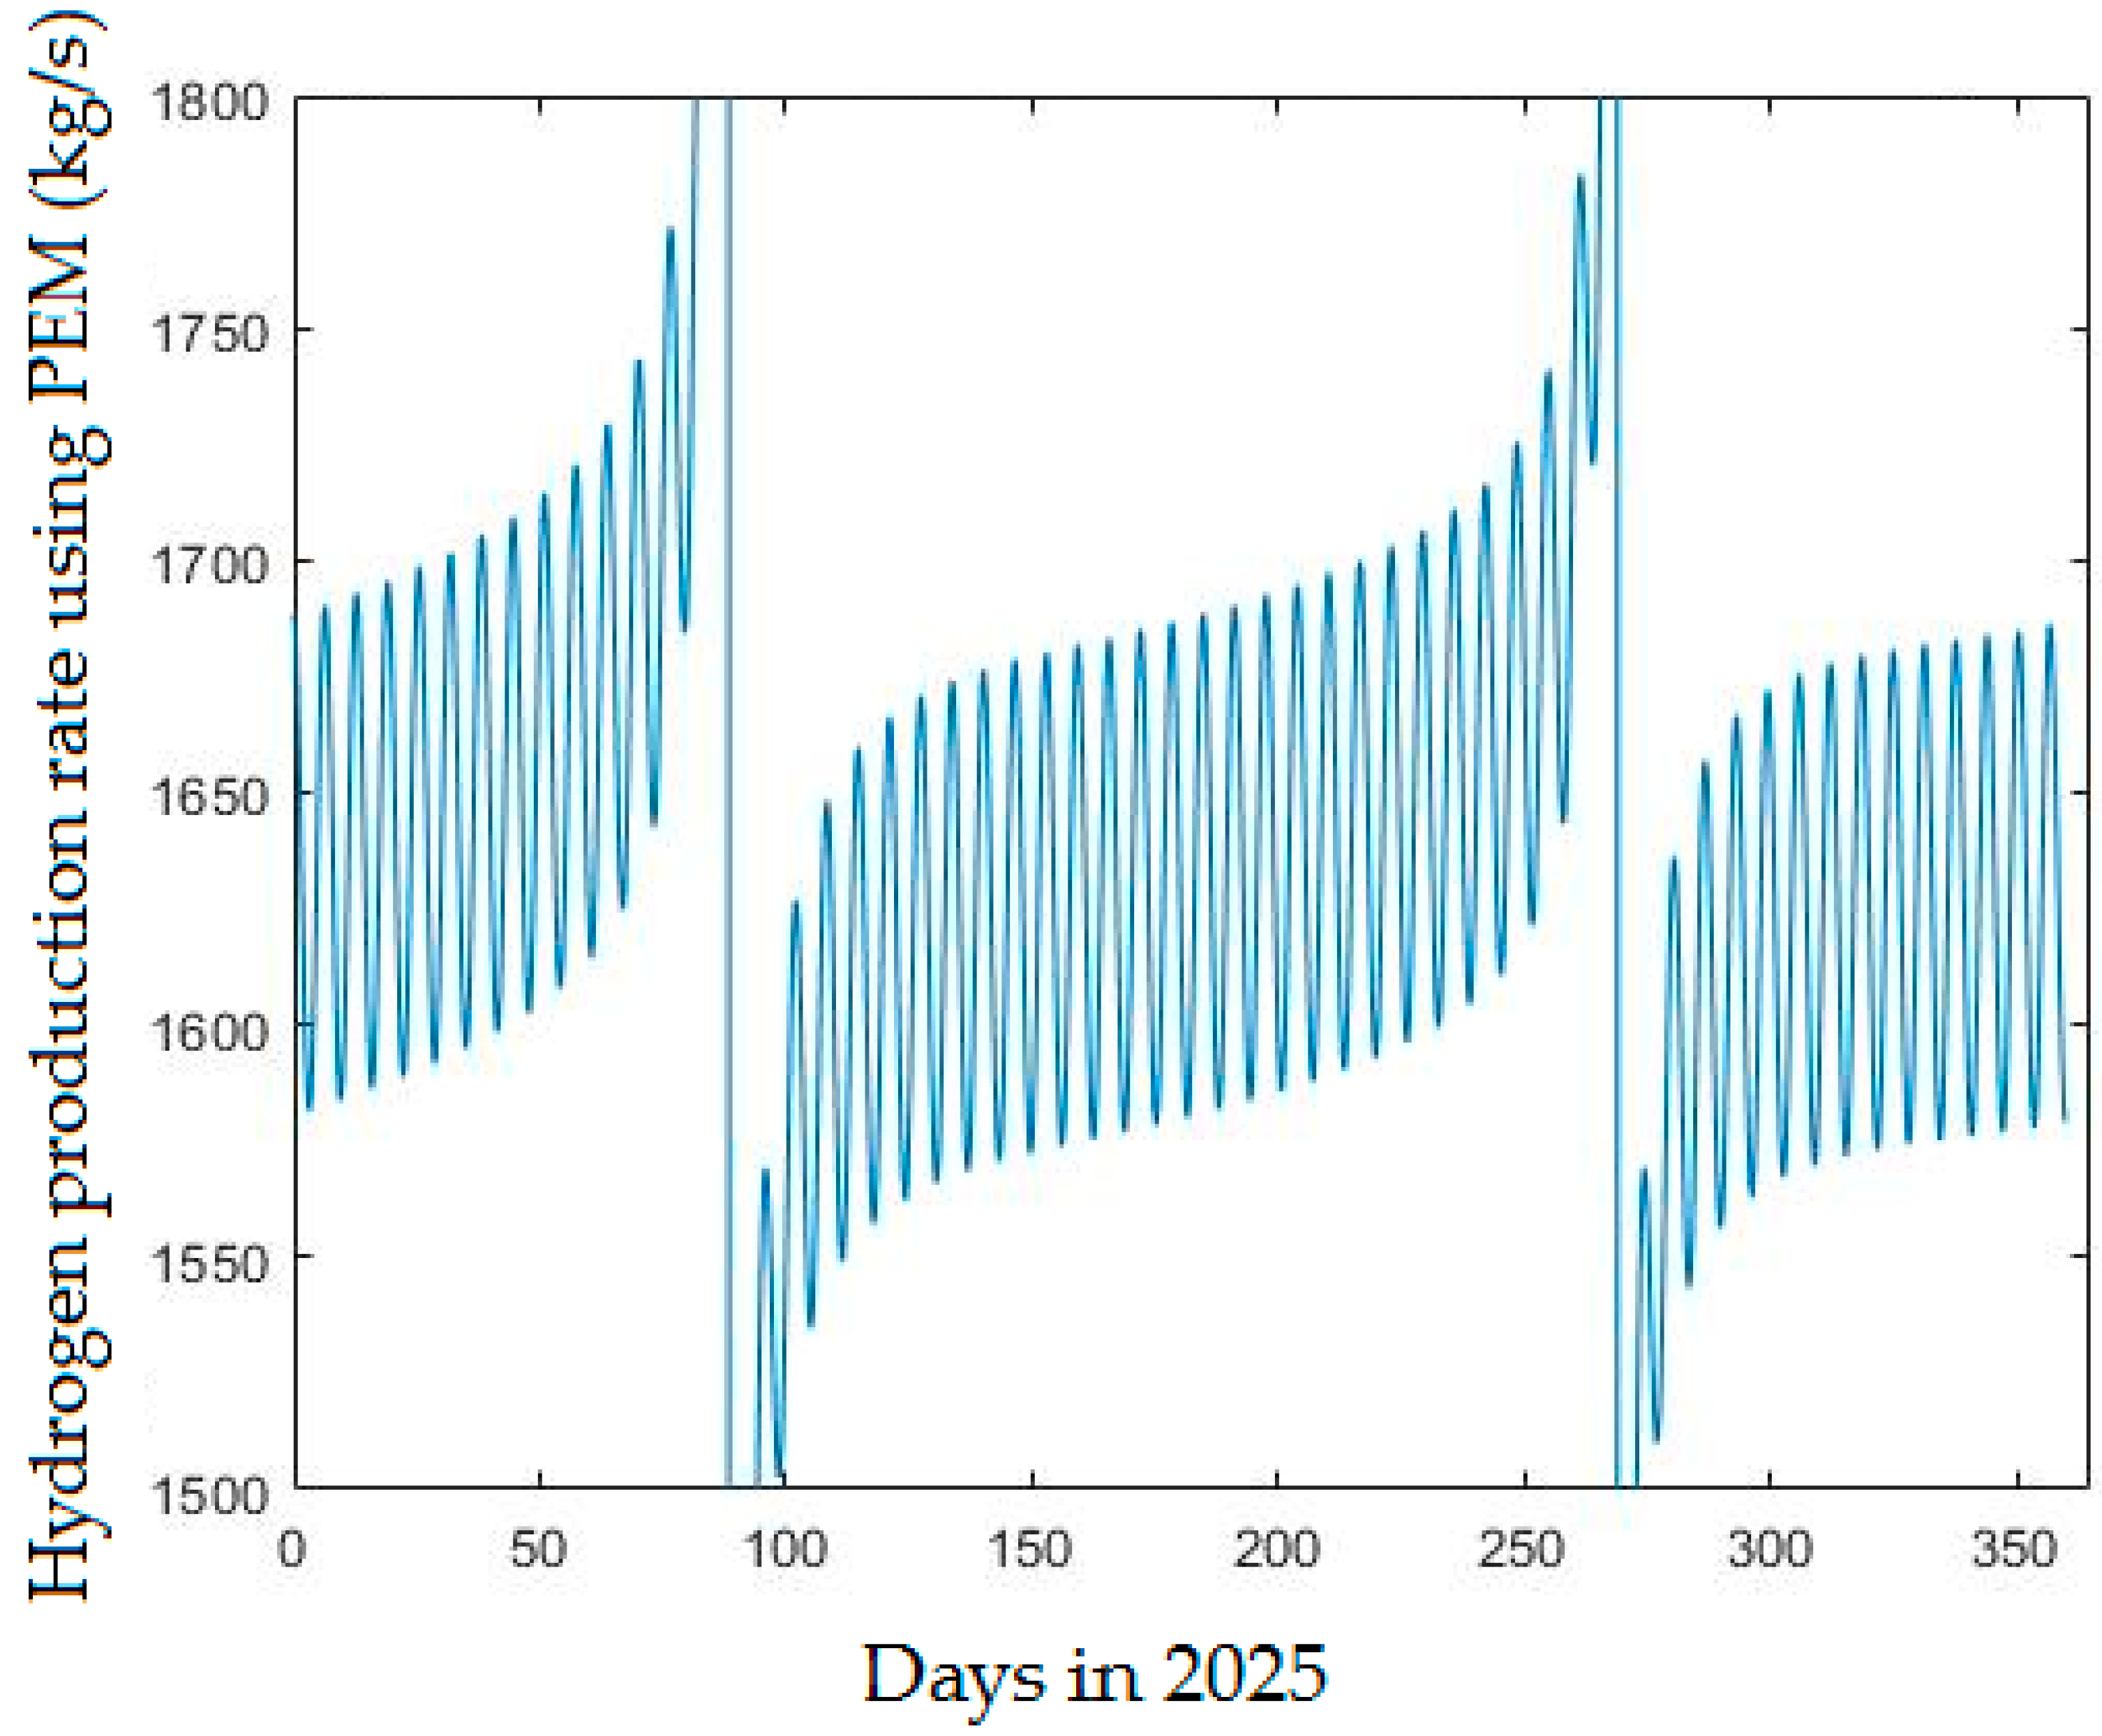
4.2.2. Hydrogen Production Rate Using PEM
4.2.3. ALK Versus PEM Hydrogen Production Rate
4.3. Techno-Economical Model Results
4.4. CO2 Emissions Reduction
5. Conclusions
Author Contributions
Funding
Data Availability Statement
Acknowledgments
Conflicts of Interest
Abbreviations
| L | latitude |
| N | Julian date |
| H | hour angle |
| tilt angle | |
| 𝛿 | declination angle |
| Gn | irradiance on normal surface |
| Rb | geometric factor |
| Gtilt | irradiance on tilted surface |
| ALK | alkaline electrolyzer |
| PEM | proton exchange membrane |
| SOEL | solid oxide electrolysis |
| HHV | higher heating value |
| LHV | lower heating value |
| γ | specific heat ratio |
| R | ideal gas constant |
| T | temperature |
| efficiency | |
| PV | photovoltaic panels |
| NPV | net present value |
| I | interest rate |
| EEF | electricity emissions factor |
Appendix A
- % Molar mass of h2 (User Input in Line 21)
- %Solar Irradiance
- %Latitude (Fixed value)
- L= 29.5476;
- %Tilt Angle
- S = 10;
- % (Number of days from 01.01)
- N = [0:0.25:360];
- % Declination Angle
- dec = 23.45 × sind(360/365 × (284 + N));
- % Hour angle
- h = [−180:0.25:180];
- % Irradiance on normal surface
- Gn = 1367 × (1+0.033 × cos (360 × N/365));
- % Geometric factor
- Rb = (sind(L − S) × sind(dec) + cosd(L − S) × cosd(dec).× cosd(h))./(sind(L) × sind(dec) + cosd(L) × cosd(dec). × cosd(h))
- % Irradiance on a tilted surface
- Gtilt = Gn. × Rb
- M.M = 1.008 × 10⁻³
- %Moles of hydrogen needed
- mole = 1000
- % Maximum pressure needed to feed the demand (This value depends on the required pressure in the storage tank)
- P = 200
- year = [2020:10/1440:2030]
- % Higher heating value of hydrogen (Fixed amount)
- HHV = 285.8
- %The pressure before the compressor
- PALK = −3528.75 + 1.75 × year
- PPEM = −7533.75 + 3.75 × year
- % Specific heat ratio of hydrogen (Fixed value)
- A = 1.4
- % Ideal gas constant (Fixed value) KJ/kg × K
- R = 8.314
- % Temperature of hydrogen (Fixed value) k
- Temp = 298
- % Isentropic efficiency of the compressor (Fixed value)
- Ceff = 0.7
- % The power consumption into ALK compressor:
- Wcompressor_ALK = (mole × R × Temp × ((PALK/P).−3.5)−1)/Ceff
- Wcompressor_PEM = (mole × R × Temp × ((PPEM/P).−3.5)−1)/Ceff
- % ALK Electrolyzer:
- % Electrolyzer power consumption (kW)
- W_Electrolyzer = mole × M.M × HHV
- % ALK Initial Cost
- ALK_Initial_Cost = (68823.75 − 33.75 × year) × W_Electrolyzer
- %ALK power consumption from the PV
- ALK_power_consumption = mole × HHV × (555.25 − 0.25 × year)
- %PV efficiency = 20%
- PVeff = 0.2
- B = PVeff × Gtilt
- % PV capacity
- PV_power_output_ALK = Wcompressor_ALK + ALK_power_consumption
- %Area needed for installing PV
- Area_Needed_ALK = (PV_power_output_ALK)./B
- %PV capital cost
- PV_capital_Cost_ALK = 500 × Area_Needed_ALK
- Total_initial_cost_ALK = ALK_Initial_Cost + PV_capital_Cost_ALK + (31,855.625 − 15.625 × year)
- % Hydrogen selling price
- HSP = M.M × Mole × (0.72)
- % PEM Electrolyzer:
- % Electrolyzer power consumption (kW)
- W_Electrolyzer_PEM = mole × M.M × HHV
- % PEM Initial Cost
- PEM_Initial_Cost = (127262.5 − 62.5 × year) × W_Electrolyzer
- %PEM power consumption from the PV
- PEM_power_consumption = mole × HHV × (1570.75 − 0.75 × year)
- PV_power_output_PEM = Wcompressor_PEM + PEM_power_consumption
- %Area needed for installing PV
- Area_Needed_PEM = (PV_power_output_PEM)./(B)
- %PV capital cost
- PV_capital_Cost_PEM = 500 × Area_Needed_PEM
- Total_initial_cost_PEM = PEM_Initial_Cost+ PV_capital_Cost_PEM
References
- Shearian Sattari, M.; Ghobadian, B.; Gorjian, S. A critical review on life-cycle assessment and exergy analysis of Enomoto bio-gasoline production. J. Clean. Prod. 2022, 379, 134387. [Google Scholar] [CrossRef]
- Rosen, M.A.; Koohi-Fayegh, S. The prospects for hydrogen as an energy carrier: An overview of hydrogen energy and hydrogen energy systems. Energy Ecol. Environ. 2016, 1, 10–29. [Google Scholar] [CrossRef] [Green Version]
- Bichler, M.; Novirdoust, A. Electricity Spot Market Design 2030–2050. p. 61. Available online: https://synergie-projekt.de/wp-content/uploads/2020/08/Whitepaper-Electricity-Spot-Market-Design-2030-2050.pdf. (accessed on 14 August 2022).
- Kakoulaki, G.; Kougias, I.; Taylor, N.; Dolci, F.; Moya, J.; Jäger-Waldau, A. Green hydrogen in Europe—A regional assessment: Substituting existing production with electrolysis powered by renewables. Energy Convers. Manag. 2021, 228, 113649. [Google Scholar] [CrossRef]
- Dash, S.K.; Chakraborty, S.; Roccotelli, M.; Sahu, U.K. Hydrogen Fuel for Future Mobility: Challenges and Future Aspects. Sustainability 2022, 14, 8285. [Google Scholar] [CrossRef]
- Alzoubi, A. Machine learning for intelligent energy consumption in smart homes. Int. J. Comput. Inf. Manuf. (IJCIM) 2022, 2, 62–75. [Google Scholar] [CrossRef]
- Razi, F.; Dincer, I. Renewable energy development and hydrogen economy in MENA region: A review. Renew. Sustain. Energy Rev. 2022, 168, 112763. [Google Scholar] [CrossRef]
- Al-Ghussain, L.; Ahmad, A.D.; Abubaker, A.M.; Hassan, M.A. Exploring the feasibility of green hydrogen production using excess energy from a country-scale 100% solar-wind renewable energy system. Int. J. Hydrogen Energy 2022, 47, 21613–21633. [Google Scholar] [CrossRef]
- Alzoubi, A. Renewable Green hydrogen energy impact on sustainability performance. Int. J. Comput. Inf. Manuf. (IJCIM) 2021, 1, 94–104. [Google Scholar] [CrossRef]
- IEA. The Future of Hydrogen—Analysis. Available online: https://www.iea.org/reports/the-futureof-hydrogen (accessed on 18 June 2022).
- Nasser, M.; Megahed, T.F.; Ookawara, S.; Hassan, H. Performance evaluation of PV panels/wind turbines hybrid system for green hydrogen generation and storage: Energy, exergy, economic, and enviroeconomic. Energy Convers. Manag. 2022, 267, 115870. [Google Scholar] [CrossRef]
- Agyekum, E.B.; Ampah, J.D.; Afrane, S.; Adebayo, T.S.; Agbozo, E. A 3E, hydrogen production, irrigation, and employment potential assessment of a hybrid energy system for tropical weather conditions—Combination of HOMER software, shannon entropy, and TOPSIS. Int. J. Hydrogen Energy 2022, 47, 31073–31097. [Google Scholar] [CrossRef]
- Praveenkumar, S.; Agyekum, E.B.; Ampah, J.D.; Afrane, S.; Velkin, V.I.; Mehmood, U.; Awosusi, A.A. Techno-economic optimization of PV system for hydrogen production and electric vehicle charging stations under five different climatic conditions in India. Int. J. Hydrogen Energy 2022, 47, 38087–38105. [Google Scholar] [CrossRef]
- Al-Buraiki, A.S.; Al-Sharafi, A. Hydrogen production via using excess electric energy of an off-grid hybrid solar/wind system based on a novel performance indicator. Energy Convers. Manag. 2022, 254, 115270. [Google Scholar] [CrossRef]
- Rad, M.A.V.; Ghasempour, R.; Rahdan, P.; Mousavi, S.; Arastounia, M. Techno-economic analysis of a hybrid power system based on the cost-effective hydrogen production method for rural electrification, a case study in Iran. Energy 2019, 190, 116421. [Google Scholar] [CrossRef]
- IEA. Global Hydrogen Review 2021—Analysis. Available online: https://www.iea.org/reports/global-hydrogen-review-2021 (accessed on 18 June 2022).
- Megía, P.J.; Vizcaíno, A.J.; Calles, J.A.; Carrero, A. Hydrogen Production Technologies: From Fossil Fuels toward Renewable Sources. A Mini Review. Energy Fuels 2021, 35, 16403–16415. [Google Scholar] [CrossRef]
- Ulejczyk, B.; Nogal, Ł.; Młotek, M.; Krawczyk, K. Efficient Plasma Technology for the Pro-duction of Green Hydrogen from Ethanol and Water. Energies 2022, 15, 2777. [Google Scholar] [CrossRef]
- Glenk, G.; Reichelstein, S. Economics of converting renewable power to hydrogen. Nat. Energy 2019, 4, 216–222. [Google Scholar] [CrossRef] [Green Version]
- Asgari, P.; Mousavi, S.; Aghayan, H.; Ghasemi, H.; Yousefi, T. Nd-BTC metal-organic framework (MOF); synthesis, characterization and investigation on its adsorption behavior toward cesium and strontium ions. Microchem. J. 2019, 150, 104188. [Google Scholar] [CrossRef]
- Barwe, S.; Weidner, J.; Cychy, S.; Morales, D.M.; Dieckhöfer, S.; Hiltrop, D.; Masa, J.; Muhler, M.; Schuhmann, W. Electrocatalytic oxidation of 5-(hydroxymethyl) furfural using high-surface-area nickel boride. Angew. Chem. Int. Ed. 2018, 57, 11460. [Google Scholar] [CrossRef]
- Renau, J.; García, V.; Domenech, L.; Verdejo, P.; Real, A.; Giménez, A.; Sánchez, F.; Lozano, A.; Barreras, F. Novel Use of Green Hydrogen Fuel Cell-Based Combined Heat and Power Systems to Reduce Primary Energy Intake and Greenhouse Emissions in the Building Sector. Sustainability 2021, 13, 1776. [Google Scholar] [CrossRef]
- Ahshan, R. Potential and Economic Analysis of Solar-to-Hydrogen Production in the Sultanate of Oman. Sustainability 2021, 13, 9516. [Google Scholar] [CrossRef]
- Jarosch, C.; Jahnke, P.; Giehl, J.; Himmel, J. Modelling Decentralized Hydrogen Systems: Lessons Learned and Challenges from German Regions. Energies 2022, 15, 1322. [Google Scholar] [CrossRef]
- Matute, G.; Yusta, J.; Beyza, J.; Monteiro, C. Optimal dispatch model for PV-electrolysis plants in self-consumption regime to produce green hydrogen: A Spanish case study. Int. J. Hydrogen Energy 2022, 47, 25202–25213. [Google Scholar] [CrossRef]
- World Atlas, Maps of Jordan. Available online: https://www.worldatlas.com/maps/jordan, (accessed on 26 November 2022).
- IEA. Countries and Regions. Available online: https://www.iea.org/countries (accessed on 14 August 2022).
- Global Solar Atlas. Available online: https://globalsolaratlas.info/map (accessed on 18 June 2022).
- Al-Mhairat, B.; Al-Quraan, A. Assessment of Wind Energy Resources in Jordan Using Different Optimization Techniques. Processes 2022, 10, 105. [Google Scholar] [CrossRef]
- Taaleri Energia-Baynona Solar Project, Jordan. Available online: https://www.taalerienergia.com/en/funds/solarwind-i/baynona-solar-project-jordan (accessed on 18 June 2022).
- Duffie, J.A.; Beckman, W.A. Solar Engineering of Thermal Processes, 4th ed.; John Wiley: Hoboken, NJ, USA, 2013. [Google Scholar]
- Krajačić, G.; Martins, R.; Busuttil, A.; Duić, N.; Carvalho, M.D.G. Hydrogen as an energy vector in the islands’ energy supply. Int. J. Hydrogen Energy 2008, 33, 1091–1103. [Google Scholar] [CrossRef]
- Taibi, E.; Miranda, R.; Vanhoudt, W.; Winkel, T.; Lanoix, J.C.; Barth, F. Hydrogen from Renewable Power: Technology Outlook for the Energy Transition; International Renewable Energy Agency (IRENA): Abu Dhabi, United Arab Emirates, 2018; p. 52. [Google Scholar]
- Demirbas, A. Effects of Moisture and Hydrogen Content on the Heating Value of Fuels. Energy Sources Part A Recover. Util. Environ. Eff. 2007, 29, 649–655. [Google Scholar] [CrossRef]
- Cengel, Y.; Boles, M. Thermodynamics: An Engineering Approach, 8th ed.; McGraw-Hill Education: New York, NY, USA, 2015. [Google Scholar]
- Walschot, M.; Luis, P.; Liégeois, M. The challenges of reverse osmosis desalination: Solutions in Jordan. Water Int. 2020, 45, 112–124. [Google Scholar] [CrossRef]
- Calado, G.; Castro, R. Hydrogen Production from Offshore Wind Parks: Current Situation and Future Perspectives. Appl. Sci. 2021, 11, 5561. [Google Scholar] [CrossRef]
- Alkhalidi, A.; Alqarra, K.; Abdelkareem, M.A.; Olabi, A. Renewable Energy Curtailment practices in Jordan and Proposed Solutions. Int. J. Thermofluids 2022, 6, 100196. [Google Scholar] [CrossRef]
- Jordanian Ministry of Energy and Mineral Resources. Energy Annual Report in 2016. Amman, Jordan. Available online: https://www.greengrowthknowledge.org/sites/default/files/downloads/policy_database/JORDAN%29%20The%20Ministry%20of%20Energy%20and%20Mineral%20Resources%2C%20Annual%20Report%202016.pdf (accessed on 1 March 2020).
- Rising Gas Prices Make Green Hydrogen Cheaper than Grey Hydrogen|Clean Energy Wire. Available online: https://www.cleanenergywire.org/news/rising-gas-prices-make_green-hydrogen-cheaper-gray-hydrogen (accessed on 18 June 2022).
- Jaradat, M.; Al-Addous, M.; Albatayneh, A.; Dalala, Z.; Barbana, N. Potential Study of Solar Thermal Cooling in Sub-Mediterranean Climate. Appl. Sci. 2020, 10, 2418. [Google Scholar] [CrossRef] [Green Version]
- Böing, F.; Regett, A. Hourly CO2 Emission Factors and Marginal Costs of Energy Carriers in Future Multi-Energy Systems. Energies 2019, 12, 2260. [Google Scholar] [CrossRef]


| Author (Year) | Renewable Energy Source | PV Area Required | Solar Irradiance Involved in Model | Simulink Tool | Electrolysis Investigated | Number of Locations |
|---|---|---|---|---|---|---|
| Ahshan, 2021 [23] | PV | No | Yes | - | No | 6 |
| Jarosch et al., 2022 [24] | PV, wind, biomass | No | No | - | No | 5 |
| Matute et al., 2022 [25] | PV | No | Yes | GAMS | No | 1 |
| Nasser et al., 2022 [11] | PV, wind | No | No | MATLAB | No | 2 |
| Agyekum et al., 2022 [12] | PV, hydro | No | No | HOMER | No | 5 |
| Technology | ALK | PEM | Mathematical Model for ALK | Mathematical Model for PEM | |||
|---|---|---|---|---|---|---|---|
| Unit | 2017 | 2025 | 2017 | 2025 | |||
| Efficiency | kWh of electricity/kg of H2 production | 51 | 49 | 58 | 52 | 555.25 − 0.25 × year | 1570.75 − 0.75 × year |
| Total System Cost | Eur/kW | 750 | 480 | 1200 | 700 | 68,823.75 − 33.75 × year | 127,262.5 − 62.5 × year |
| Typical Output Pressure | Bar | Atmospheric | 15 | 30 | 60 | −3528.75 + 1.75 × year | −7533.75 + 3.75 × year |
| System Life Time | Years | 20 | 20 | 20 | 20 | ||
| Source | GWh | CO2 Factor (kg of CO2/kWh) | Emissions (Tons) |
|---|---|---|---|
| Natural Gas | 9211 | 0.4 | 3,684,400 |
| Diesel | 6644 | 0.6 | 4,650,800 |
| Heavy Fuel Oil | 2974 | 0.7 | 1,784,400 |
| Renewable | 184 | 0 | 0 |
| Total | 19,013 | 10,119,600 |
Publisher’s Note: MDPI stays neutral with regard to jurisdictional claims in published maps and institutional affiliations. |
© 2022 by the authors. Licensee MDPI, Basel, Switzerland. This article is an open access article distributed under the terms and conditions of the Creative Commons Attribution (CC BY) license (https://creativecommons.org/licenses/by/4.0/).
Share and Cite
Jaradat, M.; Alsotary, O.; Juaidi, A.; Albatayneh, A.; Alzoubi, A.; Gorjian, S. Potential of Producing Green Hydrogen in Jordan. Energies 2022, 15, 9039. https://doi.org/10.3390/en15239039
Jaradat M, Alsotary O, Juaidi A, Albatayneh A, Alzoubi A, Gorjian S. Potential of Producing Green Hydrogen in Jordan. Energies. 2022; 15(23):9039. https://doi.org/10.3390/en15239039
Chicago/Turabian StyleJaradat, Mustafa, Omar Alsotary, Adel Juaidi, Aiman Albatayneh, Asem Alzoubi, and Shiva Gorjian. 2022. "Potential of Producing Green Hydrogen in Jordan" Energies 15, no. 23: 9039. https://doi.org/10.3390/en15239039