Article

Time-Average Heat Transfer Coefficient for Steam-Air Condensation during the Dropping of Containment Pressure

1
Science and Technology on Thermal Energy and Power Laboratory, Wuhan 2nd Ship Design and Research Institute, Wuhan 430205, China
2
State Key Laboratory of Multiphase Flow in Power Engineering, Xi’an Jiaotong University, Xi’an 710049, China
*
Author to whom correspondence should be addressed.
Energies 2022, 15(23), 9034; https://doi.org/10.3390/en15239034
Submission received: 18 October 2022 / Revised: 15 November 2022 / Accepted: 18 November 2022 / Published: 29 November 2022
(This article belongs to the Special Issue Heat and Mass Transfer of Multiphase Flow)

Abstract

:
The passive containment cooling system (PCCS) has been applied in the new generation nuclear power plant. Previous studies mainly focused on steady-state heat transfer, but the actual heat transfer of PCCS is the transient process. Thus, investigating the transient heat transfer during the containment pressure dropping is necessary. The present study proposes a time-average condensation heat transfer coefficient (time-average condensation HTC) to characterize the intensity of transient condensation heat transfer. The time-average condensation HTC is defined as the heat absorbed per unit heat transfer area and per unit wall subcooling in a unit time. Experiments were performed to research the effect of initial gas-mixture pressure and air mass fraction on transient HTC. The result showed that the more significant gas-mixture pressure and lower air mass fraction could promote the transient-state heat transfer, especially the low air mass fraction. Based on the experimental result, a detailed empirical correlation for the time-average heat transfer coefficient is developed with an error of ±20%. Another simplified empirical correlation that only includes air mass fraction is also proposed to predict the transient heat transfer roughly. Besides, research on self-sustaining stability is also conducted to evaluate the stable operation characteristic of PCCS. The system can respond quickly and then run to a new steady state after interference during the long-term operation of PCCS. The phenomenon above implies that PCCS has good self-sustaining stability.

1. Introduction

Nuclear safety has attracted increasing global attention after the Fukushima accident. The passive containment cooling system (PCCS) has been used in third-generation nuclear power plants (NPPs) [1,2,3].
AP1000 [4], VVER1200 [1] and HPR1000 [3] as new generation nuclear power plants have been most widely applied. Although both AP1000 and HPR1000 adopt passive safety technology, different methods are used in these two types of nuclear power plants. AP1000 used its inner steel containment as the heat transfer medium and was supplemented by a water tank spray and an air loop. However, for HPR1000, VVER1200 and i-POWER [5], because these NPP have concrete containment, tube-and-shell heat exchangers are placed inside the containment to remove heat from the containment to the external environment by the naturally driven flow.
In recent years, many studies have been conducted to reveal the condensation HTC with influence factor, for example, the mixed gas pressure, non-condensable gas mass fraction and wall subcooling. Kim et al. concluded that during the condensation of the gas mixture on the heat exchanger surface, the non-condensable gas exists around the heat exchanger bundle to form a barrier, resulting in increased resistance to steam diffusion to the heat exchanger surface. Thus, the condensation HTC decreases as the non-condensable gas mass fraction increases [6]. At the same time, Lee et al. found that the relationship between the non-condensable gas mass fraction and the heat transfer condensation is not linear, and the lower non-condensable gas mass fraction is sufficient to reduce the condensation heat transfer rate significantly [7]. Fan et al. and Su et al. found that the condensation HTC increases with the increase in gas-mixture pressure by experimental studies and numerical simulations [8,9]. Bian et al. concluded that increasing the gas-mixture pressure increased the gas mixture’s density and the steam’s diffusion coefficient in the gas mixture by numerical simulation. In other words, the increasing pressure is favorable to the condensation of the steam on the surface of the heat exchanger through the non-condensing gas layer [10,11]. The wall subcooling significantly impacts condensation HTC during the steady-state heat transfer. It is generally believed that the increasing wall subcooling will inhibit the condensation HTC [6,12,13].
Many previous studies have revealed the relationship between the condensation HTC and various influencing factors during the steady-state performance of PCCS. However, the operation of PCCS in actual runs is a transient process. Thus, the mixed gas pressure, air mass fraction and wall subcooling constantly change over running time. With some limitations, the steady-state calculation cannot accurately predict the transient heat transfer rate. Investigating transient heat transfer characteristics is necessary and setting up a method to characterize the transient heat transfer rate is equally important. Our previous work proposed the response time to reflect the association between transient heat transfer and steady-state heat transfer intensity. At the same time, the formula is also developed to quantify the effects of factors [14].
Researchers focus not only on the heat transfer characteristic of the transient process but also the flow characteristic. The cooling water density difference between the inlet and outlet in the heat exchanger is a driving force for PCCS. The oscillation phenomenon occurs during the start-up and long-term operation of the system, which can lead to the variation in the system, which can lead to the variation of heat transfer capacity [15]. The flow instability characteristic of the natural circulation loop is the main factor to consider during the design and operation of the system [16,17]. Former research about flow instability has focused on closed natural circulation, but relatively few studies on the open natural circulation loop. Guo et al. conducted experiments to reveal the flow instability phenomenon and its mechanism during the start-up process and a classification of flow instability is also given [18,19]. Hou et al. found the law of changes in flow patterns under the condition of different start-up power through experiments. The results suggest that the interaction between the boiling phenomenon and the flash phenomenon in the heat transfer tube caused the variation of the flow pattern [20]. In addition, a detailed study about the geysers phenomenon that occurred in the start-up process has been performed by Hou et al. The result showed that the geyser results from a mismatch between the heating power and output capacity of the system. In other words, the local overheating contributes to flash evaporation, which finally leads to the geyser phenomenon [21]. Moreover, the flow instability is closely related to the cooling water flow rate and the flow resistance.
In this paper, experiments were performed in a scale experimental facility to study the heat transfer characteristic during the containment pressure dropping. The process where the steam–air mixture pressure decreases to 95% of the initial steam–air mixture pressure in the pressurized tank is defined as the transient process. The current study aims to obtain the association between the transient heat transfer characteristic and influence factors. Based on the result, the time-average condensation HTC is proposed to characterize the transient heat transfer process and the corresponding empirical formula is established. In addition, the safety system of NPP is an integrated system; whether the perturbations will affect the operation of PCCS can equally be a cause for concern. This research can further deepen the understanding of the transient operation of PCCS and provide effective guidance to practical engineering.

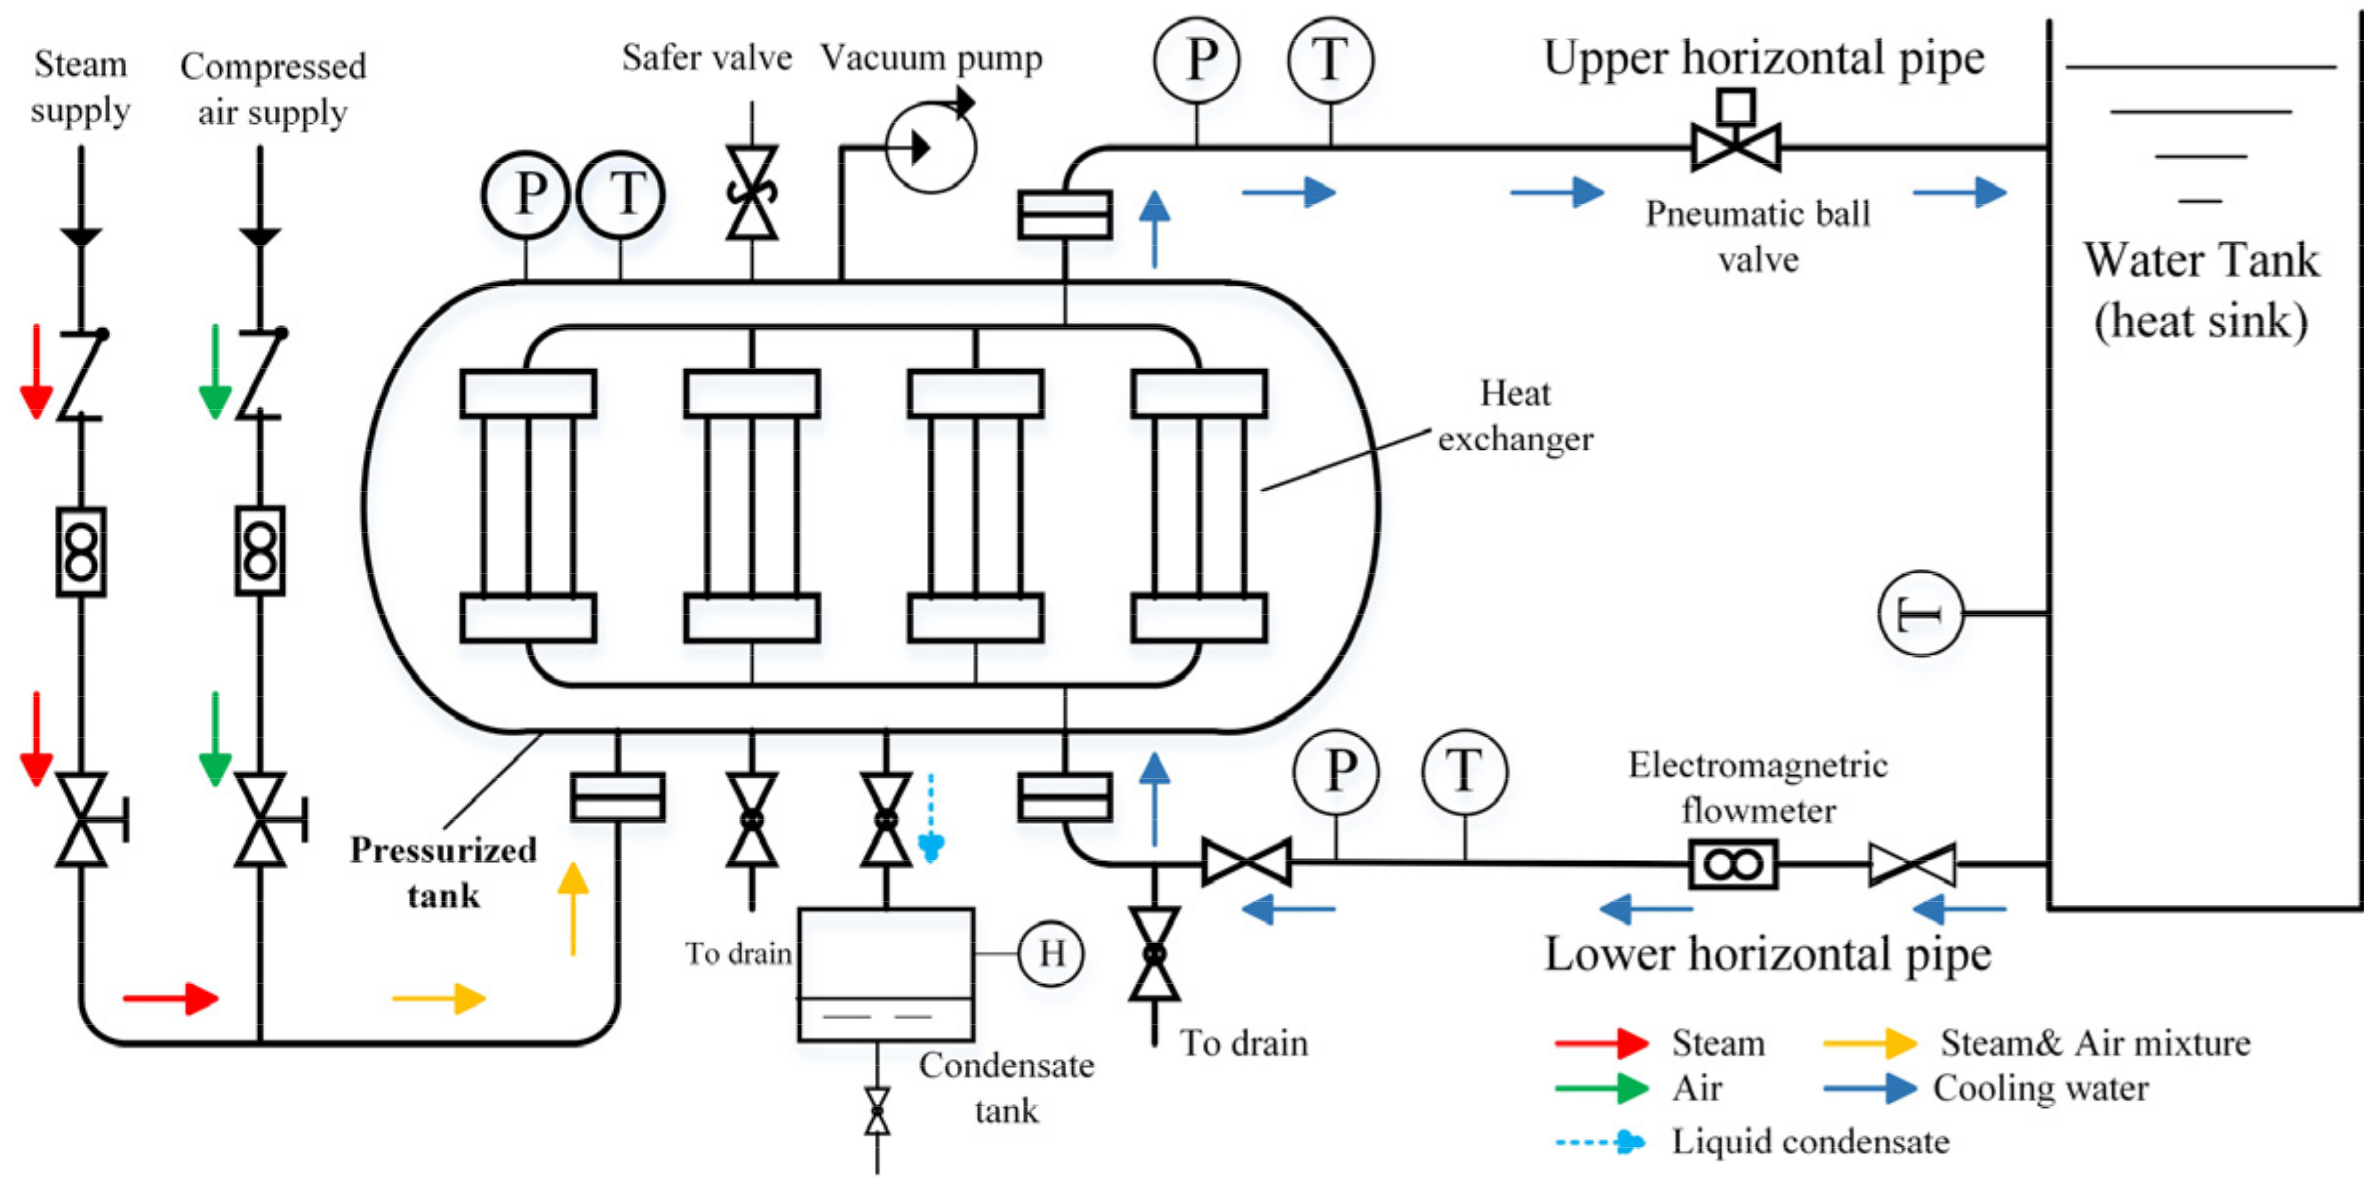
2. Experimental Facility

2.1. Details of the Facility

The experimental system is shown in Figure 1. The experimental system mainly includes the heat exchanger, pressurized tank, cooling water tank, natural circulation loop and corresponding gas supply system and measurement and acquisition system. The gas supply system includes an electric steam boiler, air compressor, vacuum pump and other auxiliary equipment.
The heat exchanger and pressurized tank are the main components of the experimental system. The pressurized tank is a horizontal tank with a diameter of 2 m and a length of 3.2 m. The heat exchanger is arranged on the wall side of the pressurized tank. The heat exchanger consists of 140 smooth stainless steel tubes with an external diameter of 17 mm, wall thickness of 1.5 mm and length of 1.2 m. The arrangement of these heat exchanger tubes is staggered by triangle form. The outer wall of the pressurized tank is wrapped with insulation material to reduce the dissipation of heat for the pressurized tank, and the heat loss can be overlooked.
The containment pressure could dynamically and intuitively reflect the transient heat transfer process and reveal the degree of heat transfer progression. Thus, in the current experiment, two pressure transducers with an accuracy of 0.025% are used to measure the total mixed gas pressure in the pressurized tank. Since the mixed gas temperature is closely related to the calculation of air mass fraction, the mixed gas temperature in containment is also an important thermal parameter, except for the pressure of mixed gas. A thermocouple group with a precision of 0.5 K is adopted to measure the temperature of mixed gas. T-type thermocouples with an accuracy of 0.5 K are welded to the outer wall of the heat exchanger to measure the outer wall temperature. Two pressure transducers are used to gain the pressure of cooling water in the inlet and outlet of the natural circulation loop. The cooling water flow rate is measured by an electromagnetic flow meter with a precision of 0.2%.

2.2. Experimental Procedures and Conditions

The overall procedure can be divided into the following steps. The pressurized tank and heat exchanger were preheated before experimentation to decrease the experimental error. In the experiment, a compressor and the vacuum obtain the air mass fraction under different working conditions. After the total pressure of the mixed gas increases to the preset value by continuously supplying the steam, PCCS will be activated and the experiment data will be recorded during the experiment.
Previous research suggests that the running parameter affects the condensation HTC. In addition, our former study showed that the transient-state heat transfer is insensitive to the initial cooling water temperature [13]. Thus, only the effect of the initial gas-mixture pressure and air mass fraction on the transient heat transfer is studied in this paper.
The gas-mixture pressure range is determined according to the engineering practice, the general maximum permissible value for containment is 0.5 MPa. The air mass fraction range is determined based on literature data [22]. The cooling water temperature is set at typical room temperature. Table 1 shows the specific operating conditions of the current experiments.
The pressure and temperature of the gas mixture are measured with some error caused by the instrument error. The pressure transducer is selected with ±0.025% accuracy of its full range and the thermocouple with an accuracy of 0.5 °C. To ensure the accuracy and reliability of experimental results, the measuring instruments were calibrated before and the repeatability experiments were performed simultaneously. In this paper, the uncertainty was estimated following the constant odds-product form method [23]. The temperature and pressure measurement of the gas mixture have an uncertainty of 4.2% and 5.6%, respectively.

3. Results and Discussion

3.1. Time-Average Condensation Heat Transfer Coefficient

The time-average condensation HTC is used to quantify the transient heat transfer in aluminum foam-filled channels [24]. The concept is now introduced in the present work to calculate the intensity of transient condensation heat transfer during the operation of PCCS. The time-average condensation HTC is defined as the heat transfer through the unit heat transfer area and wall subcooling in a unit time. Since the thermal stratification phenomenon occurs in the vertical direction of the containment, it is necessary to segment the containment and the heat exchanger vertically along this direction in the derivation of the time-average condensation HTC. The detailed calculation of time-average condensation HTC is as follows:
The total heat absorbed by cooling water in the overall transient condensation heat transfer process can be calculated as follows:
Q t o t = τ s τ e 0 L h i π d T b i , τ T w i , τ d L d τ
where, T b i is the bulk temperature, T w i is the outwall temperature of the heat transfer tube; τ e is the end moment of the heat transfer process, the end moment is the time when the containment pressure is reduced to 95% of the initial containment pressure; τ s is the start moment of the heat transfer process; L is the tube length.
The time-average heat transfer rate can be calculated as:
q = Q t o t τ = π d τ s τ e 0 L h i T b i , τ T w i , τ d L d τ τ e τ s
Q t o t = π d τ s τ e 0 L h i T b i , τ d L 0 L h i T w i , τ d L d τ
To simplify Equation (3), it is assumed that there is a functional relationship along the heat exchange tube length direction as follows.
T b i , τ = f T b i τ
T w i , τ = f T w i τ
Equation (3) can be expressed as.
Q t o t = π d τ s τ e f T b i τ 0 L h i d L f T w i τ 0 L h i d L d τ
The average condensation HTC along the direction of the heat transfer tube is obtained as follows.
h ¯ = 1 L 0 L h i d L
Based on Equations (6) and (7), Equation (2) can be expressed as follows.
q = Q t o t τ = π d L τ s τ e h ¯ f T b i τ f T w i τ d τ τ e τ s
The time-average condensation HTC can be calculated by taking the time average of the average condensation HTC.
h = = q π d L T ¯
and   T ¯ = τ s τ e f T b i τ f T w i τ d τ τ

3.2. Time-Average Condensation HTC vs. Various Conditions

Figure 2 shows the variation of time-average condensation HTC with air mass fraction. As present in the figure, the time-average condensation HTC drops with the rise of air mass fraction. The conclusion is consistent with previous studies, resulting from the lower air mass fraction weakening the thermal resistance around the heat transfer tube and enhancing the diffusion capacity.
Figure 3 presents the variation of time-average condensation HTC with initial gas-mixture pressure. The time-average condensation HTC increases with increasing gas-mixture pressure. However, it also suggests that the increasing initial gas-mixture pressure serves a limited role in the increase in time-average condensation HTC. The more tremendous gas-mixture pressure cannot significantly improve the time-average condensation HTC of the system in specific air mass fraction ranges.
Several steam condensation experimental correlations have been proposed in previous studies, such as Bian-Ding correlation [25], Su correlation [9], Dehbi correlation [26], Liu correlation [12] and Uchida correlation [27]. Figure 4 shows the comparisons between the current experimental data and the results calculated by the above correlations. It is clear that the experimental values display a large deviation from the predicted values, the maximum error is nearly up to 80%.
The empirical correlations proposed in existing literature fail to predict transient heat transfer effectively. These correlations are obtained during steady-state conditions. However, the running parameter is continuously changing during the transient heat transfer. The steady correlations can theoretically be applied to predict the transient heat transfer under the assumption that the transient heat transfer at each instant is the steady heat transfer. Nevertheless, the real-time operation parameters are difficult to obtain after the accident. For this reason, it is still tough to use steady-state correlations to predict transient heat transfer in practical engineering. Thus, the initial running parameters at the moment of the accident should be considered to predict the transient heat transfer.

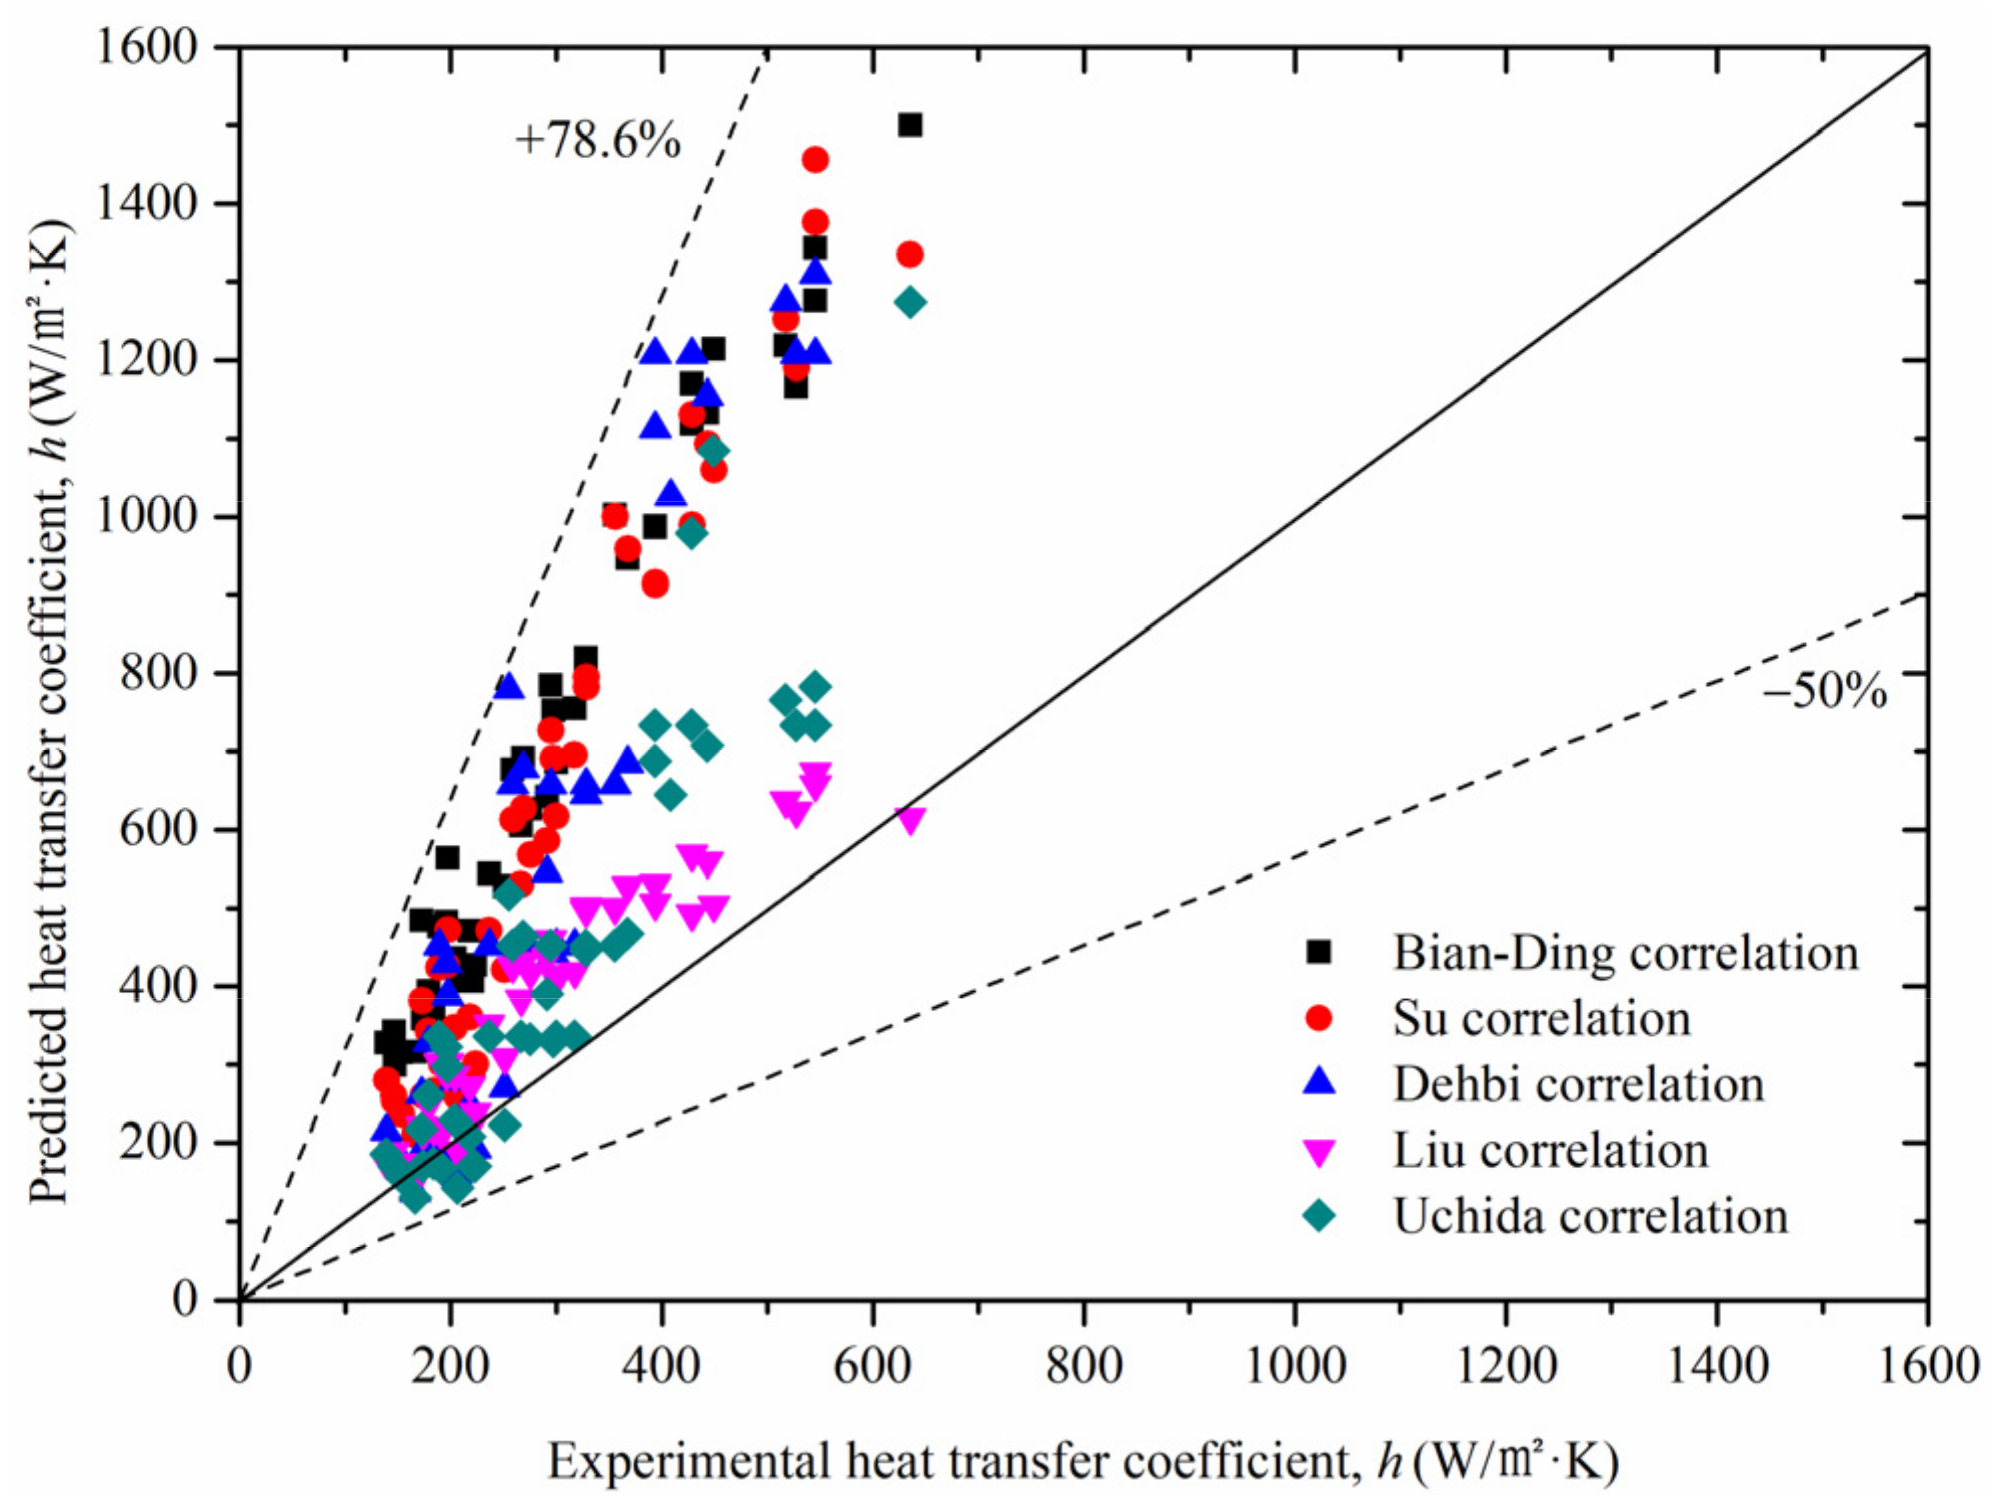
3.3. The Empirical Correlation

Since Equation (9) is hard to apply in a real application of practical engineering, it is necessary to develop a simple form of an equation. Based on the above equations, the state equation of ideal gas and Buckingham’s method of dimensional analysis are adopted, Equation (9) can be written as:
h = = P 3 / 2 V 1 / 3 ρ a 1 / 2 f V 2 / 3 A T ¯ 1
Since the air density is affected by the air mass fraction and gas-mixture pressure, Equation (11) can be transformed as:
h = = k V 1 / 3 f V 2 / 3 A f W a , P t T ¯ 1
h = = K f V , A f W a , P t T ¯ 1
Based on the above conclusion, the air mass fraction is considered the main impact factor for the system in practical engineering. Our earlier study demonstrated that the cooling water temperature almost does not influence the transient heat transfer [14]. Thus, the cooling temperature is disregarded in the formula fitting. After obtaining experimental data at different mixed gas pressure and air mass fraction conditions, the experimental data are fitted by nonlinear regression according to the specified function as Equation (14).
h = 81.37 φ P 0.461 W a 0.828
where   φ = V V e x p A e x p A ; V e x p   is the pressurized tank volume and the heat transfer area in the present experiment, V e x p = 8.9   m 3 and A e x p = 11.2   m 2 . The range of applicability of the fitting formula is as: 0.2 < P < 0.6;15.1% < Wa < 82.3%.
P indicates the dimensionless gas mixture pressure, which can be calculated as follows:
P = P t P s t a
where P s t a is the standard atmospheric pressure, P s t a = 0.1   MPa .
Since the time-average condensation HTC is more closely related to the air mass fraction, the simplified empirical correlation is developed as Equation (16). The empirical correlation only includes the air mass fraction, which is similar to the Uchida correlation [27].
h = 280 1 W a W a 0.44
Figure 5 and Figure 6 compare the experimental data and the predicted values of the formula. It is clear that the predicted values of the detailed empirical correlation (Equation (14)) are in accordance with the experimental data, and the predicted values of the simplified empirical correlation (Equation (16)) only agree with the experimental data trend. Since the prediction of the simplified empirical correlation is overly conservative, the empirical correlation should be applied with caution. However, the rough prediction of heat transfer by simplified empirical correlation can meet the requirements for fast calculation in practical engineering.
Figure 7 compares the experimental data and predicted values of the detailed empirical correlation (Equation (14)), and the error is less than ±20%. Thus, the empirical correlation obtained in this paper can be utilized to calculate the time-average condensation HTC.

3.4. Self-Sustaining Stability

During the operation of PCCS, the interference from PCCS itself and other systems has an impact on the running of PCCS. For example, the variation of valve opening in the inlet pipe and the decay heat transfer rate will disrupt the stable operation of PCCS. It is necessary to study the stability of PCCS by the amount of time needed to reach a steady state. Thus, the self-sustaining stability of the system is proposed to evaluate the stable operation characteristic of PCCS in this paper. Figure 8 plotted the variation of the cooling water flow rate and the outlet pressure in the natural circulation loop with a sudden change in the valve opening. The cooling water flow rate increases first and then decreases with the sudden decrease of the valve opening. The reason for this is as follows: firstly, the sudden reduction in the valve opening enhanced the flow resistance, resulting in an abrupt decrease in the cooling water flow rate. Secondly, the small cooling water flow rate increased the outlet temperature in the heat exchanger, which finally leads to an increase in the driving force of PCCS (See Figure 8). The driving force in the natural circulation loop is determined by the cooling water temperature difference between the inlet and outlet of the heat exchanger. Therefore, the cooling water flow rate remained raised until the driving force became comparable to the resistance in the natural circulation loop. It suggests that the new steady-state operation process has been re-established. In addition, with the higher temperature of cooling water, a shorter time is needed for the system to rerun the new steady-state operation process.
Figure 9 illustrates the variation of the outlet cooling water temperature in the heat exchanger under a sudden change in the valve opening. As shown in the figure, the outlet cooling water temperature increases rapidly and then remains unchanged. Due to the lower cooling water flow rate in the natural circulation loop, the cooling water will stay longer in the heat exchanger. As a result, the above processes result in the cooling water absorbing more heat. With the same heat transfer rate, the outlet cooling water temperature increases rapidly accordingly. When the outlet cooling water temperature remains constant, the operation of PCCS is back to the steady-state level.

4. Conclusions

Under different initial mixed gas pressure and initial air mass fraction conditions, a series of experiments were performed to investigate the transient-state heat transfer characteristic. A summative conclusion can be drawn as follows:
(1)
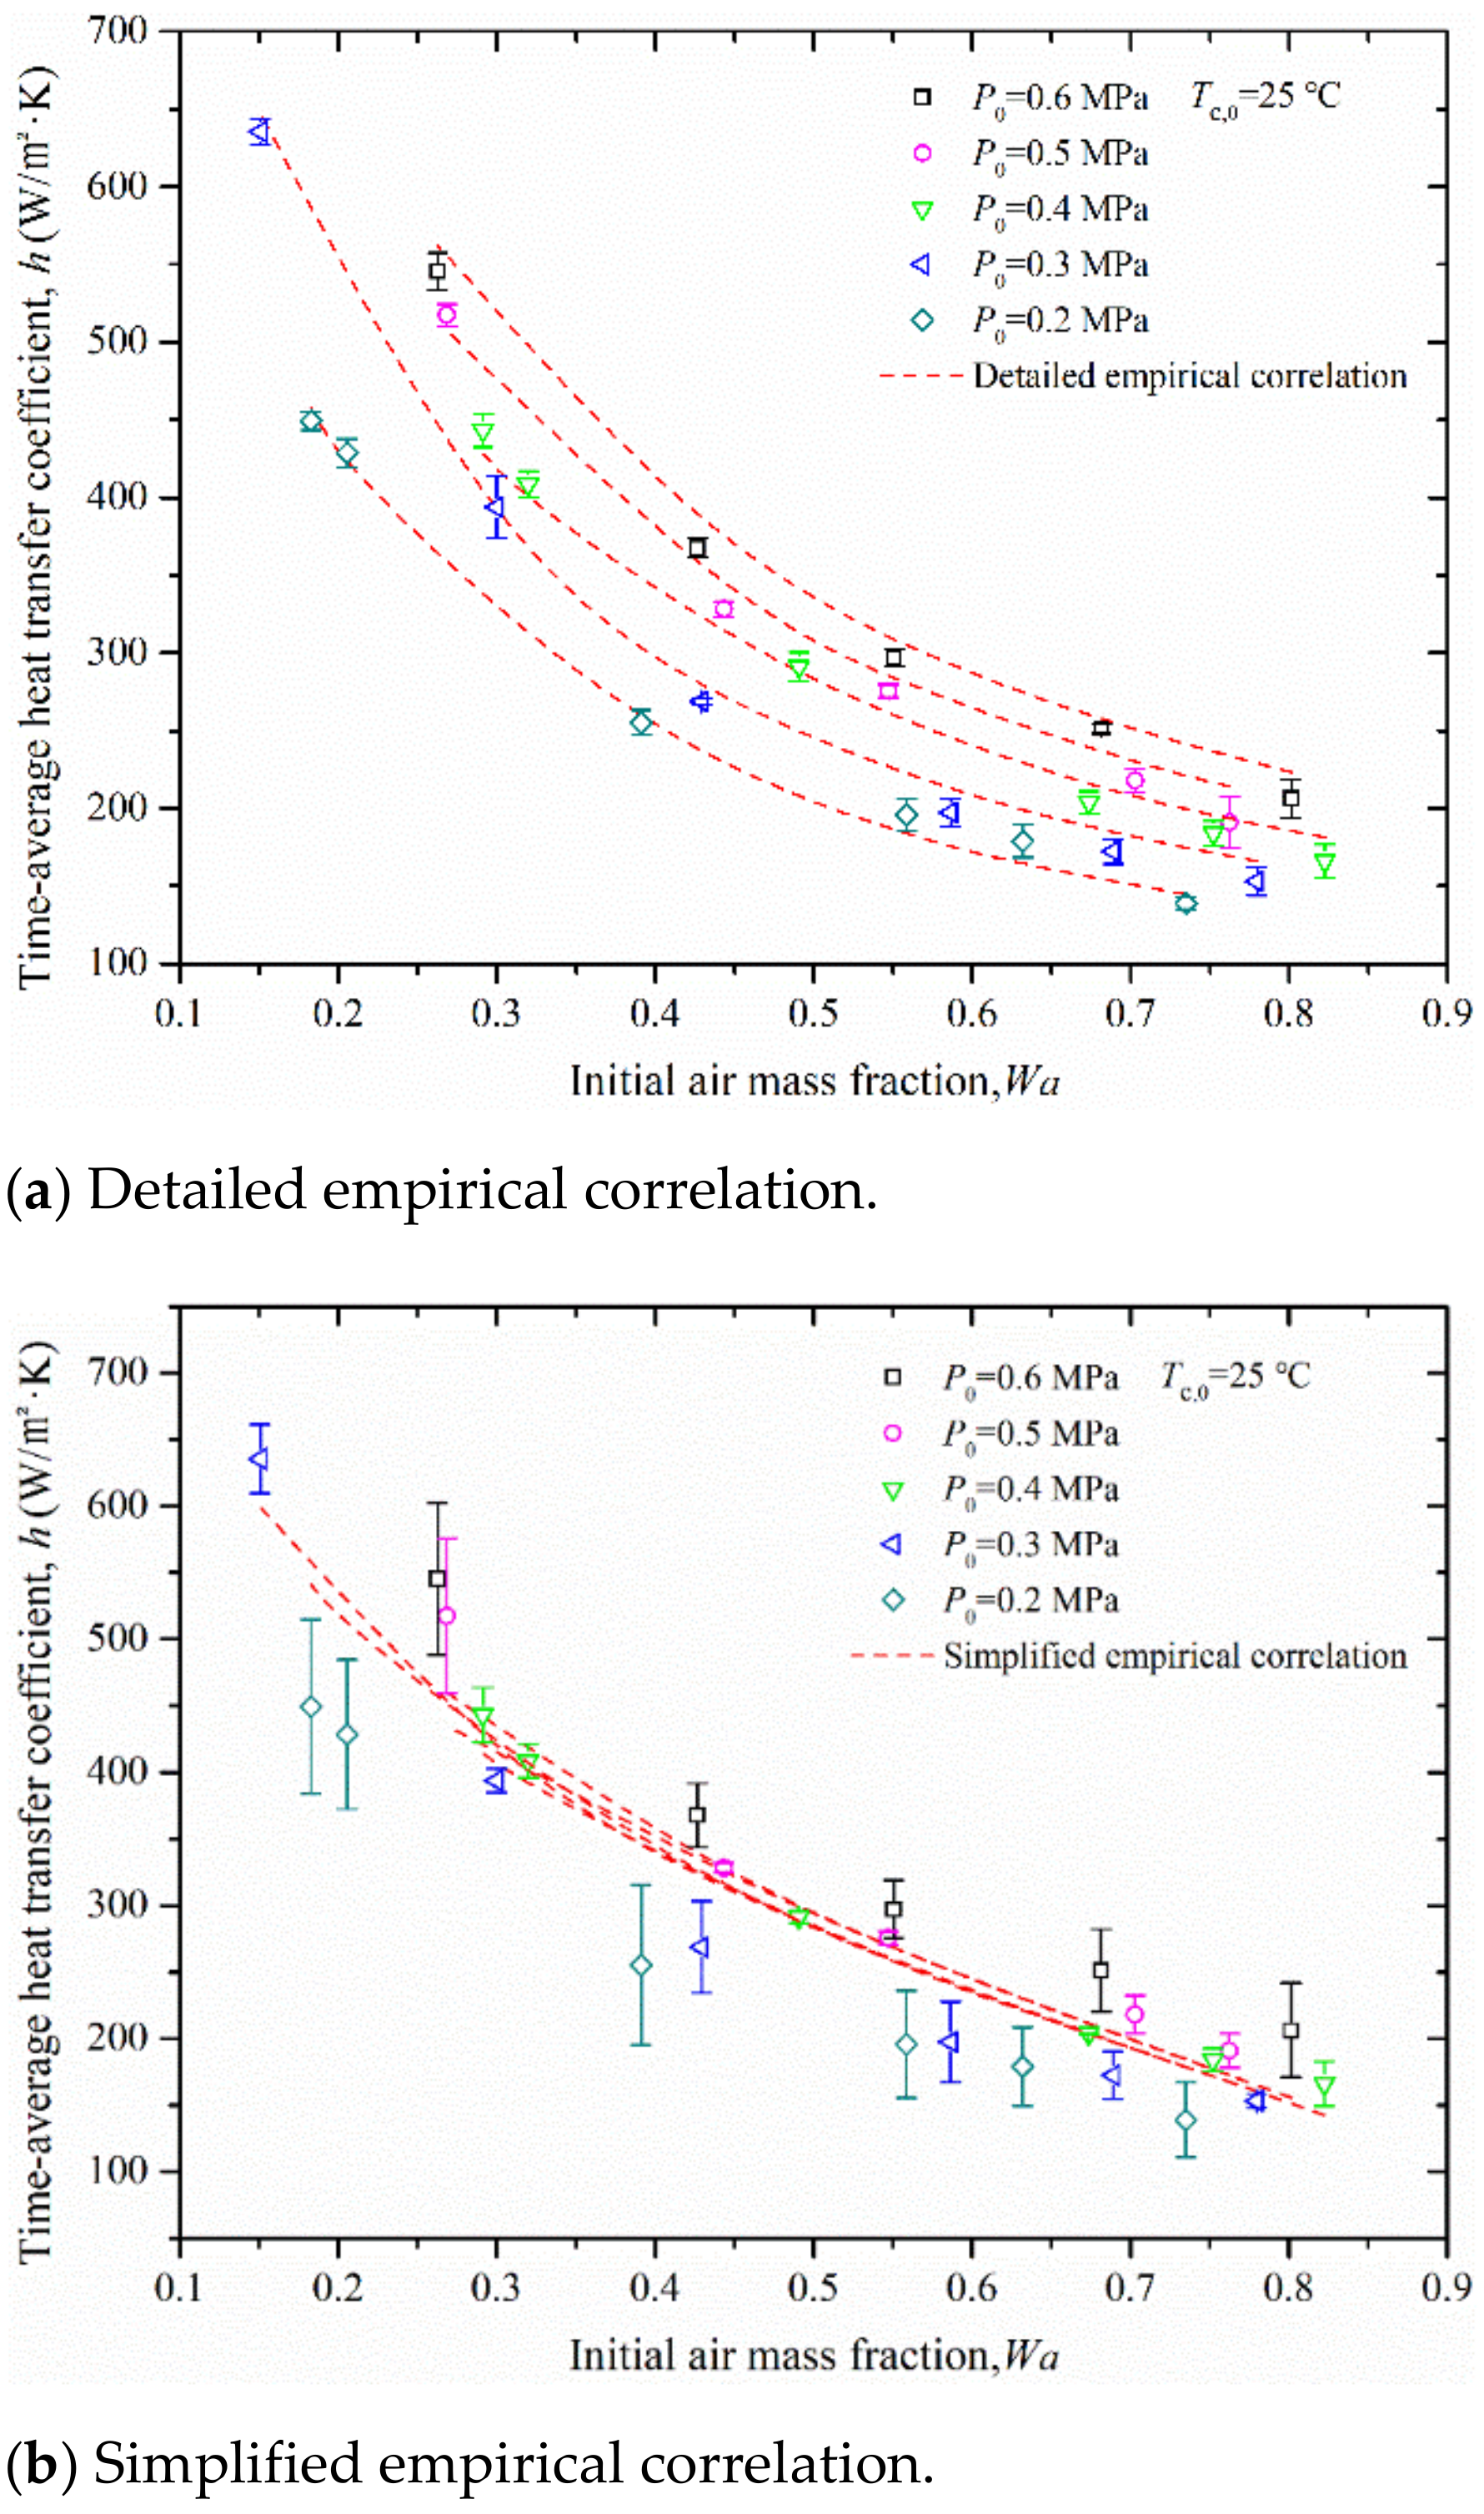
Time-average condensation HTC is defined to quantitatively characterize heat transfer intensity during the whole transient running of PCCS. Moreover, a detailed empirical correlation for the time-average condensation HTC is developed. The equation matches experimental data well with a fitting error of ±20%.
(2)
The more considerable initial gas mixture pressure and smaller air mass fraction can enhance the transient heat transfer. Moreover, the time-average HTC is more closely related to the initial air mass fraction. Thus, a simplified empirical correlation that only includes air mass fraction is also proposed to roughly predict the transient heat transfer.
(3)
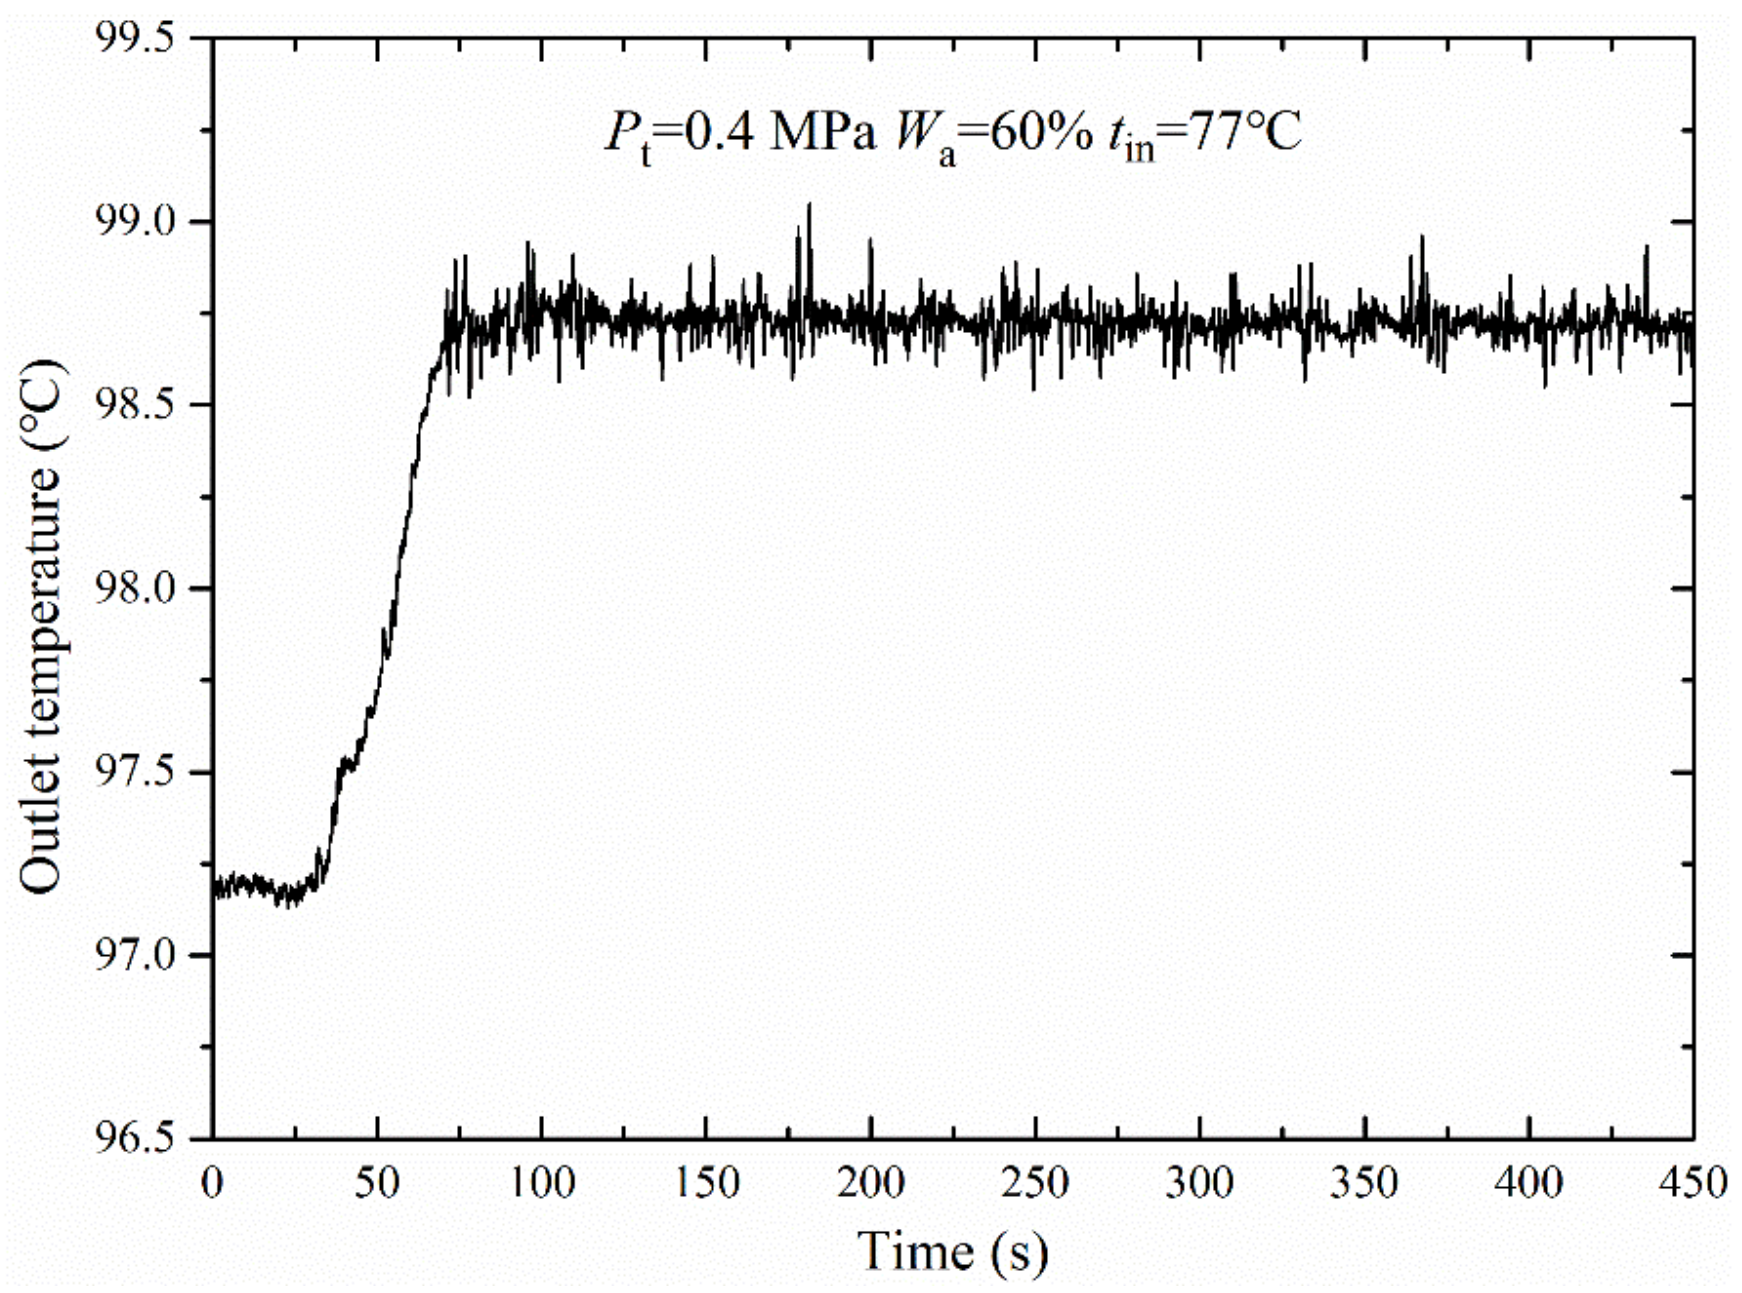
PCCS has good self-sustaining stability. When an interference occurs during the long-term operation of PCCS, PCCS responds quickly and reruns to the new steady state.

Author Contributions

S.L.: Conceptualization, Methodology, Writing—original draft. K.H.: Conceptualization, Methodology, Writing—original draft. Z.K.: Writing—review & editing. Y.L.: Writing—review & editing. All authors have read and agreed to the published version of the manuscript.

Funding

This research was funded by [Open Found of Science and Technology on Thermal Energy and Power Laboratory] grant number [TPL2020A01] And [Fundamental Research Funds for the Central Universities and National Natural Science Foundation of China] grant number [11902230].

Data Availability Statement

The data presented in this study are available upon request of the corresponding author.

Conflicts of Interest

The authors declare no conflict of inerest.

Nomenclature

Abbreviations
HTCHeat transfer coefficient
General notation
AHeat transfer area, m2
dDiameter of heat transfer tube, m
hHeat transfer coefficient, W·m−2·K−1
KCorrection factor,/
LTube length, m
PPressure, MPa
qHeat transfer rate, W
QEnergy, J
TTemperature, K
VContainment volume, m3
WMass fraction,/
ρ Mass density, kg·m−3
τ Time, s
τ e End moment, s
τ s Start moment, s
T Wall subcooling, K
Subscripts
aAir
bContainment bulk
cCooling water
iEach moment
sSteam
staStandard atmospheric
tTotal
wHeat transfer tube wall
0Initial moment

References

  1. Bakhmet’Ev, A.M.; Bol’Shukhin, M.A.; Vakhrushev, V.V.; Khizbullin, A.M.; Makarov, O.V.; Bezlepkin, V.V.; Semashko, S.E.; Ivkov, I.M. Experimental validation of the cooling loop for a passive system for removing heat from the AES-2006 protective envelope design for the Leningradskaya nuclear power plant site. Sov. At. Energy 2009, 106, 185–190. [Google Scholar] [CrossRef]
  2. Lim, S.G.; No, H.C.; Lee, S.W.; Kim, H.G.; Cheon, J.; Lee, J.M.; Ohk, S.M. Development of stability maps for flashing-induced instability in a passive containment cooling system for iPOWER. Nucl. Eng. Technol. 2019, 52, 37–50. [Google Scholar] [CrossRef]
  3. Xing, J.; Song, D.; Wu, Y. HPR1000: Advanced Pressurized Water Reactor with Active and Passive Safety. Engineering 2016, 2, 79–87. [Google Scholar] [CrossRef] [Green Version]
  4. Hung, Z.-Y.; Ferng, Y.-M.; Hsu, W.-S.; Pei, B.-S.; Chen, Y.-S. Analysis of AP1000 containment passive cooling system during a loss-of-coolant accident. Ann. Nucl. Energy 2015, 85, 717–724. [Google Scholar] [CrossRef]
  5. Lee, S.W.; Heo, S.; Ha, H.U.; Kim, H.G. The concept of the innovative power reactor. Nucl. Eng. Technol. 2017, 49, 1431–1441. [Google Scholar] [CrossRef]
  6. Kim, J.W.; Lee, Y.G.; Ahn, H.K.; Park, G.C. Condensation heat transfer characteristic in the presence of non-condensable gas on natural convection at high pressure. Nucl. Eng. Des. 2009, 239, 688–698. [Google Scholar] [CrossRef]
  7. Lee, Y.-G.; Jang, Y.-J.; Choi, D.-J. An experimental study of air–steam condensation on the exterior surface of a vertical tube under natural convection conditions. Int. J. Heat Mass Transf. 2017, 104, 1034–1047. [Google Scholar] [CrossRef]
  8. Fan, G.; Tong, P.; Sun, Z.; Chen, Y. Development of a new empirical correlation for steam condensation rates in the presence of air external vertical smooth tube. Ann. Nucl. Energy 2018, 113, 139–146. [Google Scholar] [CrossRef]
  9. Su, J.; Sun, Z.; Fan, G.; Ding, M. Experimental study of the effect of non-condensable gases on steam condensation over a vertical tube external surface. Nucl. Eng. Des. 2013, 262, 201–208. [Google Scholar] [CrossRef]
  10. Bian, H.; Sun, Z.; Zhang, N.; Meng, Z.; Ding, M. Numerical investigations on steam condensation in the presence of air on external surfaces of 3 × 3 tube bundles. Prog. Nucl. Energy 2018, 111, 42–50. [Google Scholar] [CrossRef]
  11. Bian, H.; Sun, Z.; Ding, M.; Zhang, N. Local phenomena analysis of steam condensation in the presence of air. Prog. Nucl. Energy 2017, 101, 188–198. [Google Scholar] [CrossRef]
  12. Liu, H.; Todreas, N.; Driscoll, M. An experimental investigation of a passive cooling unit for nuclear plant containment. Nucl. Eng. Des. 2000, 199, 243–255. [Google Scholar] [CrossRef] [Green Version]
  13. Kawakubo, M.; Aritomi, M.; Kikura, H.; Komeno, T. An experimental study on the cooling characteristics of passive containment cooling systems. J. Nucl. Sci. Technol. 2009, 46, 339–345. [Google Scholar] [CrossRef]
  14. Hui, K.; Chen, W.; Li, S.; Zhao, Q.; Yan, J. Experimental study on transient thermal–hydraulic characteristics of an open natural circulation for the passive containment cooling system. Int. J. Heat Mass Trans. 2021, 179, 121680. [Google Scholar] [CrossRef]
  15. Kyung, I.S.; Lee, S.Y. Periodic flow excursion in an open two-phase natural circulation loop. Nucl. Eng. Des. 1996, 162, 233–244. [Google Scholar] [CrossRef]
  16. Shi, S.; Schlegel, P.J.; Brooks, C.S. Experimental investigation of natural circulation instability in a BWR-type small modular reactor. Prog. Nucl. Energy 2015, 85, 96–107. [Google Scholar] [CrossRef] [Green Version]
  17. Yang, S.-K. Stability of flashing-driven natural circulation in a passive moderator cooling system for Canadian SCWR. Nucl. Eng. Des. 2014, 276, 259–276. [Google Scholar] [CrossRef]
  18. Guo, X.; Sun, Z.; Wang, J.; Yu, S.; Gao, L. Numerical simulation of the transient behaviors in an open natural circulation system with a large scale. Ann. Nucl. Energy 2015, 77, 83–93. [Google Scholar] [CrossRef]
  19. Guo, X.; Sun, Z.; Wang, J. Experimental study on start-up characteristics of open natural circulation system. Nucl. Tech. 2014, 37, 69–74. [Google Scholar]
  20. Hou, X.; Sun, Z.; Fan, G. Experimental investigation of start-up characteristics in open natural circulation system. At. Energy Sci. Technol. 2015, 49, 6. [Google Scholar]
  21. Hou, X.; Sun, Z.; Sun, Q. Experimental study on geysering in an open natural circulation system. J. Harbin Eng. Univ. 2016, 37, 6. [Google Scholar]
  22. Bae, B.-U.; Kim, S.; Park, Y.-S.; Kang, K.-H. Experimental investigation on condensation heat transfer for bundle tube heat exchanger of the PCCS (Passive Containment Cooling System). Ann. Nucl. Energy 2019, 139, 107285. [Google Scholar] [CrossRef]
  23. Moffat, R.J. Contributions to the theory of single-sample uncertainty analysis. J. Fluid Eng. 1982, 104, 250–260. [Google Scholar] [CrossRef]
  24. Yang, X.; Feng, Y.; Zhang, X. Average heat transfer coefficient for transient flow in aluminum foam-filled channels. Industrial heating. 2010, 39, 23–26. [Google Scholar]
  25. Bian, H.; Lu, Y.; Li, C.; Liang, T.; Ding, M. Comprehensive parameter analyses on steam-air condensation at pressures up to 1.6 MPa. Nucl. Eng. Des. 2021, 385, 111536. [Google Scholar] [CrossRef]
  26. Dehbi, A.A. Generalized correlation for steam condensation rates in the presence of air under turbulent free convection. Int. J. Heat Mass Transf. 2015, 86, 1–15. [Google Scholar] [CrossRef]
  27. Uchida, H.; Oyama, A.; Togo, Y. Evaluation of post-incident cooling systems of light-water power reactors. In Proceedings of the 3rd International Conference on Peaceful Uses of Atomic Energy, Geneva, Switzerland, 31 August–9 September 1964; pp. 93–102. [Google Scholar]
Figure 1. Schematic of the experimental facility.
Energies 15 09034 g001
Figure 2. The variation of time-average condensation HTC with initial air mass fraction.
Energies 15 09034 g002
Figure 3. The variation of time-average condensation HTC with initial containment pressure.
Energies 15 09034 g003
Figure 4. Comparison of previous correlation against experimental data.
Energies 15 09034 g004
Figure 5. Predicted values of empirical correlation under different gas-mixture pressure.
Energies 15 09034 g005
Figure 6. Predicted values of current empirical correlation under different air mass fraction.
Energies 15 09034 g006
Figure 7. Comparison of correlation against experimental data.
Energies 15 09034 g007
Figure 8. The response of the system to a sudden change in the valve opening.
Energies 15 09034 g008aEnergies 15 09034 g008b
Figure 9. The variation of outlet cooling water temperature in the heat exchanger.
Energies 15 09034 g009
Table 1. Specific experimental conditions.
Parameter.Value
Containment pressure, MPa0.2–0.6
Air mass fraction15.1–82.3%
Coolant water temperature, °C25, 60, 70, 77
Publisher’s Note: MDPI stays neutral with regard to jurisdictional claims in published maps and institutional affiliations.

