Article

Simulation Analysis of Ejector Optimization for High Mass Entrainment under the Influence of Multiple Structural Parameters

1
Huaneng Clean Energy Research Institute, Beijing 102200, China
2
State Key Laboratory of Multiphase Flow in Power Engineering, Xi’an Jiaotong University, Xi’an 710049, China
3
Xingzhi College, Zhejiang Normal University, Jinhua 321004, China
*
Author to whom correspondence should be addressed.
Energies 2022, 15(19), 7058; https://doi.org/10.3390/en15197058
Submission received: 2 September 2022 / Revised: 21 September 2022 / Accepted: 22 September 2022 / Published: 26 September 2022
(This article belongs to the Special Issue Heat and Mass Transfer of Multiphase Flow)

Abstract

:
As an energy-saving technology, the ejector is widely used in the heating, aerospace, and chemical industry. The ejector performance is closely related to its structure, so the structure of the ejector needs to be optimized. In the present study, single-factor optimization is first carried out, and the main structural parameters affecting the ejector performance are screened out. Then, the response surface method is used to analyze the combined effect of the multiple structural parameters of the ejector, find out the optimal structure, and analyze the flow field inside the ejector. This study shows that, through numerical simulation, the ejector performance obtained by the response surface method is better than that obtained by the single-factor optimization method or theoretically designed ejector, and the ejector performance is 35.4% higher than that of the theoretically designed ejector. Moreover, the optimal structure of the ejector obtained by the response surface method has high reliability, and the difference between the simulation result and the prediction result of the response surface method is 0.96%.

1. Introduction

The steam ejector is a mechanical device with a simple structure, which has the advantages of high reliability, stable operation, no moving parts, and low requirements for a suction medium. The steam ejector converts the pressure energy of the primary fluid into kinetic energy, generating entrainment force to entrain the secondary fluid, so as to obtain the steam flow that meets the industrial demand. The steam ejector can use low-grade heat energy and improve energy utilization. As an energy-saving technology, the ejector has broad application prospects.
At present, there are three main design methods of the ejector, which include the empirical coefficient method, the classical thermodynamic method, and the aerodynamic function method. The aerodynamic function method uses coefficients such as velocity coefficients to correct the losses in each flow process for more practical results. Therefore, this design method has become the main method of ejector design at present. However, the ejector performance designed by the aerodynamic function method is not so suitable for variation conditions, and the structural parameters need to be optimized.
Dong et al. [1] studied the mixing chamber length, equal-area section length, and diffuser length of the ejector, and found that the mixing chamber length has a significant impact on the ejector performance. There is an optimal value in the mixing chamber to maximize the entrainment ratio and critical back pressure. Chen et al. [2,3], Bai et al. [4], and Bauzvand et al. [5] studied the geometric structure of the ejector and found that when the ejector works under a certain thermal state, some structural parameters have an optimal value, which can maximize the entrainment capacity for the primary fluid. Yang et al. [6] studied the effect of the area ratio of the primary nozzle on the ejector performance, considering the non-equilibrium phase transition. Their result shows that with the increase of the area ratio, the flow state of the mixing chamber changes from the under-expansion state to the over-expansion state. Sun et al. [7] studied the streamline shape of the primary nozzle and found that the streamlined primary nozzle has better performance than the baseline primary nozzle under some specific operating conditions. Fu et al. [8] studied the influence of NXP and mixing chamber throat diameter on the ejector performance. The results show that under given design conditions, NXP has an optimum value that enables the steam ejector to achieve the best performance. Xue et al. [9] studied the influence of the shape of the primary nozzle on the entrainment ratio. In addition to the structural dimensions, the shape of a certain structure also has an impact on the ejector performance.
In addition to the traditional single factor optimization methods, artificial neural network optimization methods have been gradually applied recently. The artificial neural network is widely used to find complex nonlinear relationships and can learn the complex relationship between input and output [10]. Roberto et al. [11] used the artificial neural network algorithm to predict the seismic capacity of reinforced concrete. This algorithm can quickly find the best solution among a wide range of retrofitting solutions with high accuracy. Zhou et al. [12] used the artificial neural network method to quickly design and optimize the ultra-wideband and perfect absorber. Their research shows that the optimization speed of the artificial neural network is much faster than that of conventional simulation software. On the optimization of the ejector by the artificial neural network algorithm, Yongseok et al. [13] studied the NXP of two-phase ejectors using an artificial neural network model and found that there is an optimal NXP value in the double evaporator ejector cycle (DEEC) for refrigeration. The optimized NXP can improve the ejector performance and COP. The above research shows that the artificial neural network optimization method has many advantages.
However, the above structural optimization work is to optimize a certain factor at one time. This optimization method ignores the combined effect of multiple factors. Dong et al. [1] found that when the length of the mixing chamber is less than 80 mm, the length of the equal area section of the mixing chamber has no significant effect on the entrainment ratio. When the length of the mixing chamber is more than 80 mm, the length of the equal area section of the mixing chamber harms the entrainment ratio. These results show that the influence law of different factors on the ejector at different values is complicated. Although single factor optimization can effectively improve the ejector performance, it could not find out the optimal structure of the ejector. In order to explore the multi-factor interaction of the ejector structure, Wu et al. [14] used the orthogonal experimental method to optimize the ejector structure, which could effectively improve the ejector performance. However, Tong et al. [15] compared the difference between the orthogonal experimental method and response surface method in their research. The traditional orthogonal design method is a design method based on the linear mathematical model, which can find the best combination of multiple factor levels. However, orthogonal design can only analyze discrete data, which has the disadvantages of low accuracy and poor predictability. The response surface method adopts a nonlinear model, which can obtain high-precision regression equations and make a reasonable prediction to find out the optimal process conditions. Therefore, it is more reliable to optimize the ejector structure by the response surface method. The application of the response surface method is not limited to experiments. Pan et al. [16] used the response surface method to optimize the structure of mobile car machines through numerical simulation, and the optimization effect is obvious. Fu and Wu [17] also optimized the geometric structure of the cylindrical permanent magnet linear motor by using the response surface method through numerical simulation. The results show that the performance of the optimized motor has been significantly improved. Many optimization studies are using the response surface method, which shows that it is feasible to optimize structural parameters by using the response surface method through numerical simulation. Based on the application of the response surface method, Ouyang et al. [18] combined the advantages of the response surface method and artificial neural network to analyze the performance of the separator. Their result shows that the combination of these two methods can not only analyze the multivariate interaction of separator but also predict the performance of the separator quickly and accurately. This shows that the response surface method has high reliability in the study of multivariable interaction. In addition, Tayyeban and Deymi Dashtebayaz [19,20] used the Pareto solution and TOPSIS method to conduct multi-objective optimization for three indexes of energy, exergy, and system economic analysis on MSF-TVC destruction systems and thermal destruction process. This method can also find the optimal solution under a variety of evaluation indexes. For the ejector used for heating and steam supply, only the entrainment ratio is used to evaluate the performance, so the response surface method is more applicable.
Generally, the ejector designed according to the one-dimensional model can only obtain some radial structural dimensions, such as mixing tube diameter; however, other structural dimensions depend heavily on the accuracy of the empirical coefficient. Besides, the numerical method for ejector design usually obtained the optimized structural parameters by adjusting one factor at one time, but the combined effect of multiple structural parameters was ignored. Combined with the response surface method, this research provides an optimization method considering the combined effect of multiple factors for the structural parameter optimization of the ejector, solves the problem limited to single factor optimization, and has certain guiding significance for the design method of the ejector and the improvement of ejector performance.

2. Numerical Model

In this study, the steam ejector model is designed according to the one-dimensional model of Huang et al. [21]. The design parameters are the actual operation parameters of a power plant, and the working medium is steam. The pressure of the primary fluid is 4.33 MPa and the temperature is 350 °C; The pressure of the secondary fluid is 1.152 MPa and the temperature is 400 °C; The pressure at the mixed fluid outlet of the ejector is 1.3 MPa and the temperature is 366 °C, which is the pressure boundary condition setting of all simulations in this paper. The structural parameters of the preliminary design are shown in Table 1.
In this study, ANSYS Meshing is used to generate a tetrahedral mesh in the fluid domain of the ejector, and the boundary layer is generated near the wall. The numerical model is solved by fluent, and the simulated working medium is ideal water vapor. Sriveerakul et al. [22] have verified the feasibility of ideal gas simulation through experiments. The realizable k-ε viscous model is adopted, and the standard wall function is used to deal with the interaction between the steam flow and the wall. In the setting of boundary conditions, the pressure boundary conditions are selected for the inlet and outlet of each steam, and the inner wall surface is treated as non-slip and adiabatic. The steady-state solver based on pressure is selected, and the calculation format adopts the second-order upwind calculation. According to the research of Hou et al. [23], the numerical model of the steam ejector can effectively predict the ejector performance.
Figure 1 is the schematic diagram of the three-dimensional model of the steam ejector established in this study, and the structural parameters mentioned in Table 1 are reflected in this figure. The mesh division has a certain impact on the calculation results. In order to ensure the accuracy of the calculation results, the center point of the nozzle outlet section, which has a large change in pressure and velocity, is selected to test and verify the mesh independence. Table 2 lists the results of grid independence verification. It can be seen from the Table 2 that when the grid number is about 2.27 million, the relative error with the grid number of 3.76 million is small enough. Therefore, this study selects about 2.27 million grids as the grid number for numerical simulation.

3. Simulation Results and Analysis

3.1. Single Factor Optimization of Ejector Structure

The ejector performance is closely related to the structure parameters. The ejector designed by the one-dimensional model has poor operation performance, and the structure needs to be optimized in general. At present, the optimization of the ejector generally adopts the single factor optimization method, which finds the maximum value of the entrainment ratio by changing the size of a certain structural parameter. This optimization method has some defects, ignoring the interaction between various structures of the ejector. In order to study the difference between single factor optimization and response surface method optimization, this study first carries out the single factor optimization of the ejector structure and lays a foundation for the selection of the response surface method optimization parameters. The results of single factor optimization are shown in Figure 2. In this study, the single factor optimization of each important structure is carried out, and the curve of the entrainment ratio changing with the variation of each geometric structure is obtained. Finally, the single factor optimization optimal structure of the steam ejector is determined, and the optimal value of the entrainment ratio is 2.354. The structural dimensions of the ejector are shown in Table 3.

3.2. Response Surface Method Optimization of Ejector Structure

3.2.1. Response Surface Method

The response surface method is a statistical method that uses reasonable experimental design methods and obtains certain data through experiments, uses multiple quadratic regression equations to fit the functional relationship between factors and response values, seeks the optimal process parameters, and solves multivariable problems through the analysis of regression equations. The second-order fitting model of the response surface considering the cross term is as follows:
y = f ( x 1 , x 2 , , x n ) + ε
y = a 0 + i = 1 n a i x i + i = 1 n a i i x i 2 + i = 1 n j = 1 , i < j n a i j x i x j + ε
where y is the objective function to be optimized, that is, the response variable; x 1 , x 2 , , x n is the influencing factor of a certain process; ε is the systematic error; a 0 , a i , a i i , a i j is the undetermined coefficient. Formula (2) contains 1 + 2 k + k ( k 1 ) 2 parameters. For the experimental design to fit the second-order model, each factor must have at least three levels.

3.2.2. Selection of Optimization Parameters and Determination of Optimal Value Range

In this study, the central composite design of response surface method is carried out by using Design Expert. Before the optimization of the response surface method, the factorial design needs to be carried out to determine the factors for optimization. According to the single factor optimization results in Section 3.1, the structural parameters with maximum value and a great influence on the entrainment ratio in the maximum interval are selected as the optimization parameters of the response surface method, and the response value is the entrainment ratio. Table 4 shows the maximum entrainment ratio change rate of each structural parameter of the steam ejector in their maximum range. The more factors, the more test combinations need to be carried out. In order to simplify the calculation and reduce the number of tests, it is necessary to screen out the factors that have a great impact on the entrainment ratio for response surface method optimization. It can be seen from Table 4 that d1, d0, and dh have a great influence on the entrainment ratio. Therefore, d1, d0, and dh are selected for the three-level response surface method optimization. The optimized test design of the response surface method with three factors and three levels is shown in Table 5.

3.2.3. Response Surface Method Test Results and Analysis

According to the test combination of central composite design arranged by Design Expert, the response values of different structural size combinations are calculated through Fluent. The test data of the central composite design are shown in Table 6. Omitting the variance analysis results of the response surface method that has no significant impact on the entrainment ratio, as shown in Table 7, the quadratic polynomial regression is used to fit the quadratic polynomial equations of A-d1, B-d0, and C-dh for the three factors of the entrainment ratio:
Entrainment   ratio = 49.867 + 0.428 A + 1.643 B + 0.0374 C 4.352 × 10 3 A B 1.040 × 10 3 B C 1.395 × 10 3 A 2 0.0155 B 2
In Table 7, the p-Value of the model is <0.0001, indicating that the model equation is extremely significant; the p-Value of the Lack of Fit is 0.8532, less than 0.05, so the Lack of Fit is not significant, indicating that the established equation is reliable. In the first order term, the throat diameter of the mixing chamber (A) and the nozzle outlet diameter (B) have an extremely significant impact on the entrainment ratio, and the inlet diameter of the mixing chamber (C) has a significant impact on the entrainment ratio; in the quadratic term, the p-Value of factors such as AB, BC, A2, and B2 is less than 0.05, which has a significant impact on the entrainment ratio, indicating that the impact of mixing the chamber throat diameter, nozzle outlet diameter and mixing chamber inlet diameter on the entrainment ratio is not a simple linear relationship. The R2 of the model is 0.9934 and the modified adj-R2 is 0.9895, which shows that the model can reflect the variation of a 98.95% response value.
Many researchers had deeply studied the influence of structural parameters such as the throat diameter of the mixing chamber, nozzle outlet diameter, and mixing chamber inlet diameter on ejector performance. However, they only carried out a specific analysis on each structural parameter and did not combine all structural parameters. The throat diameter of the mixing chamber (A) will affect the mixing effect of the primary fluid and the secondary fluid. When the throat diameter of the mixing chamber (A) is smaller, the mixing resistance of primary fluid and secondary fluid will increase. When the throat diameter of the mixing chamber (A) is larger, the ejector operating in critical mode will change to non-critical mode, and the upstream flow field of the ejector will be affected by the outlet pressure, which will reduce the entrainment ratio.
The nozzle outlet diameter (B) will affect the Mach number of the primary fluid. When the nozzle outlet diameter (B) is smaller, the Mach number of the primary fluid is larger, and the primary fluid may leave the mixing chamber before it has fully expanded. When the nozzle outlet diameter (B) is larger, the Mach number at the primary fluid is smaller, which will reduce the shock wave strength at the nozzle outlet, increase the pressure in the low-pressure area formed by the shock wave, reduce the pressure difference between the primary fluid and the secondary fluid, and deteriorate the entrainment ratio.
The mixing chamber inlet diameter (C) will affect the Mach number of the secondary fluid and the mixing effect of the primary fluid and the secondary fluid. When the mixing chamber inlet diameter (C) is smaller, the Mach number of the secondary fluid entering the mixing chamber is larger, the static pressure is smaller, the pressure difference between the primary fluid and the secondary fluid decreases, and the steam flow resistance increases slightly. When the mixing chamber inlet diameter (C) is larger, vortices will appear on the wall of the mixing chamber, which will hinder the fluid flow and reduce the entrainment ratio. Under the condition that the inclination angle of the contraction section of the mixing chamber (α) is determined, the throat diameter of the mixing chamber (A) and the mixing chamber inlet diameter (C) jointly determine the mixing chamber length, and the mixing chamber length affects whether the jet could be fully developed. The influence of these structural parameters will be directly reflected in the variation of entrainment ratio, which also corresponds to the change in response surface diagrams (Figure 3 and Figure 4).
In order to visually observe the combined effect of multiple structural factors on the entrainment ratio, set one factor to a certain value and draw the three-dimensional response surface diagram of the other two factors. Figure 3 shows the response surface diagram of the influence of mixing chamber throat diameter (A) and nozzle outlet diameter (B) on the entrainment ratio when the mixing chamber inlet diameter (C) is the central value (level is 0). It can be seen from Figure 3 that when B = 41 mm, there is a peak value of the entrainment ratio with the increase of A; however, when B = 33 mm, the entrainment ratio increases with the increase of A. When A is at a certain value, the entrainment ratio has a peak valve with the increase of B, but the position of the peak valve changes with the value of A. Figure 4 shows the response surface diagram of the influence of nozzle outlet diameter (B) and mixing chamber inlet diameter (C) on the entrainment ratio when the mixing chamber inlet diameter (A) is the central value. As can be seen from Figure 4, when B = 33 mm, the entrainment ratio increases with the increase of C; when B = 41 mm, the entrainment ratio decreases with the increase of C.
The changing trend of the response surface diagram shows that the entrainment ratio will be affected by many structural parameters. The relationship between the entrainment ratio and structural parameters is not linear. Therefore, the ejector structure obtained by the traditional single factor optimization method is not optimal. The response surface method can take into account the interaction of multiple factors and find out the existence range of the optimal structural parameters through a regression equation from the perspective of statistics.
The structural parameters optimized by the response surface method are simulated and verified. The comparison between the optimal structure of the ejector predicted by the response surface method regression equation and the optimal structure obtained by single factor optimization is shown in Table 8. The entrainment ratio of the not-optimized ejector is calculated by a one-dimensional model, and the predicted entrainment ratio of the response surface method is calculated by the second-order regression equation. It can be seen from Table 8 that the ejector performance without optimization is poor, which is a certain gap from the predicted entrainment ratio. The entrainment ratio after single factor optimization is 2.354, which is 28.8% higher than that without optimization. The entrainment ratio optimized by the response surface method is 2.473, which is better than that of single factor optimization. Compared with single factor optimization, the entrainment ratio is increased by 5.1%. The error between the predicted entrainment ratio using the one-dimensional model and the simulated entrainment ratio is 11.4%. The error between the predicted entrainment ratio using the second-order regression equation and the simulated entrainment ratio is only 0.95%, which shows that the ejector structure optimized by the response surface method has good performance and high reliability.

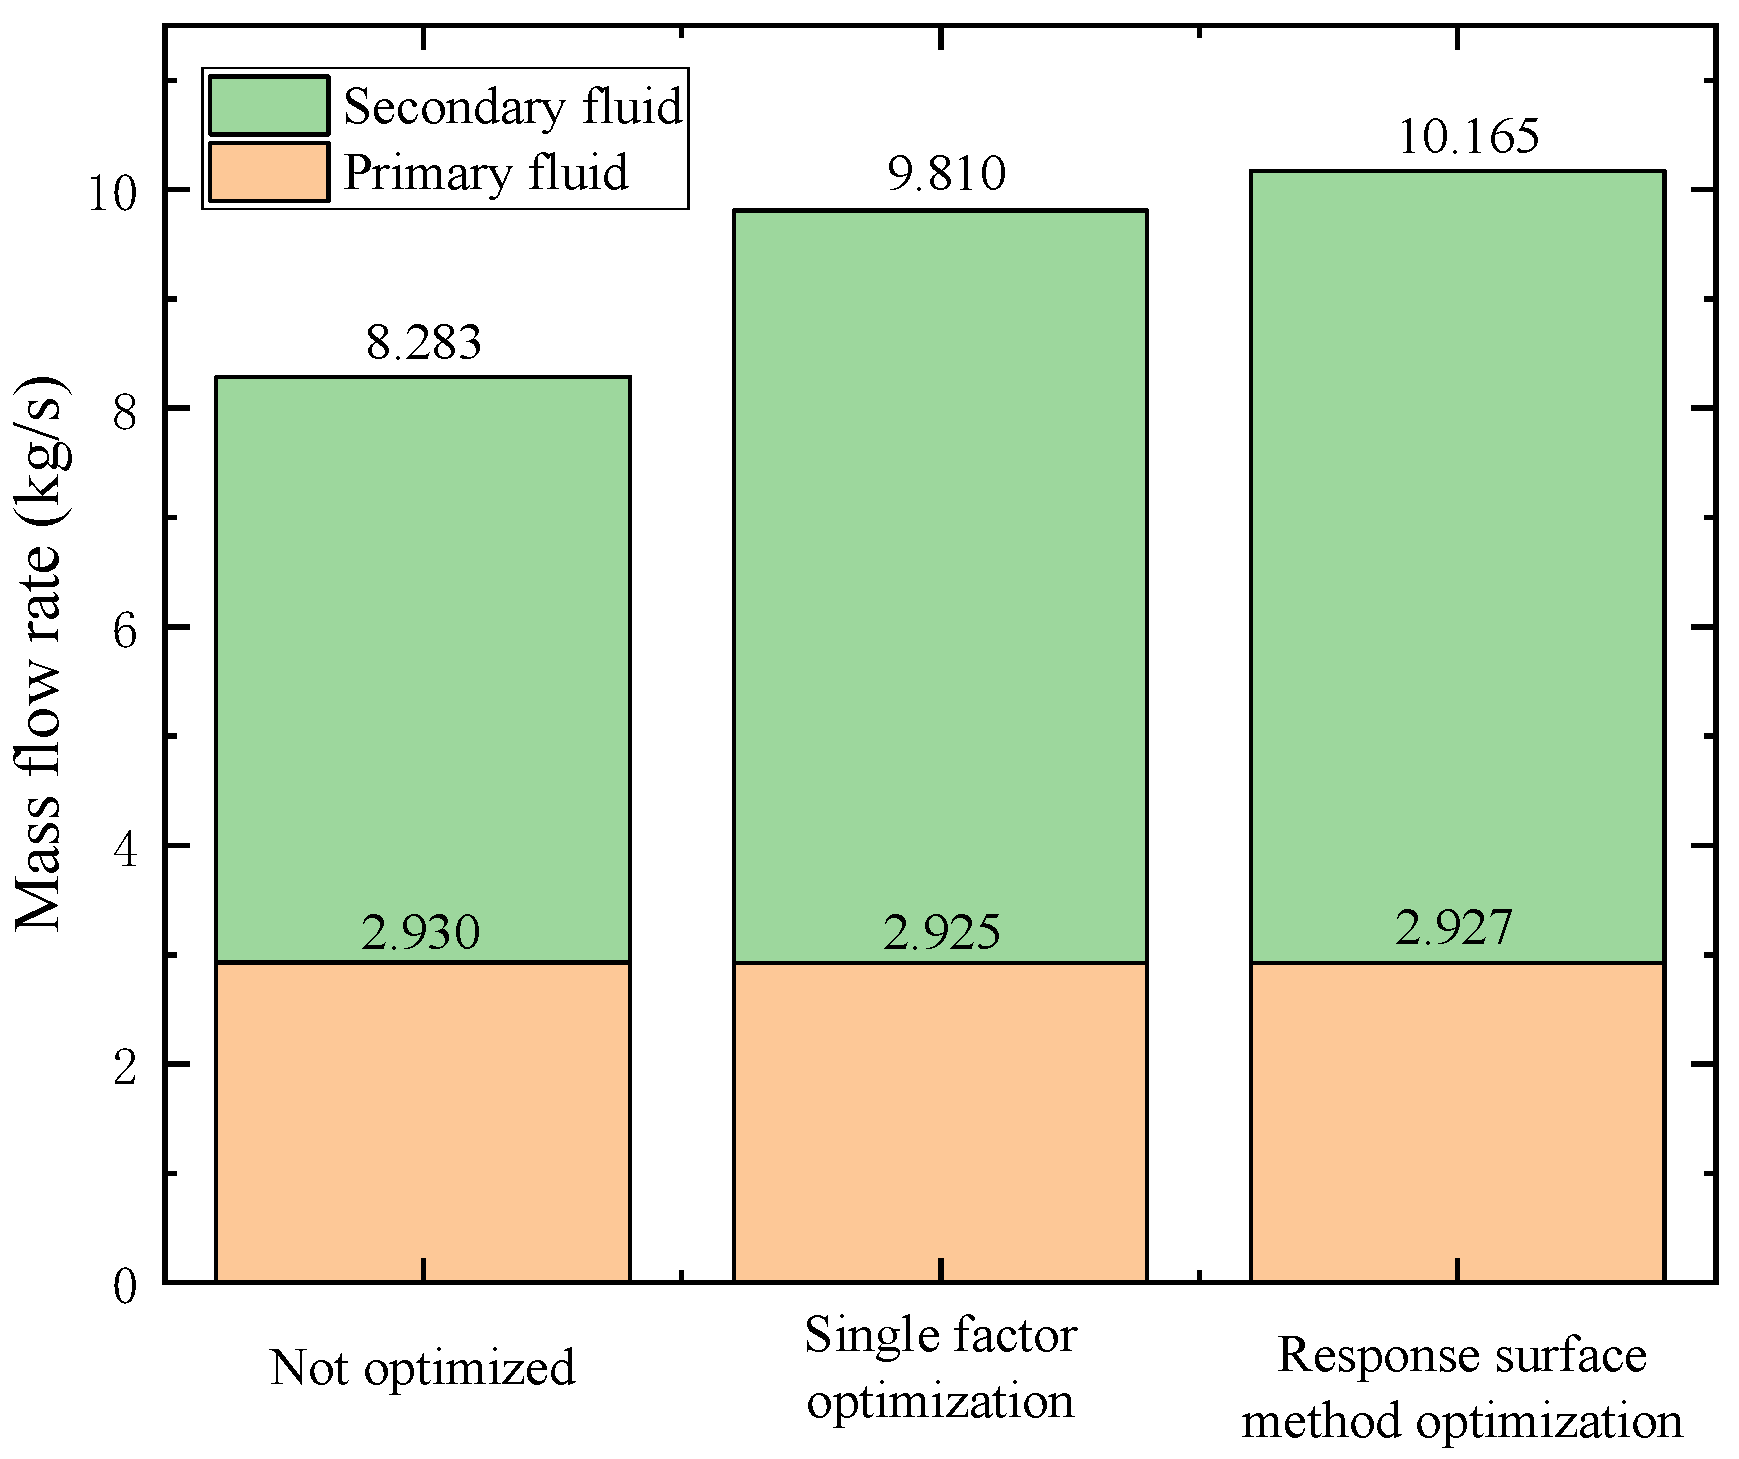
3.2.4. Flow Field Analysis of Different Optimization Methods

The internal Mach number contour of the ejector optimized by different optimization methods is shown in Figure 5. Figure 5a is the internal Mach number diagram of the theoretically designed ejector. It can be seen from Figure 5a that the Mach number of the supersonic jet from the nozzle at the inlet section of the diffuser is still greater than 1, which indicates that the high-pressure jet has not been fully mixed and developed in the throat of the mixing chamber. Compared with Figure 5b,c, the length of the mixing chamber in the initial design is short, which limits the development of the high-pressure jet and leads to the low entrainment ratio. Figure 5b shows the internal Mach number diagram of the ejector after single factor optimization. Compared with the theoretical design, the jet has been fully developed and the entrainment ratio has increased. Figure 5c shows the Mach number diagram after the optimization of the response surface method. Compared with Figure 5a,b, it can be seen that the shock wave chain after the optimization of this method is the longest. Meanwhile, the Mach number at the outlet section of the nozzle changes greatly, the shock wave intensity is large, the low-pressure fluid is easier to be entrained, and the entrainment performance can be improved.
Figure 6 shows the mass flow rate under different optimization methods. It can be seen from this figure that the mass flow rate of primary fluid is basically unchanged because the throat size of the high-pressure nozzle is not modified. Although the mass flow of primary fluid is the same, the mass flow of secondary fluid of different optimization methods is obviously different. This is because the size of the ejector structure parameters changed by different optimization methods is different. The ejector optimized by the response surface method has the largest mass flow of secondary fluid, which indicates that the ejector structure optimized by this method can enhance the entrainment capacity of the primary fluid and promote the entrainment of the secondary fluid. Therefore, the ejector optimized by the response surface method has a higher mass flow entrainment capacity.
In conclusion, the entrainment ratio optimized by the response surface method is the highest, and whether the jet is fully developed or not has a great impact on the entrainment ratio. Based on the full development of the jet, the jet expansion after the nozzle outlet section also has a certain impact on the entrainment ratio. The change in the structural parameters of the ejector will affect the variation of the flow field. The response surface method can analyze the variation of the entrainment ratio under the influence of multiple structural parameters through statistical methods, establish a second-order regression equation, and obtain the optimal solution for the structural parameters with the largest entrainment ratio.

4. Conclusions

In this study, numerical simulation and the response surface method were used to research the combined effect of multiple structural parameters on ejector performance. First, a one-dimensional model is used to design the initial structural parameters of the ejector. Then, the dimensions of each part of the ejector are obtained by using the single-factor optimization method. Finally, the response surface method is used to analyze the combined effect of multiple structural parameters on the entrainment ratio. The main results are as follows:
(1)
The entrainment ratio of the ejector optimized by the response surface method is 35.4% higher than that of the initial structure designed by the one-dimensional model and 5.1% higher than that of the ejector optimized by the single-factor optimization method. The ejector optimized by the response surface method has better performance.
(2)
The error between the predicted entrainment ratio using the one-dimensional model and the simulated entrainment ratio is 11.4%. Compared with the simulated entrainment ratio, the error of the predicted entrainment ratio using the second-order regression equation is 0.95%. The prediction equation of entrainment rate obtained by the response surface method is more reliable.
(3)
The structural dimensions of the ejector will affect each other. The change of structural parameters will cause variation in the flow field, and the variation of the flow field will affect the entrainment ratio of the ejector. The response surface method can obtain the optimal structure size through the combined effect of multiple structural parameters on the entrainment ratio.
In the heat and steam supply project of the power plant, the increase of the entrainment ratio can reduce the consumption of high-temperature and high-pressure fluid, reduce the coal consumption rate of the thermal power plant, and also improve the utilization rate of the exhaust steam from the turbine unit, so as to achieve the purpose of energy conservation.

Author Contributions

Conceptualization, J.Z. and W.C.; Data curation, Y.H. and Z.T.; Formal analysis, H.J.; Funding acquisition, J.Z. and W.C.; Investigation, Y.H. and Z.T.; Methodology, W.C.; Resources, W.C.; Software, Y.H.; Supervision, W.C. All authors have read and agreed to the published version of the manuscript.

Funding

This research was funded by the Science and Technology Project of China Huaneng Group [HNKJ21-H69], National Natural Science Foundation of China [No. 51876166], and Key R&D Program of Shaanxi Province [No. 2021GXLH-Z-002].

Conflicts of Interest

The authors declare no conflict of interest.

References

  1. Dong, J.; Hu, Q.; Yu, M.; Han, Z.; Cui, W.; Liang, D.; Ma, H.; Pan, X. Numerical investigation on the influence of mixing chamber length on steam ejector performance. Appl. Therm. Eng. 2020, 174, 115204. [Google Scholar] [CrossRef]
  2. Chen, W.; Chong, D.; Yan, J.; Liu, J. The numerical analysis of the effect of geometrical factors on natural gas ejector performance. Appl. Therm. Eng. 2013, 59, 21–29. [Google Scholar] [CrossRef]
  3. Chen, W.; Chen, H.; Shi, C.; Wang, Y.; Chong, D.; Yan, J. Experimental investigation of influences of primary nozzle exit position on ejector performance. J. Univ. Chin. Acad. Sci. 2016, 33, 253–257. [Google Scholar]
  4. Bai, T.; Xie, H.; Liu, S.; Yan, G.; Yu, J. Experimental investigation on the influence of ejector geometry on the pull-down performance of an ejector-enhanced auto-cascade low-temperature freezerÉtude expérimentale de l’influence de la géométrie de l’éjecteur sur la performance de mise en régime d’un congélateur basse température en auto-cascade avec éjecteur amélioré. Int. J. Refrig. 2021, 131, 41–50. [Google Scholar]
  5. Bauzvand, A.; Tavousi, E.; Noghrehabadi, A.; Behbahani-Nejad, M. Study of a novel inlet geometry for ejectors. Int. J. Refrig. 2022, 139, 113–127. [Google Scholar] [CrossRef]
  6. Yang, Y.; Karvounis, N.; Walther, J.H.; Ding, H.; Wen, C. Effect of area ratio of the primary nozzle on steam ejector performance considering nonequilibrium condensations. Energy 2021, 237, 121483. [Google Scholar] [CrossRef]
  7. Sun, W.; Ma, X.; Zhang, Y.; Jia, L.; Xue, H. Performance analysis and optimization of a steam ejector through streamlining of the primary nozzle. Case Stud. Therm. Eng. 2021, 27, 101356. [Google Scholar] [CrossRef]
  8. Fu, W.; Liu, Z.; Li, Y.; Wu, H.; Tang, Y. Numerical study for the influences of primary steam nozzle distance and mixing chamber throat diameter on steam ejector performance. Int. J. Therm. Sci. 2018, 132, 509–516. [Google Scholar] [CrossRef]
  9. Xue, K.; Li, K.; Chen, W.; Chong, D.; Yan, J. Numerical investigation on the performance of different primary nozzle structures in the supersonic ejector. Energy Procedia 2017, 105, 4997–5004. [Google Scholar] [CrossRef]
  10. Tu, J.V. Advantages and disadvantages of using artificial neural networks versus logistic regression for predicting medical outcomes. J. Clin. Epidemiol. 1996, 49, 1225–1231. [Google Scholar] [CrossRef]
  11. Falcone, R.; Ciaramella, A.; Carrabs, F.; Strisciuglio, N.; Martinelli, E. Artificial neural network for technical feasibility prediction of seismic retrofitting in existing RC structures. Structures 2022, 41, 1220–1234. [Google Scholar] [CrossRef]
  12. Zhou, S.; Qiu, J.; Zhang, C.; Guo, Y.; Pan, Q.; Zhou, Q.; Shuai, Y. Fast design and optimization method for an ultra-wideband perfect absorber based on artificial neural network acceleration. Int. J. Therm. Sci. 2022, 179, 107680. [Google Scholar] [CrossRef]
  13. Jeon, Y.; Lee, D.; Cho, H. Optimization of motive nozzle position in a modified two-phase ejector expansion household refrigeration cycle using an artificial neural network. Energy Rep. 2022, 8, 1114–1123. [Google Scholar] [CrossRef]
  14. Wu, Y.; Zhao, H.; Zhang, C.; Wang, L.; Han, J. Optimization analysis of structure parameters of steam ejector based on CFD and orthogonal test. Energy 2018, 151, 79–93. [Google Scholar] [CrossRef]
  15. Tong, X.; Wang, Y.; Gao, R.; Wang, W. Optimization of extraction conditions of total alkaloids from Lasiosphaera fenzlii by a combination of orthogonal design with response surface method. Pharm. Biotechnol. 2013, 20, 245–249. [Google Scholar]
  16. Pan, Y.; Yu, L.; Zhang, Z.; Han, L. Research on lightweight design of mobile car machine based on response surface method. Comput. Simul. 2020, 37, 91–95. [Google Scholar]
  17. Fu, H.; Wu, R. Optimization of thrust characteristics of tubular permanent magnet linear motor based on response surface method. Small Spec. Electr. Mach. 2022, 50, 31–35. [Google Scholar]
  18. Ouyang, S.; Xiong, Z.; Zhao, J.; Li, Z. Separator performance modeling and analysis using artificial neural network and response surface method. Ann. Nucl. Energy 2022, 174, 109139. [Google Scholar] [CrossRef]
  19. Tayyeban, E.; Deymi-Dashtebayaz, M.; Dadpour, D. Multi objective optimization of MSF and MSF-TVC desalination systems with using the surplus low-pressure steam (an energy, exergy and economic analysis). Comput. Chem. Eng. 2022, 160, 107708. [Google Scholar] [CrossRef]
  20. Deymi-Dashtebayaz, M.; Tayyeban, E. Multi objective optimization of using the surplus low pressure steam from natural gas refinery in the thermal desalination process. J. Clean. Prod. 2019, 238, 117945. [Google Scholar] [CrossRef]
  21. Huang, B.J.; Chang, J.M.; Wang, C.P.; Petrenko, V.A. A 1-D analysis of ejector performance. Int. J. Refrig. 1999, 22, 354–364. [Google Scholar] [CrossRef]
  22. Sriveerakul, T.; Aphornratana, S.; Chunnanond, K. Performance prediction of steam ejector using computational fluid dynamics: Part 1. Validation of the CFD results. Int. J. Therm. Sci. 2006, 46, 812–822. [Google Scholar] [CrossRef]
  23. Hou, Y.; Chen, F.; Zhang, S.; Chen, W.; Zheng, J.; Chong, D.; Yan, J. Numerical simulation study on the influence of primary nozzle deviation on the steam ejector performance. Int. J. Therm. Sci. 2022, 179, 107633. [Google Scholar] [CrossRef]
Figure 1. Structural diagram of the steam ejector.
Energies 15 07058 g001
Figure 2. Variation curve of entrainment ratio with each structural size of the ejector.
Energies 15 07058 g002
Figure 3. Response surface diagram of the influence of A and B on the entrainment ratio.
Energies 15 07058 g003
Figure 4. Response surface diagram of the influence of B and C on the entrainment ratio.
Energies 15 07058 g004
Figure 5. Mach number contour inside the ejector.
Energies 15 07058 g005
Figure 6. Fluid mass flow rate under different optimization methods.
Energies 15 07058 g006
Table 1. Ejector geometric parameters.
Structure NameValue
Nozzle inlet diameter (di)48 mm
Nozzle throat diameter (dt)25.96 mm
Nozzle throat length (lt)5 mm
Nozzle outlet diameter (d0)35 mm
Mixing chamber inlet diameter (dh)160 mm
Inclination angle of contraction section of mixing chamber (α)18°
Throat diameter of mixing chamber (d1)80.5 mm
Throat length of mixing chamber (l1)400 mm
Diffuser outlet diameter (dc)161 mm
Diffuser length (lc)700 mm
Table 2. Verification of grid independence of nozzle outlet section center.
Number of GridsPressure
(Pa)
Absolute Value of Relative Error
(%)
Velocity
(m/s)
Absolute Value of Relative Error
(%)
361,449590,477-918.053-
514,450601,9201.93914.0740.43
820,227591,4191.74917.090.33
1,545,968586,7480.79918.9820.21
2,270,250595,8741.56915.0520.43
3,768,720597,2520.23914.450.07
Table 3. Final geometric parameters of the ejector optimized by the single factor.
ParameterValueParameterValue
di48 mmdc177 mm
dt25.96 mmlt5 mm
d037 mmα18°
dh160 mml1720 mm
d190 mmlc700 mm
Table 4. Maximum entrainment ratio interval and maximum entrainment ratio change rate in the interval of ejector structure.
ParameterMaximum Interval [a, b]Maximum Entrainment Ratio Change Rate
ab
d184 m96 mm10.7%
d033 mm41 mm13.8%
dh140 mm180 mm15.7%
α14°18°3.0%
l1640 mm800 mm1.2%
dc173 mm181 mm1.0%
lc800 mm1000 mm0.2%
Table 5. Response surface method test design of three factors and three levels.
LevelFactor
A-d1B-d0C-dh
−184 mm33 mm140 mm
090 mm37 mm160 mm
196 mm41 mm180 mm
Table 6. Test results of central composite design.
Serial NumberFactorResponse
(Entrainment Ratio)
A-d1B-d0C-dh
10002.2673
21002.3451
30002.2676
40002.2832
5−1002.1107
61−112.4804
70002.2853
8−1111.6401
91111.6233
1000−12.3189
110012.2829
120002.2135
130101.7905
141−1−12.3531
150−102.2702
16−11−11.8657
1711−11.8172
18−1−112.0909
190002.3085
20−1−1−11.9723
Table 7. Variance analysis of response surface quadratic model of the ejector.
SourceSum of SquaresdfMean SquareF Valvep ValveSignificance
Model1.2270.17257.88<0.0001**
A-d10.08810.088130.56<0.0001**
B-d00.5910.59873.70<0.0001**
dh4.393 × 10−314.393 × 10−36.500.0255*
AB0.08710.087129.13<0.0001**
BC0.05510.05581.88<0.0001**
A28.076 × 10−318.076 × 10−311.950.0047**
B20.2010.20290.69<0.0001**
Residual8.111 × 10−3126.759 × 10−4
Lack of Fit3.020 × 10−374.314 × 10−40.420.8532
Pure Error5.091 × 10−351.018 × 10⁻³
Cor Total1.2319
Note: * indicates that p < 0.05 is significant, ** indicates that p < 0.01 is extremely significant.
Table 8. Comparison of the three main influencing factors of the ejector under different optimization methods.
TypeThroat Diameter of Mixing Chamber (mm)Nozzle Outlet Diameter (mm)Mixing Chamber Inlet Diameter (mm)Entrainment Ratio Predicted by One-Dimensional Model [19]Entrainment Ratio Predicted by the Second-Order Regression EquationSimulated Entrainment Ratio
Not optimized80.5291602.036-1.827
Single factor optimization90371602.297-2.354
Response surface method optimization9633.581802.6262.4972.473
Publisher’s Note: MDPI stays neutral with regard to jurisdictional claims in published maps and institutional affiliations.

