

How Dependent Are European Power Systems and Economies on Natural Gas?—A Macroeconomic Optimization for Security of Electricity Supply
 , , ,
, , ,
Abstract
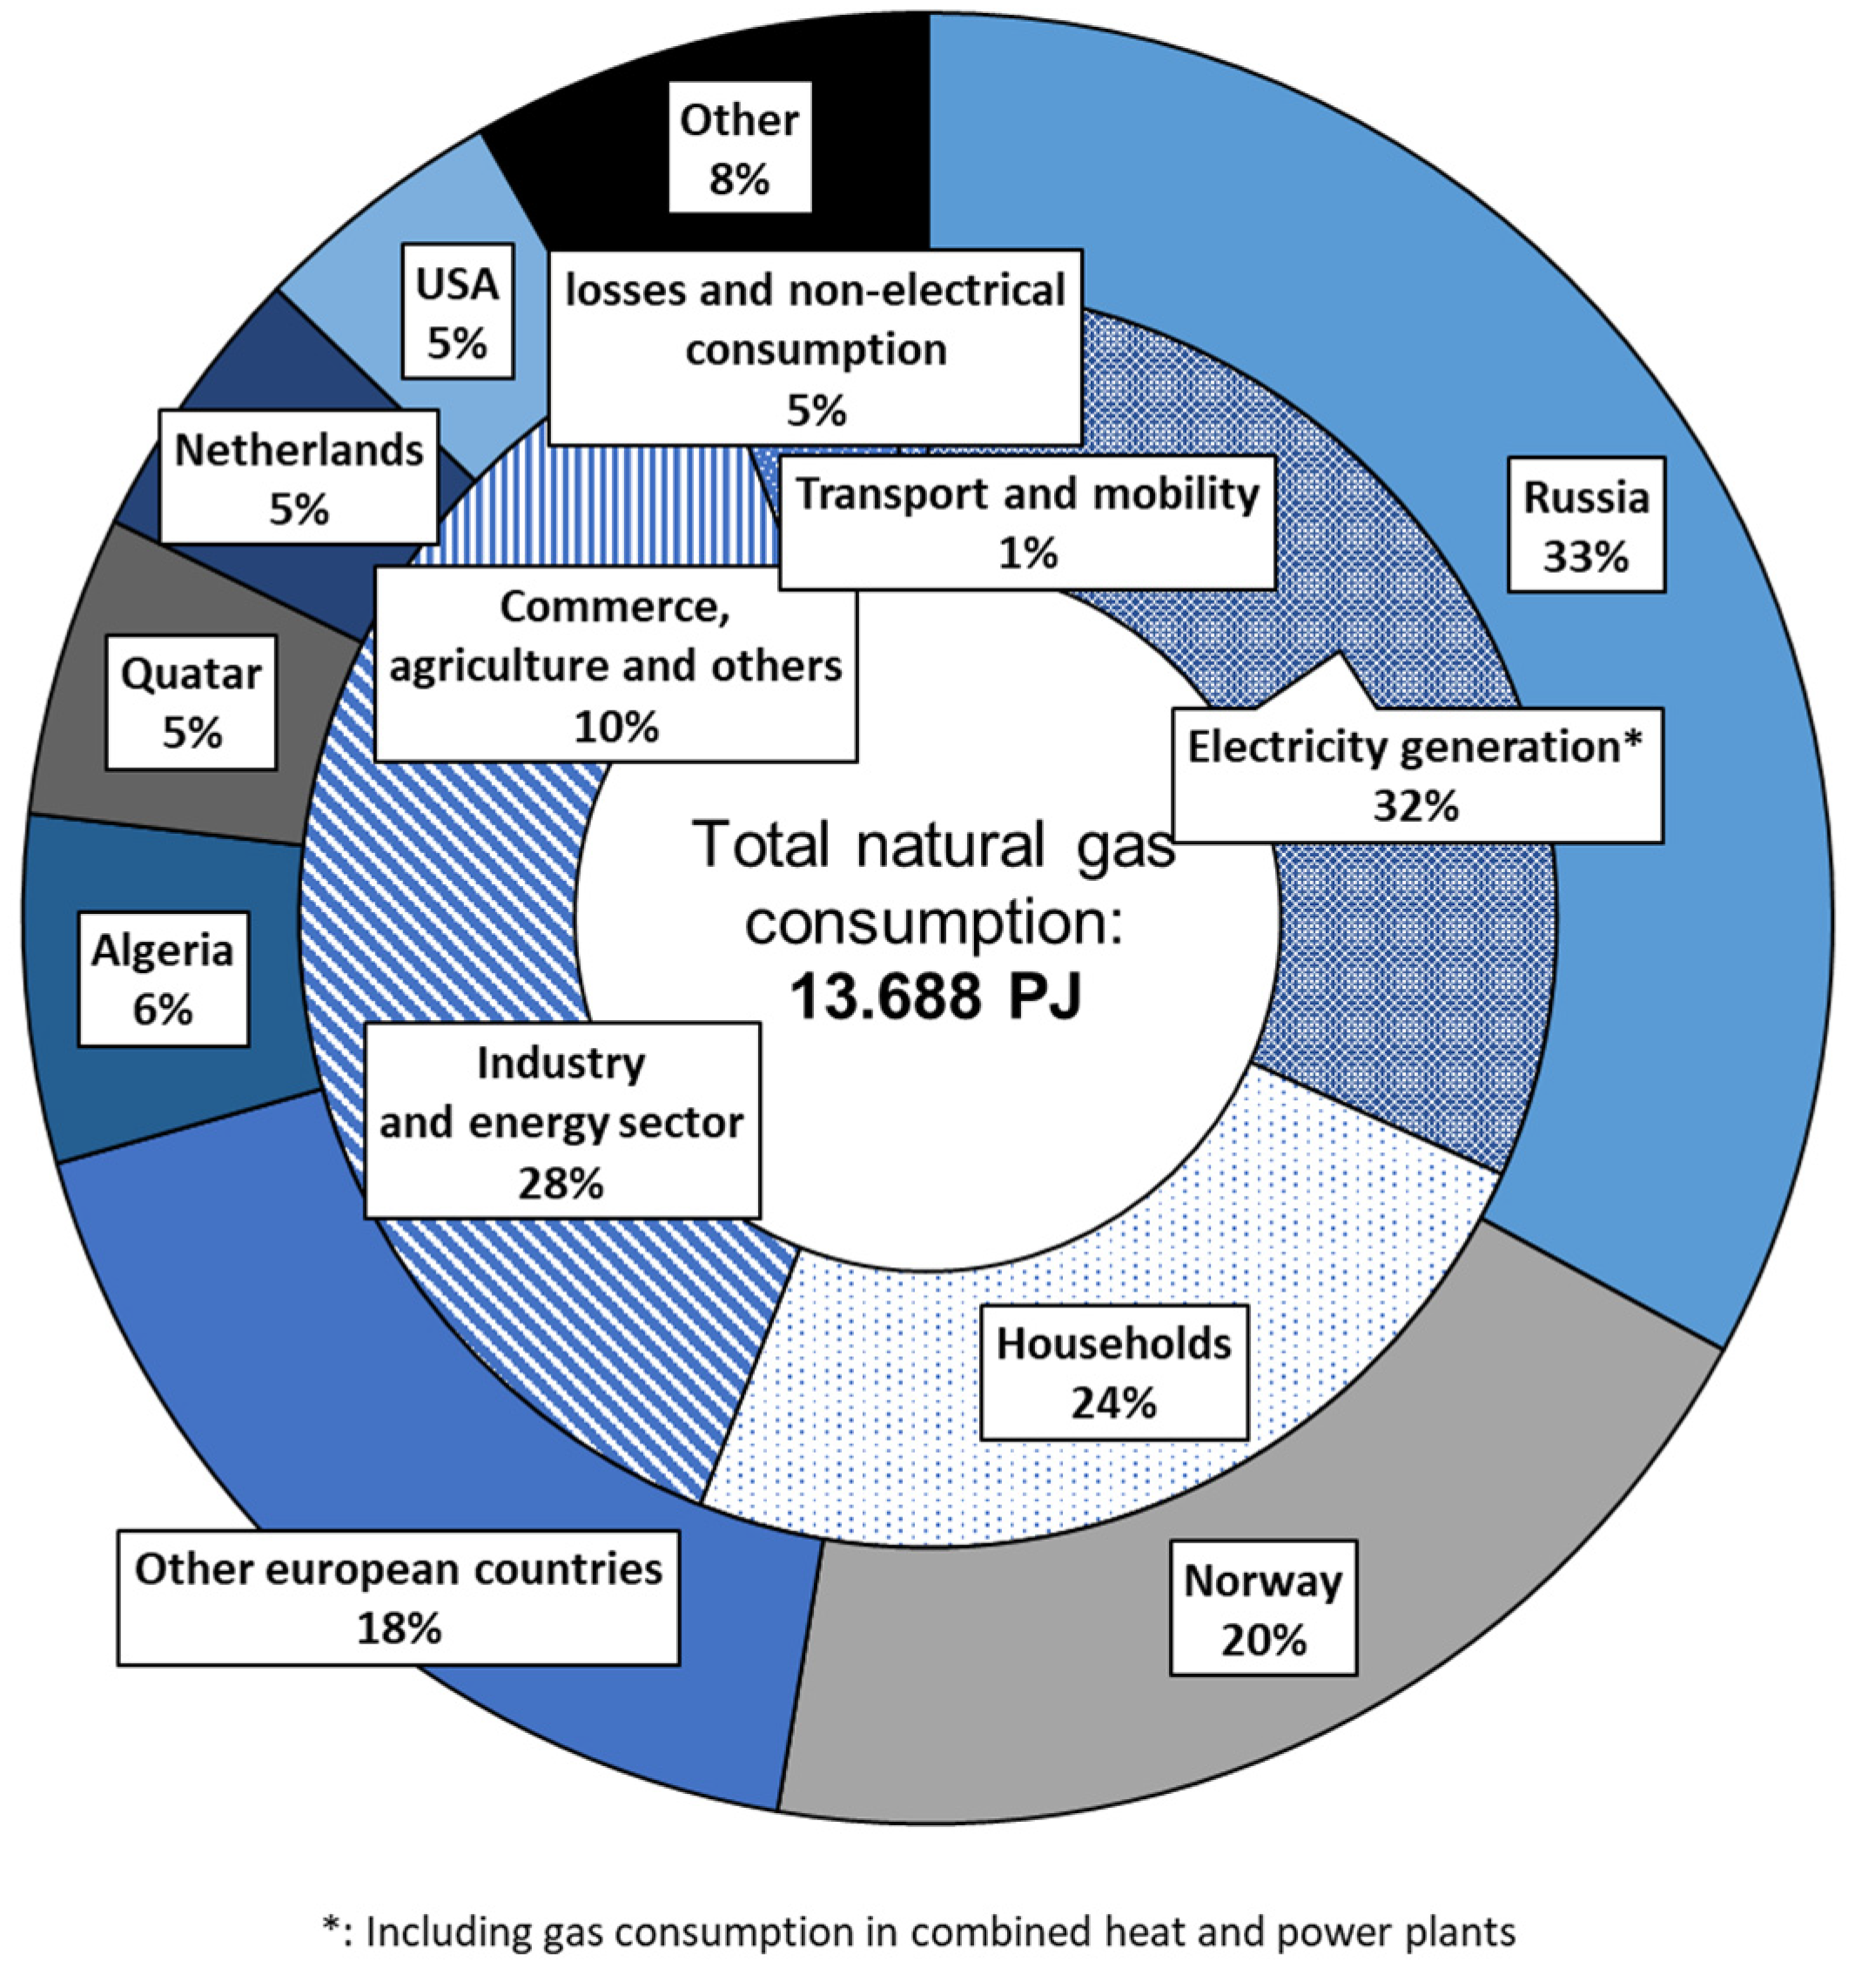
1. Introduction
2. Materials and Methods
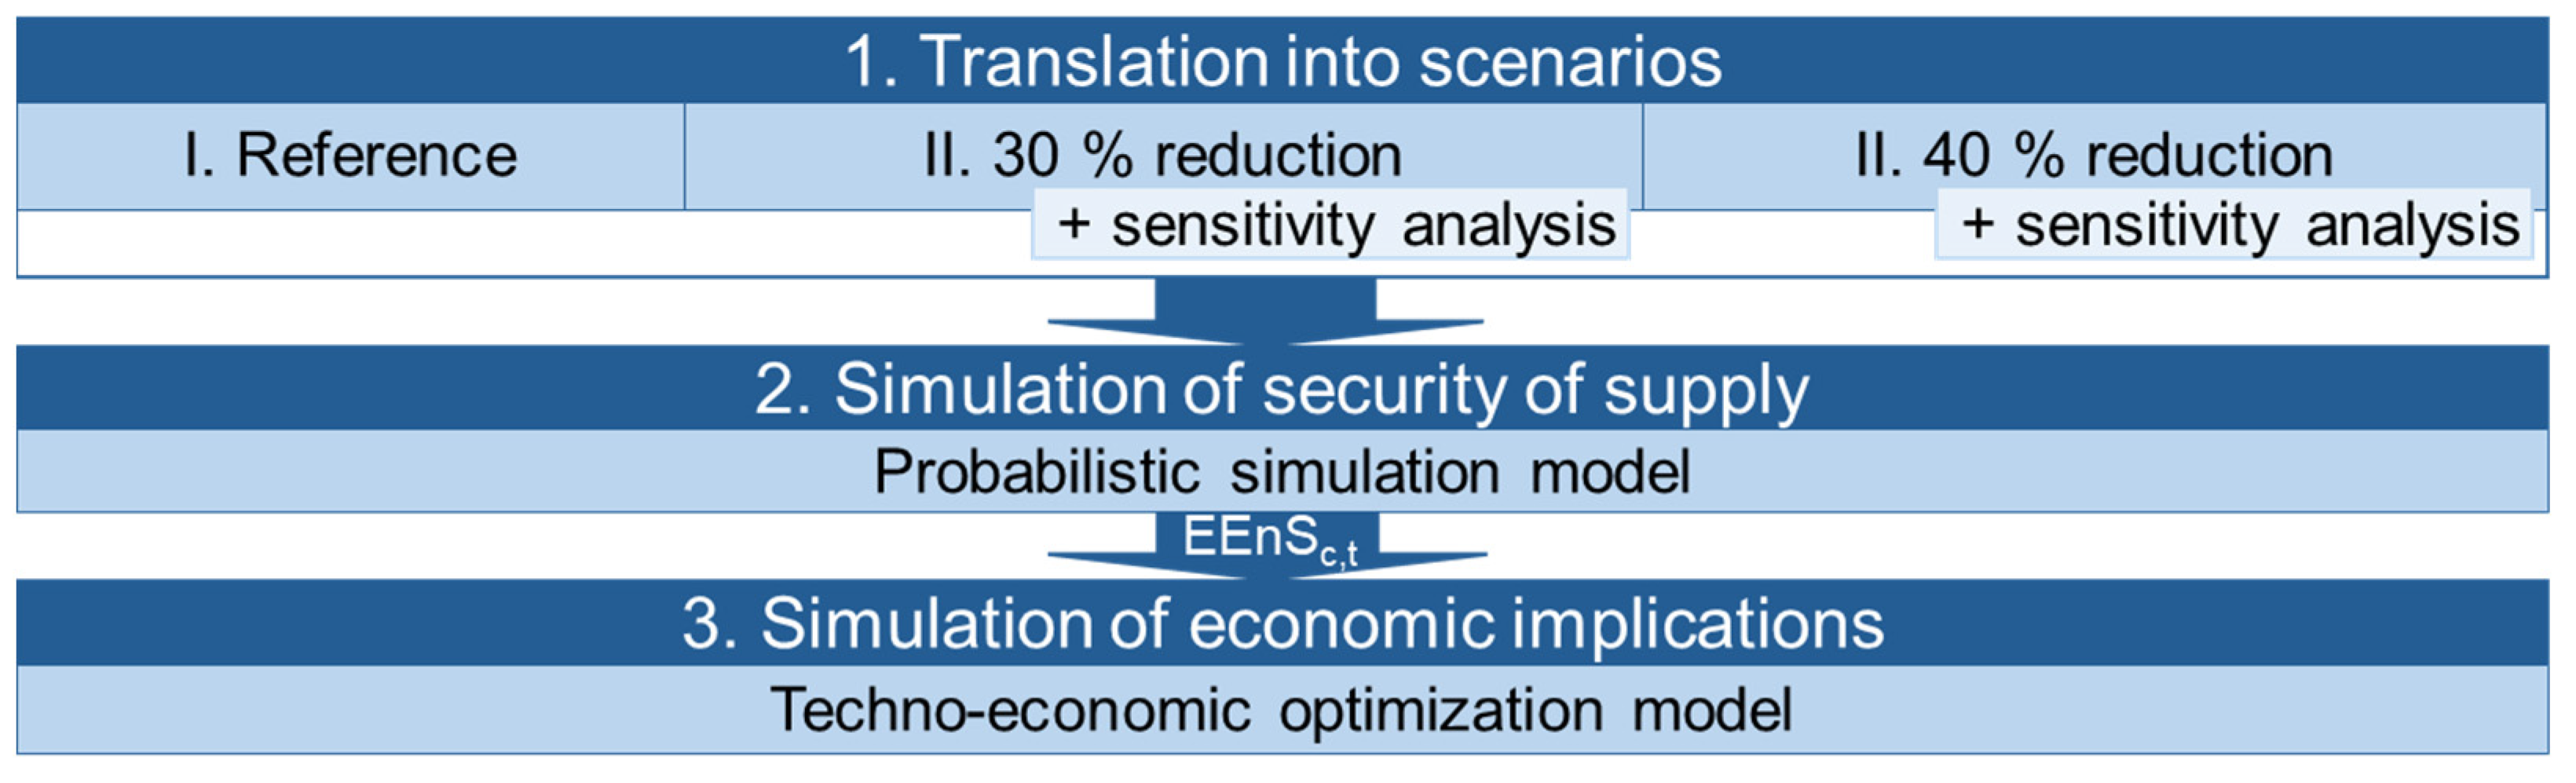
2.1. Step 1: Translation into Scenarios
- ▪
- Can Russian natural gas be substituted by other natural gas supplies or even other energy sources? When will these substitutes be available and what costs would be associated with them?
- ▪
- How do natural gas and electricity prices develop in relation to other energy prices and CO2 taxes?
- ▪
- How do sectors outside the power system (e.g., heat and industry) react to a shortage and increase in the price of natural gas supplies? Which sectors would have regulatory or economic priority in the supply of natural gas?
- ▪
- How will natural gas storage levels develop? How will natural gas storage facilities be operated in the near future?
- ▪
- How much renewable energy will be fed into the power grids in the next few years? What additional capacity can we expect? What types of weather years will we have?
- ▪
- What will the future power plant mix look like? Will previously planned power plant decommissioning be postponed?
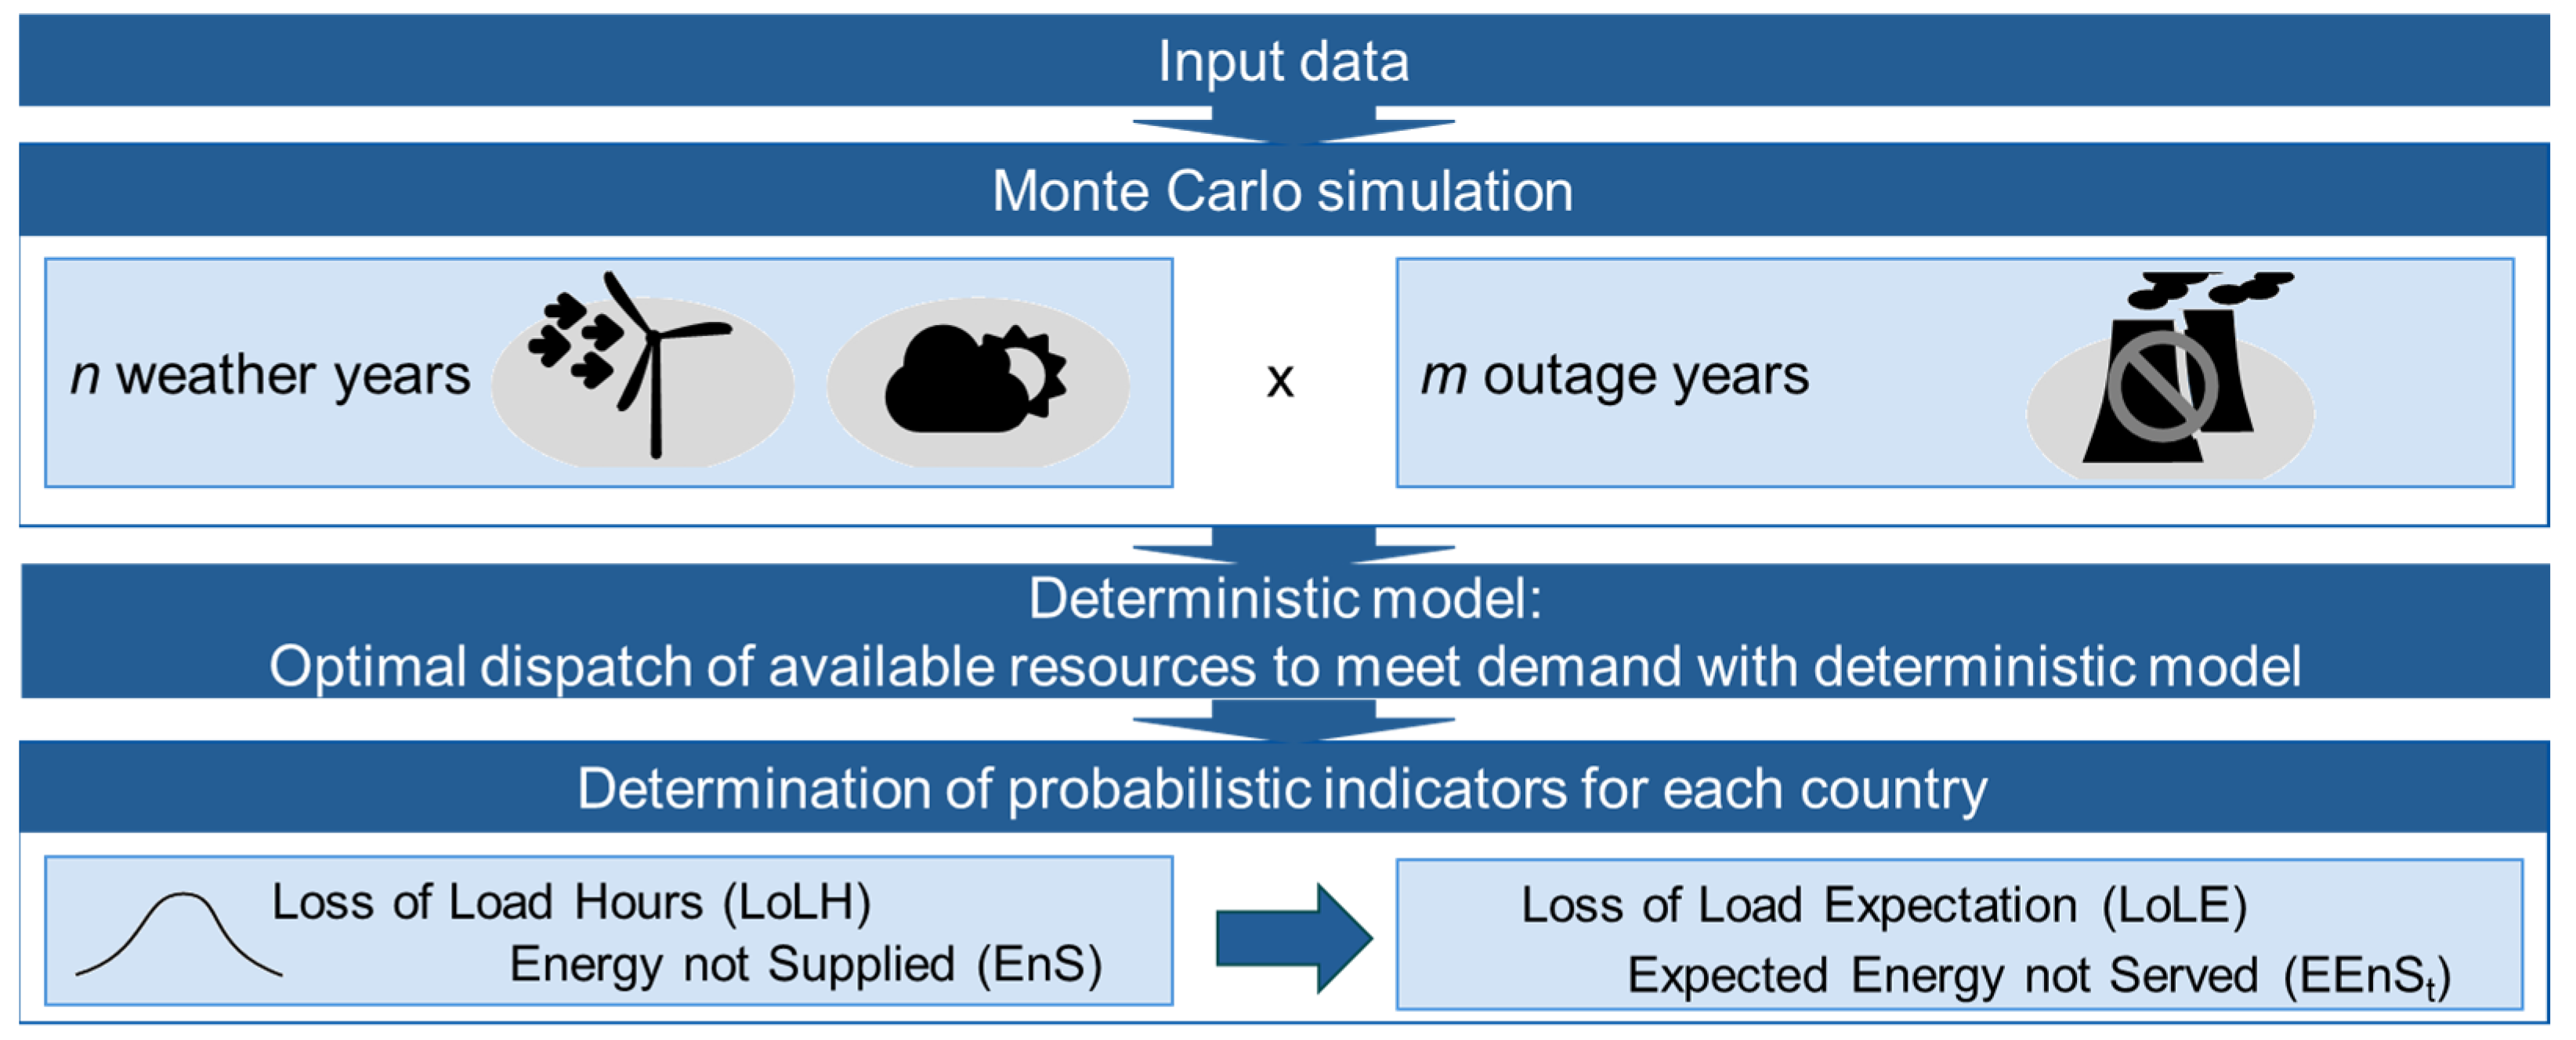
2.2. Step 2: Security of Supply
- -
- Dispatch of power plants as well as storage units (especially hydraulic storage and pumped storage power plants)
- -
- Curtailment of generation from renewable energy sources
- -
- Electricity exchanges between coupled market areas
- -
- Demand flexibility (load shifting and/or load shedding)
- -
- Energy not served
- -
- Cover of demand per market area
- -
- Limited availability of power plants and storage units
- -
- Mandatory dispatch for combined heat and power (CHP) power plants
- -
- Continuity of storage levels
- -
- Transmission capacity restrictions for electricity exchanges (NTC or FBMC)
- -
- Restrictions of flexibility potentials on the demand side
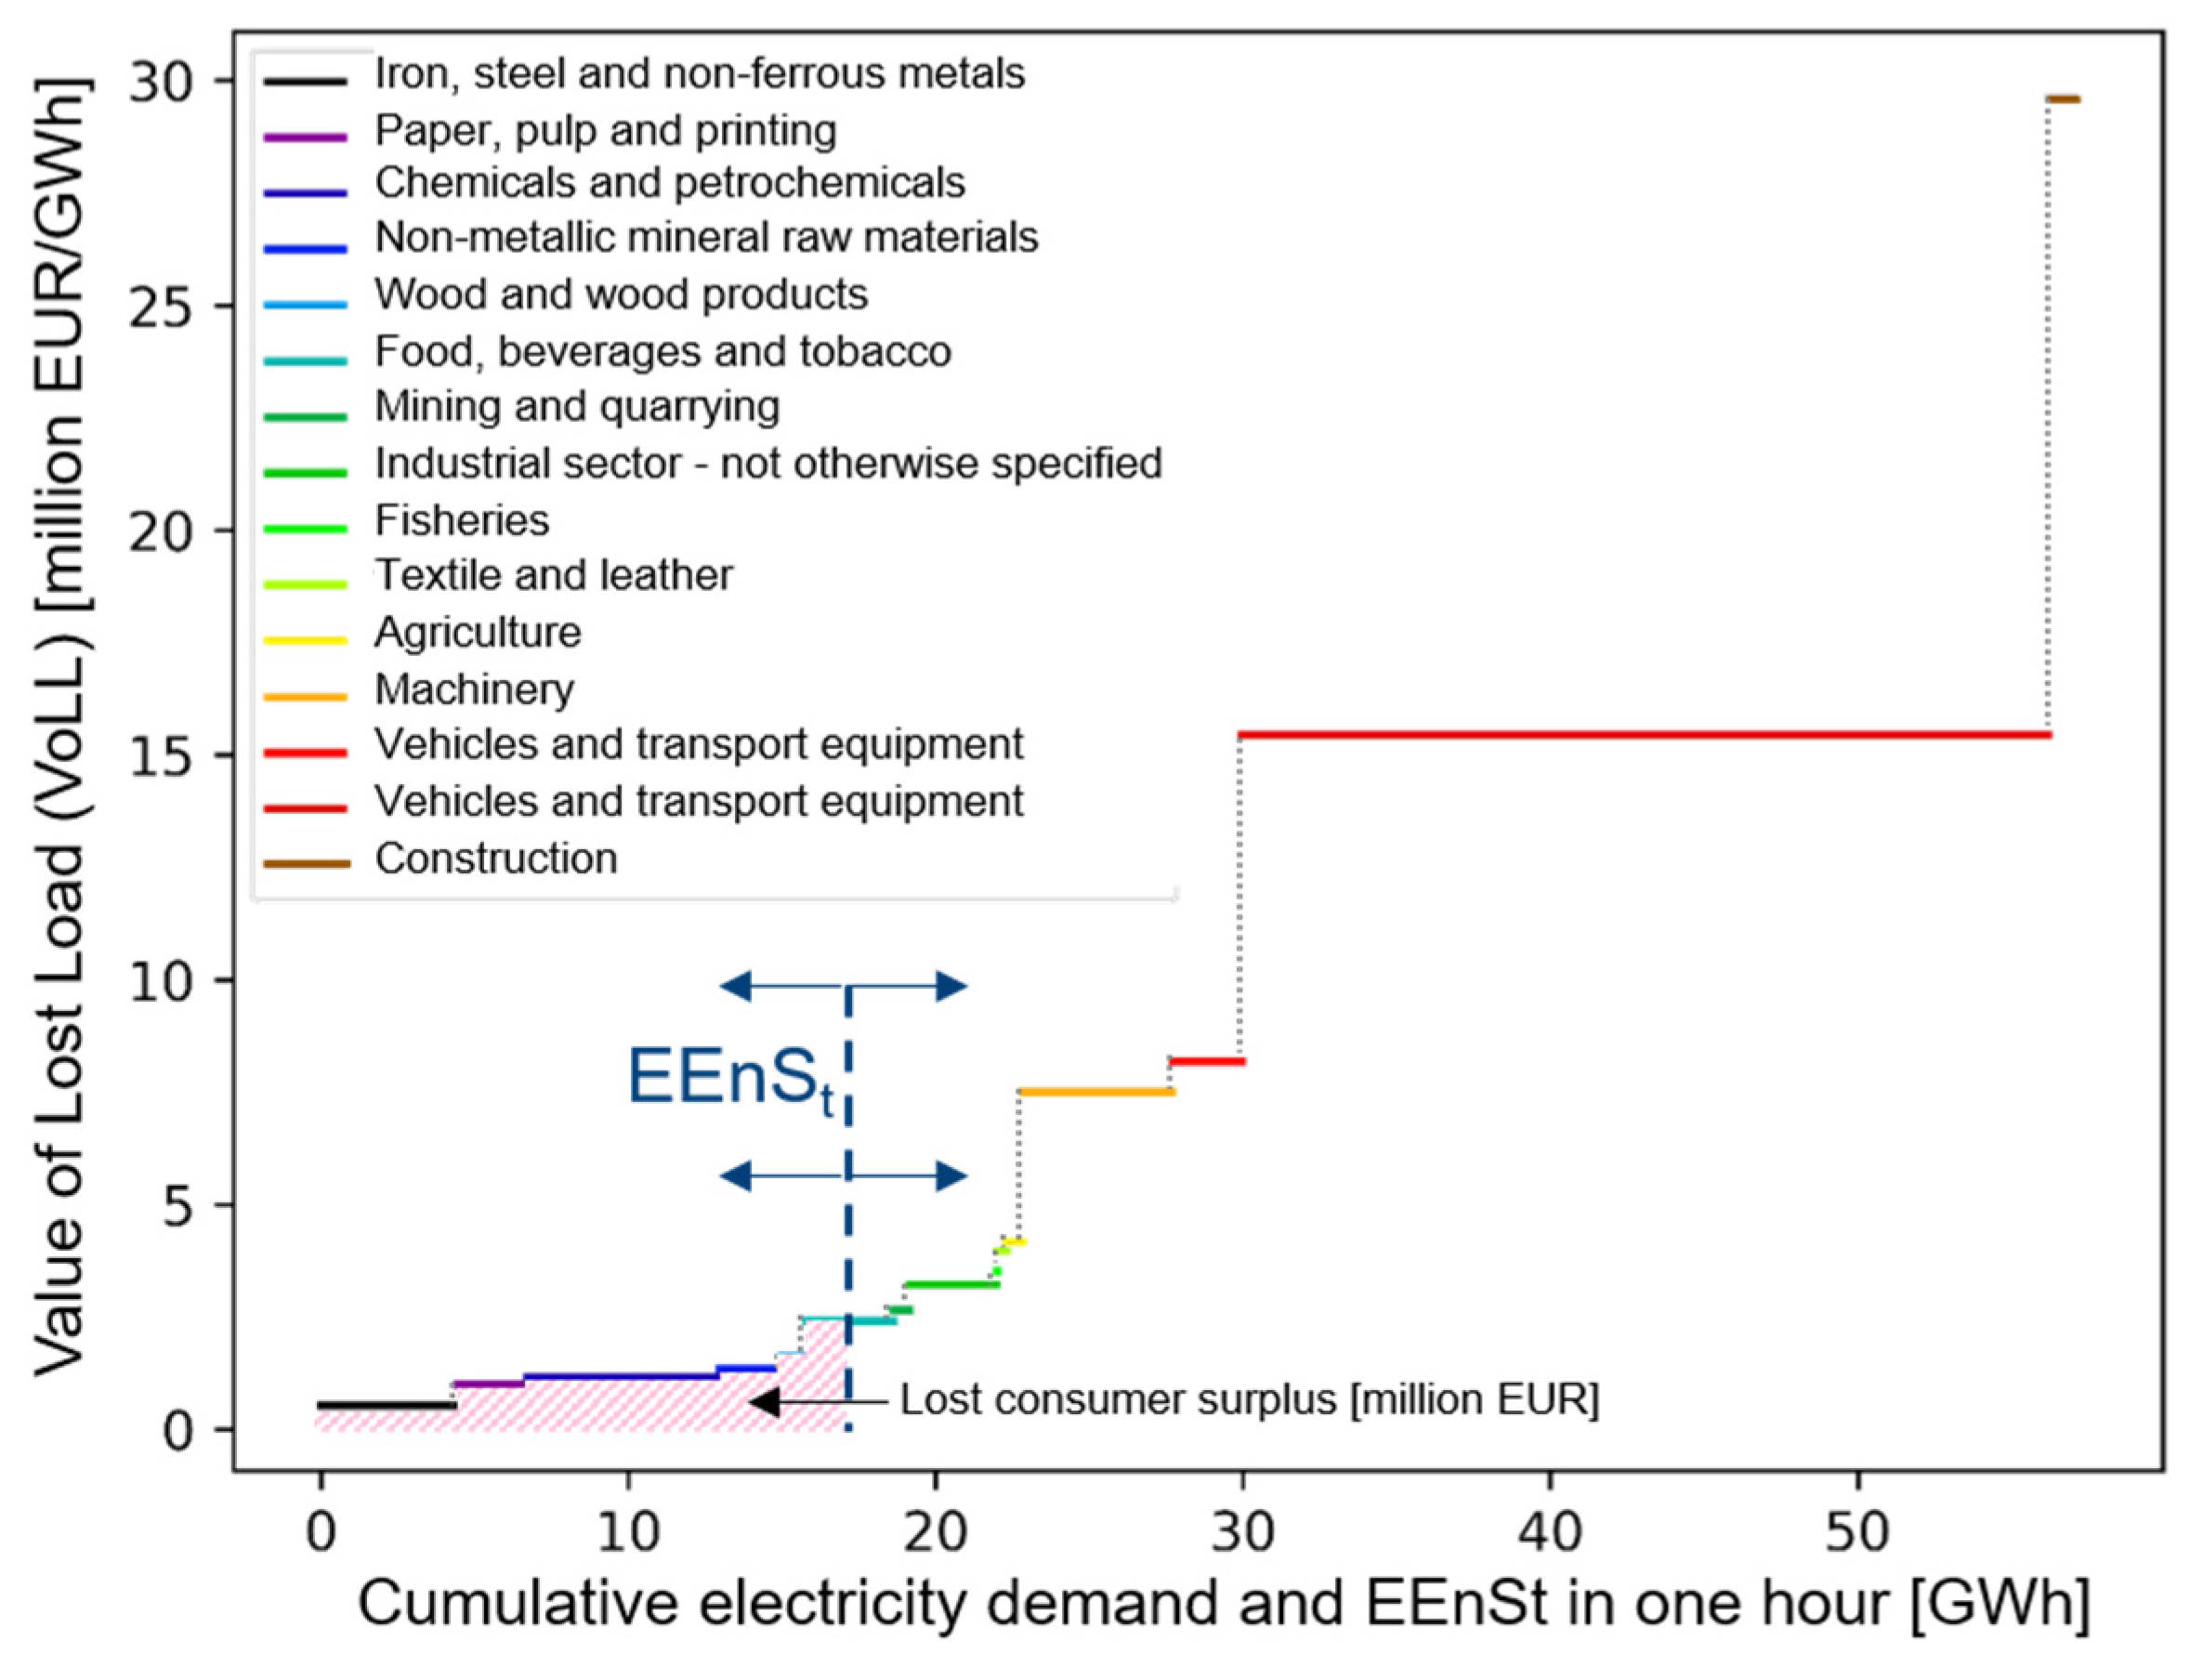
2.3. Step 3: Economic Impact
3. Results
3.1. Reference and Reduction Scenarios
3.2. Sensitivity Analyses on the Impact of Delayed Power Plant Shutdowns
4. Discussion and Conclusions
- Effects of a solidary coordinated natural gas distribution in Europe: A solidary-based coordinated distribution of the total natural gas available for power generation in Europe could be an effective means to avoid the current limited cross-border power capacities leading to increased national congestions and very high value-added losses in individual countries. Especially for countries with high dependencies on natural gas, increasing the volume of imports under existing trade agreements or creating new import opportunities to these countries could reduce their economic costs.
- Necessity of coordinating reductions in the power plant fleet at the European level: The results of the sensitivity studies show that a joint delay of planned power plant decommissioning is in principle an effective measure to increase the security of the electricity supply in the event of reduced natural gas volumes. However, in view of the recent EU sanctions on Russian coal, the availability of increasing imports of hard coal from other exporting countries would have to be urgently examined. In particular, ecological effects from the continued operation of emission-intensive lignite and hard coal-fired power plants would also have to be taken into account.
- Coordination of natural gas consumption between the electricity sector and other sectors: Reducing natural gas consumption, especially in the heat and industrial sectors, could increase the amount of natural gas available for power generation in the event of supply shortages, thus supporting the security of the electricity supply.
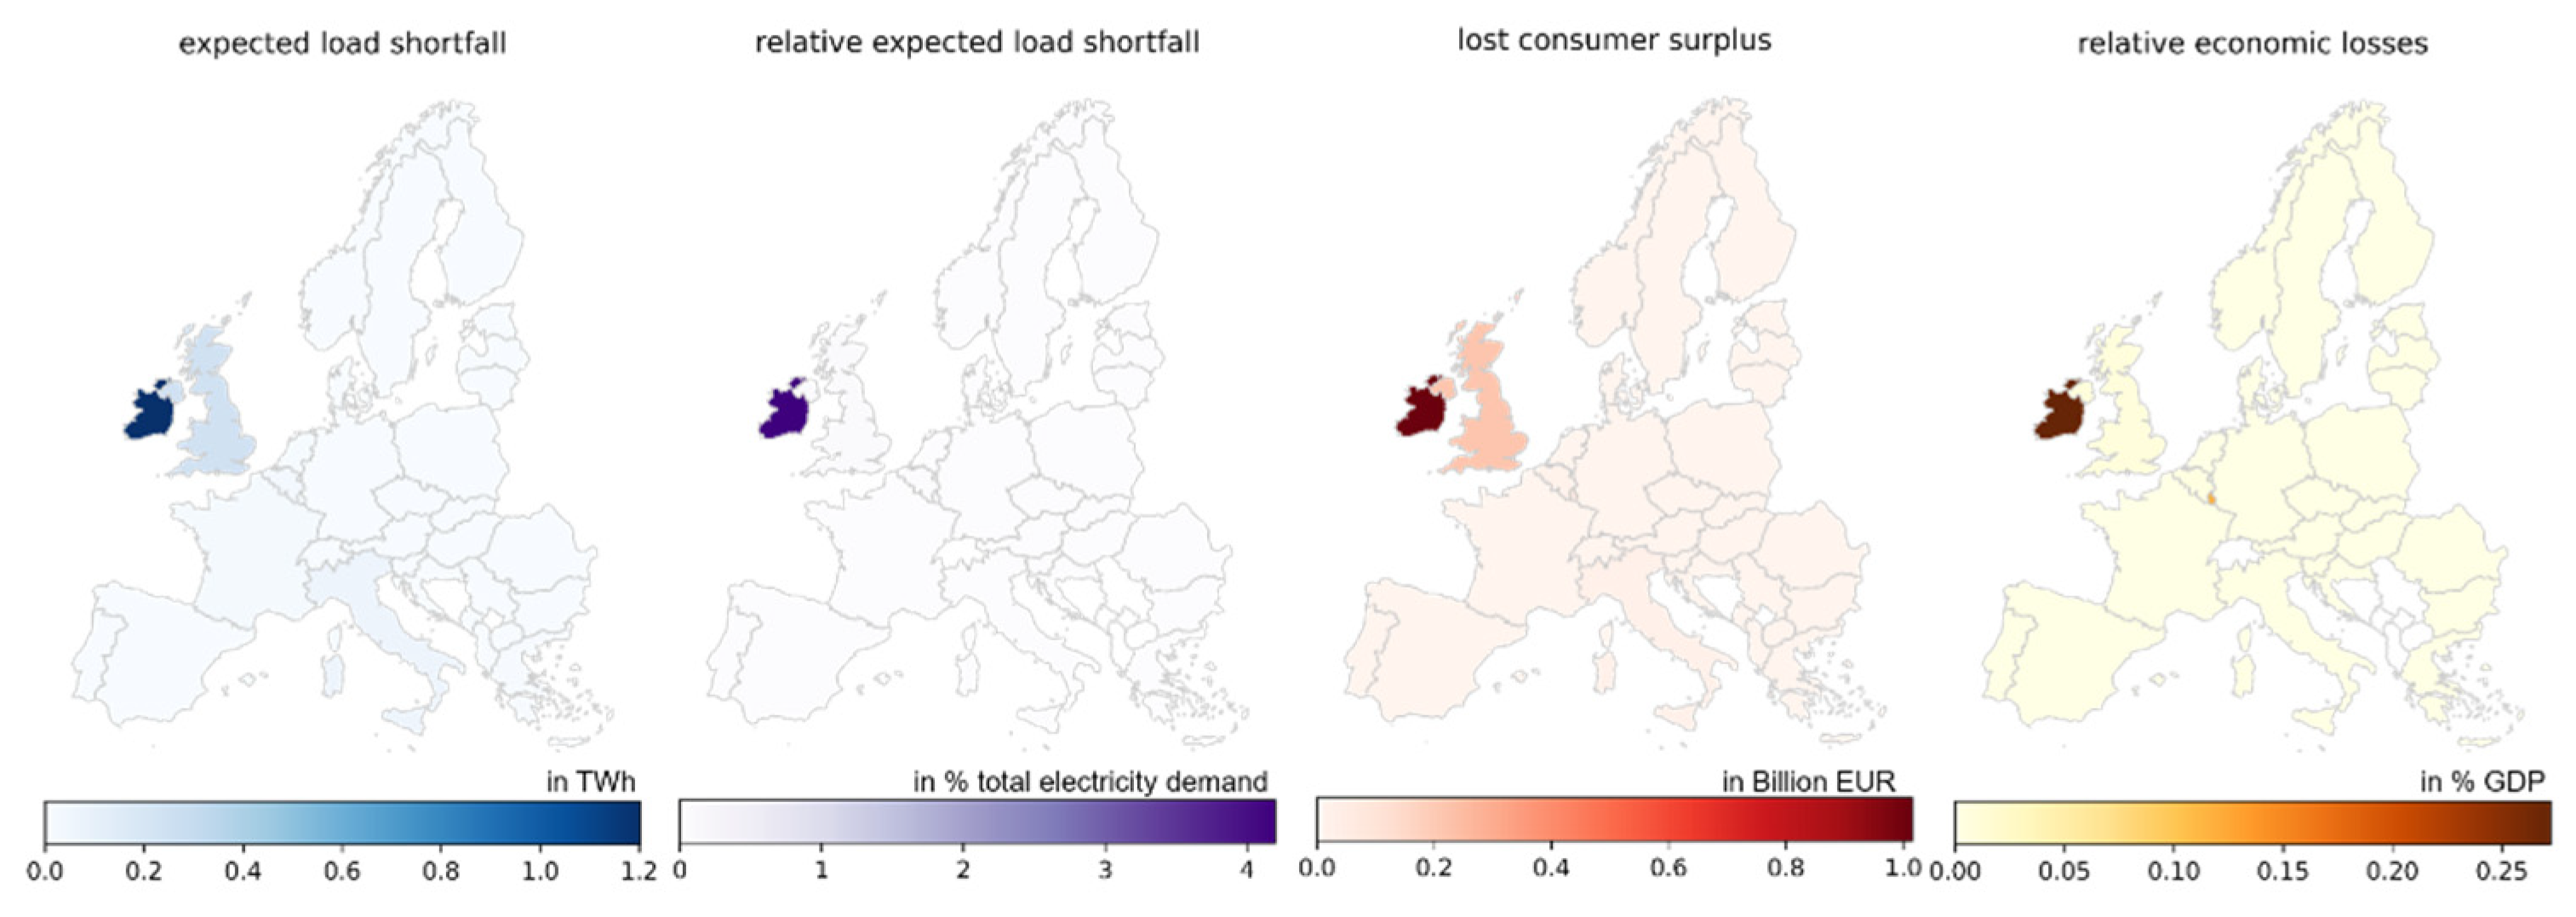
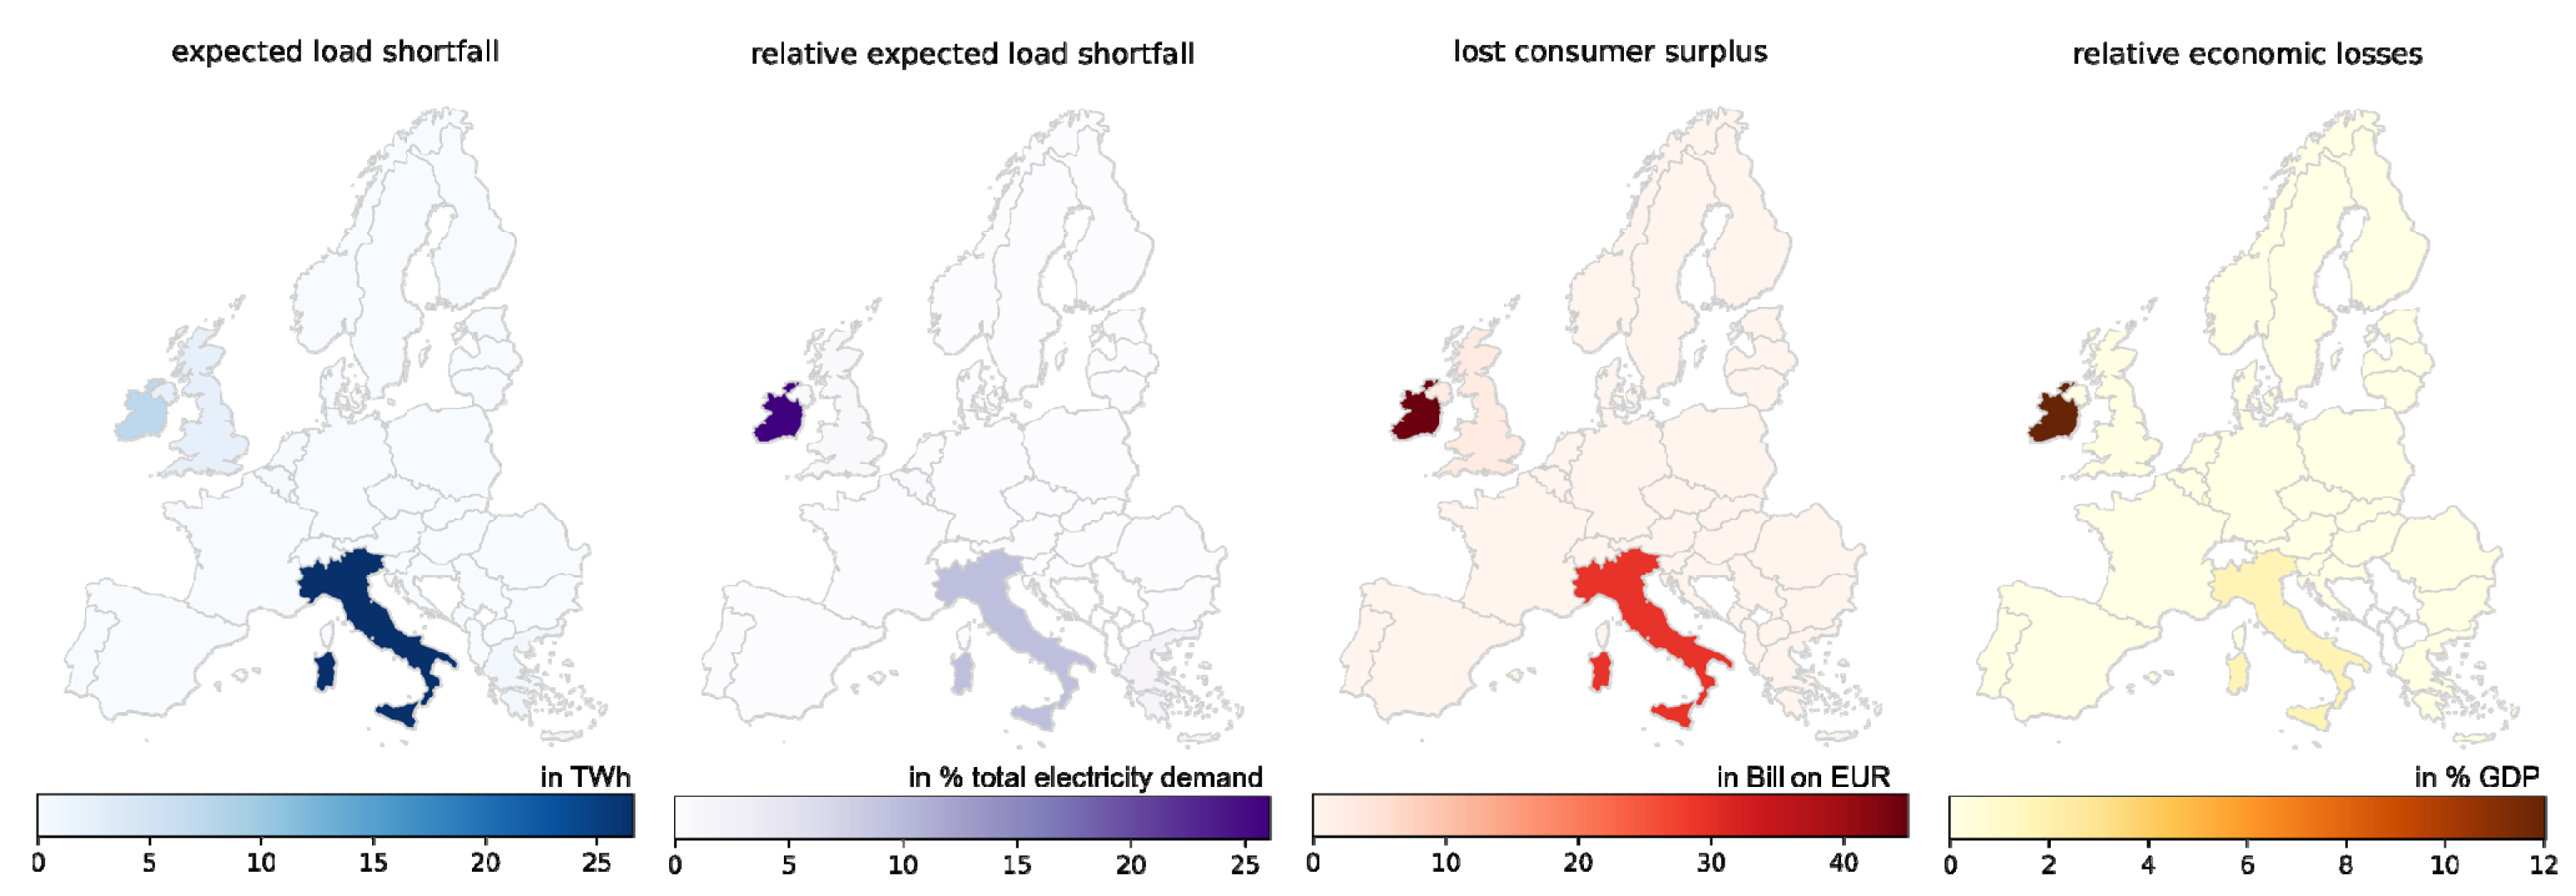
- Relevance of European load balancing: In particular, the very high shortfall quantities in the island state of Ireland show the relevance of the balancing potential in the European interconnected grid. In order to absorb national bottlenecks as efficiently as possible, an intensified expansion of cross-border interconnection capacities is therefore advisable.
Author Contributions
Funding
Data Availability Statement
Conflicts of Interest
References
- bp, Statistical Review of World Energy, 70th Edition. 2021. Available online: https://www.bp.com/content/dam/bp/country-sites/de_de/germany/home/presse/broschueren/bp-stats-review-2021-full-report.pdf (accessed on 17 September 2022).
- Statistical Office of the European Union (Eurostat), “Energiebilanzen“ (Energy Balances). 2022. Available online: https://ec.europa.eu/eurostat/de/web/energy/data/energy-balances (accessed on 18 September 2022).
- Bachmann, R.; Baquaee, D.; Bayer, C.; Kuhn, M.; Löschel, A.; McWilliams, B.; Moll, B.; Peichl, A.; Pittel, K.; Schularick, M.; et al. How it can be done. Policy Brief 2022. [Google Scholar]
- Berger, E.; Bialek, S.; Garnadt, N.; Grimm, V.; Other, L.; Salzmann, L.; Schnitzer, M.; Truger, A.; Wieland, V. A potential sudden stop of energy imports from Russia: Effects on energy security and economic output in Germany and the EU. Ger. Counc. Econ. Experts Work. Paper 2022. Available online: https://www.sachverstaendigenrat-wirtschaft.de/fileadmin/dateiablage/Arbeitspapiere/Arbeitspapier_01_2022.pdf (accessed on 18 September 2022).
- European Parliament and Council, Regulation (EU) 2019/943 of the European Parliament and of the Council of 5 June 2019 on the Internal Market for Electricity (PE/9/2019/REV/1). 2019. Available online: https://eur-lex.europa.eu/legal-content/EN/TXT/?uri=CELEX%3A32019R0943 (accessed on 18 September 2022).
- entso-e. Mid-Term Adequacity Forecast 2019. Available online: https://www.entsoe.eu/outlooks/midterm/ (accessed on 18 September 2022).
- ACER. Methodology for the European Resource Adequacy Assessment (ERAA). 2020. Available online: https://www.acer.europa.eu/sites/default/files/documents/Individual%20Decisions_annex/ACER%20Decision%2024-2020%20on%20ERAA%20-%20Annex%20I_1.pdf (accessed on 18 September 2022).
- ACER. Methodology for Calculating the Value of Lost Load, the Cost of New Entry and the Reliability Standard. 2020. Available online: https://www.acer.europa.eu/sites/default/files/documents/Individual%20Decisions_annex/ACER%20Decision%2023-2020%20on%20VOLL%20CONE%20RS%20-%20Annex%20I_1.pdf (accessed on 18 September 2022).
- Baumanns, P.T. Berechnung Probalistischer Kenngrößen zur Resource Adequacy in der Europäischen Energiewende, 1st ed.; Printproduction, M., Ed.; Wolff GmbH: Aachen, Germany, 2019. [Google Scholar]
- Nolting, L.; Praktiknjo, A. Can we phase-out all of them? Probabilistic assessments of security of electricity supply for the German case. Appl. Energy 2020, 263, 114704. [Google Scholar] [CrossRef]
- Nolting, L.; Praktiknjo, A. The complexity dilemma—Insights from security of electricity supply assessments. Energy 2021, 241, 122522. [Google Scholar] [CrossRef]
- Consentec und r2b Energy Consulting, Versorgungssicherheit in Deutschland und Seinen Nachbarländern: Länderübergreifendes Monitoring und Bewertung (Security of Supply in Germany and Its Neighbouring Countries: International Monitoring and Evaluation). 6 March 2015. Available online: https://www.bmwi.de/Redaktion/DE/Publikationen/Energie/versorgungssicherheit-in-deutschland-und-seinen-nachbarlaendern.html (accessed on 19 September 2022).
- EICom, System Adequacy 2020. Available online: https://goo.gl/8JztdE (accessed on 19 September 2022).
- Pentalateral Energy Forum, Generation Adequacity Assessment. 2018. Available online: https://goo.gl/ipG8RS (accessed on 19 September 2022).
- Praktiknjo, A. Sicherheit der Elektrizitätsversorgung: Das Spannungsfeld von Wirtschaftlichkeit und Umweltverträglichkeit; Springer: Berlin/Heidelberg, Germany, 2013. [Google Scholar]
- Bateman, I.J.; Carson, R.; Day, B.; Hanemann, M.; Hanley, N.; Hett, T.; Jones-Lee, M.; Loomes, G. Economic Valuation with Stated Preference Techniques: Chapter 1—The Foundations of Economic Valuation; Edward Elgar Publishing: Cheltenham, UK, 2002; pp. 30–59. [Google Scholar]
- ENTSO-E, European Resource Adequacy Assessment—2021 Edition. 2021. Available online: https://www.entsoe.eu/outlooks/eraa/ (accessed on 20 September 2022).
- Statistical Office of the European Union (Eurostat), Collection of Data on Combined Heat and Power Generation (CHP Data). 2022. Available online: https://ec.europa.eu/eurostat/web/energy/data (accessed on 18 March 2022).
- Statistical Office of the European Union (Eurostat), Aufkommens-, Verwendungs- und Input-Output Tabellen. 2022. Available online: https://ec.europa.eu/eurostat/de/web/esa-supply-use-input-tables/data/database (accessed on 18 March 2022).
- Praktiknjo, A. The Value of Lost Load for Sectoral Load Shedding Measures: The German Case with 51 Sectors. Energies 2016, 9, 116. [Google Scholar] [CrossRef]
- Praktiknjo, A.J.; Hähnel, A.; Erdmann, G. Assessing energy supply security: Outage costs in private households. Energy Policy 2011, 39, 7825–7833. [Google Scholar] [CrossRef]
- Praktiknjo, A.J. Stated preferences based estimation of power interruption costs in private households: An example from Germany. Energy 2014, 76, 82–90. [Google Scholar] [CrossRef]
- Ganz, K.; Guminski, A.; Kolb, M.; von Roon, S. Wie können europäische Branchen-Lastgänge die Energiewende im Industriesektor unterstützen? (How can European industry load profiles support the energy transition in the industrial sector?). Et-Energ. Tagesfr. 2021, 1, 79–81. [Google Scholar]
- Priesmann, J.; Nolting, L.; Kockel, C.; Praktiknjo, A. Time series of useful energy consumption patterns for energy system modeling. Sci. Data 2021, 8, 1–12. [Google Scholar] [CrossRef] [PubMed]


| 30% Reduction Scenario | BE | DE | DK | FR | GR | IE | IT | LU | LV | NL | UK | Total |
|---|---|---|---|---|---|---|---|---|---|---|---|---|
| Expected energy not served (EEnS) [GWh] | 32.7 | 2.2 | 0.9 | 21.0 | 5.2 | 1202.6 | 61.8 | 0.8 | 0.8 | 11.4 | 243.1 | 1590.9 |
| EEnS relative to national electricity demand [%] | 0.0 | 0.0 | 0.0 | 0.0 | 0.0 | 4.2 | 0.0 | 0.1 | 0.0 | 0.0 | 0.1 | - |
| Economic costs [million EUR] | 14.8 | 1.2 | 0.9 | 7.7 | 0.9 | 1015.6 | 26.8 | 75.6 | 0.6 | 5.3 | 222.1 | 1371.5 |
| Costs relative to national GDP [%] | 0.0 | 0.0 | 0.0 | 0.0 | 0.0 | 0.3 | 0.0 | 0.1 | 0.0 | 0.0 | 0.0 | - |
| 40% Reduction Scenario | BE | DE | DK | FR | GR | IE | IT | LU | LV | NL | UK | Total |
|---|---|---|---|---|---|---|---|---|---|---|---|---|
| Expected energy not served (EenS) [GWh] | 362.7 | 60.5 | 4.9 | 47.1 | 743.8 | 7473.7 | 26,598.7 | 41.1 | 1.5 | 185.4 | 2265.4 | 37,785.5 |
| EenS relative to national electricity demand [%] | 0.5 | 0.0 | 0.0 | 0.0 | 1.6 | 26.1 | 9.7 | 0.7 | 0.0 | 0.2 | 0.8 | - |
| Economic costs [million EUR] | 182.2 | 32.2 | 4.8 | 17.2 | 128.4 | 44,849.9 | 29,435.2 | 532.0 | 1.0 | 93.4 | 2510.3 | 77,787.1 |
| Costs relative to national GDP [%] | 0.0 | 0.0 | 0.0 | 0.0 | 0.1 | 12.0 | 1.8 | 0.8 | 0.0 | 0.0 | 0.1 | - |
Publisher’s Note: MDPI stays neutral with regard to jurisdictional claims in published maps and institutional affiliations. |
© 2022 by the authors. Licensee MDPI, Basel, Switzerland. This article is an open access article distributed under the terms and conditions of the Creative Commons Attribution (CC BY) license (https://creativecommons.org/licenses/by/4.0/).
Share and Cite
Kockel, C.; Nolting, L.; Pacco, K.; Schmitt, C.; Moser, A.; Praktiknjo, A. How Dependent Are European Power Systems and Economies on Natural Gas?—A Macroeconomic Optimization for Security of Electricity Supply. Energies 2022, 15, 8991. https://doi.org/10.3390/en15238991
Kockel C, Nolting L, Pacco K, Schmitt C, Moser A, Praktiknjo A. How Dependent Are European Power Systems and Economies on Natural Gas?—A Macroeconomic Optimization for Security of Electricity Supply. Energies. 2022; 15(23):8991. https://doi.org/10.3390/en15238991
Chicago/Turabian StyleKockel, Christina, Lars Nolting, Kevin Pacco, Carlo Schmitt, Albert Moser, and Aaron Praktiknjo. 2022. "How Dependent Are European Power Systems and Economies on Natural Gas?—A Macroeconomic Optimization for Security of Electricity Supply" Energies 15, no. 23: 8991. https://doi.org/10.3390/en15238991
APA StyleKockel, C., Nolting, L., Pacco, K., Schmitt, C., Moser, A., & Praktiknjo, A. (2022). How Dependent Are European Power Systems and Economies on Natural Gas?—A Macroeconomic Optimization for Security of Electricity Supply. Energies, 15(23), 8991. https://doi.org/10.3390/en15238991