Article

Research on Packet Control Strategy of Constant-Frequency Air-Conditioning Demand Response Based on Improved Particle Swarm Optimization Algorithm

1
School of Electrical & Automation Engineering, Nanjing Normal University, Nanjing 210023, China
2
State Grid Zhejiang Longgang Electric Power Supply Corporation, Longgang 325802, China
3
College of Electrical Engineering of Shanghai University of Electric Power, Yangpu District, Shanghai 200090, China
*
Author to whom correspondence should be addressed.
Energies 2022, 15(23), 8985; https://doi.org/10.3390/en15238985
Submission received: 23 October 2022 / Revised: 17 November 2022 / Accepted: 24 November 2022 / Published: 28 November 2022
(This article belongs to the Special Issue Advances and Optimization of Electric Energy System)

Abstract

:
To better utilize air-conditioning load in terms of demand side response potential and improve precision and speed, a control strategy of traditional temperature-control air conditioning, determining frequency load as the research object, and air conditioning determined with a frequency theory model and the Monte Carlo method, were used to construct a power aggregation model. This was combined with user feedback to study thermal comfort as a lateral load demand response resource to determine the potential demand response of power systems. Based on the state-queuing model, an air-conditioning load grouping control strategy using an improved particle swarm optimization algorithm is proposed which can accurately control the air-conditioning load following the reference load.

1. Introduction

With the rapid economic development in recent years in China, the power load in the electricity network has been progressively increasing over the years, which leads to a lack of power supply during the summer peak period, especially in developed areas. Furthermore, for the constitution of the summer peak load, air conditioners account for the largest proportion. Let us take Beijing and Shanghai as an example, where the air-conditioning load makes up 50% of the power load during the summer peak, and this proportion will continue to witness an increase [1]. Because of the physical characteristics and the users’ habits, the air-conditioning load is anticipated to endow significant potential for adjustability. In addition, the revolutionary development of renewable energy and the extensive integration of wind generation place challenges on the control and operation of power systems due to limited adjustability, high randomness, and uncertainty [2]; thus, flexible control strategies for adaptable resources at the demand side are urgently needed to resolve potential adverse impacts from fluctuations in renewable generation on power system stability. Among the options, air conditioners are typically adopted as temperature-controlling loads which, under the premise of guaranteeing users’ comfort, enable flexible and fast responses for operational power by heat inertia of the constructions. Moreover, this is an economical and reliable resource for demand response which could potentially participate in reactive power optimization for the system [3], orderly load shedding [4], peak load regulation, and carbon emission reduction [5].
To take full advantage of the demand response capability of the air-conditioning load, the corresponding control strategy must be proposed with practical scenarios. In line with the existing difficulty of regulating the clusters of air conditioners and efficiently reducing groups and simplifying control technologies, considering load shedding and comfort, Ref. [6] proposed an aggregation and peak-shifting methodology; however, there are large disturbances in air-conditioning load. In [7], a rotating framework for air conditioner regulation is proposed using an energy management system, improving real-time control effectiveness for air conditioners with adjustable status during the adjusting time. However, it has high-level prerequisites for hardware. Ref. [8] proposed a straightforward and efficient control approach for tracing large-scale air-conditioning loads based on second-order equivalent thermal parameters (ETP), implemented by utilizing reference signals to trace the original load curve and the expected load curve. Nonetheless, if the analysis of the solving time and accuracy of the proposed method could be further improved, that would be more practical. In [9], the interactivity of commercial buildings is predicted by their physical model. Then, the interactivity curve of the commercial buildings could be established based on the comprehensive temperature-controlling strategy [10]. The merit of this technique is that the flexibility of the air-conditioning load is well utilized, while the accuracy is highly reliant upon the simulation model of the energy consumption of the buildings [11].
To address the aforementioned issues, this paper mainly investigates the demand response control strategy of the constant-frequency air-conditioning load. First, the single-machine model of the air-conditioning load is constructed based on the ETP model. Then, considering the factor of user comfort, an analysis of the potential and characteristics of the air-conditioning demand response is conducted, adopting the Monte Carlo approach. Furthermore, the demand response control strategy for air conditioners is proposed based on enhanced particle swarm optimization (PSO), which makes the most of the demand response capability of air conditioners, reduces dependence on third-party software, and has superiority over traditional algorithms in the aspects of computational accuracy and velocity.

2. Model and Analysis of Constant-Frequency Air Conditioners

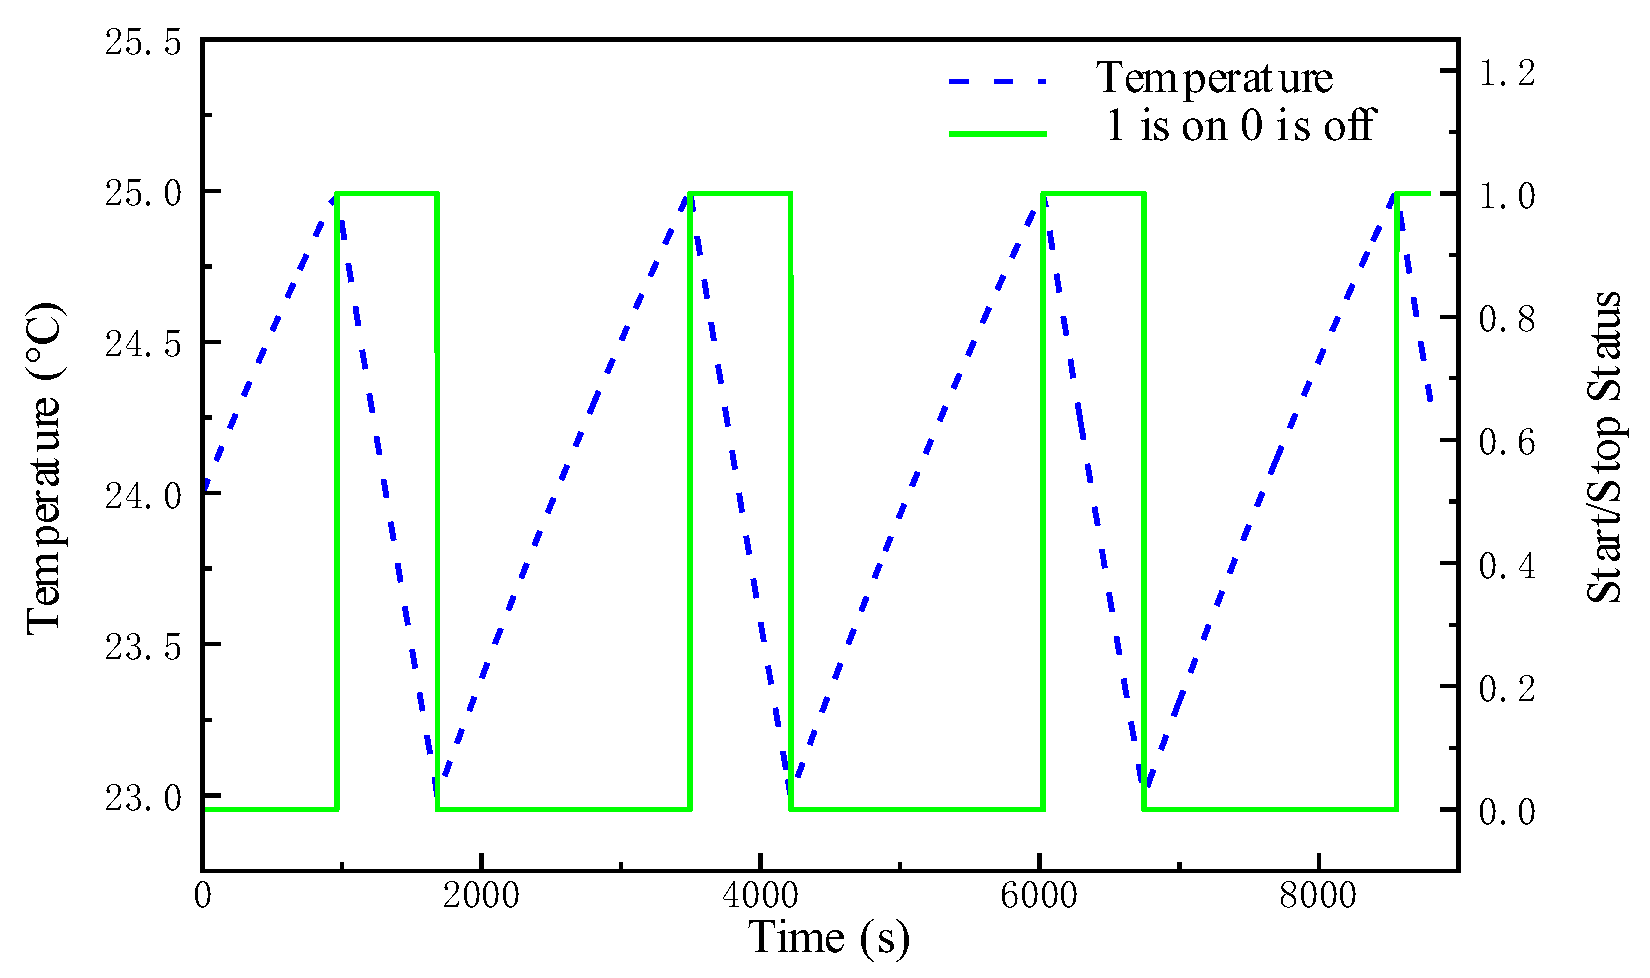
2.1. Physical Model of Constant-Frequency Air Conditioners

The underlying principle of investigating the regulation capability of air conditioners is, first, to establish a physical model for air-conditioning load, demonstrating operational status and power consumption. The conventional methodology to model air-conditioning load typically adopts the ETP approach to mimic the heat transfer process indoors, which equates interior environments, exterior environments, and the refrigerating capacity of air conditioners to the resistances, capacitances, and power sources of the corresponding circuits, respectively [12]. Illustrating the operation process of air-conditioning load using the ETP model of the second and higher orders has assured precision. Nevertheless, the parameters of the second- and higher-order models are rather complicated, resulting in heavy computational burdens. To simplify the modelling of the temperature-controlling load of air conditioners, many researchers express the temperature variations in the air-conditioning load located space with the first-order ETP model, assuming the equivalence between the temperature of the interior air and that of the solid [13,14]. The circuit schematic obtained from the first-order ETP model is depicted in Figure 1.
The indoor temperature variation can be described as in (1), from which, in the simplified models, the indoor temperature variation can be approximately equivalent to the exponential functions. Therefore, the model only consists of the equivalent parameters of capacitances, resistances, and refrigerating quantity, which are easy to acquire and model, and can relieve computational burdens.
Constant-frequency air conditioners regulate the indoor temperature via periodical start–stop compressors which, in other words, have two operating states: turned-on mode and turned-off mode. During the turned-on mode, the air conditioners provide rated refrigerating/heating quantity to the room with the nominal power output while, for the turned-off mode, the air-conditioning load stops running. Accordingly, the first-order ETP model for constant-frequency air conditioners is written as [15]:
{ T in , t + 1 = T out , t + 1 ( T out , t T in , t ) e Δ t / R C ,   α = 0 T in , t + 1 = T out , t + 1 Q R ( T out , t Q R T in , t ) e Δ t / R C ,   α = 1  
where Q = η P , P represents the nominal active power of the air conditioners, η is the energy efficiency ratio, and α is a binary state variable for air conditioners, where 0 and 1 indicate the turned-off and turned-on modes, respectively.
Assume that the interior temperature is set as [ T min , T max ], and the exterior temperature is fixed at Tout in a cycle of control. Additionally, denote the air conditioner as turned off at τ 0 and turned on at τ 1 . The control period is τ c . Substituting the range of the set interior temperature into (1) yields:
τ 0 = R C Δ t ln ( T min T out T max T out )  
τ 1 = R C Δ t ln ( η P R + T max T out η P R + T min T out )
τ c = τ 0 + τ 1
Given that the air conditioners operate within a limited range of temperatures, the variation in the interior temperature can be traced via straight lines, which thus derives the linear ETP model, i.e., the state-queuing (SQ) model [16], shown as:
T in , t + 1 = T in , t + Δ t τ 0 ( T max T min ) , α = 0 T in , t + 1 = T in , t Δ t τ 1 ( T max T min ) , α = 1
According to the single-machine model of the constant-frequency air-conditioning load as given in (1), the characteristics of the interior temperature for a typical residential room and the start–stop state for the constant-frequency air conditioners are illustrated in Figure 2.

2.2. Modelling of the Air-Conditioning Load Clusters

Calculating the aggregated power and the regulation capability of a cluster of air conditioners based on the operational power model of the single-machine constant-frequency air conditioner is critical to the air-conditioning load participating in the demand response. This paper equates a significant number of air-conditioning loads to a single aggregated load via the Monte Carlo methodology [17], which has the following three procedures, as displayed in Figure 3.
The calculation results of the aggregated power are generally regarded as the reference power [18], which benefits the precise assessment of the aggregated power of a large amount of air-conditioning load, as well as shortens computation time to a certain degree.

2.3. Analysis of the Regulation Capability of Air-Conditioning Clusters

This paper obtains the aggregated power and average power of the air-conditioning clusters through the Monte Carlo approach on a single-machine model. Considering that the average power of aggregated air conditioners can be utilized to represent the actual power consumption of each air conditioner in the case of a large-scale air-conditioning load, the total amount of power consumption can be derived from the accumulation of that of the single machines. Moreover, the accuracy of this method can be verified by simulations, which illuminate further case studies calculating the average power of the aggregated air conditioners with multiple scenarios of exterior temperature and a set value for interior temperature. Consequently, the average power consumption for the aggregated air conditioners in several typical scenarios can be acquired. Then, combined with the adjustable range of the users’ thermal comfort, load shedding capabilities of the air-conditioning load can be obtained [19].
To quantify the impact of temperature on human comfort, the Franger thermal comfort equation is adopted to formulate the index of the predicted mean vote (PMV), which approximates thermal comfort. The correlation between the PMV value and human feelings is shown in Figure 4, where the smaller values indicate superior user comfort [20].
Given that the other factors assure the user comfort, the relationship between the PMV value (denoted as IPMV) and the temperature (denoted as x) can be expressed as [21]:
I P M V = { 0.3895 ( x 26 )   x 26 0.4065 ( x + 26 )   x < 26
It could be implied from (6) that PMV has a minimum value with a temperature of 26 °C, which is also the most comfortable level. It has been suggested by ISO7730 that the users are most comfortable with PMV values ranging from −0.5 to 0.5 [17], where the corresponding interior temperature is 24.8 °C~27.3 °C. Considering that the users shall set the temperature as an integer [24, 28] °C is determined as the tunable range for users with their thermal comfort also satisfied. Thus, the demand response capability for the air-conditioning load can be derived by accounting for the users’ thermal comfort and the aggregated power consumption.

3. Power Consumption Model and Regulatory Capability Analysis of Constant-Frequency Air Conditioners

3.1. Group Methodology and State-Queueing Model

Various parameters and categories are present in the air-conditioning load that participates in the demand response. As a result, it is not practical to regulate each of the controllable loads with distinguished strategies. This paper first aggregates the air conditioners with a certain parameter and conducts control within the group. The process is followed by:
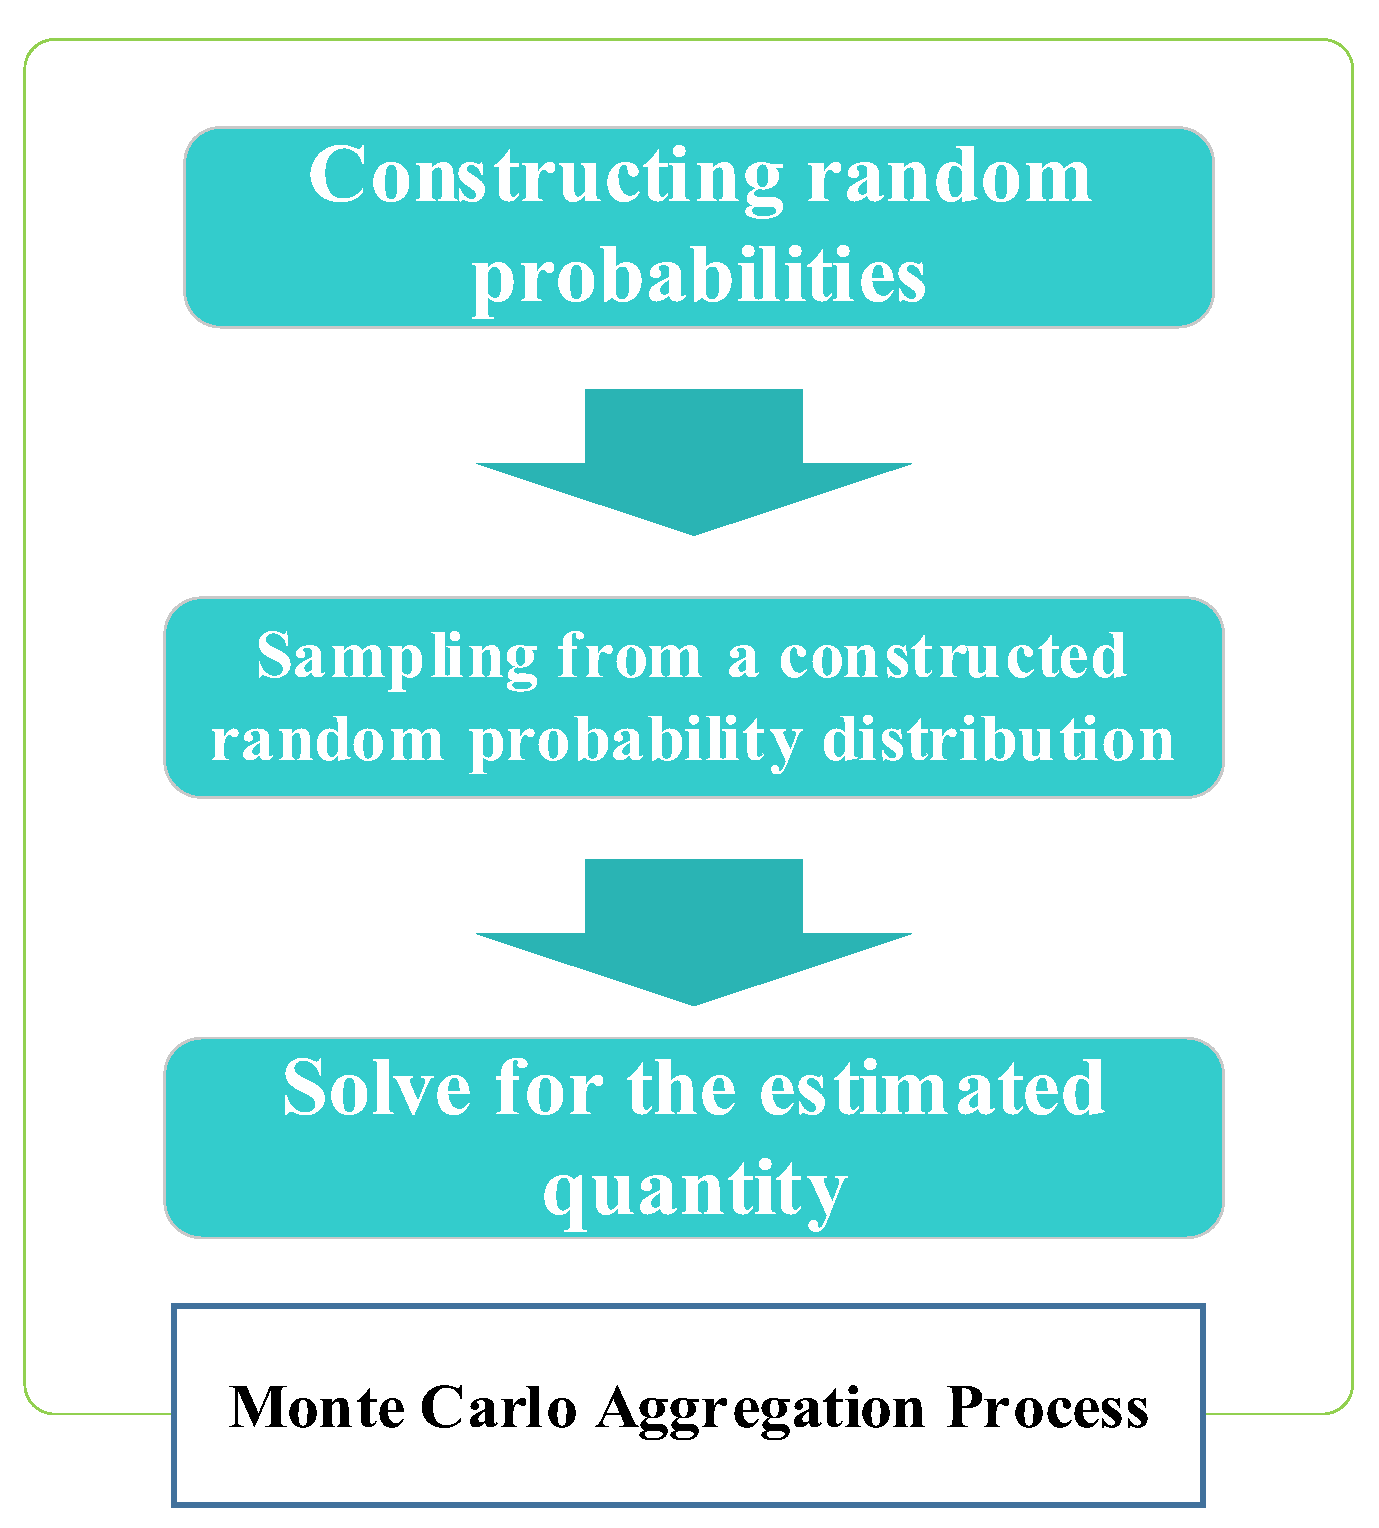
  • Based on the analyses given in (2) and (3), the power consumption of the constant-frequency air conditioners is closely related to the parameters representing the temperature variable, RC, and the distinct temperature difference, QR, yielded from the aforementioned parameters Q, R, and C, generated by Monte Carlo simulations.
  • Characterizing the constant-frequency air conditioners with the values of QR and RC, and aggregating them into different groups with K-means algorithms.
  • Obtaining the characteristic values for each aggregated group; the total power consumption for each group is the accumulation of all the machines.
  • Controlling the air-conditioning clusters of each group.
For the aggregated constant-frequency air conditioners, the analysis of the air-conditioning clusters with similar parameters is conducted with the state-queueing model, which is derived from the linearized ETP model [22].
It could be understood that several N air conditioners exist with identical or similar parameters after the aggregation. Under the circumstances that the exterior temperature is T 0 and the temperature range is provided as [ T min , T max ], the air conditioner shall operate under the procedure of being off for 7 min and being on for 3 min. Therefore, the entire process can be divided into 10 states, with each of the states lasting for 1 min.
In the beginning, N air conditioners in the aggregated group have significant variety, which thus leads to the air conditioners being averagely distributed across the ten states. Accordingly, each state comprises the number of N/10 air conditioners, denoted as a state group. The states in the original group move to the next with every minute passing by. For instance, the first state group enters the second state, and the second state group becomes the third state [23,24]. Ultimately, the new cycle starts when the tenth state group turns into the first state, where the detailed procedure is shown in Table 1.

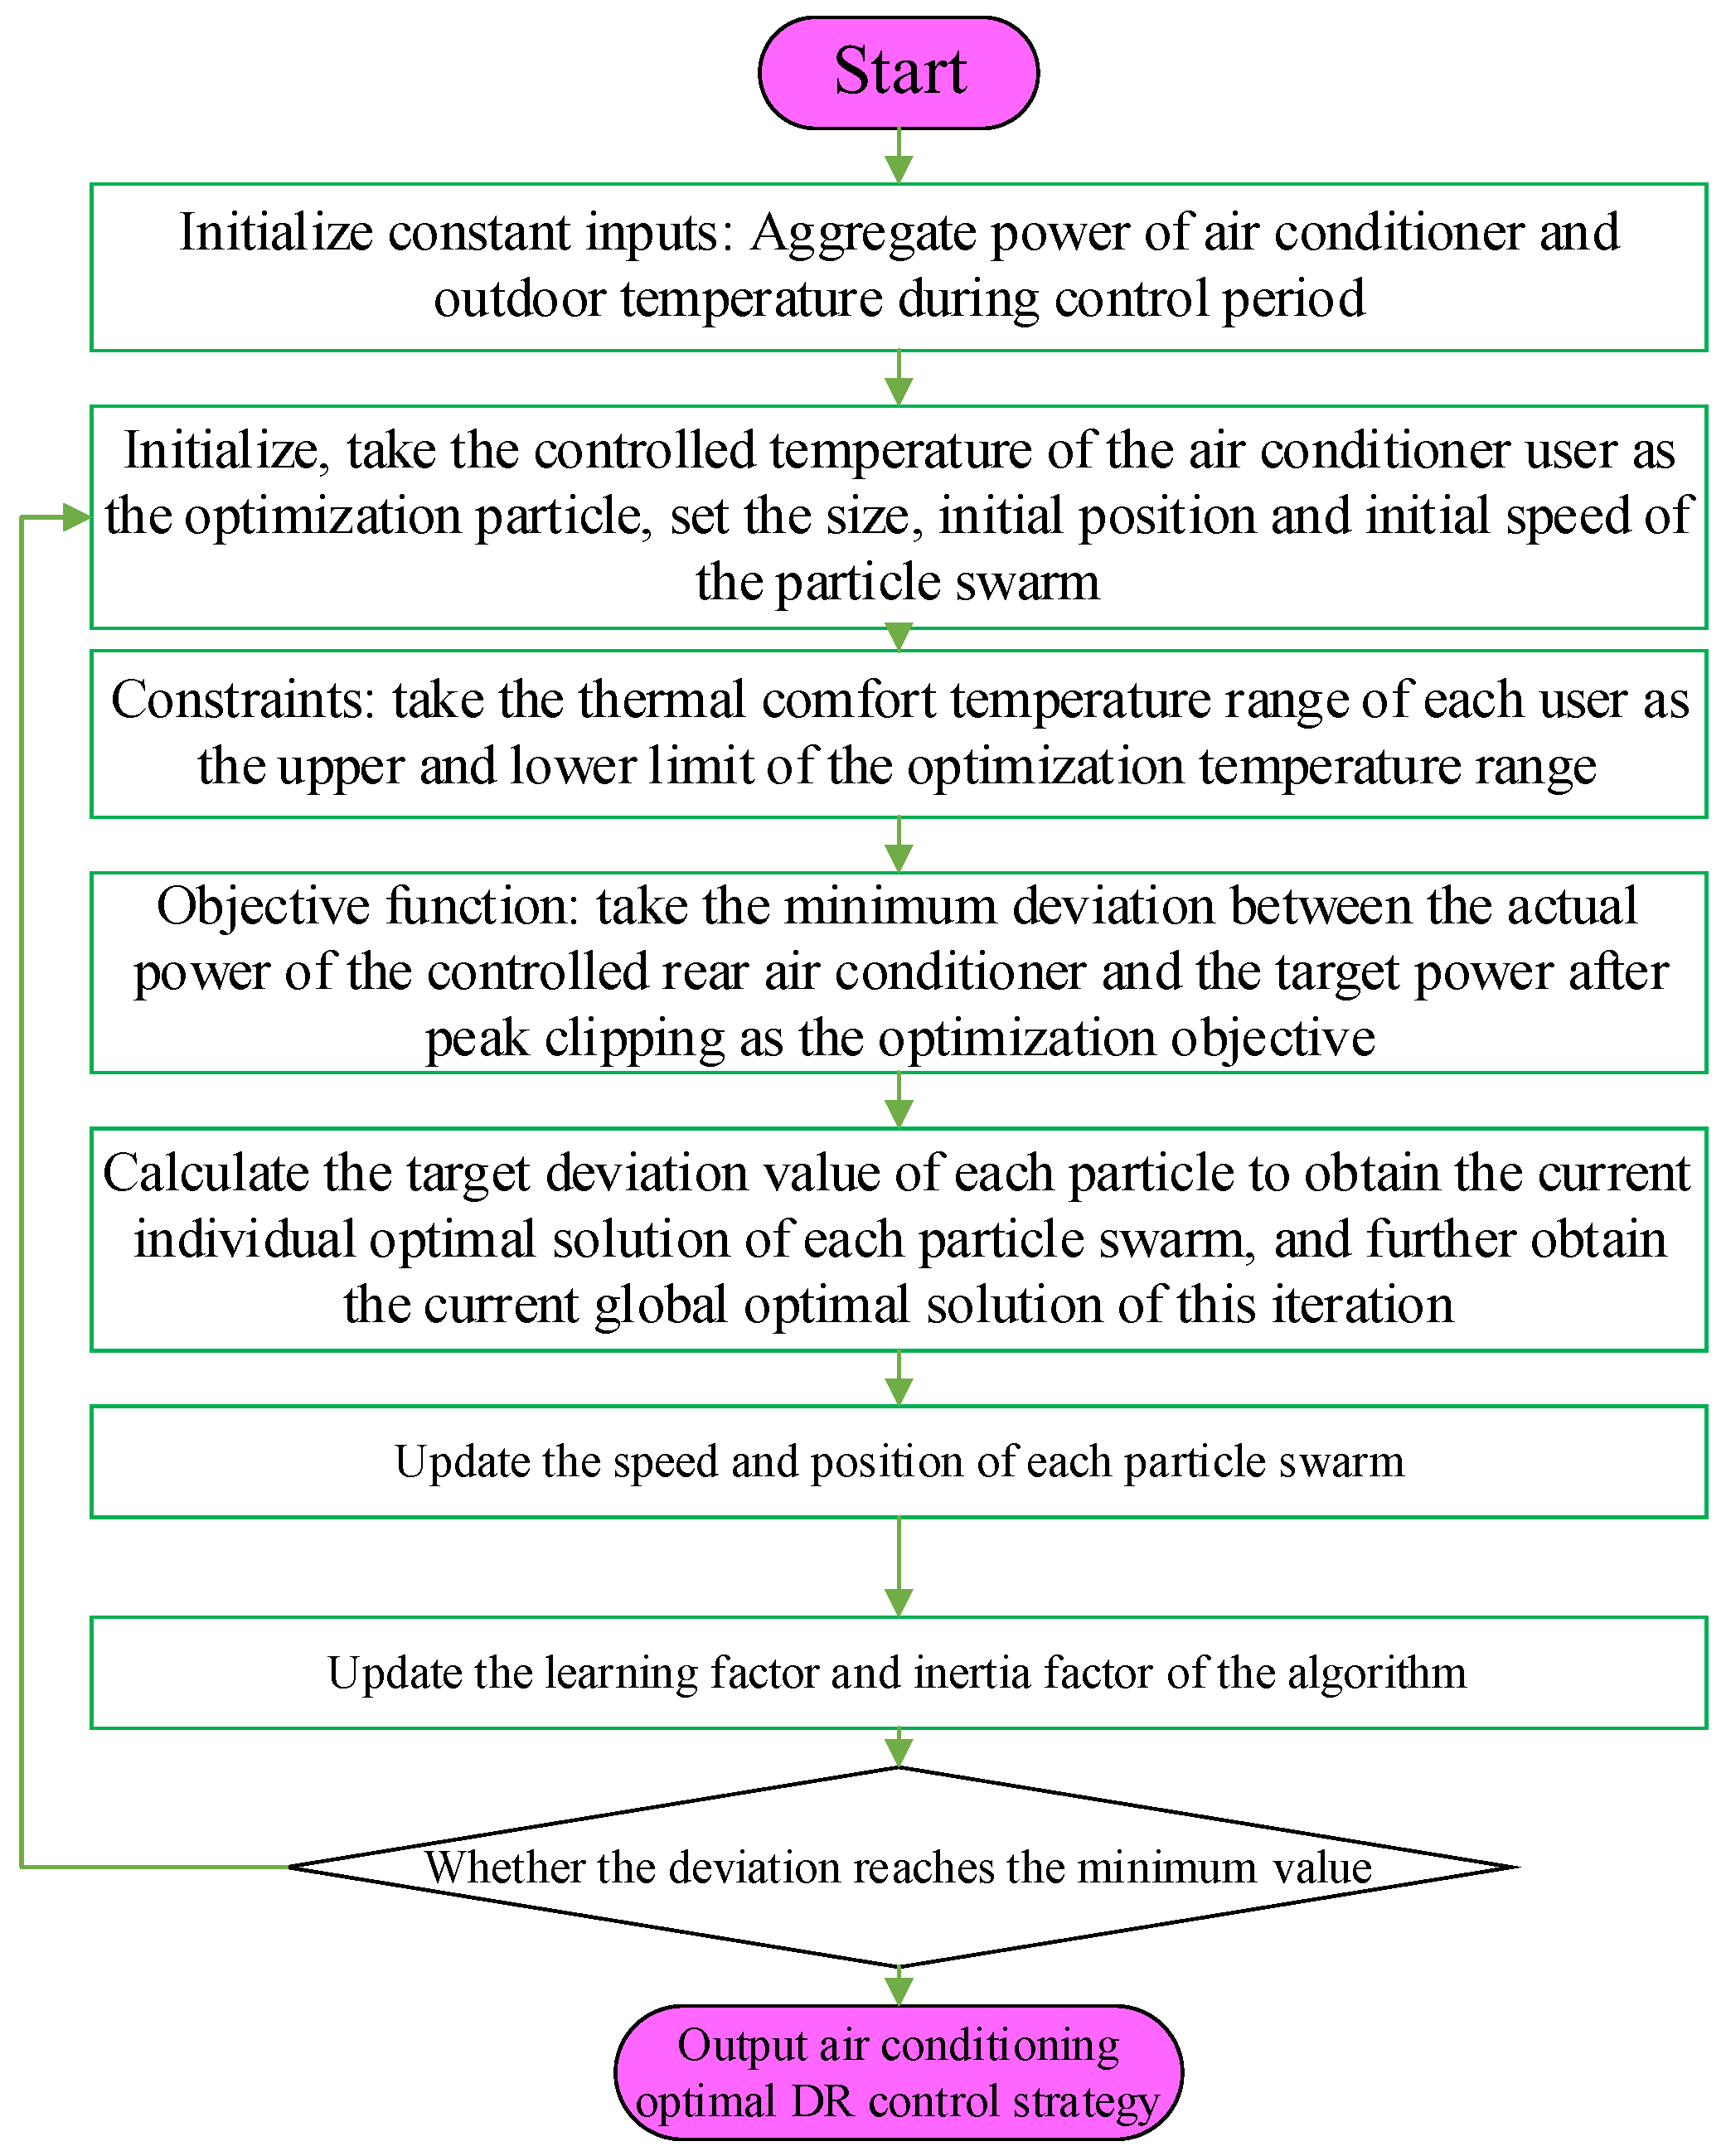
3.2. Control Strategy for the Air-Conditioning Load Based on the Improved PSO Algorithm

Conventional methodology, such as the state-queueing approach, can effectively describe the operational conditions of the grouped air conditioners. This paper also adopts this technique, formulating the objective function of the minimum deviation between the actual active power consumption of the air conditioners and the target of shifted peaks. Considering the investigation of capability analysis, the objective function is formulated such that the demand response capability can be developed with the tuning of the set temperature for the air conditioning:
min ( a b s ( t = T S T E ( i = 1 J P afc , i , t ( 1 λ t ) P pre , t ) ) )
where T s is the initial time starting control, T E is the control finishing time, J is the air-conditioning group regulated by the system, P afc , i , t is the regulated power for the i -th group of air conditioners during the t interval, λ t is the targeted peak shifting ratio for each time interval, and P pre , t is the predicted active power load at the time of t .
Taking the users’ thermal comfort into consideration, the constraint on the set temperature is expressed as:
θ min , i , t θ set , i , t θ max , i , t
where θ min , i , t is the lower bound, θ max , i , t is the upper bound, and θ set , i , t is the regulated temperature of air-conditioning user i at the time of t .
The enhanced PSO algorithm is employed in this paper, which modifies the learning factors, c 1 and c 2 , and the inertia factor, ω :
  • Learning factors: this paper utilizes asynchronous learning factors, i.e., the two learning factors conduct different variations during the optimization process. This, as a result, enables the particle’s strong self-learning capability and weak self-learning capability at the initial stage of optimization, which also strengthens global searching capabilities. Additionally, this modification is beneficial for the convergence of the globally optimized solution. The expressions are updated as:
c 1 = c 1 max ( c 1 max c 1 min ) × t t max c 2 = c 2 min ( c 2 max c 2 min ) × t t max
where c 1 max = c 2 max = 2.5 and c 1 min = c 2 min = 0.5 are the maximum and minimum values for c 1 and c 2 , respectively, t is the time also representing the current times for iteration, and t max is the maximum time for optimization.
2.
Inertia factor: a linearized inertia-weighted method is adopted in this paper, which linearly reduces the inertia weights from the maximum value to the minimum value. For the initial searching stage, enhancing the capability of global searching avoids the trap in the local solution. Moreover, for the later period, enhancing the capability of local searching assists in locking the optimized solution. The equation relating to the iteration is written as:
ω = ω max ( ω max ω min ) × t t max
where ω max = 0.9 and ω min = 0.4 are the maximum and minimum values for ω , respectively.
The flow chart of the improved PSO algorithm is schematized in Figure 5.

4. Case Studies

4.1. Simulation Scenarios

The simulations are carried out on the clusters of constant-frequency air conditioners. Several parameters are set in the simulations: (1) The simulation period is 3600 s. (2) The exterior temperature is 31 °C. (3) The targeted temperature of the air conditioners is 25 °C. (4) The controlled temperature allows a 1 °C error. Taking the reality of the location into account, other parameters are uniformly distributed in Table 2, and are taken from empirical values.

4.2. Analysis of the Simulation Results of the Air-Conditioning Aggregated Model

The total polymerization power of the different polymerization quantities of the constant-frequency air conditioners is shown in Figure 6 with the Monte Carlo method, where there are 1000, 5000, and 10,000 air conditioners. When there are 1000 units, the power is about 400 kW. When there are 5000 units, the power is about 2000 kW. It can be inferred from Figure 6 that, provided that the quantity continues to increase and reaches a certain scale, the aggregated power deviates around the stable value. With this finding, the average load power of a single air conditioner with a different number of aggregations is depicted in Figure 7.
This implies that the average power for a single air conditioner is 0.401 kW, whatever the aggregation quantity is. In addition, power fluctuations decrease with the increasing aggregated quantity, which eventually converges to 0.401 kW. Thus, for the following simulations, different characteristics of air conditioners can be ignored, if the quantity of the air conditioners is large enough. The simulations on the aggregated power are therefore conducted with the Monte Carlo method, with the single-machine air-conditioning load combined.

4.3. Analysis of the Simulation Results of the Demand Response Capability

The cases are further expanded to account for multiple conditions of different exterior temperatures and different set values for the air conditioning temperature. Consequently, the average power of polymeric air-conditioning units with different outdoor temperatures is illustrated in Table 3.
The error between the set temperature and the original temperature can be further derived from Table 3, which can thus be utilized to calculate the load shedding capability of the air-conditioning load.
Through the analysis of Table 3, it can be found that the average power for a single air-conditioning load is different under multiple circumstances of the exterior temperature and the set temperature for the air conditioners. Let us take the refrigerating mode in summer as an instance. Given that the temperature is set as the same, air conditioners consume more power when the exterior temperature is hotter. Furthermore, with the same exterior environment, the average power is larger with the smaller set value of the temperature. Table 3 quantifies this phenomenon.
By combining the aggregated power model of air-conditioning load with the range of users’ thermal comfort, it can be calculated that the load reduces by approximately 1800 kW by adjusting the set temperature from 24 °C to 28 °C, under the conditions of 10,000 air-conditioning loads and an exterior temperature of 31 °C. The load is reduced up to 45%, reflecting that there is abundant demand response capability.
For the following control strategies, Table 3 acts as a theoretical and numerical basis. The optimized strategy is therefore obtained by the objective function of the minimum error between the actual power consumption and the targeted shifting peak power.

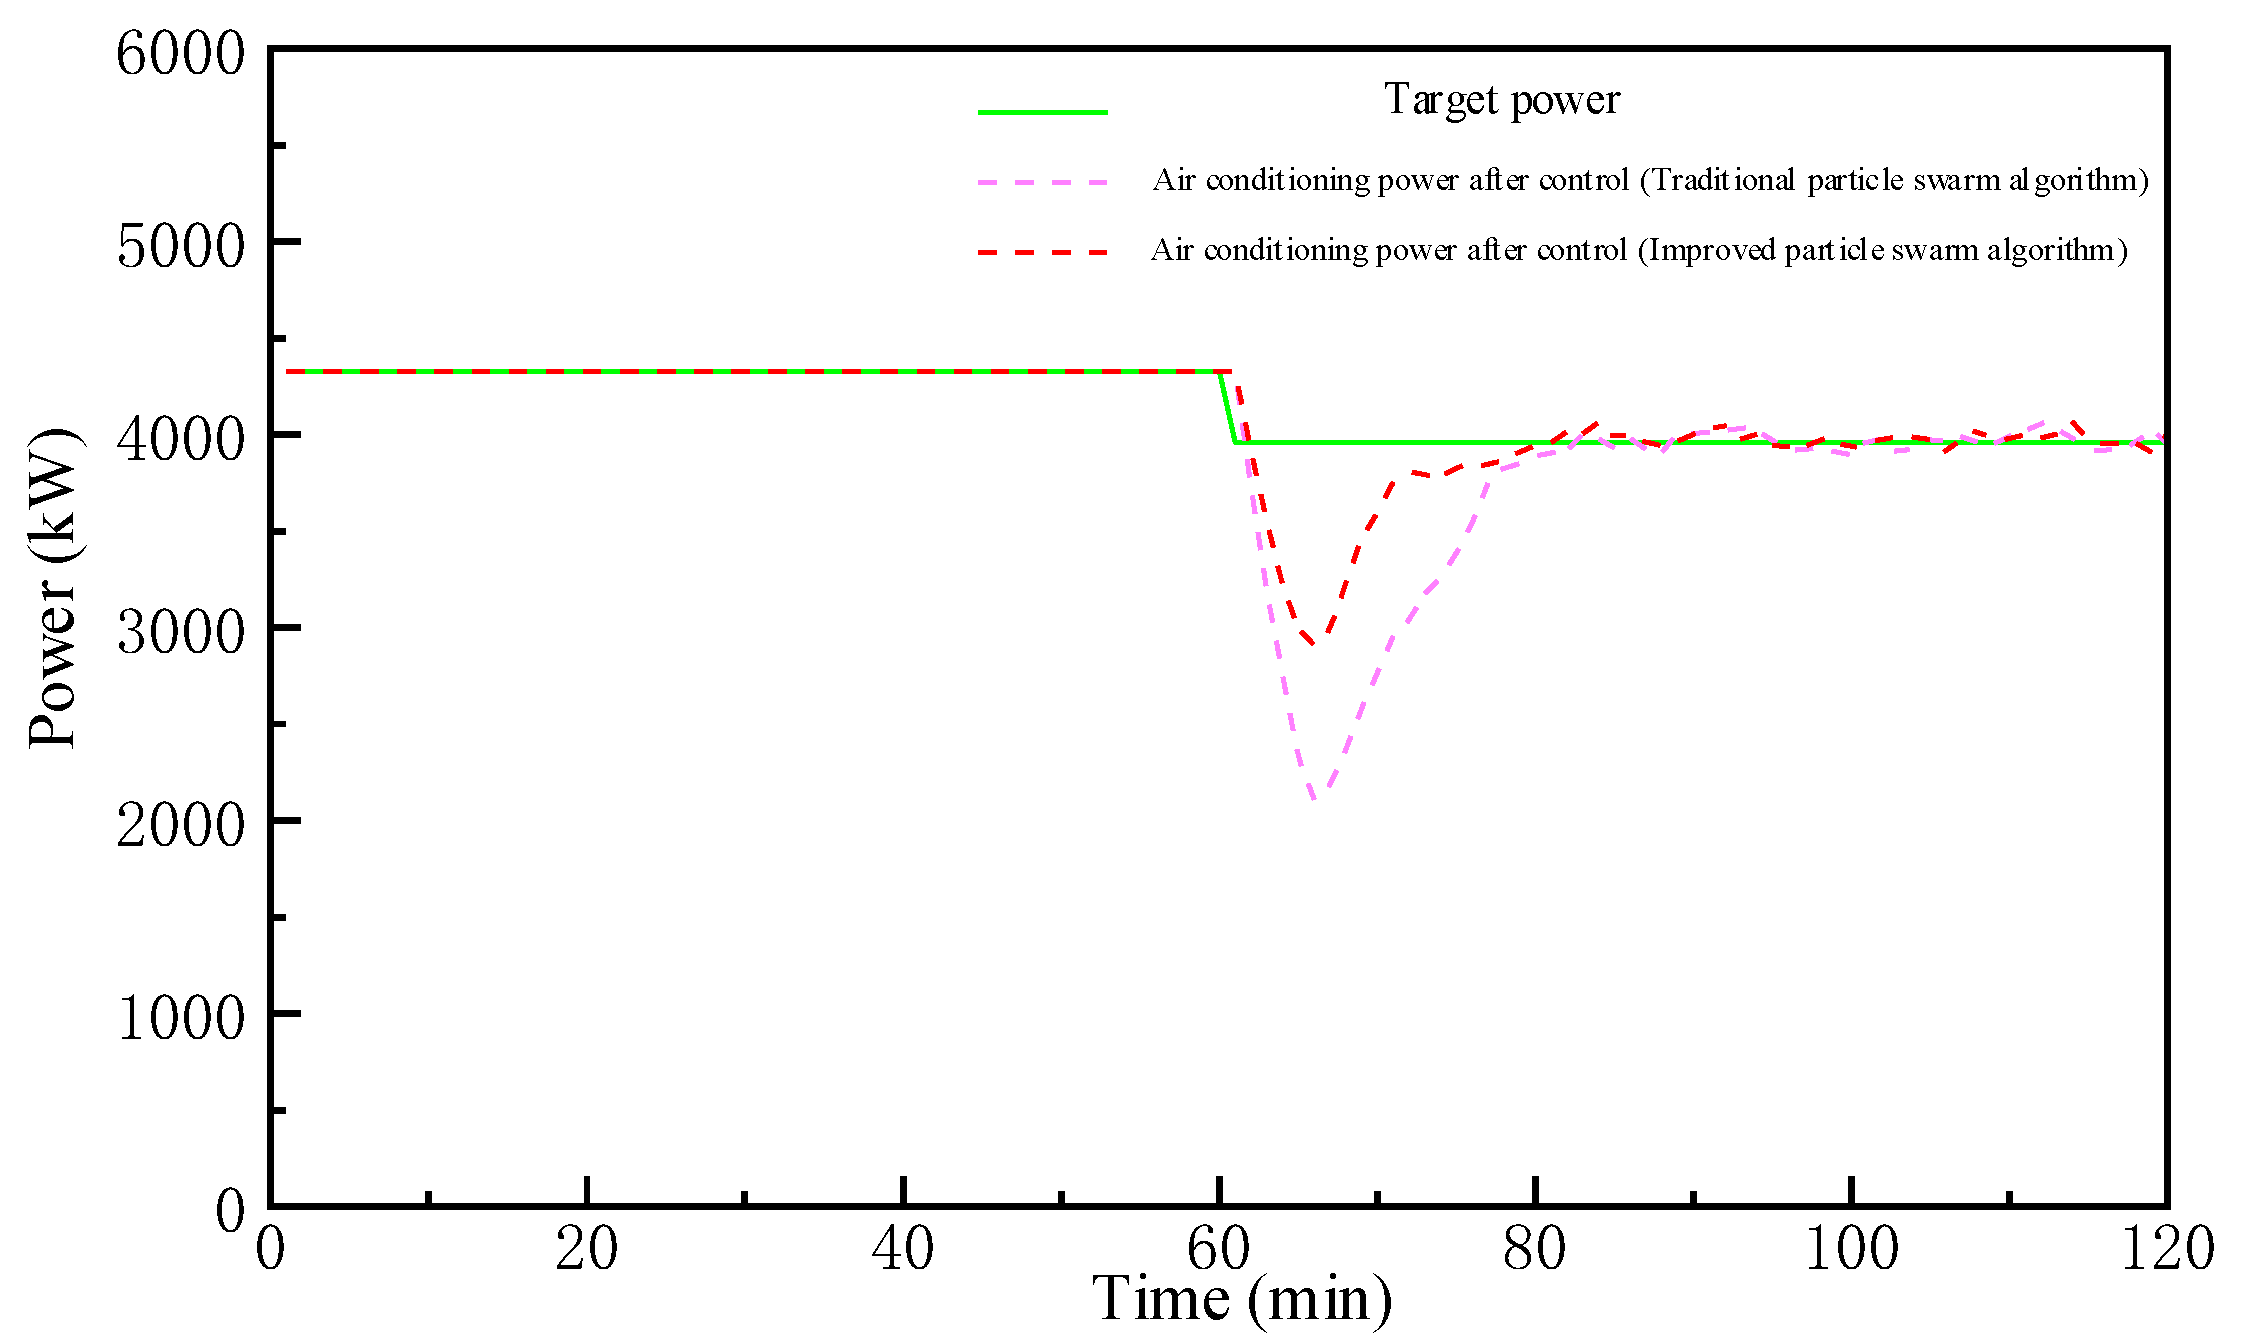
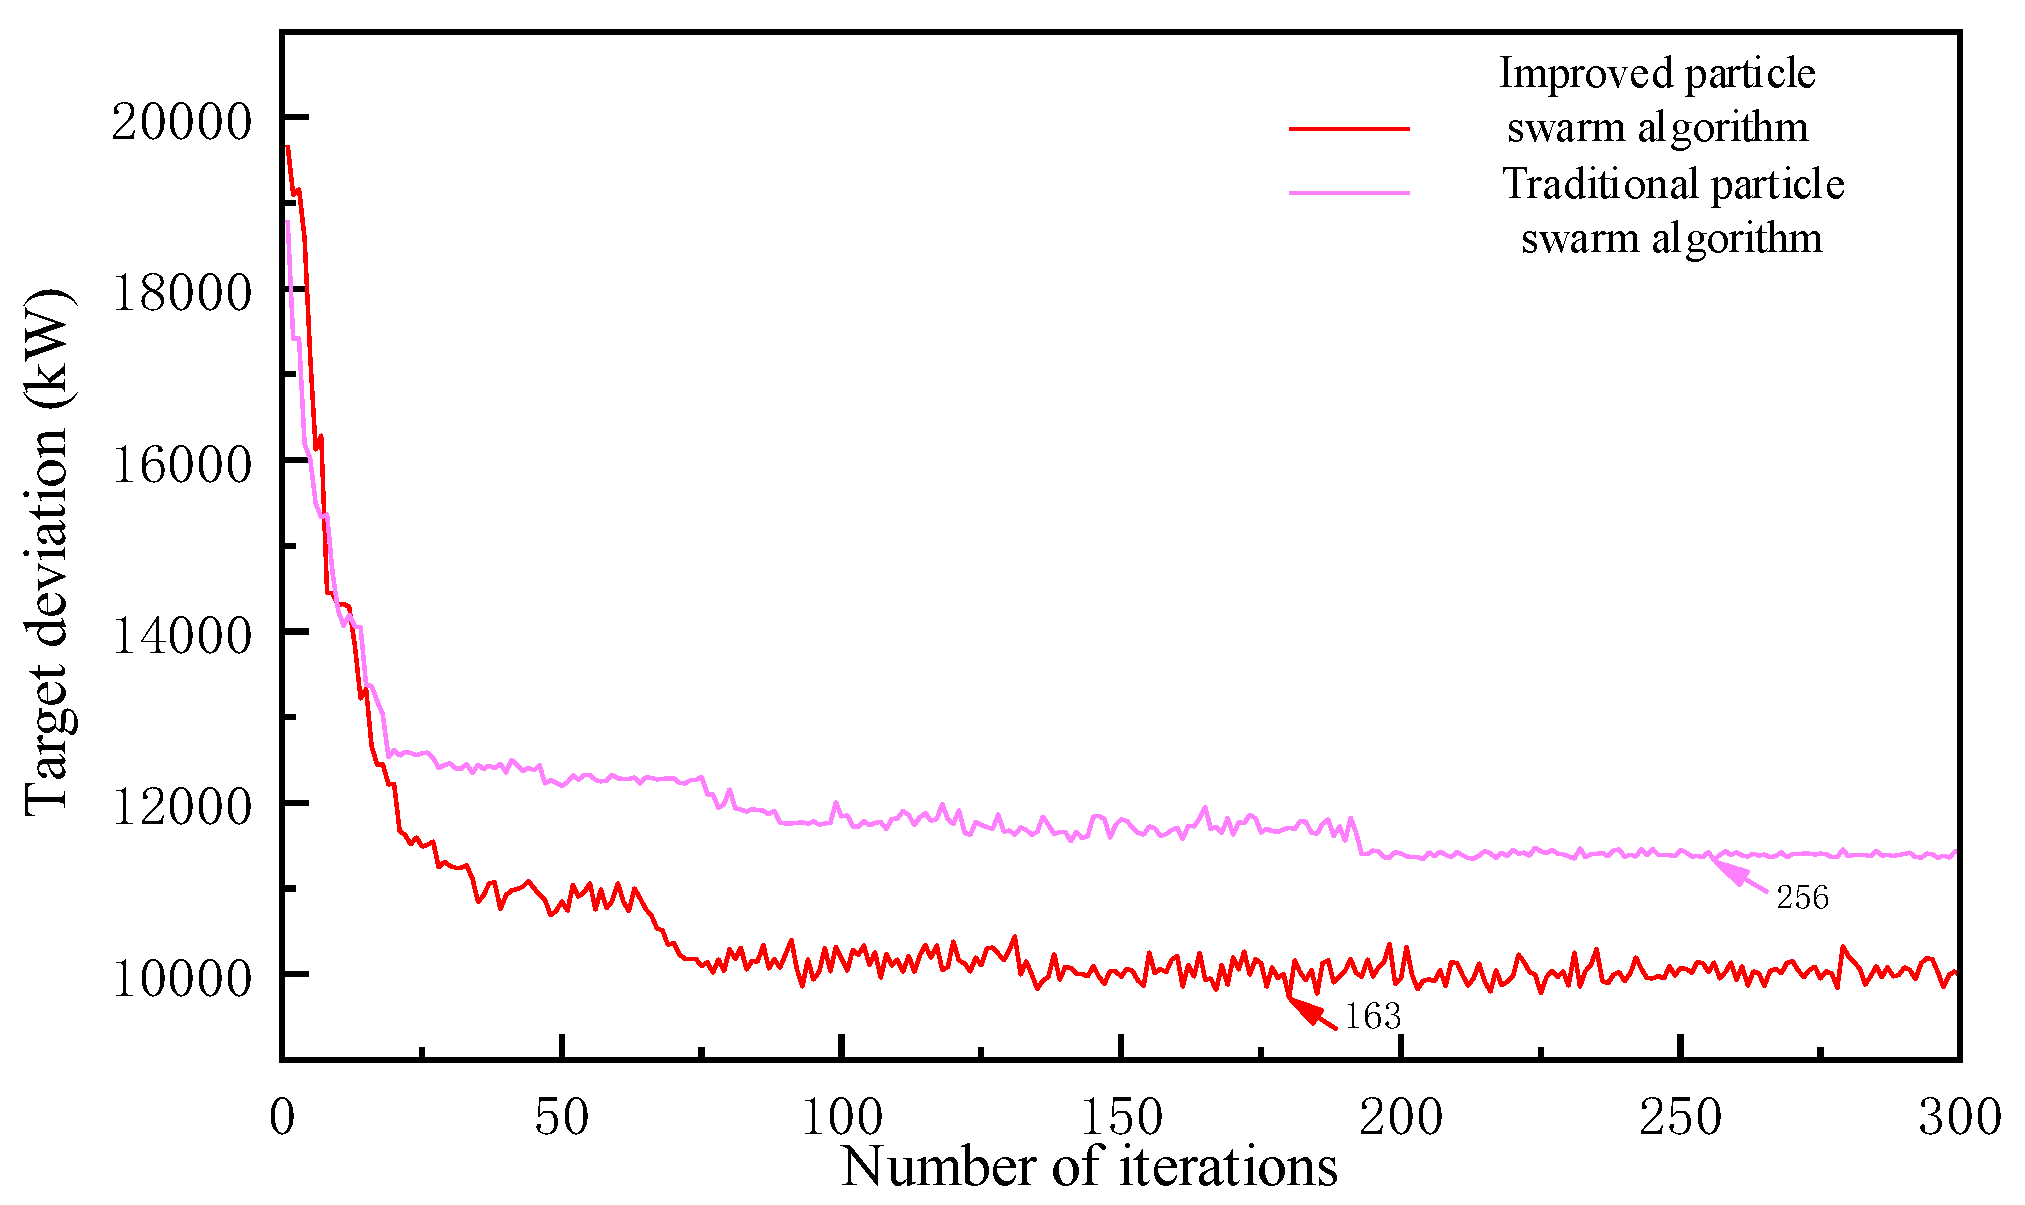
4.4. Analysis of the Simulation Results of the Control Strategy

Assume that the users accept the direct load control, where the range for the acceptable controlled temperature is [24, 28] °C. The targeted peak shifting ratio is set to 8% under the exterior temperature of 31 °C. To verify the effectiveness of the proposed control strategy, the simulations are carried out by aggregating 10,000 constant-frequency air conditioners whose parameters are uniformly distributed, as in Table 2, into 30 aggregations according to the K-means algorithm. The proposed control strategy is also compared to the traditional PSO algorithm to prove its superiority. The comparison results are plotted in Figure 8.
It can be acquired from Figure 8 that the aggregated power for the 10,000 air-conditioning load is 4328.9 kW, with the reference power being 3982.6 kW. A power drop exists in the simulation results of both algorithms, which is due to the simultaneous regulation of the air-conditioning clusters. However, comparing the improved PSO algorithm to that of the conventional algorithm, the improved PSO algorithm drop is shallower and shorter, which benefits from the superior searching capability. This feature can also improve the active power dip issues to a certain degree when the large-scale conventional air-conditioning load is under control. After the active power drops, both algorithms follow the reference power, where there are smaller fluctuations for the improved PSO algorithm. Hence, the effectiveness of the proposed control strategy is validated, as is the control efficiency during power drops and normal operation.
To further analyze the convergence, computational time, and accuracy of the improved PSO and conventional PSO algorithms, the convergence is compared in Figure 9. It can be found from Figure 9 that the improved PSO algorithm gradually converges to the optimized solution when the number of iteration times is 75, and the globally optimized solution is obtained after 153 iterations. The computation time is 196.83 s. Nonetheless, the traditional PSO algorithm converges around the optimized solution after 190 iterations and ultimately obtains the optimized solution with 256 iterations. This proves that the improved PSO algorithm has superiority over the traditional algorithm in the aspects of convergence and computation time. Additionally, the optimization error for the improved PSO algorithm is 9727.14 kW, which is much smaller than the 11,684.27 kW of the traditional algorithm. This indicates that the improved PSO algorithm has better computational accuracy, which further validates the improved PSO algorithm.

5. Conclusions

This paper focuses on the traditional temperature-controlling load of constant-frequency air conditioners, constructs a theoretical model for constant-frequency air conditioners and its aggregated power model, and investigates the demand response capability considering the users’ thermal comfort. Moreover, the packet control strategy for air-conditioning load is proposed based on the improved PSO algorithm. The corresponding simulations are conducted to validate the effectiveness. Several conclusions are made as follows:
  • Monte Carlo aggregation analysis is adopted based on the first-order ETP model. Combined with the users’ requests, such as users’ thermal comfort, the maximum theoretical capability for the load shedding of the air conditioners is up to 45%, which has significant demand response capability.
  • The improved PSO algorithm-based control strategy for the aggregated air-conditioning load can accurately control the air-conditioning following the reference load. Additionally, it is superior to the traditional PSO algorithm in computation speed, convergence, precision, and load fluctuation, which can illuminate the practical application of the air-conditioning load accurately participating in the demand response.

Author Contributions

Conceptualization, Q.L. and G.F.; Methodology, Q.L.; Software, Q.L. and W.L.; Validation, J.H.; Formal analysis, G.F. and G.M.; Investigation, Q.L. and J.H.; Resources, G.M.; Data curation, G.F. and W.L.; Writing—original draft, Q.L. and G.F.; Writing—review & editing, Q.L. and W.L.; Visualization, G.F. and J.H.; Supervision, G.M. and J.H.; Project administration, G.M.; Funding acquisition, G.F. and W.L. All authors have read and agreed to the published version of the manuscript.

Funding

This work was financially supported by State Grid Jiangsu Electric Power Co., Ltd. Science and Technology Project (5210EF21002N) and Jiangsu Province Carbon Peak Carbon Neutralization Science and Technology Innovation Special Fund (Industry Prospect and Key Core Technology Tackling—Topic) (BE2022003-5).

Data Availability Statement

The study does not report any data.

Conflicts of Interest

The authors declare no conflict of interest.

References

  1. Yang, X.; Fu, G.; Liu, F.; Tian, Y.; Xu, Y.; Chai, Z. Potential evaluation and control strategy of air conditioning load aggregation response considering multiple factors. Power Syst. Technol. 2021, 46, 1–17. [Google Scholar]
  2. Muhammad, W.; Lin, Z.; Ding, Y.; Wen, F.; Liu, S.; Ivo, P. Technologies and Practical Implementations of Air-conditioner Based Demand Response. Mod. Power Syst. Clean Energy 2021, 9, 1395–1413. [Google Scholar]
  3. Cai, Z.; Wu, J.; Wang, R. Coordinated control research for voltage and reactive power of distribution network considering virtual energy storage of air-conditionings. Power Demand Side Manag. 2021, 23, 63–68. [Google Scholar]
  4. Hu, X.; Shao, L.; Gu, X.; Yu, M.; Chen, P.; Zhu, H.; Wang, Z. Hierarchical Control Architecture and Decentralized Cooperative Control Strategy for Large Scale Air Conditioning Load Participating in Peak Load Regulation. In Proceedings of the International Conference on Electricity Distribution, Tianjin, China, 30 December 2018; pp. 2925–2930. [Google Scholar]
  5. Zhang, T.; Jiang, X.; Zhang, H. Optimal dispatching of load aggregator considering refined potential evaluation. Power Demand Side Manag. 2022, 24, 15–21. [Google Scholar]
  6. Guan, G.; Xin, J. Grouping Control Method for Air Conditioning Load. Autom. Electr. Power Syst. 2016, 40, 40–46. [Google Scholar]
  7. Yang, D.; Lin, Z.; Lai, W.; Zhang, S.; Zhang, X. Load control strategy under the background of virtual power generation. Power Demand Side Manag. 2020, 22, 48–51. [Google Scholar]
  8. Wang, T.; Liu, X.; Wu, M.; Bao, Y.; Zhang, C.; Xu, Q.; Zhao, J. Research on load aggregation modeling and tracking control scheme for large scale air conditioning. Power Demand Side Manag. 2020, 22, 51–56. [Google Scholar]
  9. Zhao, J.; Zhao, B.; Gu, P.; Zhang, P. Coordinated control strategy of HVAC cluster based on interaction capability curve. Power Demand Side Manag. 2021, 23, 17–23. [Google Scholar]
  10. Nariman, M.; Julio, H.B.; Maria, M.S.; Samuel, R.W. Model Predictive Control of Distributed Air-Conditioning Loads to Compensate Fluctuations in Solar Power. IEEE Trans. Smart Grid 2017, 8, 3055–3065. [Google Scholar]
  11. Saxena, A.; De, M. Demand Response Management of Residential Loads with Integrated Temperature Dependent Appliances. In Proceedings of the 2018 Fifth International Conference on Emerging Applications of Information Technology (EAIT), Kolkata, India, 12–13 January 2018; pp. 1–4. [Google Scholar]
  12. Tindemans, S.H.; Strbac, G. Low-Complexity Decentralized Algorithm for Aggregate Load Control of Thermostatic Loads. IEEE Trans. Ind. Appl. 2021, 57, 987–998. [Google Scholar] [CrossRef]
  13. He, H.; Borhan, M.; Kameshwar, P.; Tyrone, L. Aggregate Flexibility of Thermostatically Controlled Loads. IEEE Trans. Power Syst. 2014, 30, 189–198. [Google Scholar]
  14. Shah, Z.A.; Sindi, H.F.; Ul-Haq, A.; Ali, M.A. Fuzzy Logic-Based Direct Load Control Scheme for Air Conditioning Load to Reduce Energy Consumption. IEEE Access 2020, 8, 117413–117427. [Google Scholar] [CrossRef]
  15. Zhou, L.; Zhu, M.; Zhang, Z.; Yin, Q.; Qian, X.J. Design of progressive time-differentiated peak pricing mechanism for aggregated air-conditioning load. Power Demand Side Manag. 2019, 21, 11–16. [Google Scholar]
  16. Bao, Y.; Chen, P.; Hu, M.; Zhu, X. Control parameter optimization of thermostatically controlled loads using a modified state-queuing model. J. Power Energy Syst. 2020, 6, 394–401. [Google Scholar] [CrossRef]
  17. Nariman, M.; Braslavsky, J.H. Modelling and Control of Ensembles of Variable-Speed Air Conditioning Loads for Demand Response. IEEE Trans. Smart Grid 2020, 11, 4249–4260. [Google Scholar]
  18. Naqvi, S.A.R.; Kar, K.; Bhattacharya, S.; Chandan, V. Peak Power Minimization for Commercial Thermostatically Controlled Loads in Multi-Unit Grid-Interactive Efficient Buildings. IEEE Trans. Sustain. Energy 2022, 13, 998–1010. [Google Scholar]
  19. Ferdyn-Grygierek, J.; Grygierek, K.; Gumińska, A.; Krawiec, P.; Oćwieja, A.; Poloczek, R.; Szkarłat, J.; Zawartka, A.; Zobczyńska, D.; Żukowska-Tejsen, D. Passive Cooling Solutions to Improve Thermal Comfort in Polish Dwellings. Energies 2021, 14, 3648. [Google Scholar] [CrossRef]
  20. Hei, S.; Jiang, S.; Yang, J.; Zhang, J. The Developing Process and Applicability Analysis of Fanger PMV Thermal Comfort Model. Low Temp. Archit. Technol. 2017, 39, 125–128. [Google Scholar]
  21. He, P. Study on Indoor Air Conditioning System Based on Comfort. Degree Thesis, Chongqing university, Chongqing, China, 2010. [Google Scholar]
  22. Zhou, L.; Li, Y.; Gao, C. Improvement of Temperature Adjusting Method for Aggregated Air-conditioning Loads and Its Control Strategy. Proc. CSEE 2014, 34, 5579–5589. [Google Scholar]
  23. Xun, G.; Eduardo, C.; Julian, L.; Cardenas, B.; Bo, C.; Saleh, A.; Chang, L. Robust Hierarchical Control Mechanism for Aggregated Thermostatically Controlled Loads. IEEE Trans. Smart Grid 2021, 12, 453–467. [Google Scholar]
  24. Saeid, B.; Fathy, H.K. Modeling and Control of Aggregate Air Conditioning Loads for Robust Renewable Power Management. IEEE Trans. Control Syst. Technol. 2013, 21, 1318–1327. [Google Scholar]
Figure 1. First-order equivalent thermal parameter model of air-conditioning load.
Energies 15 08985 g001
Figure 2. Diagram of temperature and air-conditioning start–stop state over time.
Energies 15 08985 g002
Figure 3. Monte Carlo aggregation process.
Energies 15 08985 g003
Figure 4. Users’ thermal comfort.
Energies 15 08985 g004
Figure 5. Flow chart of the improved PSO algorithm.
Energies 15 08985 g005
Figure 6. Total polymerization power of different polymerization quantities.
Energies 15 08985 g006
Figure 7. Average load power of a single air conditioner under different numbers of aggregates.
Energies 15 08985 g007
Figure 8. Simulation results of control strategy example.
Energies 15 08985 g008
Figure 9. Comparison of algorithm convergence.
Energies 15 08985 g009
Table 1. The linear distribution of air-conditioning polymerization group status.
Group12345678910Total
Initial123456789103
1234567891013
2345678910123
3456789101233
4567891012343
5678910123453
6789101234563
7891012345673
8910123456783
9101234567893
10123456789103
11234567891013
12345178910123
Table 2. Load parameter range of fixed-frequency air-conditioning.
ParametersRangeParametersRange
R[4.76, 6.36] T s e t [24, 26]
C[0.13, 0.23]δ[1]
P[2, 3]η[2.6, 2.8]
Table 3. Average power of polymeric air-conditioning unit at different outdoor temperatures (kW).
Exterior Temperature
26272829303132333435
0.29 0.34 0.40 0.45 0.60 0.66 0.69 0.78 0.78 0.83
0.22 0.29 0.34 0.40 0.45 0.60 0.66 0.69 0.78 0.78
0.14 0.22 0.29 0.34 0.40 0.45 0.60 0.66 0.69 0.78
0.00 0.14 0.22 0.29 0.34 0.40 0.45 0.60 0.66 0.69
0.00 0.00 0.14 0.22 0.29 0.34 0.40 0.45 0.60 0.66
0.00 0.00 0.00 0.14 0.22 0.29 0.34 0.40 0.45 0.60
0.00 0.00 0.00 0.00 0.14 0.22 0.29 0.34 0.40 0.45
Publisher’s Note: MDPI stays neutral with regard to jurisdictional claims in published maps and institutional affiliations.

