Article

Agricultural Biomass-Based Power Generation Potential in Sri Lanka: A Techno-Economic Analysis

by
W. A. M. A. N. Illankoon
1,*,
Chiara Milanese
2,*,
Alessandro Girella
2,
Puhulwella G. Rathnasiri
3,
K. H. M. Sudesh
4,
Maria Medina Llamas
2,5,
Maria Cristina Collivignarelli
6 and
Sabrina Sorlini
1
1
Civil, Environmental, International Cooperation and Mathematical Engineering, University of Brescia—Via Branze 43, 25123 Brescia, Italy
2
Department of Chemistry & Center for Colloid and Surface Science, University of Pavia—Viale Taramelli 16, 27100 Pavia, Italy
3
Department of Chemical and Process Engineering, University of Moratuwa, Bandaranayake Mawatha, Moratuwa 10400, Sri Lanka
4
Department of Applied Earth Sciences, Faculty of Applied Sciences, Uva Wellassa University, Passara Road, Badulla 90000, Sri Lanka
5
Unidad Académica Preparatoria, Plantel II, Universidad Autónoma de Zacatecas, Zacatecas 98068, Mexico
6
Department of Civil Engineering and Architecture, University of Pavia, Via Ferrata 3, 27100 Pavia, Italy
*
Authors to whom correspondence should be addressed.
Energies 2022, 15(23), 8984; https://doi.org/10.3390/en15238984
Submission received: 22 October 2022 / Revised: 18 November 2022 / Accepted: 23 November 2022 / Published: 28 November 2022

Abstract

:
Worldwide energy costs have grown in recent years due to the dwindling global fossil fuel resources and the increased reliance on them for global energy production. This is a common scenario in many nations, including Sri Lanka. As a developing country, Sri Lanka should encourage the diversification of its renewable energy supplies using locally available resources. In this regard, Sri Lanka can promote the use of agricultural residues for energy generation. The present work explores the energy potential of the solid waste generated by the rice industry: rice straw (RS) and rice husk (RH). A new approach was developed using statistical data on rice production and paddy cultivation in each district of the island. The obtained data were integrated into a geographic information system (GIS) to provide geo-referenced results. A physico-chemical characterization of the RS and RH was conducted to correlate the properties of raw materials to their potential energy generation. As an energy generation technology, the grate-fired combustion boiler accompanied by steam turbine cycle (GFC/ST) was selected. Our findings show that the total energy capacity using by-products of the rice industry is estimated to be 2129.24 ktoe/year of primary energy, with a capacity of 977 Mwe, producing 5.65 TWh of electricity annually. An economic analysis shows ten districts have a high profit index (PI > 1). The districts with the highest PI values are Anuradhapura, Ampara, Polonnaruwa, and Kurunegala, with annual energy potentials of 286 ktoe, 279 ktoe, 231 ktoe, and 160 ktoe, respectively. This work aims to aid future policy decisions by identifying potential districts in which to develop infrastructure for energy generation using agricultural waste, thus reducing net greenhouse gas emissions (GHG) of Sri Lanka.

1. Introduction

The world is experiencing an energy transition by replacing fossil fuels with low-carbon energy sources. The rate at which this transformation occurs varies across the globe. For each country, it depends on factors such as economic growth, access to technological innovation, and the implementation of institutional reforms [1]. Sri Lanka is a developing country in South Asia that has experienced consistent economic growth in recent decades. Sri Lanka’s energy consumption grew from 70 TWh in 2010 to 106 TWh in 2021 [2] and it is expected to increase in the following years. According to the Sri Lanka Energy Sector Assessment, petroleum provided 43.9% of the energy supply in 2019, followed by biomass (33.2%), coal (11.5%), hydropower (7.5%), and new renewable energies (3.9%) as primary energy sources [3]. As a result, in 2019, Sri Lanka produced only 44.6% of its energy from renewable energies (RE). Figure A1 shows the variation of each primary energy supply from 2010 to 2019. To meet energy demands while reducing carbon emissions, the country must encourage the use of RE. As a comparison, developing countries such as Brazil, Colombia, and Chile have already met their energy demands for using RE with values of 78.4%, 74.5%, and 47.2%, respectively [4]. At the 22nd session of the United Nations framework convention on climate change, the Sri Lankan government pledged to use 100% RE to generate electricity by 2050, with a short-term goal of fulfilling 80% of their energy demands by 2030 [5]. For this reason, the Sri Lankan government intends to build 10,000 MW of renewable energy capacity over the next ten years. To meet this goal, the Sri Lankan government is planning to add 104.62 MW of electricity using agricultural, municipal, and industrial sources by 2025 [6].
Hydropower, photovoltaics, wind turbines, and geothermal are mature and commercially available technologies. However, their widespread implementation in developing countries is hindered by the relatively high investment and maintenance cost. On the other hand, biomass power generation is a well-known alternative energy generation technology, and it is the most widely used RE source in Sri Lanka [7]. It can provide decentralized power generation to agricultural communities using locally available resources, while improving waste management practices. This study aims to estimate the capacity and energy production cost of agricultural waste (RS and RH) in Sri Lanka to aid future policy decisions in the country’s energy sector.

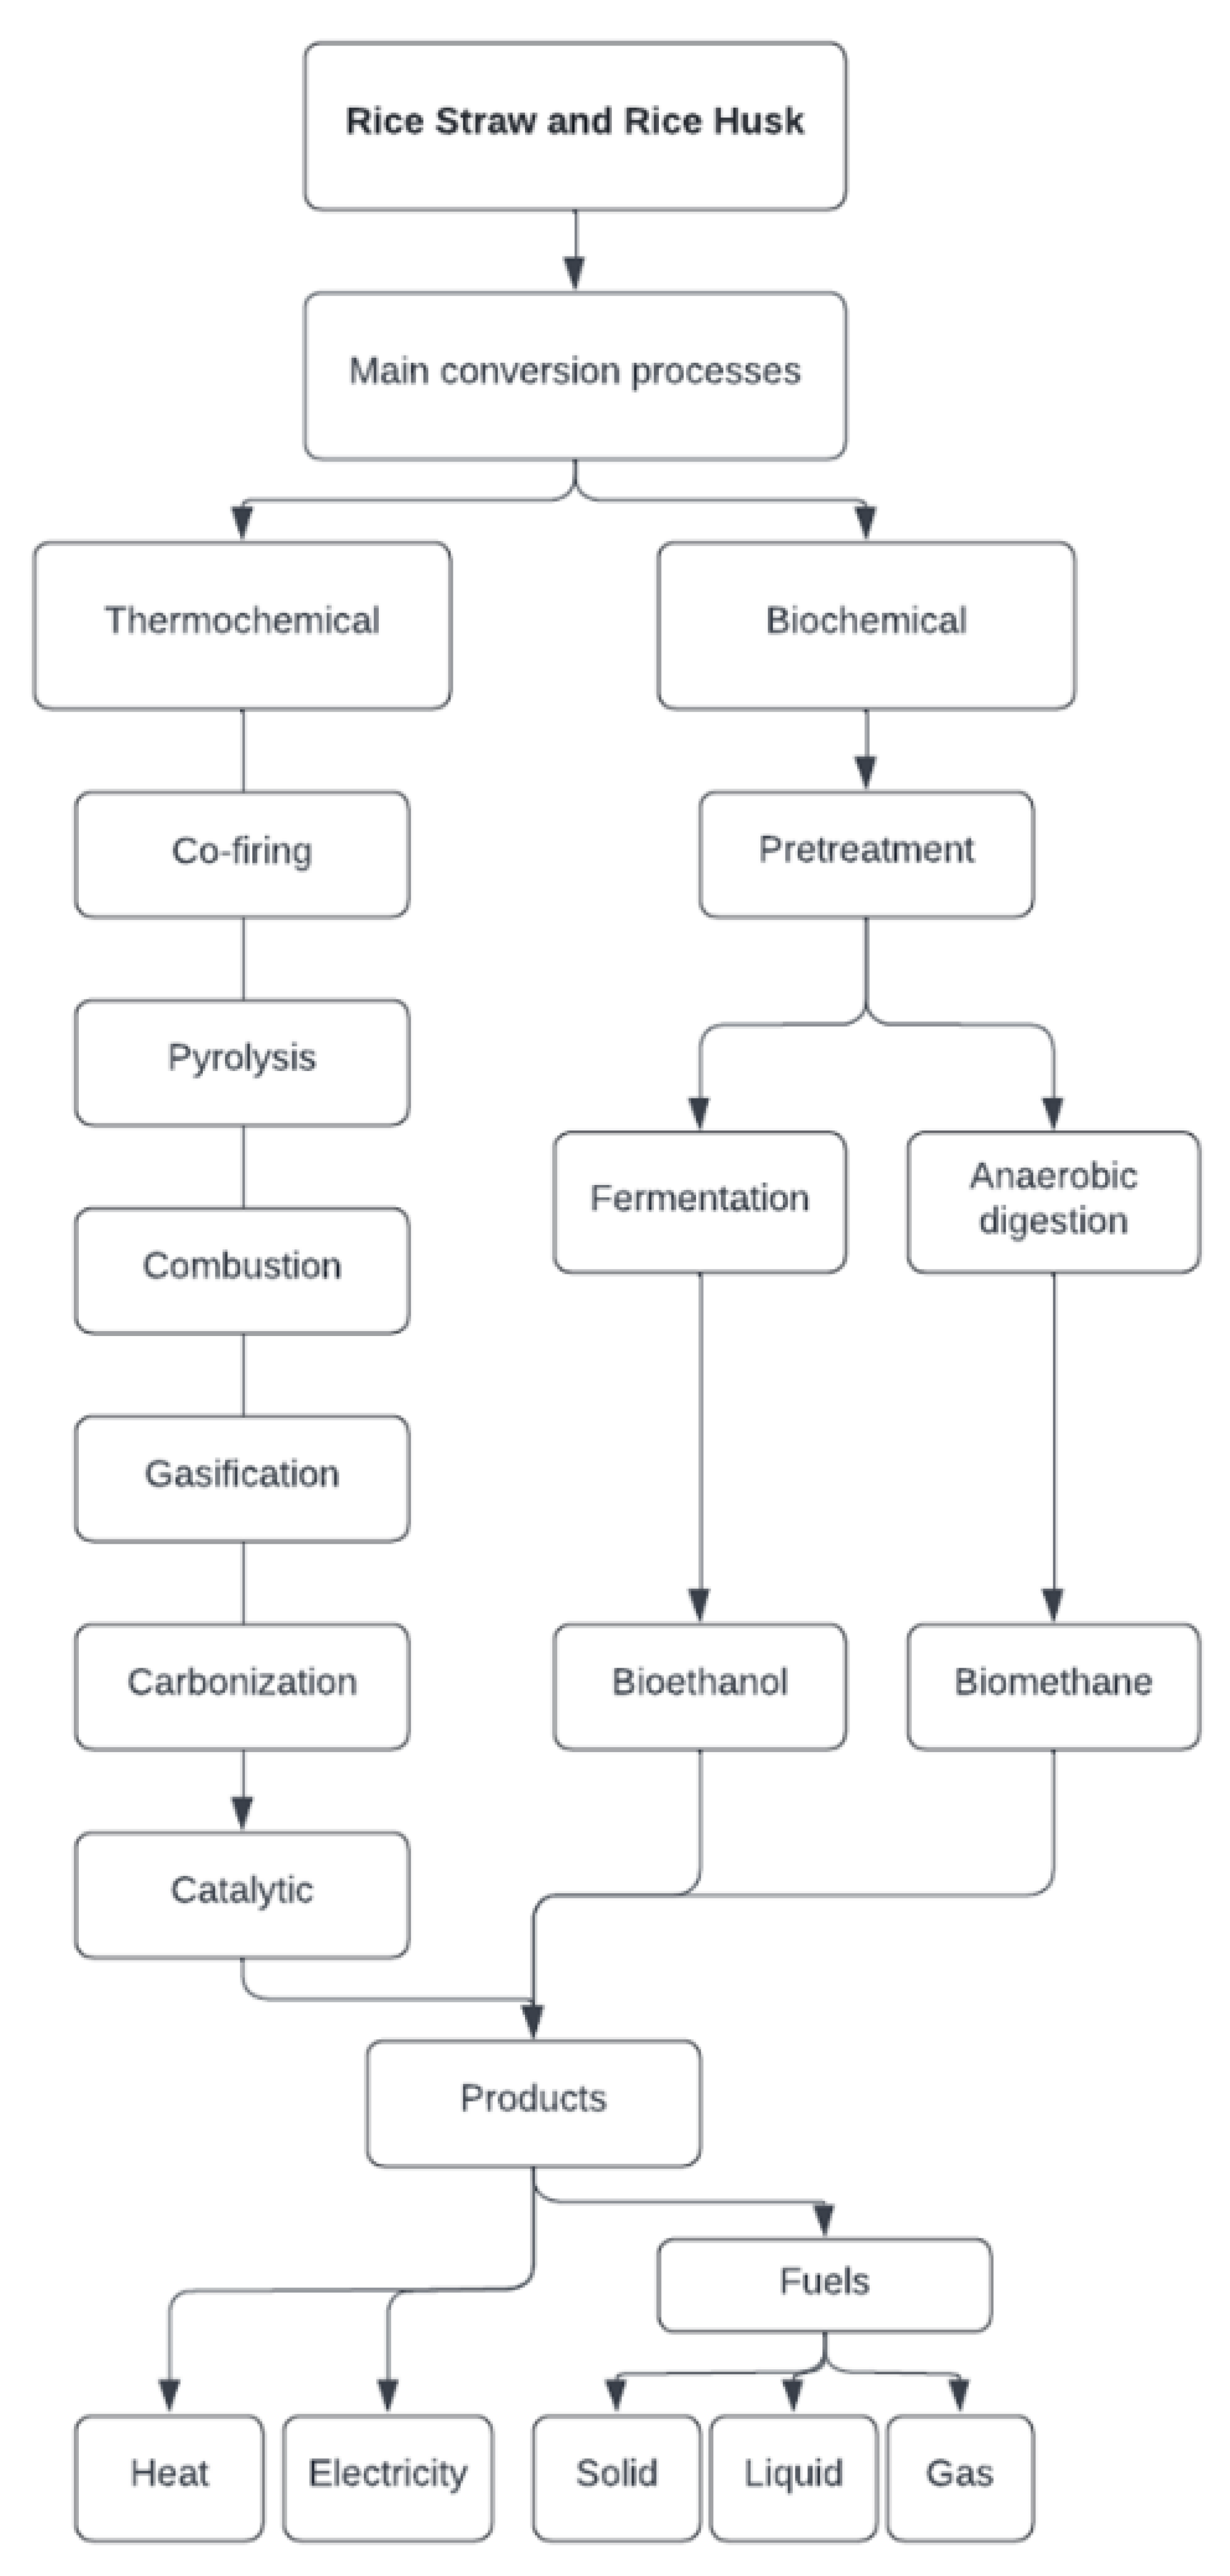
Biomass Generation and Energy Conversion

Agricultural food processing is the transformation of agricultural products into foods; from farm to fork. It consists of a set of value chains, each of which generates a significant amount of waste. In the last few decades, worldwide agricultural production has increased exponentially due to factors such as the expansion of soil for agricultural use, technological innovations, and accelerated population growth [8]. As an example, worldwide cereal production increased by 231% from 1960 to 2020 [9]. Agricultural waste follows the same trend. Based on conversion factors of grain residues to grain production, worldwide crop waste increased more than three-fold, from 1589 Mt in 1960–61 to 5280 Mt in 2020–21 [9]. It is widely known that agricultural waste is an excellent biomass source for RE production [10,11].
Biomass can be subjected to chemical or biochemical conversion technologies to obtain energy [8,12,13,14,15]. Figure 1 highlights the different biomass feedstocks, their conversion techniques, and the obtained renewable energy products [8,12,13,14,15,16]. For biomass, its widespread implementation as a RE is hindered by factors such as high investment costs, pre-treatment of the biomass, and uneven distribution of biomass [7]. In addition, the potential to obtain energy heavily relies on the physico-chemical properties of the biomass source [8]. Biomass can be utilized to provide a variety of energy sources, including thermal and electrical energy as well as fuel for the transportation industry.
Rice (Oryza sativa L.) has been a staple food in Sri Lanka since ancient times; the rice consumption per capita was close to 107 kg in 2019, according to the Sri Lanka Rice Research Center. The two main seasons for paddy harvesting in Sri Lanka are the Yala season (March to August) and the Maha season (September to December). The main agricultural wastes (by-products) of the rice industry are RH and RS. The rice plant’s vegetative part is referred to as rice straw. RS is produced by cutting and removing the plant’s grain, which consists of the paddy plant’s stem, leaves, and spikes. Rice husk is the rice grain’s hard protective covering; it is separated during the milling process. RH is also known as hull and chuff. The quantity and percentage of by-products of paddy processing depend on the type of rice, the geographical area, the growing season, weather conditions, the grinding rate, the market, and many other factors [24,25,26,27,28].
RS and RH can be converted into energy using various technologies such as anaerobic digestion, direct combustion, co-firing, pyrolysis, gasification, etc. [7,8]. Figure A2 shows possible energy generation technologies for RS and RH. Among these technologies, direct combustion and gasification are the most common and are applicable worldwide [29].
In a combustion process, RS and RH are burned in boilers to generate high-pressure steam, which is used to power steam turbine generators [30]. Gasification converts biomass into a mixture of gases (CO, H2, CO2, and CH4) called syngas. Gasification is achieved by reacting the feedstock material at high temperatures (>700 °C) and controlling the amount of oxygen and/or steam present in the reaction [31]. Although gasification is characterized by having higher efficiencies than combustion processes [32], direct combustion is the most widely used process for biomass conversion; it contributes to over 97% of biomass utilization around the world [33]. Using either a combustion or gasification method, there are many technological innovations for energy production such as fluidized bed combustion followed by a steam turbine (FC/ST), gasification with an internal combustion engine (GICE), grate-fired combustion followed by a steam turbine cycle (GFC/ST), and gasification combined cycle system (GCCS). Several reports emphasized that FC/ST has better performance than GFC/ST [10,34,35]. However, FC/ST is associated with higher investment costs [10]. GICE technology requires high-quality raw materials, meticulous operation, and has high investment costs; as a result, the technology is commercially available but not widely used [36]. GCCS is a highly efficient technology, but it is in early stage of development. On the other hand, GFC/ST is an economic technology, can operate a partial load, and has a low investment cost [34]. For these reasons, GFC/ST is an adopted technology in Sri Lankan industries that use fuelwood chips as a source of biomass. Consequently, for this study, GFC/ST was selected as the most appropriate power generation technology in Sri Lanka.
There are biomass power plants operating all over the world that use agricultural waste from the rice industry. For example, in 2000, a 36 MW power plant in Sutton, Ely, Cambridgeshire, capable of generating more than 270 GWh per year and using 200,000 tons of RS per year, was built. The total cost of this plant was £60 million [37]. In Argentina, a study conducted on the energy potential in the area of General Pueyrredón showed 723.6 GWh per year can be produced using herbaceous and vegetable residues derived from the agricultural activity in the region [38]. A similar study was done in Serbia’s energy-limited province of Vojvodina. The results show that crop residues, fruits, vines, forestry, and the wood processing industry could produce 9325 GWh of energy per year [39].
Sri Lanka, like other agricultural countries in Asia, has an abundance of agricultural biomass from the rice industry. However, its abundance varies from region to region. Therefore, this study explores the potential energy generation in Sri Lanka using RS and RH as agricultural waste. To carry out the study, physico-chemical properties, geographical distribution, and transportation costs were considered. In addition, other factors such as energy conversion methods, power plant size, energy production costs, operation, and maintenance costs of a GFS/ST plant were considered.

2. Methodology, Empirical Modeling, and Data

2.1. Chemical and Physical Analysis of Rice Straw and Rice Husk

To estimate the potential energy generation using RS and RH, it is necessary to have knowledge of their physico-chemical properties. Therefore, thermogravimetric analysis (TGA Q5000, TA Instruments Inc. New Castle, DE, USA) was carried out for RS and RH collected from the Northwestern Province of Sri Lanka to determine their moisture content, volatile matter, ash content, and fixed carbon content. The measurements were performed on about 5 mg of as-received samples by heating them from room temperature to 1000 °C at 5 °C/min in a Pt crucible under N2 flux. The derivative curve of the mass loss with respect to the temperature (DTG) was obtained by the Universal Analysis software provided by TA Instrument.
To identify the elemental compositions of the RS and RH, an EDX analysis was performed using as-received samples, following the guidelines provided by the standard method (ASTM E 1508) using a scanning electron microscope Zeiss EVO MA10 (Carl Zeiss, Oberkochen, Germany) with an Oxford XMax 50 mm2 detector. The measurements were performed under ultra-high vacuum at a working distance of 8.5 mm and with an electron generation voltage of 20 kV.

2.2. Determination of Energy Potential

We have estimated the maximum energy available from paddy industry by-products. RS and RH are considered as potential energy sources for this assessment. The heating value (or calorific value) is defined as the energy content of a fuel from a thermochemical conversion process [40]. The heating value of a fuel is often expressed as either a high heating value (HHV) or low heating value (LHV). The former, HHV, is the total amount of energy released after combustion of a given fuel, assuming all water existing in the fuel, as well as the water formed during combustion, is in a condensed state [40,41,42,43]. The LHV is defined as the net heating value of a fuel minus the latent heat of vaporization of water. Therefore, for calculations of the LHV, it is assumed that the water remains in vapor state at the end of the combustion process [40]. As the HHV calculation method is time-consuming, complex, and prone to experimental errors [40], the LHV calculation method was selected throughout this investigation. The energy potential of the by-products under consideration is generally based on two basics assumptions: the quantity of waste generated of the two seasons (Yala and Maha) in 2019/2020 and the LHV of each residue. The data were taken from Sri Lanka Rice Research Center with an ascertained geographical disaggregation.
In this analysis, the energy potentials of RS and RH were calculated from statistical data using Equations (1) and (2). The energy potential of each district was integrated into a Geographic Information System (GIS) to provide geo-referenced results for each district.
E R S = n P n   W R S   Q R S  
E R H = n P n   W R H   S R H   Q R H  
ERS and ERH are the total energy potentials of RS and RH, respectively; Pn is the annual paddy production in n district; WRS and WRH are the ratios of the weight of by-products (either RS or RH) to the weight of rice produced, and the values are 1.25 kg RS/kg rice and 0.24 kg RH/kg rice, respectively. Figure 2 depicts the by-products and usable production ratios in each step from rice production to consumption, these values are based on the literature [24,25,26,27,28]. SRH is the excess RH remaining in the environment, accounting for 30% of total RH production [7]. Due to the null applications of RS, it is assumed that all the amount of RS generated will be used for power generation. QRS and QRH are the LHV of the RS and RH, which are 14.43 MJ/kg and 12.01 MJ/kg, respectively.

2.3. Economic Analysis

Grate-Fired Combustion Followed by a Steam Turbine Cycle (GFC/ST)

A GFC/ST power generation technology was selected to treat the waste from the paddy industry. In this study, it was hypothesized that the waste generated in each district would be used to generate energy in the same district. This concept is like establishing decentralized biomass power plants in each district. To estimate the power of a GFC/ST power plant in each district, Equation (3) is used. The values were integrated into the GIS to provide geo-referenced results in each district.
W n = E R S , n + E R H , n h   η  
where Wn is the power of a GFC/ST plant that uses the RS and RH generated in district n, ERS and ERH are the energy potentials of both residues in district n expressed as (MWth/year), h is the number of hours operating in a year (h/year), which is 7000 h per year [10], and η is the electrical efficiency of the GFC/ST power plant. The expression for obtaining η is taken from [34] and is calculated by using Equation (4).
η = 0.0323 ln X + 0.1545
where X is the size of the power plant, and it is given in MWth
Different capacities of biomass-based power plants have been installed around the world. However, a 50 MW power plant is the most common biomass-based combustion facility [44]. Although a capacity of 300 MW is the highest reported unit without any technological limitations [45], the capital cost per unit of energy goes down as the capacity of biomass-based power plants goes up [46].
After estimating the capacity of the power plant, the net present value (NPV) is used to calculate the economic profitability of plants in each district by using Equation (5).
NPV = t = 1 N ( R O C ) ( 1 + i ) t I C  
The Profitability index (PI) can be calculated by using Equation (6).
PI = t = 1 N ( R O C ) t / ( 1 + i ) t I C  
In the first 20 years, the fee will remain at a flat rate without any increases [7]. N is the plant’s life, taken as 20 years, R (LKR/year) is the plant’s annual income from the sale of generated electricity, OC (LKR/year) is the annual operating cost, i is the discount rate, which was assumed to be 15% [7], and IC (LKR) is the total investment cost of the GFC/ST plant. Investment cost is calculated by using Equation (7) [46].
IC = 4.89⋅(Capacity)0.85
IC is given in million USD dollars ($) and plant capacity is given in MW.
Converts monetary value to LKR using October 2022 exchange rate (1 USD = 360 LKR). The revenue of the power plant is calculated by using Equation (8) [10].
R = Wn h Tf
where Tf is the current tariff declared by the Public Utilities Commission of Sri Lanka (PUCSL) under a standard energy purchase agreement (SPPA) [47]. Under this system, there are two tariff options in Sri Lanka: three-tier tariff and flat tariff. For this analysis, a flat tariff of 17.71 LKR/kWh was considered for energy production from biomass (agricultural and industrial waste). The operating costs, OC (LKR/year) are composed of operational and management (O&M) costs. O&M costs are taken as a fraction of investment costs. According to the literature data, this value varies from 3% to 7% [7,10,34,35,44,46]. Therefore, the O&M costs were set at 5%. RS is commonly used as an energy source, animal feed, composting process, cattle bedding, paper industry, handicraft, and agricultural cover material [48]. However, since RS has no economic value, farmers are used to burning it on paddy fields to prepare the soil before the next ploughing process. RH is also used as a primary energy source in rice mills, a silica-rich cement solution, and in poultry farming [25]. It is also used sporadically as a fertilizer and as a construction material [49]. However, RH frequently ends up in landfills or open fires, causing significant environmental pollution. This excess amount of RS and RH is the basis for this analysis. Furthermore, based on information obtained from various stakeholders from the Sri Lankan paddy industry, their prices are negligible. However, if there is a genuine market demand for RS and RH as an energy source, this assumption will not be valid, and farmers and millers will set a fixed price. In the meantime, the prices of RS and RH are excluded from this study. The transportation costs of RS and RH are calculated by using Equation (9) [46].
CRS,RH = 2 × 10⁻¹⁹ (Capacity)3 − 6 × 10⁻¹³ (Capacity)2 + 2 × 10⁻⁶ (Capacity) + 12.767
Plant capacity is given in MW. Table 1 summarizes all economic parameters used in this analysis.

3. Results

3.1. Chemical and Physical Properties of Rice Straw and Rice Husk

3.1.1. Thermogravimetric Analysis

TGA can provide details on the thermal stability and volatile organic contents of the sample. Moreover, it can be used in combination with other analytical methods to model the performance of biomass for the generation of energy. Figure 3 and Figure 4 show the thermograms of RS and RH respectively; the TGA and DTG curves are reported. The results show a similar behavior for both materials, as they have a similar chemical nature. Figure 3 shows the mass loss of RS; the graph shows four stages, each one associated with the mass loss. In the first stage, which occurs between 45 °C and 100 °C, 5.43% of the initial mass loss is due to the elimination of the moisture content of the sample. Between 140 °C and 310 °C, the second stage of mass loss (23.42%) is due to bound water and the first decomposition step of the organic compounds. Between 300 °C and 430 °C is the third stage of mass loss (40.61%), which is attributable to the elimination of different types of carbonaceous components such as lignin, cellulose, and hemicellulose [50]. The final stage, which occurs at temperatures ranging from 450 °C to 1000 °C, results in the loss of 9.88% of the initial mass due to the final elimination of various types of more stable carbonaceous components [51,52]. By the end of the process, 79.14% of the initial mass has been lost during the thermal process. Figure 4 represents the TGA of RH, mainly divided into four stages of mass loss, as it was for RS. The first stage of weight loss of around 5.35% occurs between 45 °C and 120 °C, due to the elimination of the moisture content of the sample. In the range from 150 °C to 310 °C, a weight loss of 16.79% occurs due to the removal of the fixed water content. Between 310 °C and 400 °C, 36.30% mass loss occurs due to the elimination of different types of carbonaceous components such as lignin and cellulose [50]. The last stage of weight loss (10.52%) occurs after further elimination of different types of carbonaceous components [51,52]. By the end of the process, 68.95% of the mass has been lost during the thermal treatment of RH.

3.1.2. Energy Dispersive X-ray Analysis (EDX)

Table 2 shows the elemental analysis of RS and RH. The amount of C, H, and O determines the gross calorific value of biomass. H is not visible by this technique, but C and O are detectable, which are the most abundant elements in the sample, followed by Si. The generation of NOx, which is one of the main aspects contributing to the environmental impact of biomass burning, is caused by nitrogen content; however, this element is not detected within the limits of EDX. Consequently, we cannot quantify the amount of N in RS and RH. Deposit formation and corrosion in the GFC/ST are caused by the presence of Cl and S, which are present in small quantities in the RS. Hence, they are important for the effective use of a machine. The above information is necessary to generate empirical molecular formulas and perform mass balances during the biomass conversion process [53,54,55]. The proximate analyses of RS and RH were compared based on several reports [7,24,25,26,27,28]. Table 3 shows the average value of each parameter for dry-basis samples. Reported values in the literature of the ash content from rice by-products show that the ash content of RH is higher than that of RS; these results agree with TGA analyses conducted in this study, which found the residual ashes from RH were higher than those found in RS (around 31% vs. 21%).

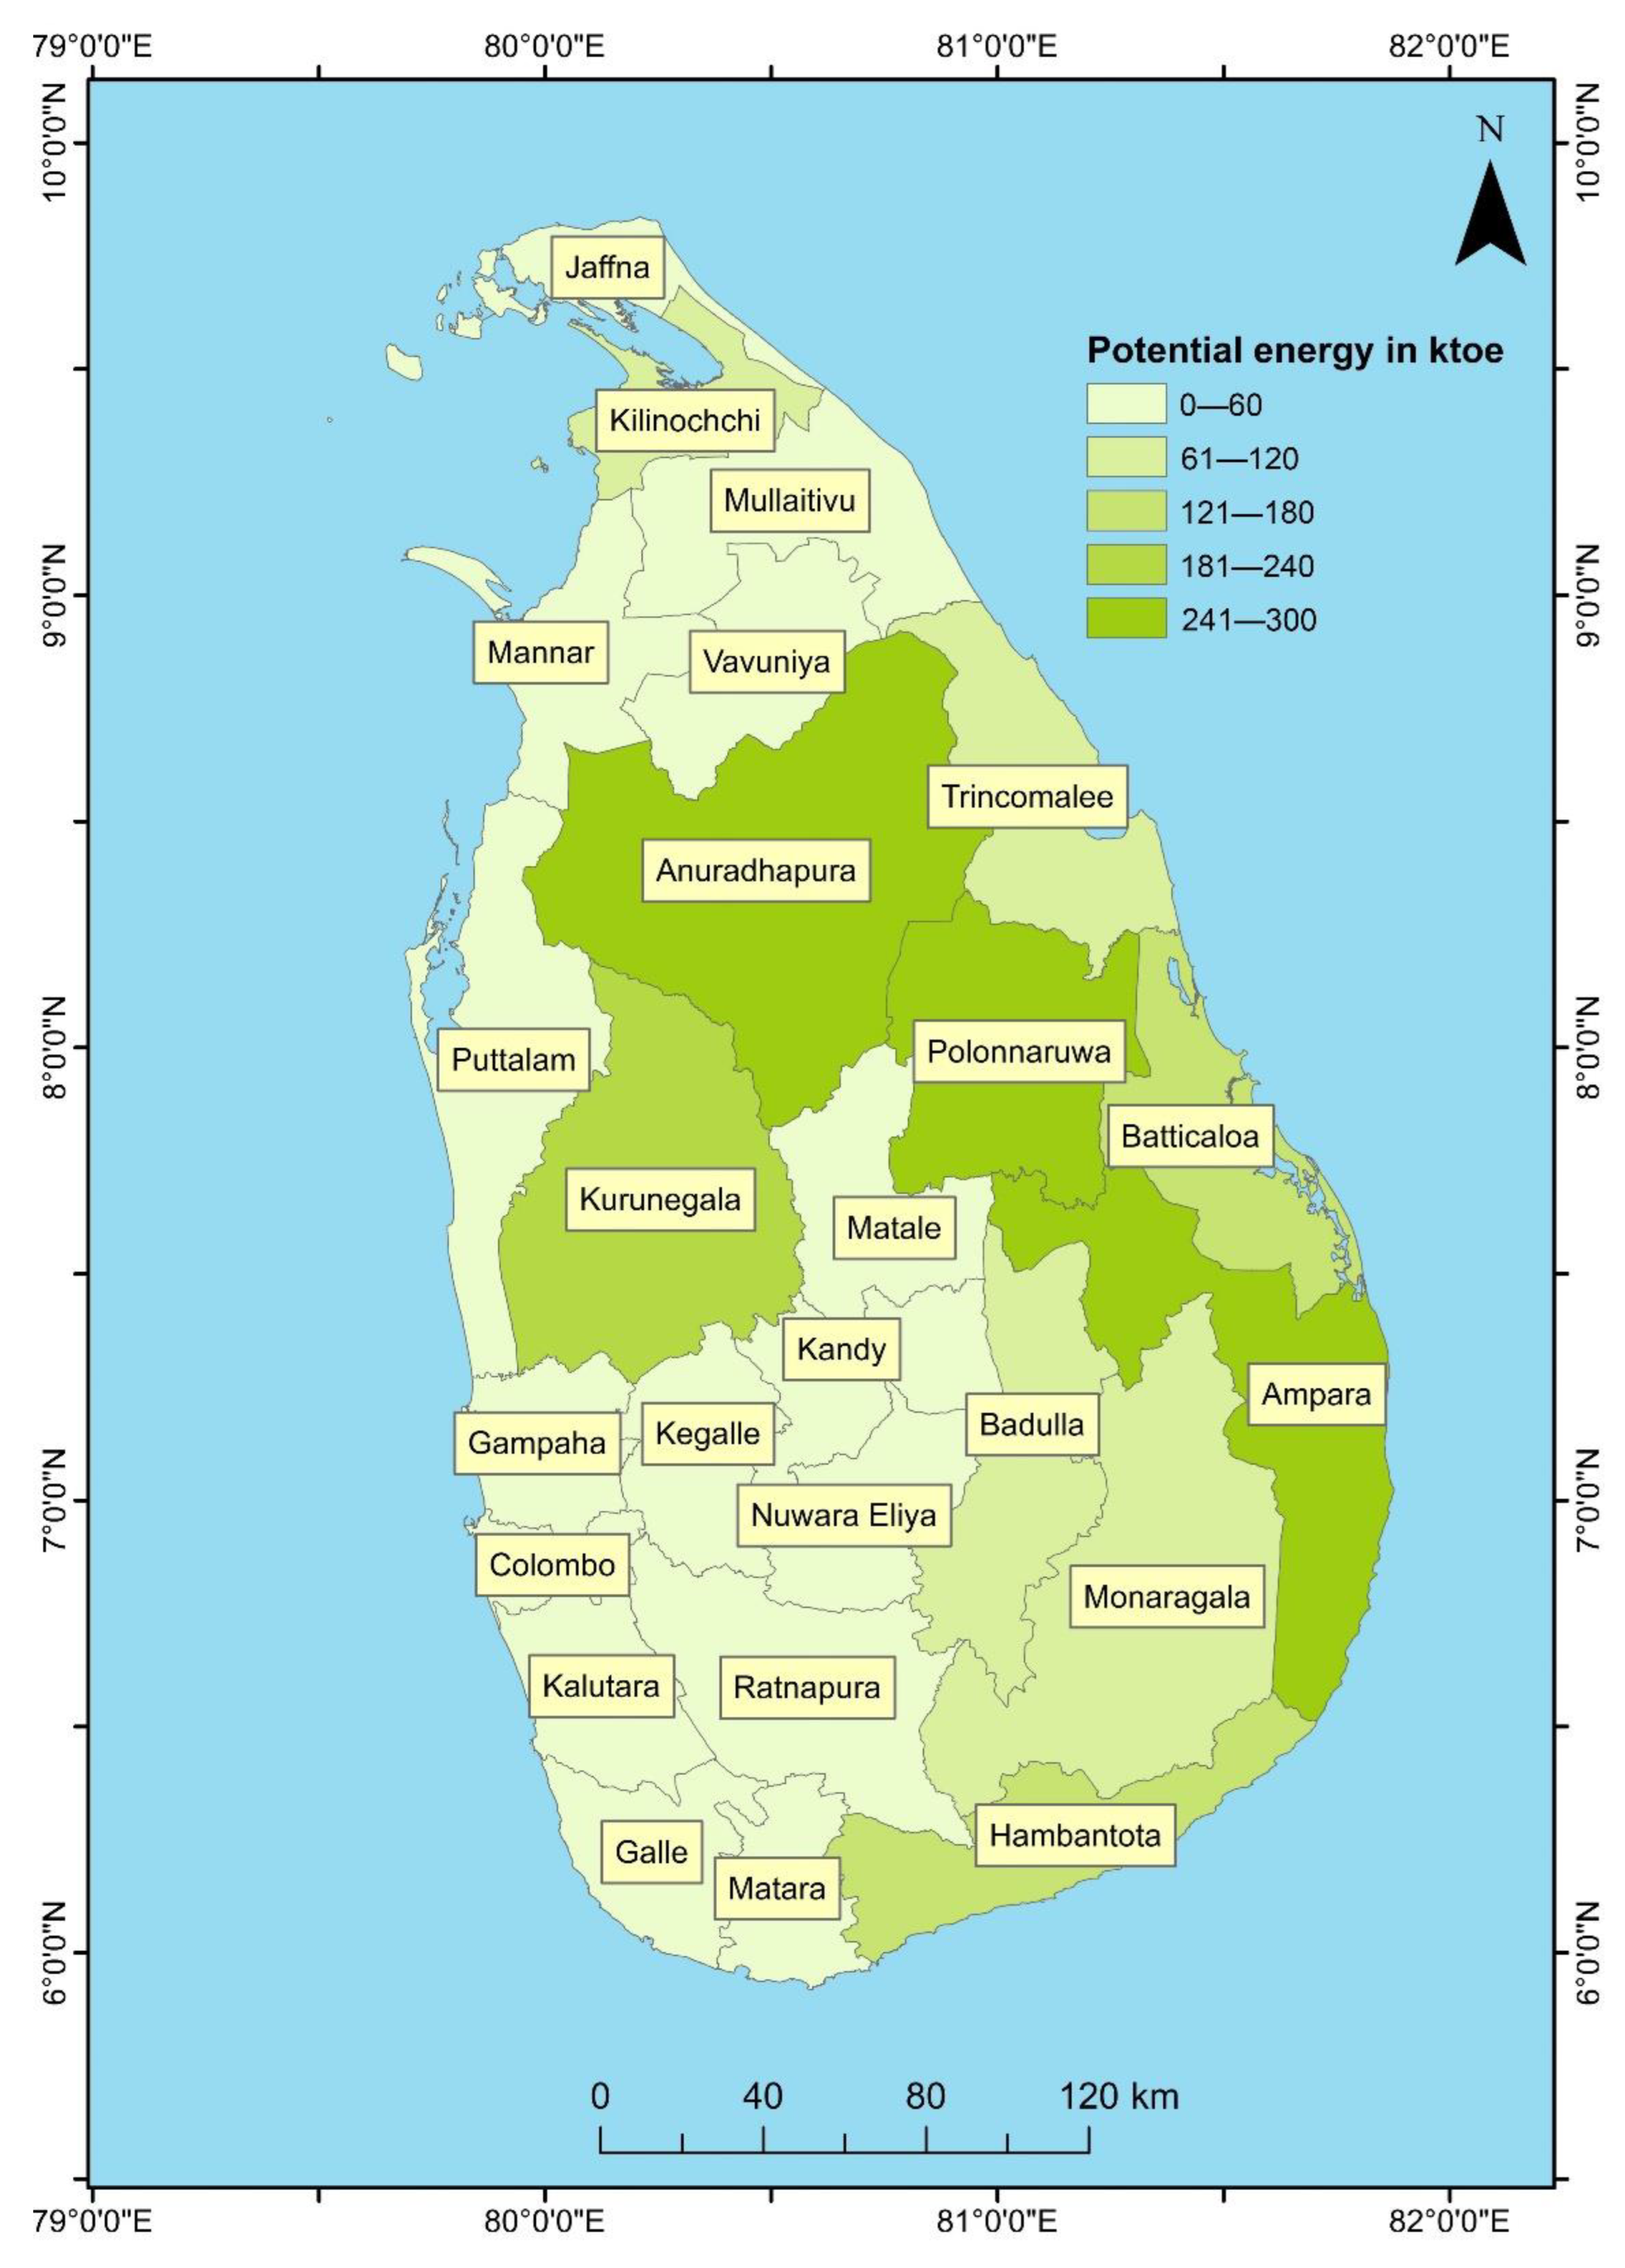
3.2. Energy Potentials

Paddy cultivation covers more than one million hectares and represents 34% of the total agricultural land in Sri Lanka. According to the data gathered for this investigation, Sri Lanka produces more than 4.7 million metric tons of paddy each year. This large-scale paddy production industry generates 5.9 million metric tons of RS and 1.1 million metric tons of RH per year (Figure 5). These by-products have the potential to contribute 2129.24 ktoe/year of primary energy to the national economy.
Figure 6 shows the geographical distribution of the energy potential of the by-products of the paddy industry in Sri Lanka. The districts of Anuradhapura (299.1 ktoe/year), Ampara (285.7 ktoe/year), Polonnaruwa (279 ktoe/year), Kurunegala (231 ktoe/year), and Hambanthota (160 ktoe/year) have the best potential for RS and RH energy generation. These districts are situated in the dry zone of Sri Lanka, where most of the rivers and irrigation tanks are found (Figure 7). This region of the country has a well-planned irrigation system. On the other hand, the lowest potential for energy production is in the Colombo and Nuwara Eliya districts, with 4.8 ktoe/year and 2.6 ktoe/year, respectively. Colombo is Sri Lanka’s largest industrial district; therefore, most of the land is used for other economic purposes. In contrast, Nuwara Eliya is known as a hilly area and its climate and geography are more conducive to tea growth; hence, a considerable area is dedicated to tea cultivation. However, all other districts represent energy potential ranging from 13 ktoe/year to 128 ktoe/year. These results reveal the significant potential for energy production from waste from the rice industry in all parts of the island.

3.3. Economic Analysis

Table 4 represents the potential GFC/ST power plant power (MWe), electricity generation (TWh), NPV, and PI from the by-products of the rice industry in the relevant districts with positive NPV and PI > 1. Figure 8 depicts the distribution of power plants on the island. Plant sizes vary from 32.98 MWe to 176.41 MWe. It is estimated that only 10 districts (excluding Badulla in the island’s dry zone) have the capacity to operate GFC/ST power plants profitably. It can also contribute a sum of 977 MWe and an electrical generation of 5.65 TWh/year as green energy. These data denote that there are only a few districts that have of a high potential of RS and RH, while the remaining districts have a low one; this is also represented in Figure 6.
According to the results of the sensitivity analysis, the discount rate and investment cost have the biggest influence on the economic viability of this type of project. Thus, a 50% rise in investment costs and a 5% increase in the discount rate will reduce the two lucrative power plants in the Killinochchi and Badulla districts. In addition, a 50% reduction in investment costs and a 5% reduction in the discount rate will increase the number of profitable plants. Furthermore, it affects the installation of new GFC/ST plants in the districts of Matale, Mullaitivu, Puttalam, and Vavuniya by providing a total of 93.1 MW of green energy. The operating and maintenance costs, as well as the pricing impact of the RS and RH, are important for analysis, but to a lesser extent than the discount rate and investment cost. Therefore, among the limitations analyzed, the cost of O&M and the transportation of RS and RH have the least impact on the economic viability of this type of power plant.

4. Discussion

For any country, the willingness to invest in RE increases as the benefit–cost ratio rises. This scenario is especially important for developing nations, where there is a tendency to grant minimal investments for the installation of new RE sources. Therefore, a key aspect will be giving economic incentives to stakeholders to ease the financial burden. In Sri Lanka, biomass energy generation is an established technology that has already been adopted by the population compared to other renewable technologies such as solar and wind. Therefore, a possible approach is the development and widespread implementation of biomass power plants. According to the information gathered from the stakeholders dealing with the value chain, and previous research conducted on the paddy industry, the surplus quantity of RS and RH in each district fluctuates and is not consistent across the country due to their diverse uses. According to millers from Sri Lanka, over 60% of the RH generated in mills is used to create energy for the parboiling process and drying purposes in the same mill. In general, parboiling and drying of rice are the main functions of the rice mill, which will affect the excess RH in each district. Other farmers report that 100% of the RS generated after harvesting is discharged into the field without being properly applied. As a result, a portion of the RS will degrade in the same field, while others will be used to feed animals, and the remainder will be burned to clear the field for the next cultivation. Hence, if biomass-based industry in Sri Lanka can use the total amount of RS generated in the above districts and manage to use only 30% of the RH generated in the same districts, they will be able to easily reach the energy potential of 5.65 TWh/year for power via a GFC/ST power plant. Furthermore, positive NPV and higher PI demonstrated that the economic viability of the projects is being implemented in the respective districts.
Furthermore, depending on the quantity of resources and financial viability, different sizes of GFC/ST power plants can be installed, such as commercial-scale rice residue power plants, small-scale rice residue power plants, and off-grid rice residue power plants. Introducing a power plant, on the other hand, may ensure national energy supply while also stimulating economic activity in the relevant district (Figure 9). In addition, it will help stimulate reverse logistics practices within the region. Reverse logistics is the study of reverse flow operations that reintegrate waste materials and by-products into the production process [57]. In this regard, by-products of RS and RH power plants can be employed in many industrial sectors of the economy, such as an absorbent material in water treatment [58,59,60,61,62,63,64,65,66], as a coating material [67], as a pigment [68,69], in the cement industry as a replacement of some portion of rice husk ash with other raw materials [70,71,72,73], as an insulator [74,75], as a filler in the rubber industry [76,77,78,79,80,81,82,83,84], and in the electronics industry [85,86,87,88,89].
These are in addition to co-processing, which involves the use of two or more different types of waste in the production or heat generation process. In this sense, co-processing in the cement kiln is the greatest available technique anywhere in the world for absorbing the waste material’s energy content. Cement manufacturing is one of the most energy-intensive businesses, relying heavily on traditional fuels. The cement industry in Sri Lanka is likewise heavily reliant on fossil fuels. A clinker kiln with a production capacity of 1000 tons per day, on the other hand, may burn up to 20 tons of rice husk [90]. As a result, reverse logistics has become increasingly significant in many organizations’ business strategies, not only because of the financial rewards but also because it satisfies environmental conservation laws.
However, stakeholders in the value chain of the rice industry suffer from a lack of knowledge of these types of energy generation methods and a lack of financial support. As a result, the generation of power from such waste is currently being debated. Hence, the government of Sri Lanka and other key bodies in the energy generation sector in the country, such as the ministry of power, the sustainable energy authority, the public utility commission, the ministry of agriculture, and the national institute of post-harvest management, should take the first step to shed light on incorporating agricultural waste into the energy generation process.
Since Sri Lanka is a developing country, the greatest impediment to the implementation of such projects is the lack of capital investment. If lenders refuse to provide financial help for the development of such projects in the country, investors who seek to implement such projects would be crippled. To overcome this problem, the government of Sri Lanka should lend a helping hand to future entrepreneurs through government banks or other public financial institutions to develop such power plants and promote such technologies in the community.
Finally, the findings of this study can be useful to policymakers in Sri Lanka’s energy and post-harvest sectors. Once a potential energy source has been identified, managers, stakeholders, and policymakers can easily determine the energy potential related to an area of interest. Finally, appropriate strategies can be designed for the valorization of agricultural wastes, including the use of incentives and rebates for companies. Therefore, this research is anticipated to be beneficial not only for Sri Lanka but also for many developing countries and rice-producing countries.

5. Conclusions

This study unveils that, if only 30% of RH and the whole RS production were managed, Sri Lanka’s yearly energy potential would be 2129.24 ktoe. However, profitability indexes revealed that only 10 districts can operate a GFC/ST plant with economic benefits. The total power generating capacity of the GFC/ST plant is 977 MWe, with an annual power generation capacity of 5.65 TWh. The districts with the highest potential for electricity production from RS and RH are Anuradhapura (299.1 ktoe/year), Ampara (285.7 ktoe/year), Polonnaruwa (279 ktoe/year), Kurunegala (231 ktoe/year), and Hambantota (160 ktoe/year). By the year 2030, Sri Lanka has pledged to obtain 80% of its electricity from renewable sources. This research suggests that RS and RH are a potential way to meet future energy targets.
Furthermore, a life cycle assessment can be conducted in Sri Lanka’s energy sector to compare the energy potential using biomass-based sources and traditional fossil fuels.

Author Contributions

Conceptualization, W.A.M.A.N.I.; methodology, W.A.M.A.N.I.; software, A.G., K.H.M.S. and M.M.L.; validation, W.A.M.A.N.I. and C.M.; formal analysis, W.A.M.A.N.I.; investigation, W.A.M.A.N.I.; data curation, W.A.M.A.N.I.; writing—original draft preparation, W.A.M.A.N.I.; writing—review and editing, W.A.M.A.N.I., C.M., P.G.R., M.M.L., M.C.C. and S.S.; supervision, C.M., P.G.R., M.C.C. and S.S. All authors have read and agreed to the published version of the manuscript.

Funding

This research received no external funding.

Data Availability Statement

The data presented in this study are available on request from the corresponding author.

Acknowledgments

Darusha Vithanage of the Sri Lanka Rice Research Center deserves our deepest thanks for supplying important data that helped make this research a success. Nimesh Ariyadasa is acknowledged for his invaluable assistance in bringing together diverse stakeholders in Sri Lanka. Hashani Ruwanthika Padmasiri is acknowledged for her invaluable assistance in making this research a success.

Conflicts of Interest

The authors declare no conflict of interest.

Appendix A

Figure A1. Percentage share of primary energy supply adopted from [1].
Energies 15 08984 g0a1
Figure A2. Energy generation technologies.
Energies 15 08984 g0a2

References

  1. Dutt, A. Accelerating Renewable Energy Investments in Sri Lanka; Centre for Energy Finance, Council on Energy, Environment and Water (CEEW): New Delhi, India, 2020. [Google Scholar]
  2. Ritchie, H.; Roser, M.; Rosado, P. Sri Lanka: Energy Country Profile. Available online: https://ourworldindata.org/energy/country/sri-lanka#citation (accessed on 15 November 2022).
  3. Asian Development Bank. Sri Lanka Energy Sector Assessment, Strategy and Road Map; Asian Development Bank: Manila, Philippines, 2019. [Google Scholar]
  4. Share of Renewables in Electricity Production. Available online: https://yearbook.enerdata.net/renewables/renewable-in-electricity-production-share.html (accessed on 5 November 2022).
  5. Adittiya, S.W. SL Needs 10,000 MW of Renewable Energy to Meet 2030 Target: Official. Daily FT 2020. Available online: https://www.ft.lk/front-page/SL-needs-10-000-MW-of-renewable-energy-to-meet-2030-target-official/44-695612 (accessed on 5 November 2022).
  6. Singh, M.; Keswani, S.; Chitkara, P.; Joseph, R.; Singha, H.; Sen, S.; Mahindru, G.; Rao, V.; Sumanasekaran, P.; Shazaad, N.; et al. 100% Percent Electricity Generation through Renewable Energy by 2050: Assessment of Sri Lanka’s Power Sector; Asian Development Bank: Manila, Philippines, 2021. [Google Scholar]
  7. Rodrigo, A.S.; Perera, S. Potential and Viability of Rice Husk Based Power Generation in Sri Lanka. Eng. J. Inst. Eng. Sri Lanka 2013, 46, 9. [Google Scholar] [CrossRef]
  8. Qian, X.; Xue, J.; Yang, Y.; Lee, S.W. Thermal Properties and Combustion-Related Problems Prediction of Agricultural Crop Residues. Energies 2021, 14, 4619. [Google Scholar] [CrossRef]
  9. Shinde, R.; Shahi, D.K.; Mahapatra, P.; Singh, C.S.; Naik, S.K.; Thombare, N.; Singh, A.K. Management of Crop Residues with Special Reference to the On-Farm Utilization Methods: A Review. Ind. Crops Prod. 2022, 181, 114772. [Google Scholar] [CrossRef]
  10. Gómez, A.; Zubizarreta, J.; Rodrigues, M.; Dopazo, C.; Fueyo, N. An Estimation of the Energy Potential of Agro-Industrial Residues in Spain. Resour. Conserv. Recycl. 2010, 54, 972–984. [Google Scholar] [CrossRef]
  11. Caputo, A.C.; Scacchia, F.; Pelagagge, P.M. Disposal of By-Products in Olive Oil Industry: Waste-to-Energy Solutions. Appl. Therm. Eng. 2003, 23, 197–214. [Google Scholar] [CrossRef]
  12. di Fraia, S.; Fabozzi, S.; Macaluso, A.; Vanoli, L. Energy Potential of Residual Biomass from Agro-Industry in a Mediterranean Region of Southern Italy (Campania). J. Clean Prod. 2020, 277, 124085. [Google Scholar] [CrossRef]
  13. McKendry, P. Energy Production from Biomass (Part 1): Overview of Biomass. Bioresour. Technol. 2002, 83, 37–46. [Google Scholar] [CrossRef]
  14. McKendry, P. Energy Production from Biomass (Part 2): Conversion Technologies. Bioresour. Technol. 2002, 83, 47–54. [Google Scholar] [CrossRef]
  15. Muigai, H.H.; Bordoloi, U.; Hussain, R.; Ravi, K.; Moholkar, V.S.; Kalita, P. A Comparative Study on Synthesis and Characterization of Biochars Derived from Lignocellulosic Biomass for Their Candidacy in Agronomy and Energy Applications. Int. J. Energy Res. 2021, 45, 4765–4781. [Google Scholar] [CrossRef]
  16. Zhou, Q.; Le, Q.V.; Yang, H.; Gu, H.; Yang, Y.; Sonne, C.; Tabatabaei, M.; Lam, S.S.; Li, C.; Chen, X.; et al. Sustainable Conversion of Agricultural Biomass into Renewable Energy Products: A Discussion. Bioresources 2022, 17, 3489–3508. [Google Scholar] [CrossRef]
  17. Kretschmer, B.; Allen, B.; Kieve, D.; Smith, C. Shifting Away from Conventional Biofuels: Sustainable Alternatives for the Use of Biomass in the UK Transport Sector; Institute for European Environmental Policy (IEEP): London, UK, 2013. [Google Scholar]
  18. Copa Rey, J.R.; Tamayo Pacheco, J.J.; António da Cruz Tarelho, L.; Silva, V.; Cardoso, J.S.; Silveira, J.L.; Tuna, C.E. Evaluation of Cogeneration Alternative Systems Integrating Biomass Gasification Applied to a Brazilian Sugar Industry. Renew. Energy 2021, 178, 318–333. [Google Scholar] [CrossRef]
  19. Mohapatra, S.S.; Rath, M.K.; Singh, R.K.; Murugan, S. Performance and Emission Analysis of Co-Pyrolytic Oil Obtained from Sugarcane Bagasse and Polystyrene in a CI Engine. Fuel 2021, 298, 120813. [Google Scholar] [CrossRef]
  20. Ren, J.; Yu, P.; Xu, X. Straw Utilization in China—Status and Recommendations. Sustainability 2019, 11, 1762. [Google Scholar] [CrossRef] [Green Version]
  21. Fleig, O.P.; Raymundo, L.M.; Trierweiler, L.F.; Trierweiler, J.O. Study of Rice Husk Continuous Torrefaction as a Pretreatment for Fast Pyrolysis. J. Anal. Appl. Pyrolysis 2021, 154, 104994. [Google Scholar] [CrossRef]
  22. Morrissey, K.G.; Thoma, G.; López, D.E. Life Cycle Impact Assessment of Biofuels Derived from Sweet Sorghum in the U.S. Biotechnol. Biofuels 2021, 14, 166. [Google Scholar] [CrossRef]
  23. Elnajjar, E.; Syam, M.M.; Al-Omari, S. Experimental Investigations of Bio-Syngas Production Using Microwave Pyrolysis of UAE’S Palm Date Seed Pits. Fuel 2021, 303, 121348. [Google Scholar] [CrossRef]
  24. Migo-Sumagang, M.V.P.; van Hung, N.; Detras, M.C.M.; Alfafara, C.G.; Borines, M.G.; Capunitan, J.A.; Gummert, M. Optimization of a Downdraft Furnace for Rice Straw-Based Heat Generation. Renew. Energy 2020, 148, 953–963. [Google Scholar] [CrossRef]
  25. Vaskalis, I.; Skoulou, V.; Stavropoulos, G.; Zabaniotou, A. Towards Circular Economy Solutions for The Management of Rice Processing Residues to Bioenergy via Gasification. Sustainability 2019, 11, 6433. [Google Scholar] [CrossRef] [Green Version]
  26. Magnago, R.F.; Costa, S.C.; de Assunção Ezirio, M.J.; de Godoy Saciloto, V.; Cremona Parma, G.O.; Gasparotto, E.S.; Gonçalves, A.C.; Tutida, A.Y.; Barcelos, R.L. Briquettes of Citrus Peel and Rice Husk. J. Clean Prod. 2020, 276, 123820. [Google Scholar] [CrossRef]
  27. Payá, J.; Monzó, J.; Borrachero, M.V.; Peris-Mora, E.; Ordóñez, L.M. Studies on Crystalline Rice Husk Ashes and the Activation of Their Pozzolanic Properties. In Waste Management Series; Elsevier: Amsterdam, The Netherlands, 2000; pp. 493–503. [Google Scholar]
  28. Hossain, S.S.; Mathur, L.; Roy, P.K. Rice Husk/Rice Husk Ash as an Alternative Source of Silica in Ceramics: A Review. J. Asian Ceram. Soc. 2018, 6, 299–313. [Google Scholar] [CrossRef]
  29. Oliveira, M.O.; Neto, J.M.; Inocencio, M.C.; Ando Junior, O.H.; Bretas, A.S.; Perrone, O.E. Viability Study for Use of Rice Husk in Electricity Generation by Biomass. Renew. Energy Power Qual. J. 2012, 1, 1655–1658. [Google Scholar] [CrossRef]
  30. Stanmore, B.R. Generation of Energy from Sugarcane Bagasse by Thermal Treatment. Waste Biomass Valorization 2010, 1, 77–89. [Google Scholar] [CrossRef]
  31. Kirubakaran, V.; Sivaramakrishnan, V.; Nalini, R.; Sekar, T.; Premalatha, M.; Subramanian, P. A Review on Gasification of Biomass. Renew. Sustain. Energy Rev. 2009, 13, 179–186. [Google Scholar] [CrossRef]
  32. Zhang, L.; Xu, C.; Champagne, P. Overview of Recent Advances in Thermo-Chemical Conversion of Biomass. Energy Convers. Manag. 2010, 51, 969–982. [Google Scholar] [CrossRef]
  33. Bhavanam, A.; Sastry, R.C. Biomass Gasification Processes in Downdraft Fixed Bed Reactors: A Review. Int. J. Chem. Eng. Appl. 2011, 2, 425. [Google Scholar]
  34. Celma, A.; Rojas, S.; Lopezrodriguez, F. Waste-to-Energy Possibilities for Industrial Olive and Grape by-Products in Extremadura. Biomass Bioenergy 2007, 31, 522–534. [Google Scholar] [CrossRef]
  35. Dornburg, V.; Faaij, A.P.C. Efficiency and Economy of Wood-Fired Biomass Energy Systems in Relation to Scale Regarding Heat and Power Generation Using Combustion and Gasification Technologies. Biomass Bioenergy 2001, 21, 91–108. [Google Scholar] [CrossRef]
  36. Faaij, A. Modern Biomass Conversion Technologies. Mitig. Adapt Strateg. Glob. Chang. 2006, 11, 343–375. [Google Scholar] [CrossRef] [Green Version]
  37. Mohiuddin, O.; Mohiuddin, A.; Obaidullah, M.; Ahmed, H.; Asumadu-Sarkodie, S. Electricity Production Potential and Social Benefits from Rice Husk, a Case Study in Pakistan. Cogent Eng. 2016, 3, 1177156. [Google Scholar] [CrossRef]
  38. Roberts, J.J.; Cassula, A.M.; Osvaldo Prado, P.; Dias, R.A.; Balestieri, J.A.P. Assessment of Dry Residual Biomass Potential for Use as Alternative Energy Source in the Party of General Pueyrredón, Argentina. Renew. Sustain. Energy Rev. 2015, 41, 568–583. [Google Scholar] [CrossRef]
  39. Kumar, A.; Nayak, A.K.; Sharma, S.; Senapati, A.; Mitra, D.; Mohanty, B.; Prabhukarthikeyan, S.R.; Sabarinathan, K.G.; Mani, I.; Garhwal, R.S.; et al. Recycling of Rice Straw—A Sustainable Approach for Ensuring Environmental Quality and Economic Security: A Review. Pedosphere 2022, in press. [Google Scholar] [CrossRef]
  40. Qian, X.; Lee, S.; Soto, A.; Chen, G. Regression Model to Predict the Higher Heating Value of Poultry Waste from Proximate Analysis. Resources 2018, 7, 39. [Google Scholar] [CrossRef] [Green Version]
  41. Yin, C.-Y. Prediction of Higher Heating Values of Biomass from Proximate and Ultimate Analyses. Fuel 2011, 90, 1128–1132. [Google Scholar] [CrossRef] [Green Version]
  42. Nhuchhen, D.R.; Abdul Salam, P. Estimation of Higher Heating Value of Biomass from Proximate Analysis: A New Approach. Fuel 2012, 99, 55–63. [Google Scholar] [CrossRef]
  43. Ghugare, S.B.; Tiwary, S.; Elangovan, V.; Tambe, S.S. Prediction of Higher Heating Value of Solid Biomass Fuels Using Artificial Intelligence Formalisms. Bioenergy Res. 2014, 7, 681–692. [Google Scholar] [CrossRef]
  44. El-Kordy, M.N.; Badr, M.A.; Abed, K.A.; Ibrahim, S.M.A. Economical Evaluation of Electricity Generation Considering Externalities. Renew. Energy 2002, 25, 317–328. [Google Scholar] [CrossRef]
  45. Wickwire, S. Biomass Combined Heat and Power Catalog of Technologies; U.S. Environmental Protection Agency: Washington, DC, USA, 2007. [Google Scholar]
  46. Morató, T.; Vaezi, M.; Kumar, A. Techno-Economic Assessment of Biomass Combustion Technologies to Generate Electricity in South America: A Case Study for Bolivia. Renew. Sustain. Energy Rev. 2020, 134, 110154. [Google Scholar] [CrossRef]
  47. Jayatissa de Costa Non Conventional Renewable Energy Tariff Announcement Purchase of Electricity to the National Grid under Standardized Power Purchase Agreements (SPPA). Available online: https://web.pucsl.gov.lk/english/notices/non-conventional-renewable-energy-tariff-announcement-purchase-of-electricity-to-the-national-grid-under-standardized-power-purchase-agreements-sppa/ (accessed on 25 May 2022).
  48. Matsumura, Y.; Minowa, T.; Yamamoto, H. Amount, Availability, and Potential Use of Rice Straw (Agricultural Residue) Biomass as an Energy Resource in Japan. Biomass Bioenergy 2005, 29, 347–354. [Google Scholar] [CrossRef]
  49. Asadi Zeidabadi, Z.; Bakhtiari, S.; Abbaslou, H.; Ghanizadeh, A.R. Synthesis, Characterization and Evaluation of Biochar from Agricultural Waste Biomass for Use in Building Materials. Constr. Build Mater. 2018, 181, 301–308. [Google Scholar] [CrossRef]
  50. Weber, K.; Quicker, P. Properties of Biochar. Fuel 2018, 217, 240–261. [Google Scholar] [CrossRef]
  51. Xiao, B.; Sun, X.F.; Sun, R. Chemical, Structural, and Thermal Characterizations of Alkali-Soluble Lignins and Hemicelluloses, and Cellulose from Maize Stems, Rye Straw, and Rice Straw. Polym. Degrad. Stab. 2001, 74, 307–319. [Google Scholar] [CrossRef]
  52. Sun, Y.; Webley, P.A. Preparation of Activated Carbons from Corncob with Large Specific Surface Area by a Variety of Chemical Activators and Their Application in Gas Storage. Chem. Eng. J. 2010, 162, 883–892. [Google Scholar] [CrossRef]
  53. Satlewal, A.; Agrawal, R.; Bhagia, S.; Das, P.; Ragauskas, A.J. Rice Straw as a Feedstock for Biofuels: Availability, Recalcitrance, and Chemical Properties. Biofuels Bioprod. Biorefining 2018, 12, 83–107. [Google Scholar] [CrossRef]
  54. Vassilev, S.v.; Baxter, D.; Andersen, L.K.; Vassileva, C.G. An Overview of the Chemical Composition of Biomass. Fuel 2010, 89, 913–933. [Google Scholar] [CrossRef]
  55. Sannigrahi, P.; Ragauskas, A.J.; Tuskan, G.A. Poplar as a Feedstock for Biofuels: A Review of Compositional Characteristics. Biofuels Bioprod. Biorefining 2010, 4, 209–226. [Google Scholar] [CrossRef]
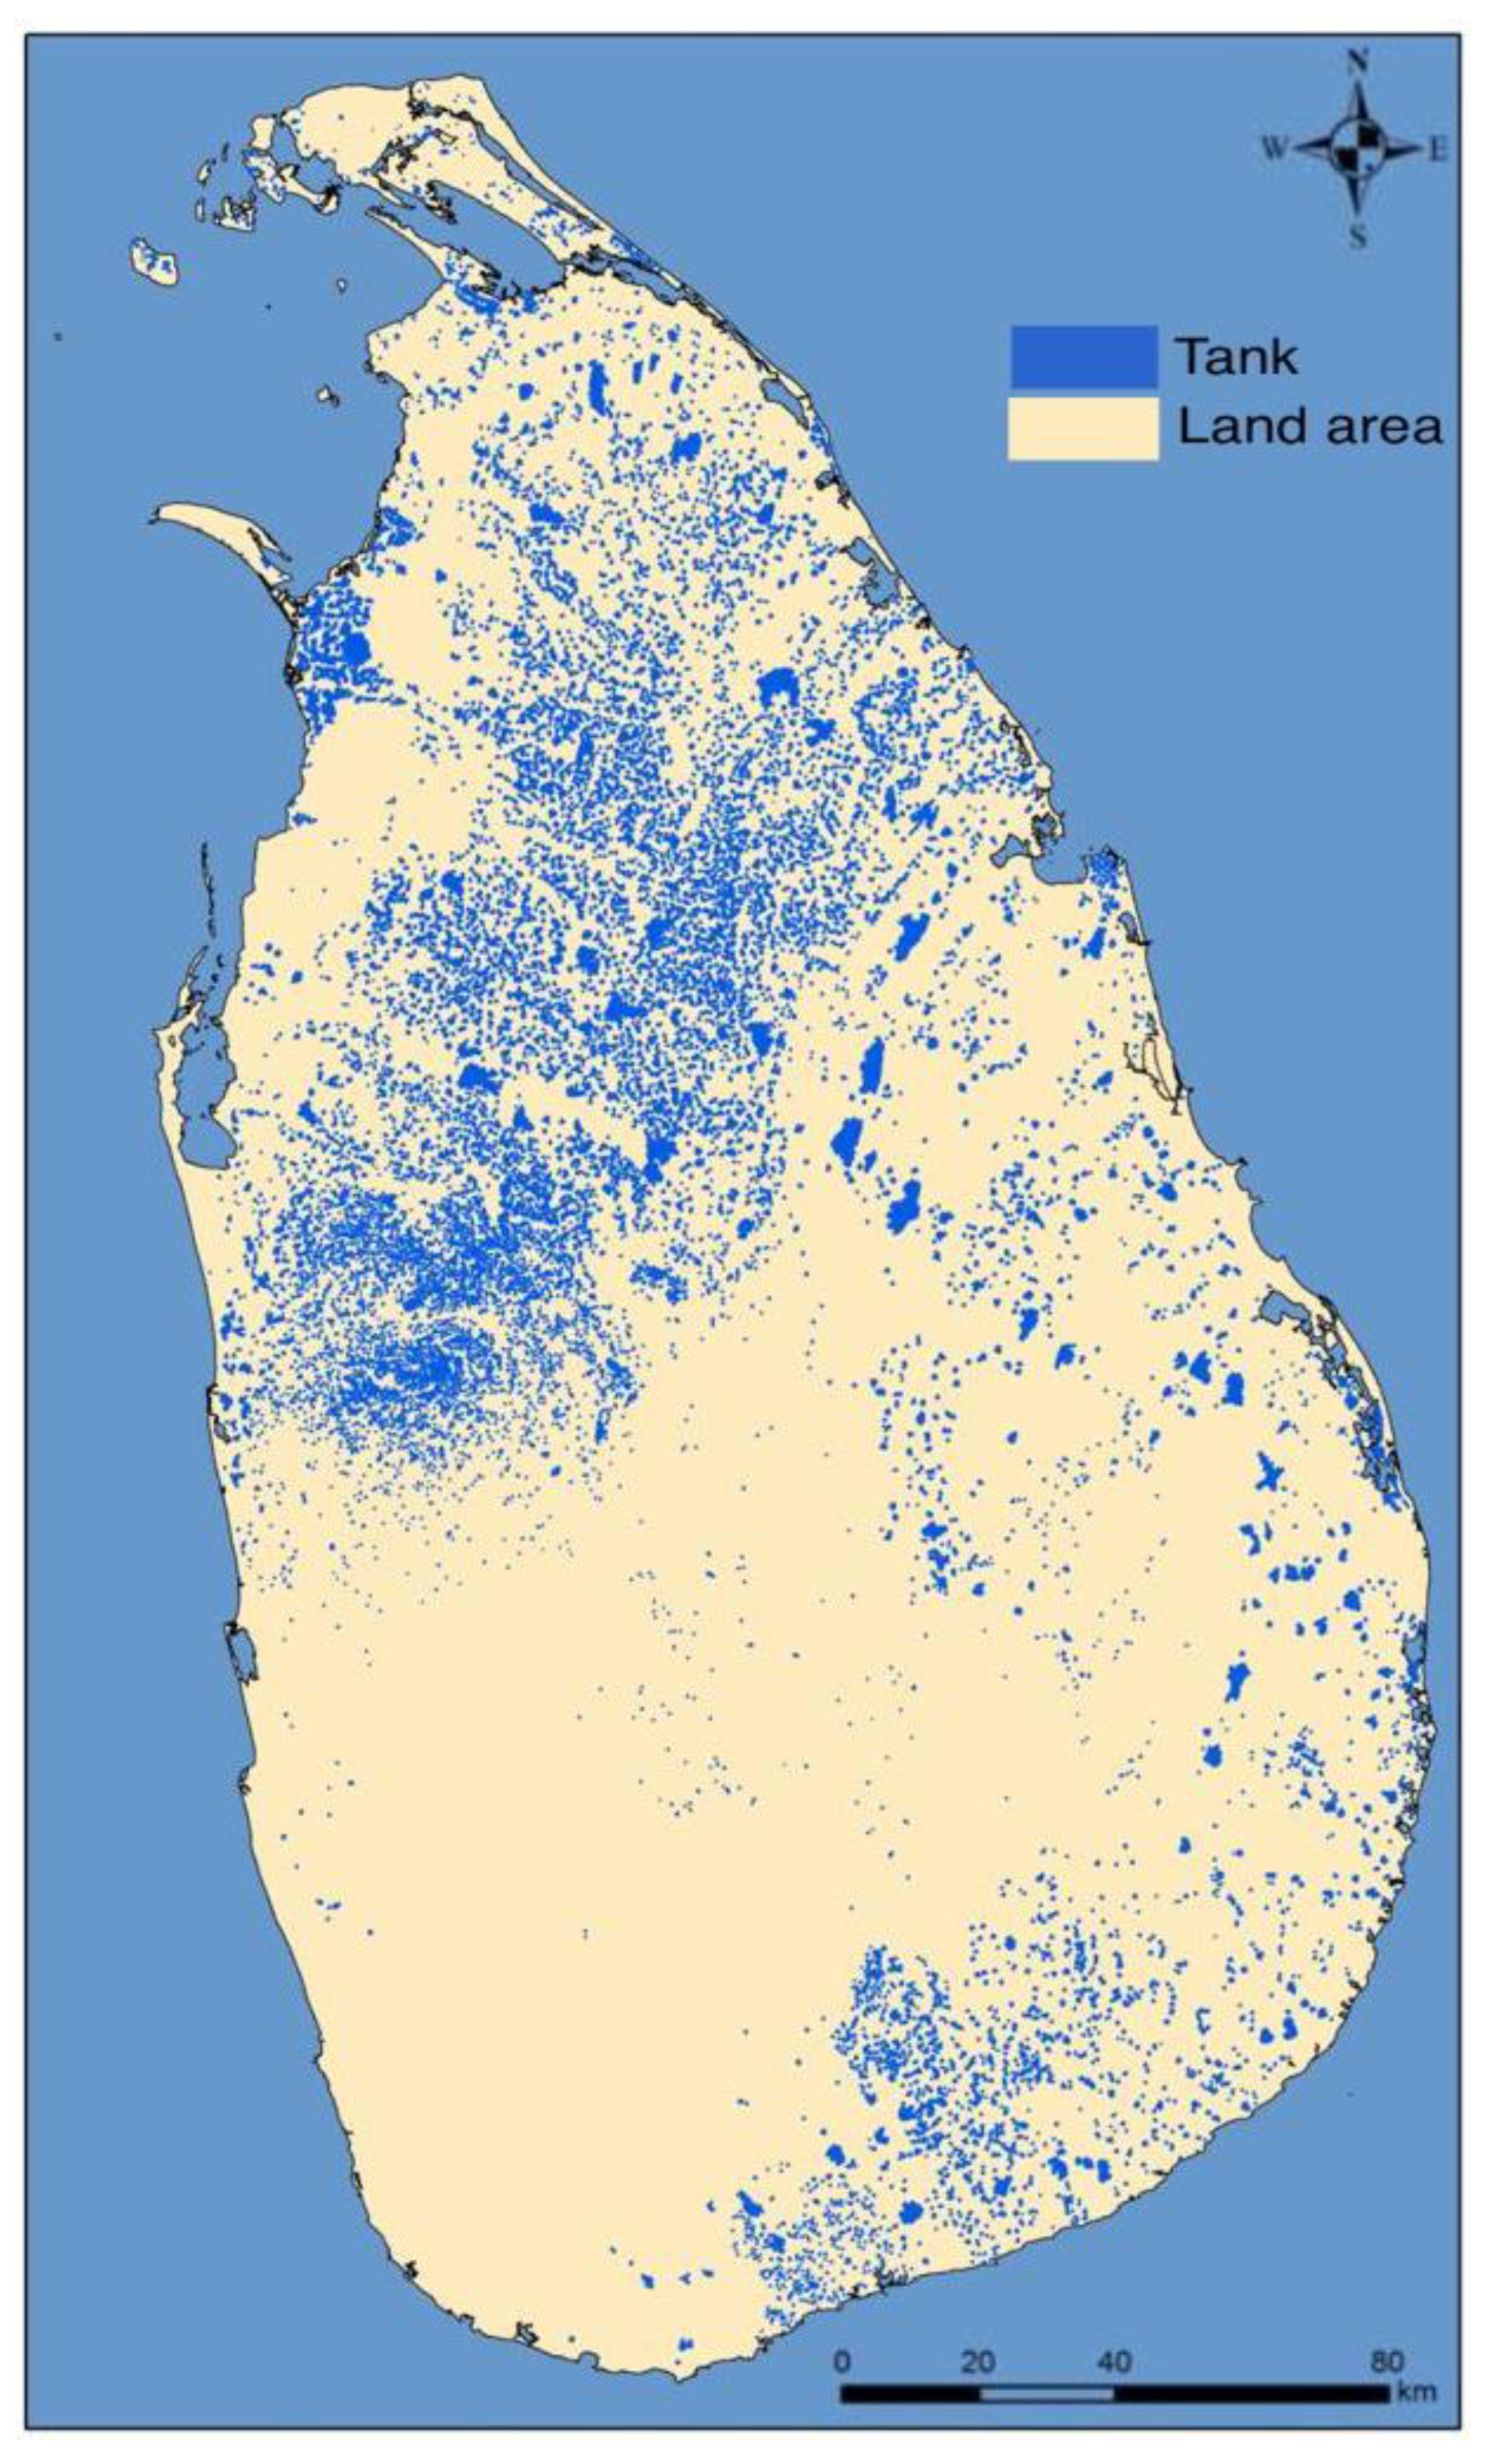
  56. Sri Lanka—River and Streams. Available online: https://data.humdata.org/dataset/sri-lanka-water-bodies-0-0 (accessed on 25 March 2022).
  57. Sellitto, M.A.; Kadel, N.; Borchardt, M.; Pereira, G.M.; Domingues, J. Rice husk and scrap tires co-processing and reverse logistics in cement manufacturing. Ambiente Soc. 2013, 16, 141–162. [Google Scholar] [CrossRef] [Green Version]
  58. Srivastava, V.C.; Mall, I.D.; Mishra, I.M. Adsorption Thermodynamics and Isosteric Heat of Adsorption of Toxic Metal Ions onto Bagasse Fly Ash (BFA) and Rice Husk Ash (RHA). Chem. Eng. J. 2007, 132, 267–278. [Google Scholar] [CrossRef]
  59. Abo-El-Enein, S.A.; Eissa, M.A.; Diafullah, A.A.; Rizk, M.A.; Mohamed, F.M. Removal of Some Heavy Metals Ions from Wastewater by Copolymer of Iron and Aluminum Impregnated with Active Silica Derived from Rice Husk Ash. J. Hazard Mater. 2009, 172, 574–579. [Google Scholar] [CrossRef]
  60. Ajmal, M.; Ali Khan Rao, R.; Anwar, S.; Ahmad, J.; Ahmad, R. Adsorption Studies on Rice Husk: Removal and Recovery of Cd(II) from Wastewater. Bioresour. Technol. 2003, 86, 147–149. [Google Scholar] [CrossRef]
  61. Rocha, C.G.; Zaia, D.A.M.; Alfaya, R.V.d.S.; Alfaya, A.A. da S. Use of Rice Straw as Biosorbent for Removal of Cu(II), Zn(II), Cd(II) and Hg(II) Ions in Industrial Effluents. J. Hazard Mater. 2009, 166, 383–388. [Google Scholar] [CrossRef]
  62. Amin, M.N.; Kaneco, S.; Kitagawa, T.; Begum, A.; Katsumata, H.; Suzuki, T.; Ohta, K. Removal of Arsenic in Aqueous Solutions by Adsorption onto Waste Rice Husk. Ind. Eng. Chem. Res. 2006, 45, 8105–8110. [Google Scholar] [CrossRef]
  63. Taimur Khan; Shahril Anwar Bin Ab Wahap; Malay Chaudhuri Adsorption of Arsenite from Water by Rice Husk Silica. Nat. Environ. Pollut. Technol. Int. Q. Sci. J. 2012, 11, 229–233.
  64. Wang, L.-H.; Lin, C.-I. Adsorption of Chromium (III) Ion from Aqueous Solution Using Rice Hull Ash. J. Chin. Inst. Chem. Eng. 2008, 39, 367–373. [Google Scholar] [CrossRef]
  65. Nakbanpote, W.; Thiravetyan, P.; Kalambaheti, C. Comparison of Gold Adsorption by Chlorella Vulgaris, Rice Husk and Activated Carbon. Miner. Eng. 2002, 15, 549–552. [Google Scholar] [CrossRef]
  66. Han, R.; Ding, D.; Xu, Y.; Zou, W.; Wang, Y.; Li, Y.; Zou, L. Use of Rice Husk for the Adsorption of Congo Red from Aqueous Solution in Column Mode. Bioresour. Technol. 2008, 99, 2938–2946. [Google Scholar] [CrossRef]
  67. Soltani, N.; Bahrami, A.; Pech-Canul, M.I.; González, L.A. Review on the Physicochemical Treatments of Rice Husk for Production of Advanced Materials. Chem. Eng. J. 2015, 264, 899–935. [Google Scholar] [CrossRef]
  68. Bondioli, F.; Andreola, F.; Barbieri, L.; Manfredini, T.; Ferrari, A.M. Effect of Rice Husk Ash (RHA) in the Synthesis of (Pr,Zr)SiO4 Ceramic Pigment. J. Eur. Ceram. Soc. 2007, 27, 3483–3488. [Google Scholar] [CrossRef]
  69. Andreola, F.; Barbieri, L.; Bondioli, F. Agricultural Waste in the Synthesis of Coral Ceramic Pigment. Dye. Pigment. 2012, 94, 207–211. [Google Scholar] [CrossRef]
  70. Nair, D.G.; Fraaij, A.; Klaassen, A.A.K.; Kentgens, A.P.M. A Structural Investigation Relating to the Pozzolanic Activity of Rice Husk Ashes. Cem. Concr. Res. 2008, 38, 861–869. [Google Scholar] [CrossRef]
  71. Papadakis, V.G.; Tsimas, S. Supplementary Cementing Materials in Concrete. Cem. Concr. Res. 2002, 32, 1525–1532. [Google Scholar] [CrossRef]
  72. Chandrasekhar, S.; Pramada, P.N.; Majeed, J. Effect of Calcination Temperature and Heating Rate on the Optical Properties and Reactivity of Rice Husk Ash. J. Mater. Sci. 2006, 41, 7926–7933. [Google Scholar] [CrossRef]
  73. Saraswathy, V.; Song, H.-W. Corrosion Performance of Rice Husk Ash Blended Concrete. Constr. Build Mater. 2007, 21, 1779–1784. [Google Scholar] [CrossRef]
  74. Gonçalves, M.R.F.; Bergmann, C.P. Thermal Insulators Made with Rice Husk Ashes: Production and Correlation between Properties and Microstructure. Constr. Build Mater. 2007, 21, 2059–2065. [Google Scholar] [CrossRef]
  75. Ugheoke, B.I.; Onche, E.O.; Namessan, O.N.; Asikpo, G.A. Property Optimization of Kaolin–Rice Husk Insulating Fire–Bricks. Leonardo Electron. J. Pract. Technol. 2006, 9, 167–178. [Google Scholar]
  76. Haxo, H.E.; Mehta, P.K. Ground Rice-Hull Ash as a Filler for Rubber. Rubber Chem. Technol. 1975, 48, 271–288. [Google Scholar] [CrossRef]
  77. Sae-Oui, P.; Rakdee, C.; Thanmathorn, P. Use of Rice Husk Ash as Filler in Natural Rubber Vulcanizates: In Comparison with Other Commercial Fillers. J. Appl. Polym. Sci. 2002, 83, 2485–2493. [Google Scholar] [CrossRef]
  78. Fuad, M.Y.A.; Ismail, Z.; Ishak, Z.A.M.; Omar, A.K.M. Application of Rice Husk Ash as Fillers in Polypropylene: Effect of Titanate, Zirconate and Silane Coupling Agents. Eur. Polym. J. 1995, 31, 885–893. [Google Scholar] [CrossRef]
  79. Siriwardena, S.; Ismail, H.; Ishiaku, U.S. White Rice Husk Ash Filled Ethylene-Propylene-Diene Terpolymer/Polypropylene Blends: Effect Of Dynamic Vulcanization And Filler Loading. Polym Plast Technol. Eng. 2001, 40, 519–538. [Google Scholar] [CrossRef]
  80. Siriwardena, S.; Ismail, H.; Ishiaku, U.S.; Perera, M.C.S. Mechanical and Morphological Properties of White Rice Husk Ash Filled Polypropylene/Ethylene-Propylene-Diene Terpolymer Thermoplastic Elastomer Composites. J. Appl. Polym. Sci. 2002, 85, 438–453. [Google Scholar] [CrossRef]
  81. Siriwardena, S.; Ismail, H.; Ishiaku, U.S. Water Absorption Behavior and Its Effect on Tensile Properties of Ethylene–Propylene–Diene–Terpolymer/Polypropylene/Filler Ternary Composites: A Preliminary Study. Polym. Plast. Technol. Eng. 2002, 41, 419–433. [Google Scholar] [CrossRef]
  82. John, M.J.; Francis, B.; Varughese, K.T.; Thomas, S. Effect of Chemical Modification on Properties of Hybrid Fiber Biocomposites. Compos. Part A Appl. Sci. Manuf. 2008, 39, 352–363. [Google Scholar] [CrossRef]
  83. Kalia, S.; Kaith, B.S.; Kaur, I. Pretreatments of Natural Fibers and Their Application as Reinforcing Material in Polymer Composites-A Review. Polym. Eng. Sci. 2009, 49, 1253–1272. [Google Scholar] [CrossRef]
  84. Cristaldi, G.; Latteri, A.; Recca, G.; Cicala, G. Composites Based on Natural Fibre Fabrics. In Woven Fabric Engineering; Dubrovski, P.D., Ed.; InTech: Rijeka, Croatia, 2010. [Google Scholar]
  85. Chaudhary, D.S.; Jollands, M.C.; Cser, F. Understanding Rice Hull Ash as Fillers in Polymers: A Review. Silicon Chem. 2002, 1, 281–289. [Google Scholar] [CrossRef]
  86. Adam, F. The Synthesis and Characterization of Cobalt-Rice Husk Silica Nanoparticles. Open Colloid Sci. J. 2011, 4, 12–18. [Google Scholar] [CrossRef]
  87. Ismail, H.; Mega, L.; Khalil, H.A. Effect of a Silane Coupling Agent on the Properties of White Rice Husk Ash-Polypropylene/Natural Rubber Composites. Polym. Int. 2001, 50, 606–611. [Google Scholar] [CrossRef]
  88. Omatola, K.M.; Onojah, A.D. Elemental Analysis of Rice Husk Ash Using X-Ray Fluorescence Technique. Int. J. Phys. Sci. 2009, 4, 189–193. [Google Scholar]
  89. Bose, S.; Acharya, H.N.; Banerjee, H.D. Electrocal, Thermal, Thermoelectric and Related Properties of Magnesium Silicide Semiconductor Prepared from Rice Husk. J. Mater. Sci. 1993, 28, 5461–5468. [Google Scholar] [CrossRef]
  90. Sellitto, M.A.; Kadel, N., Jr.; Borchardt, M.; Pereira, G.M.; Domingues, J. Coprocessamento de Cascas de Arroz e Pneus Inservíveis e Logística Reversa Na Fabricação de Cimento. Ambiente Soc. 2013, 16, 141–162. [Google Scholar] [CrossRef]
Figure 1. Basic biomass energy feedstocks, conversion technologies, and output products, adopted from [8,16,17,18,19,20,21,22,23].
Energies 15 08984 g001
Figure 2. Amount of rice processing by-products throughout the value chain adopted from [24,25,26,27,28].
Energies 15 08984 g002
Figure 3. TGA and DTG curves for rice straw.
Energies 15 08984 g003
Figure 4. TGA and DTG curves for rice husk.
Energies 15 08984 g004
Figure 5. Total production of paddy, rice straw, and rice husk in the year 2019/2020 (Source: Sri Lanka Rice Research Center).
Energies 15 08984 g005
Figure 6. Geographic distribution of the energy potential.
Energies 15 08984 g006
Figure 7. Irrigation tanks situation adopted from [56].
Energies 15 08984 g007
Figure 8. Power plant distribution.
Energies 15 08984 g008
Figure 9. Business associated with RS and RH power plants.
Energies 15 08984 g009
Table 1. Economic parameters with their relative values [7,10,34,35,42,46,47].
ParameterValue or Function
Lifetime of the plant (N)20 years
Discount Rate (i)15%
Investment Cost (IC, million $)4.89⋅(Capacity)0.85 *
Income of the Power Plant (R)Wn h Tf
Flat tariff (Tf)17.71 LKR/kWh
Operating Costs (OC)
Operation and Management cost (O&M)5% (LKR/year)
Cost of RS and RH (CRS,RH)2 × 10⁻¹⁹ (Capacity)3–6 × 10⁻¹³ (Capacity)2 + 2 × 10⁻⁶ (Capacity) + 12.767 *
* Plant capacity is given in MW.
Table 2. Elemental analysis (EDX) of as-received rice straw and rice husk samples from Sri Lanka.
ElementsAverage Values (% wt)
Rice StrawRice Husk
C41.58937.576
O52.63053.041
Si3.8149.284
Ca0.9660.066
Mg0.3530.009
P0.235-
K0.2090.021
S0.144-
Cl0.031-
Mn0.026-
Table 3. Proximate analysis of dry-basis samples of rice straw and rice husk, data obtained from [7,24,25,26,27,28].
PropertiesAverage Values
Rice StrawRice Husk
Higher Heating Value (HHV) (MJ/kg)15.513.18
Lower Heating Value (LHV) (MJ/kg)14.4312.01
Fixed Carbon (%wt)14.624.62
Volatile Matter (%wt)60.2846.13
Ash (%wt)16.8319.77
Moisture (% wt)8.479.01
Table 4. Location, electrical power, electricity generation, NPV, and PI of GFC/ST plants with a positive NPV.
DistrictPower (MW)Generation (TWh)NPV m (LKR)PI
Anuradhapura176.411.23201,353.74.86
Ampara167.831.17191,770.24.63
Polonnaruwa163.481.14186,915.54.62
Kurunegala133.020.93152,825.53.74
Hambantota88.740.62102,979.52.58
Batticcaloa69.840.4981,573.22.07
Trincomalee57.820.4067,899.81.73
Monaragala53.860.3863,383.81.63
Killinochchi33.090.2339,558.51.04
Badulla32.980.2339,425.91.04
Publisher’s Note: MDPI stays neutral with regard to jurisdictional claims in published maps and institutional affiliations.

