
Earthquake Algorithm-Based Voltage Referenced MPPT Implementation through a Standardized Validation Frame


Abstract
1. Introduction
- A new MPPT based on EA algorithm is proposed with an improvement that integrates a PI controller.
- We evaluate the proposed EA-MPPT strategy with the EN 50530 standard test that uses real-world weather conditions.
- We implement the proposed EA-MPPT embedded into a LabVIEW-FPGA frame in order to explore computational parallelism and compare it with the P&O counterpart.
2. Voltage Reference Based MPPT
Voltage Reference Based P&O MPPT Method
3. MPPT-EA Reference Voltage
3.1. Overview of EA
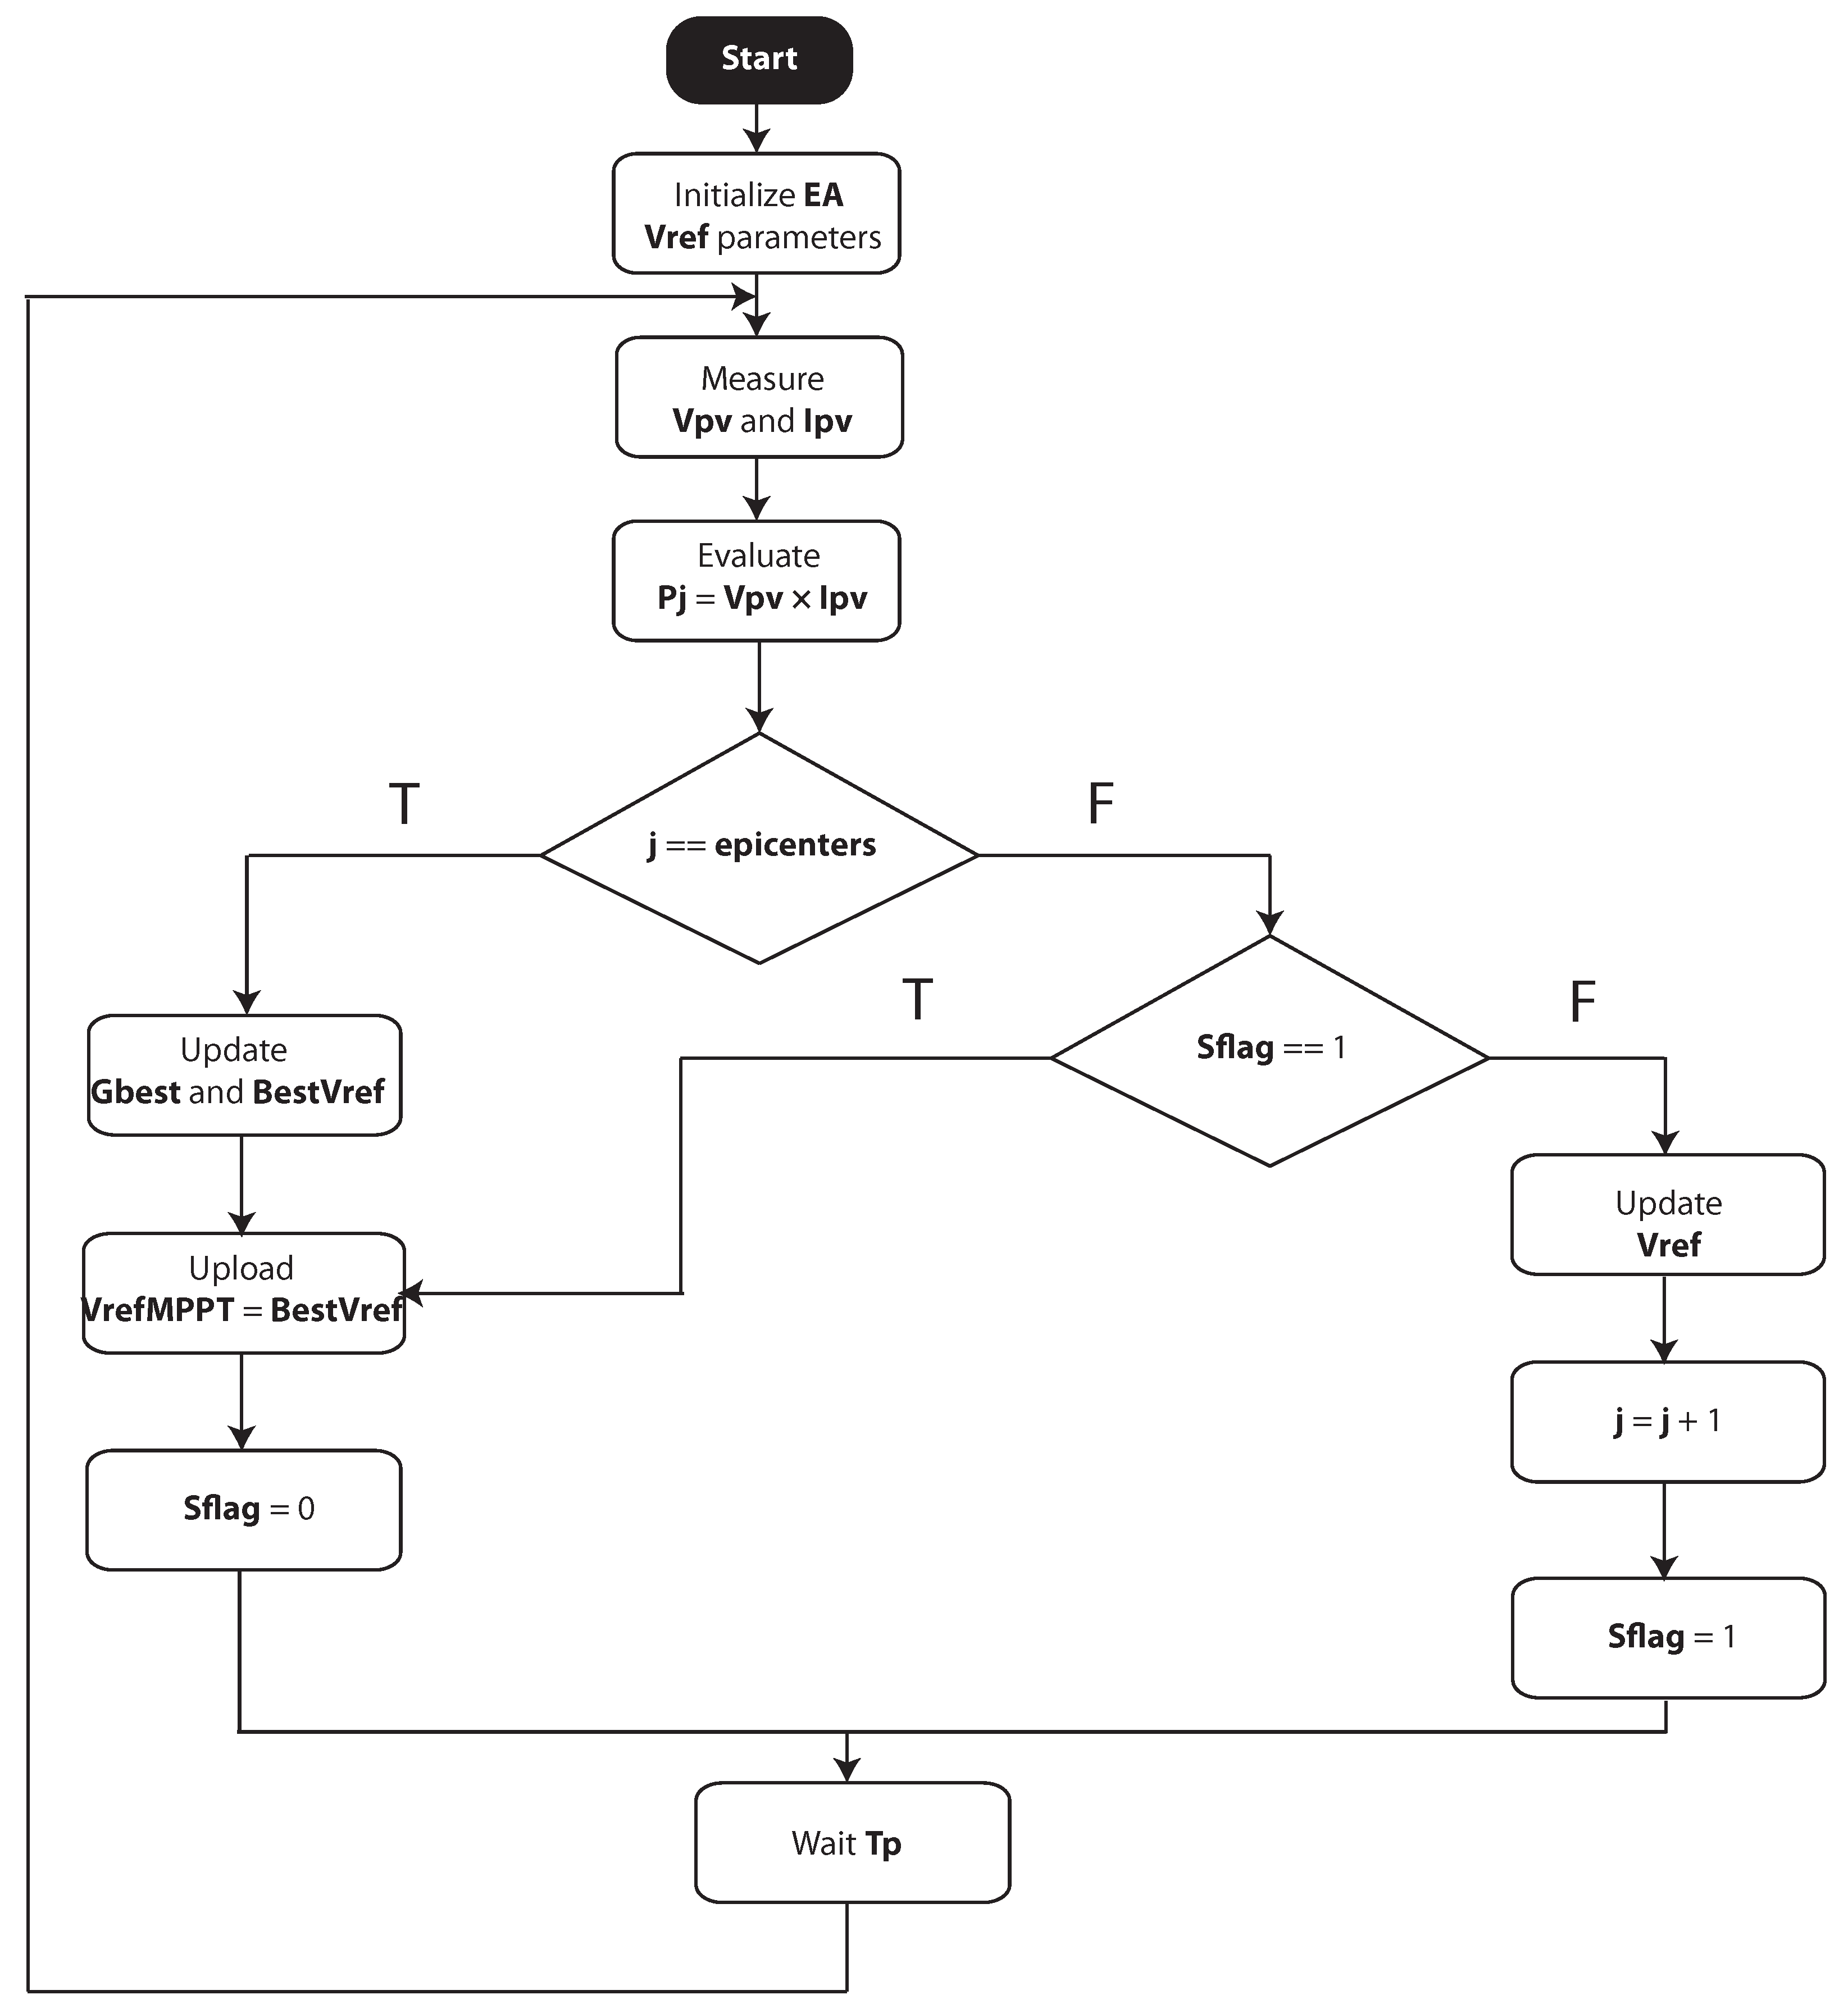
3.2. Proposed EA-MPPT-
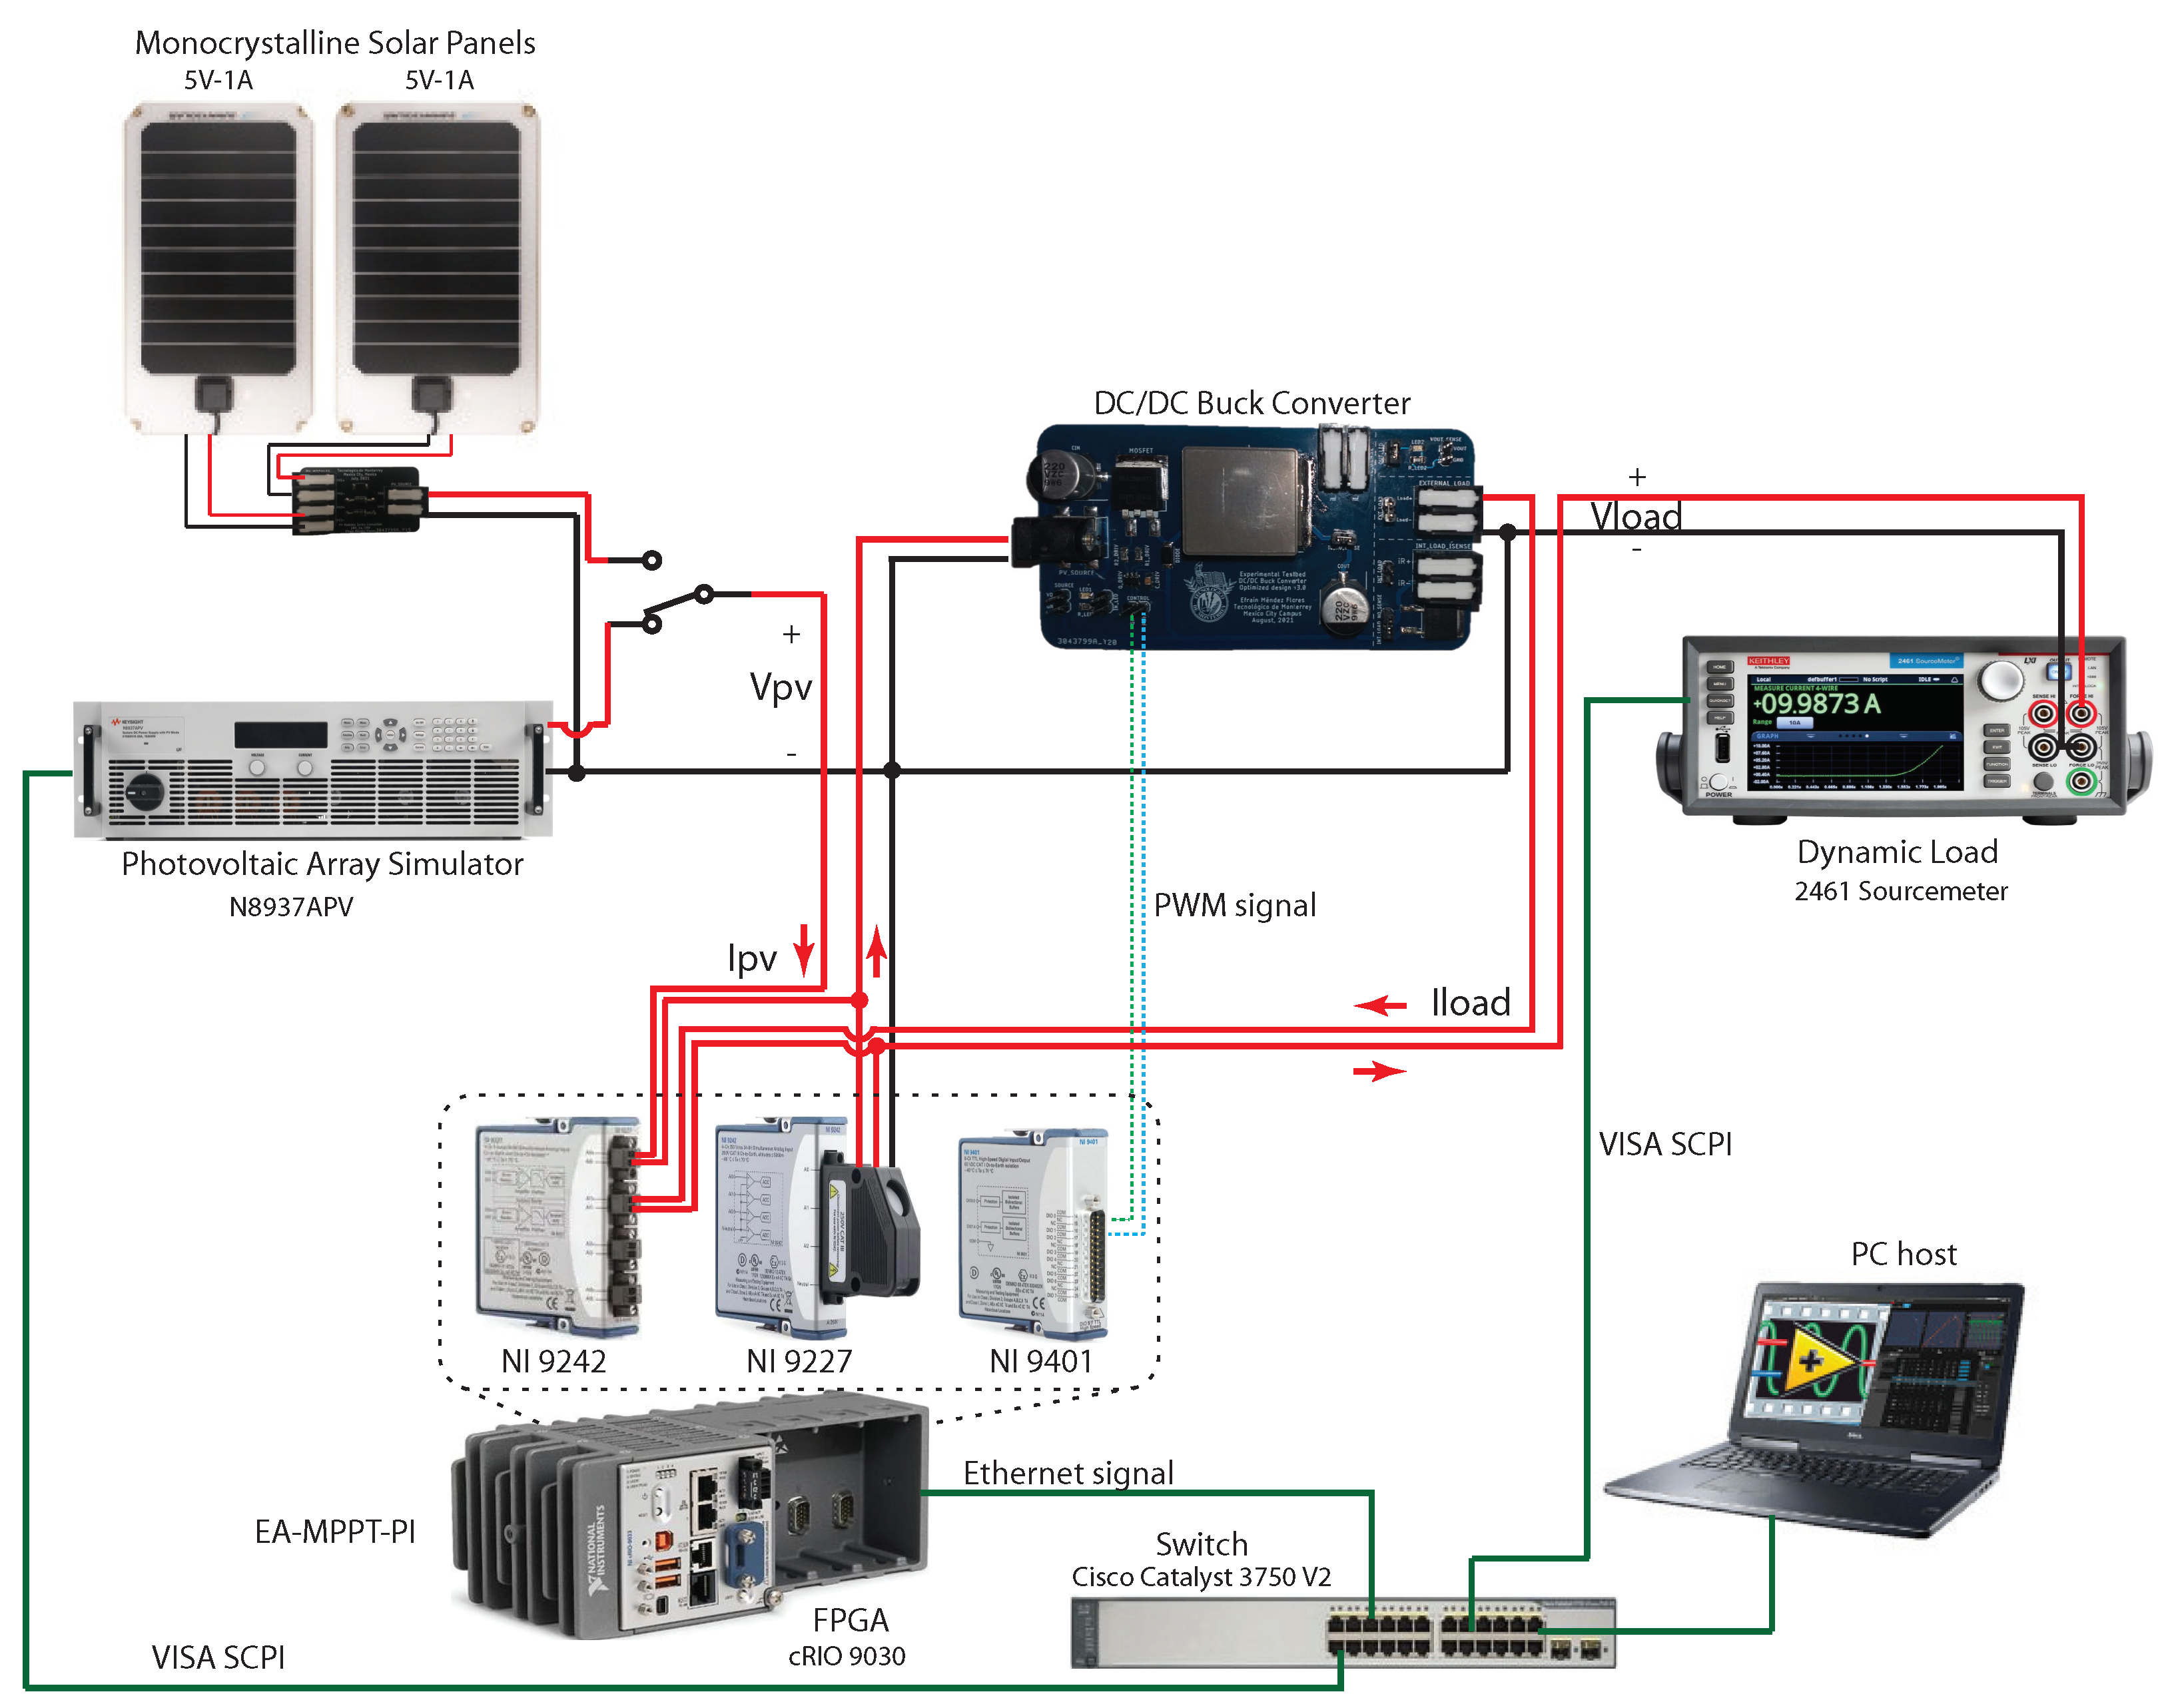
4. Testbed System
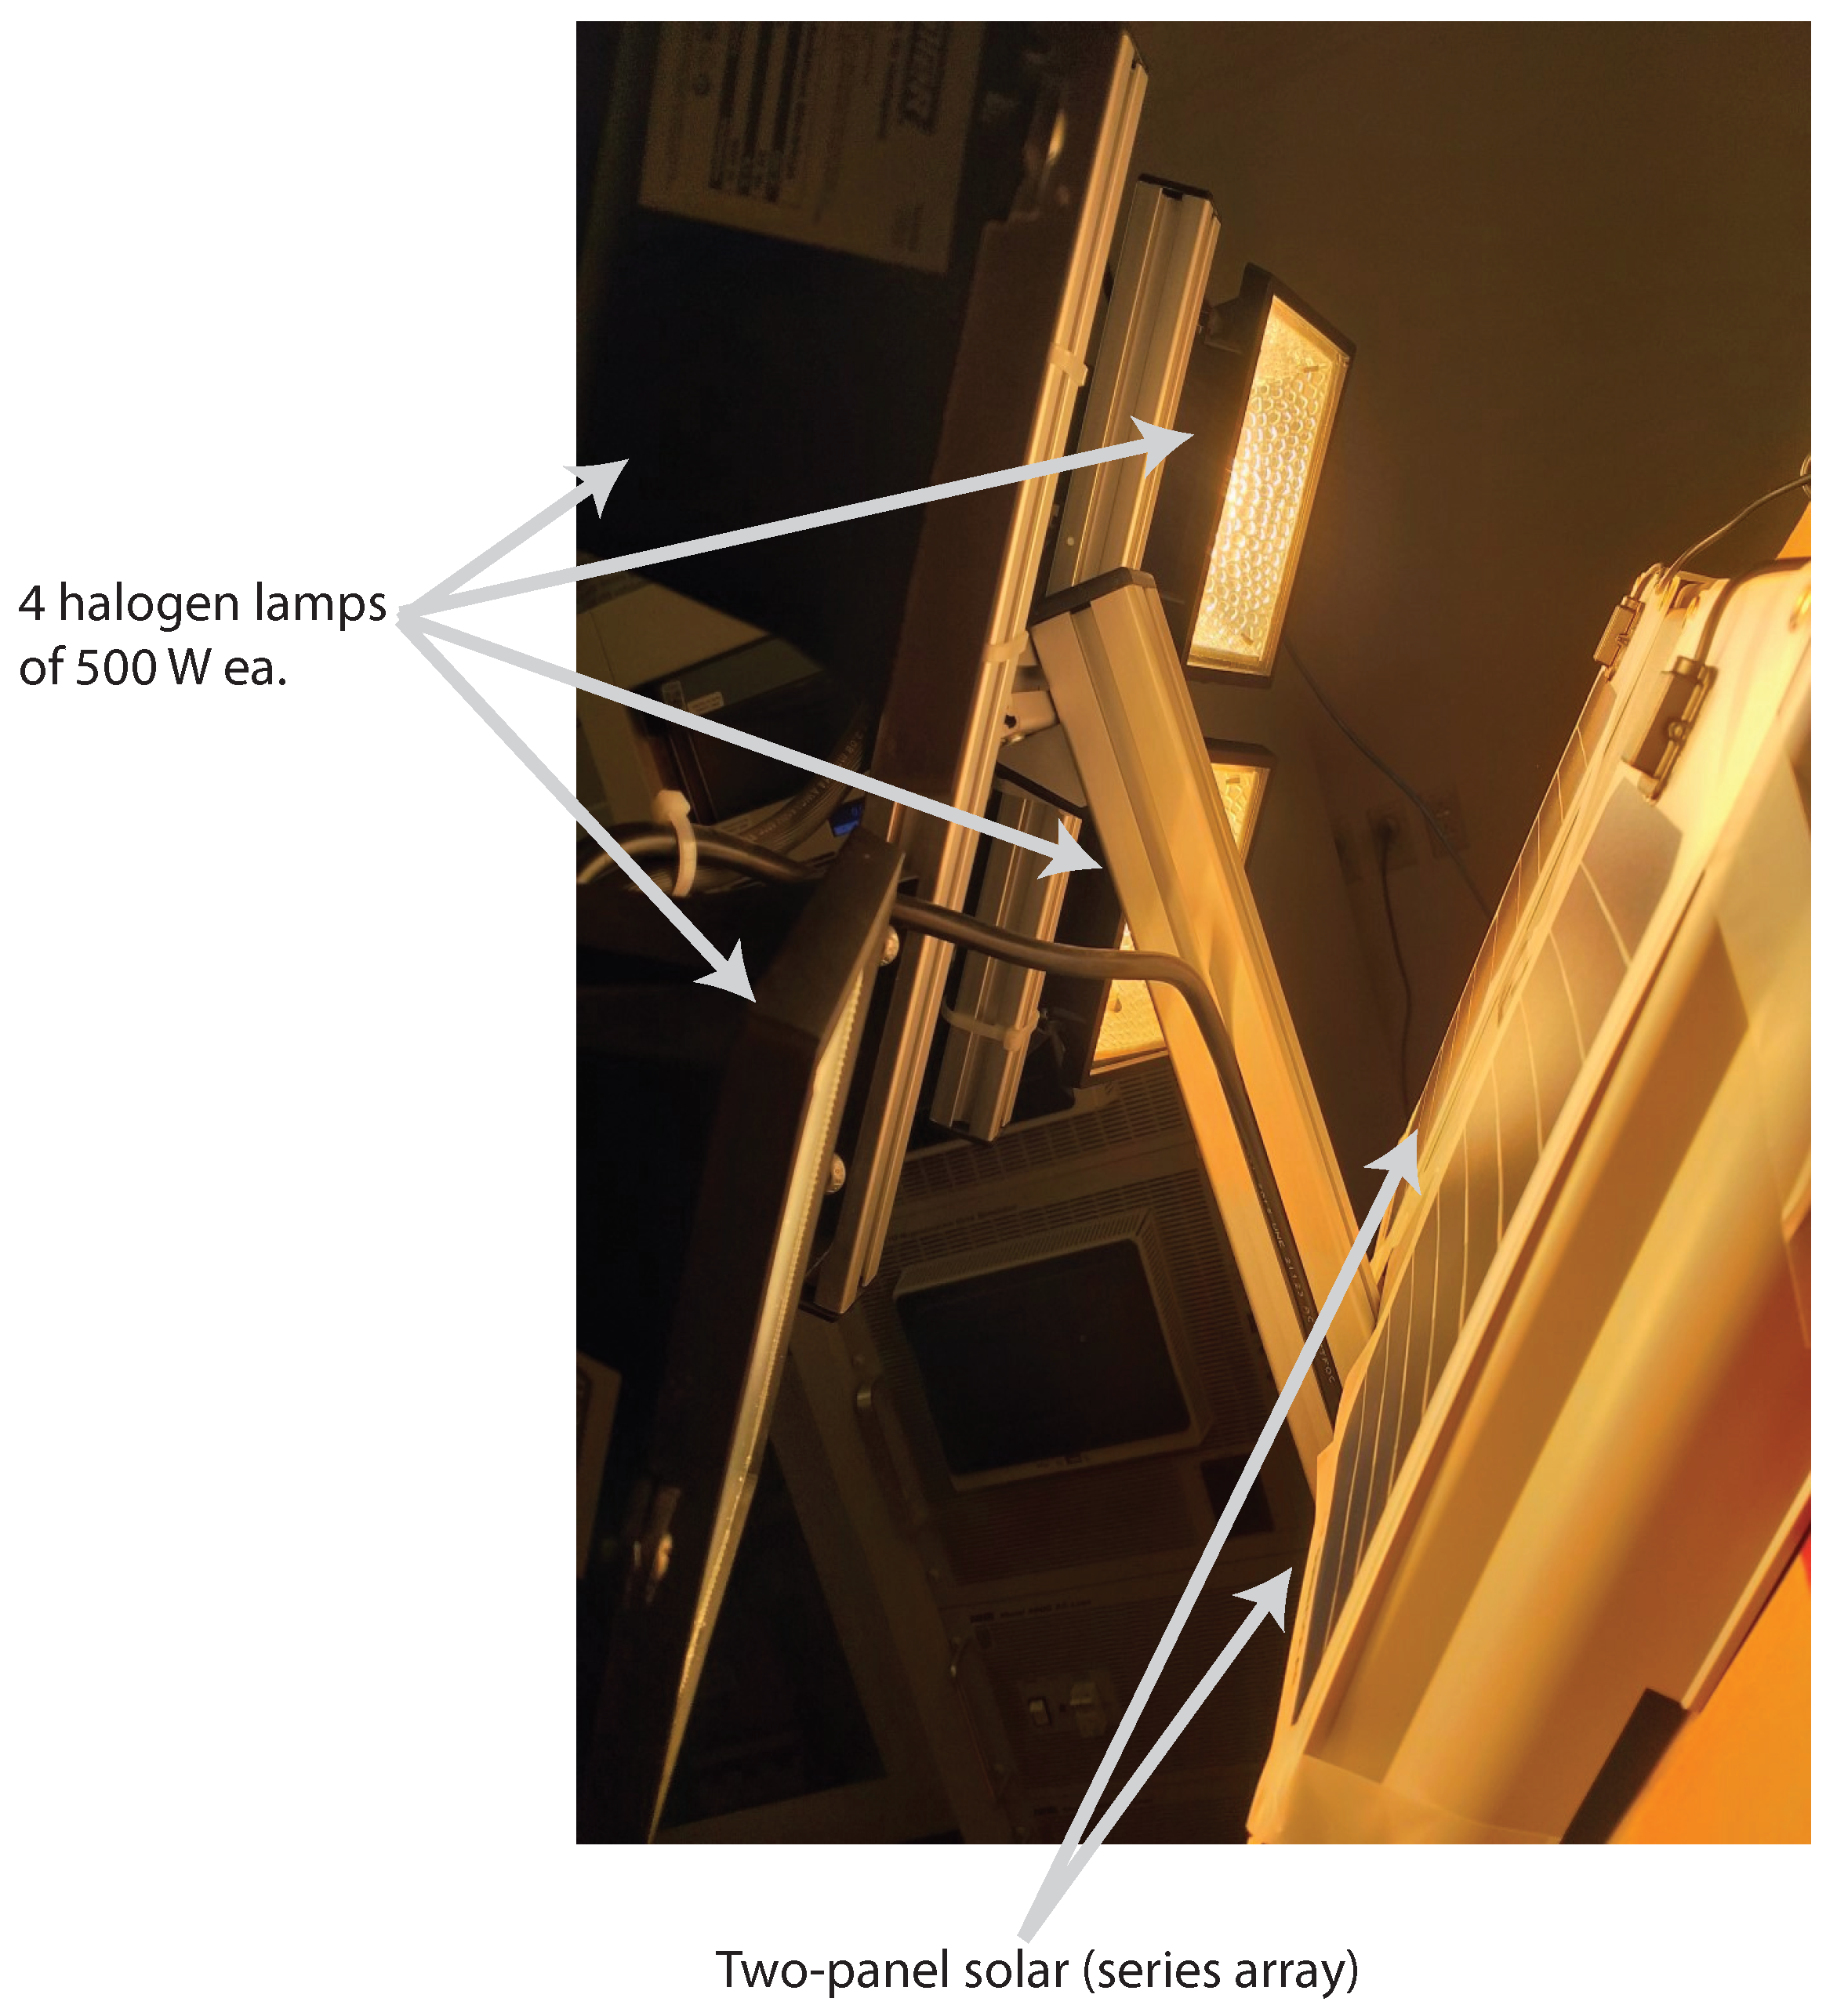
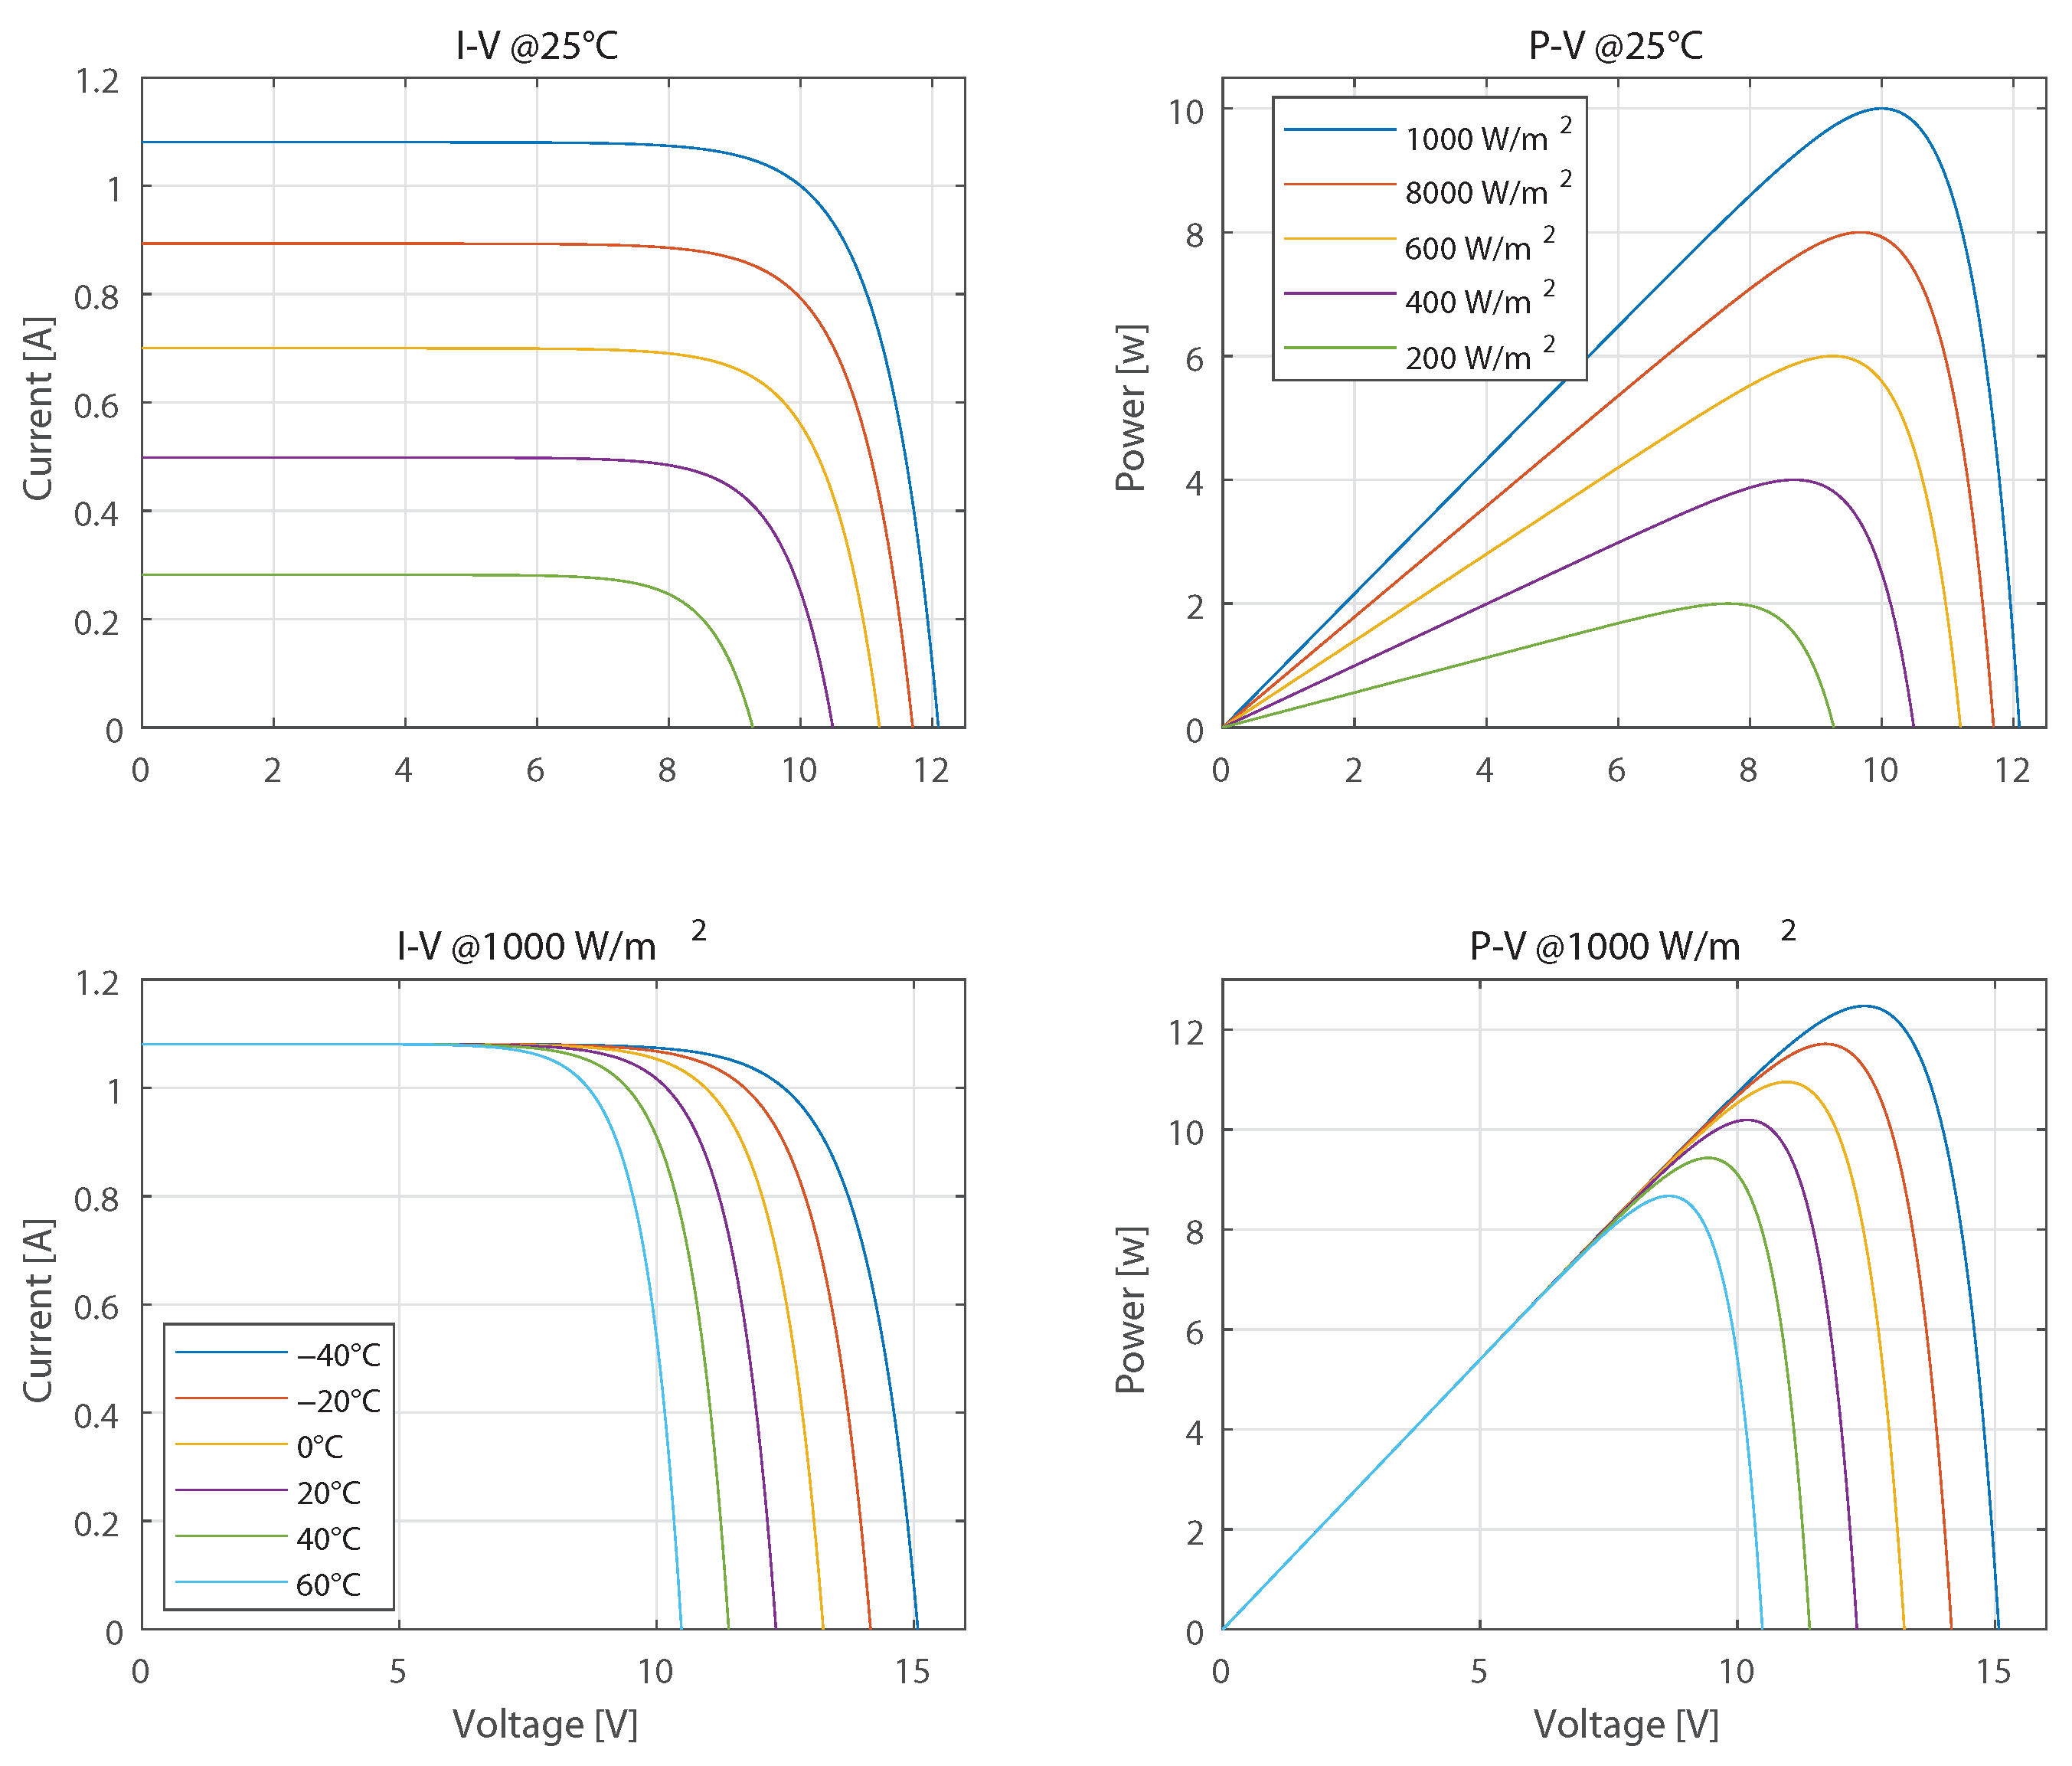
4.1. Solar Panel System
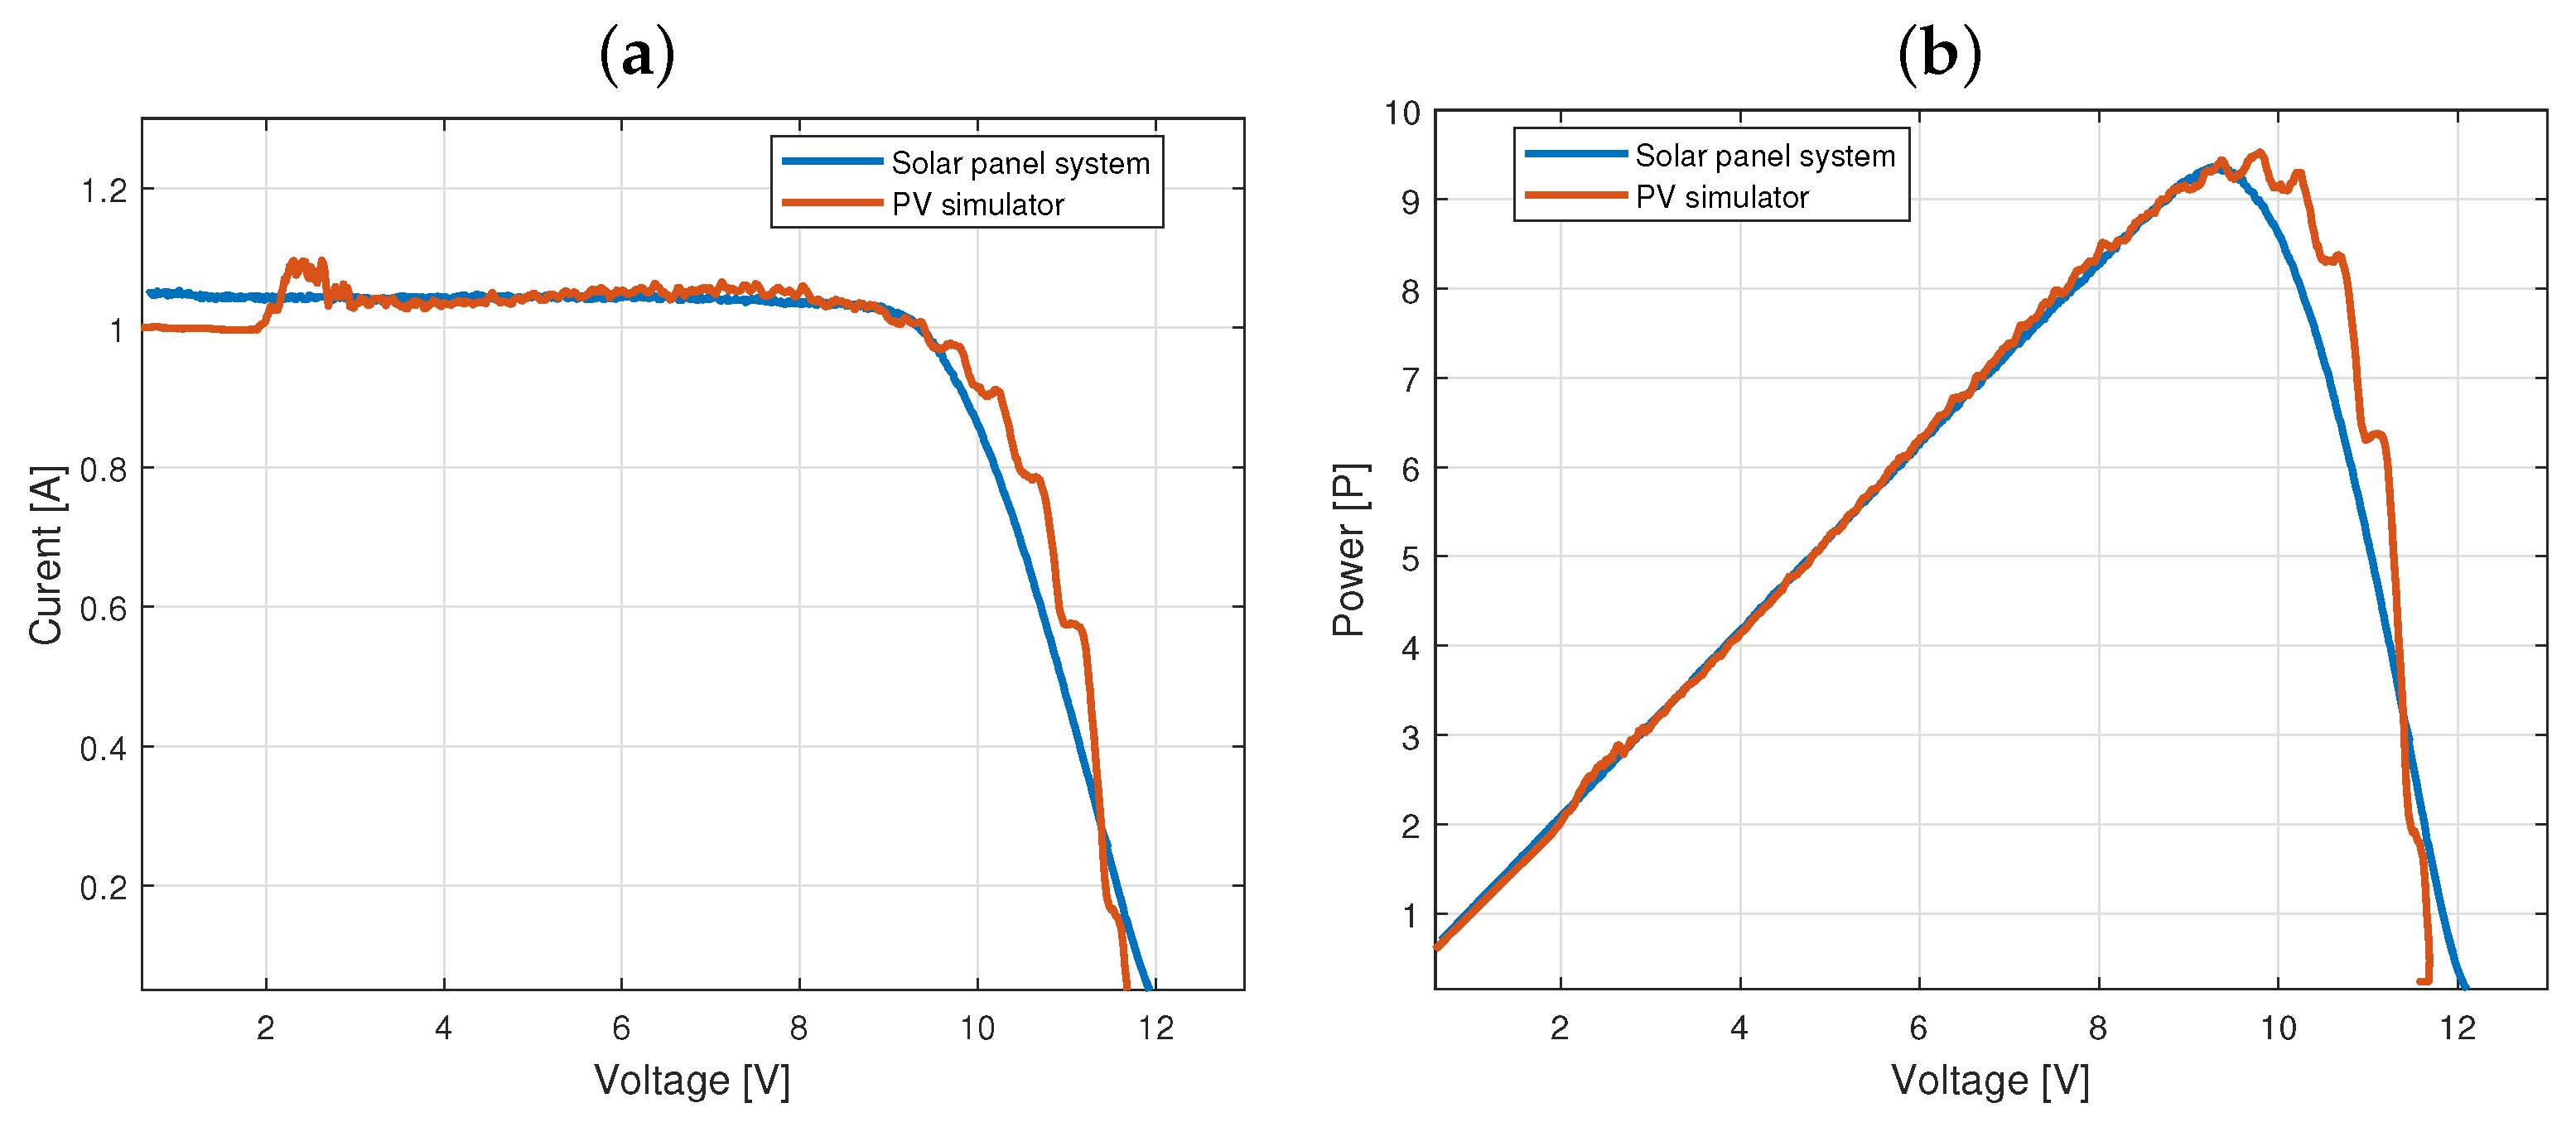
4.2. PV Array Simulator
4.3. DC/DC Converter
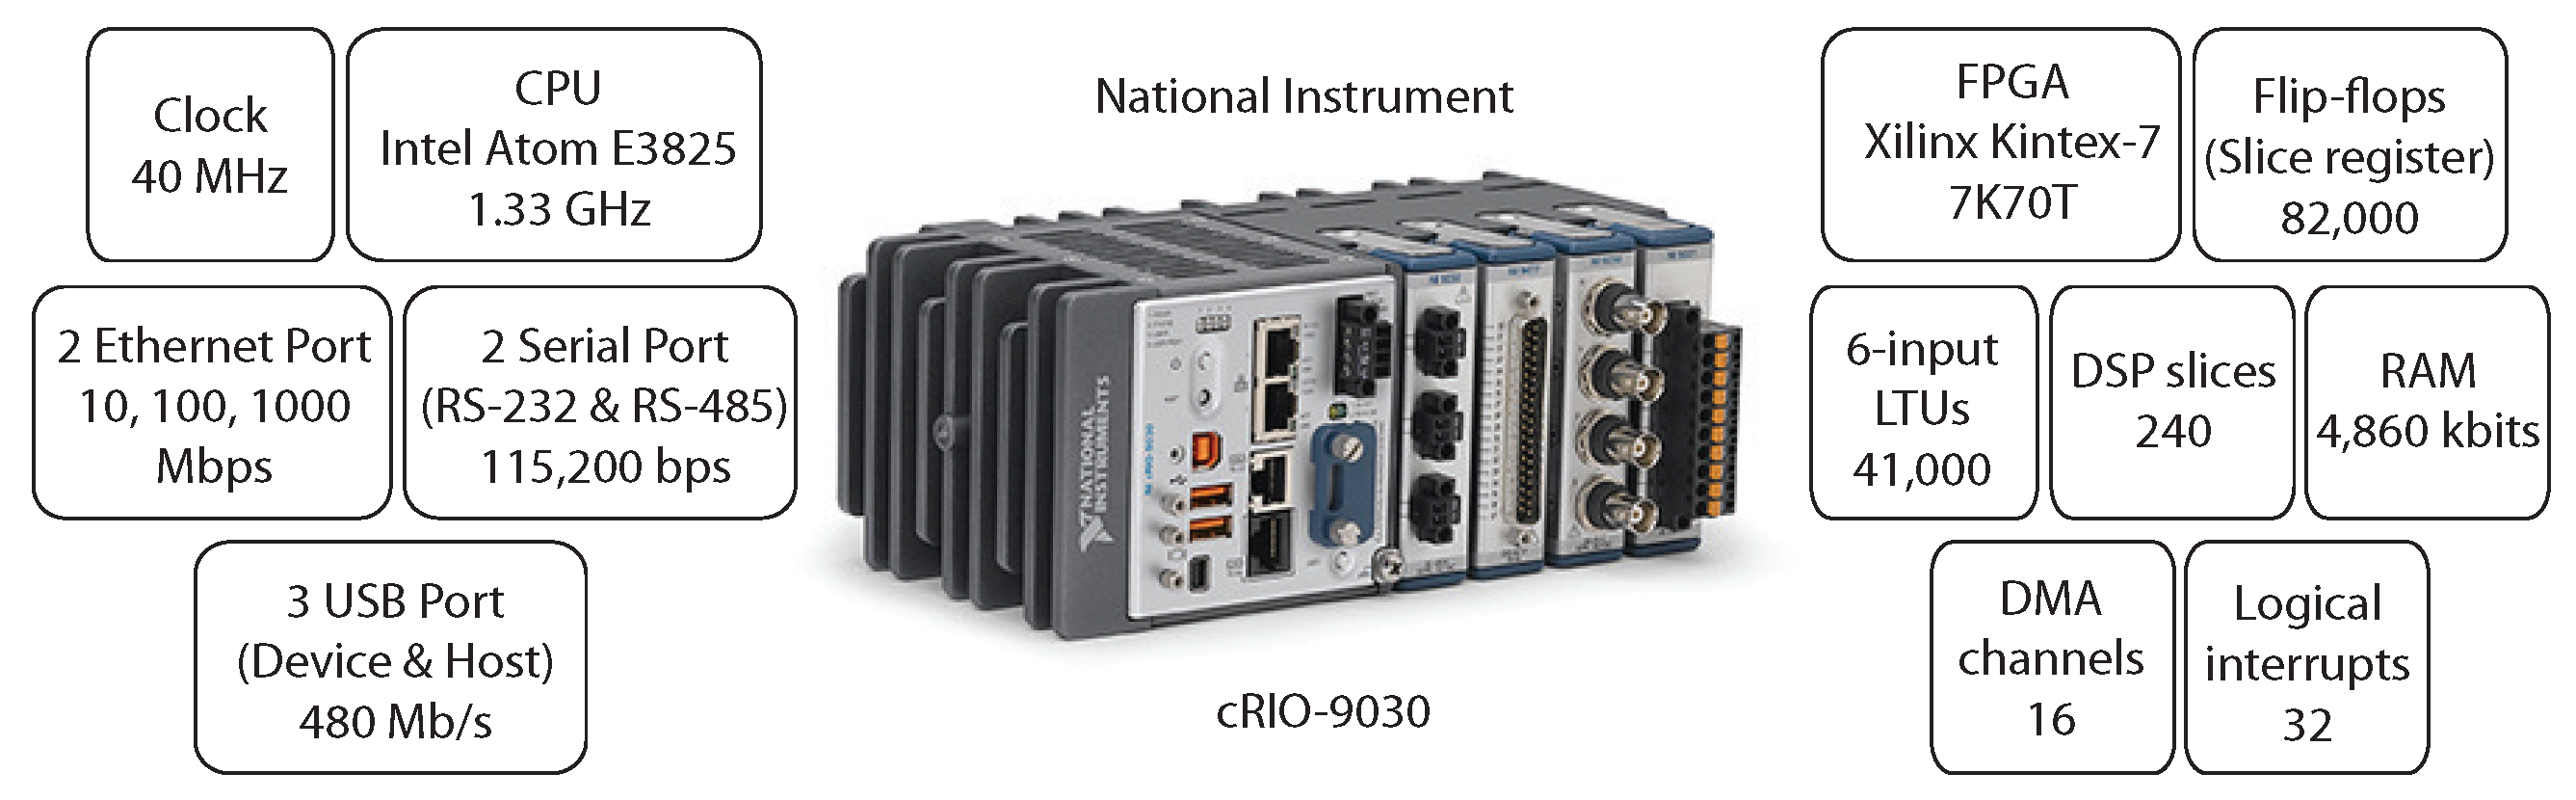
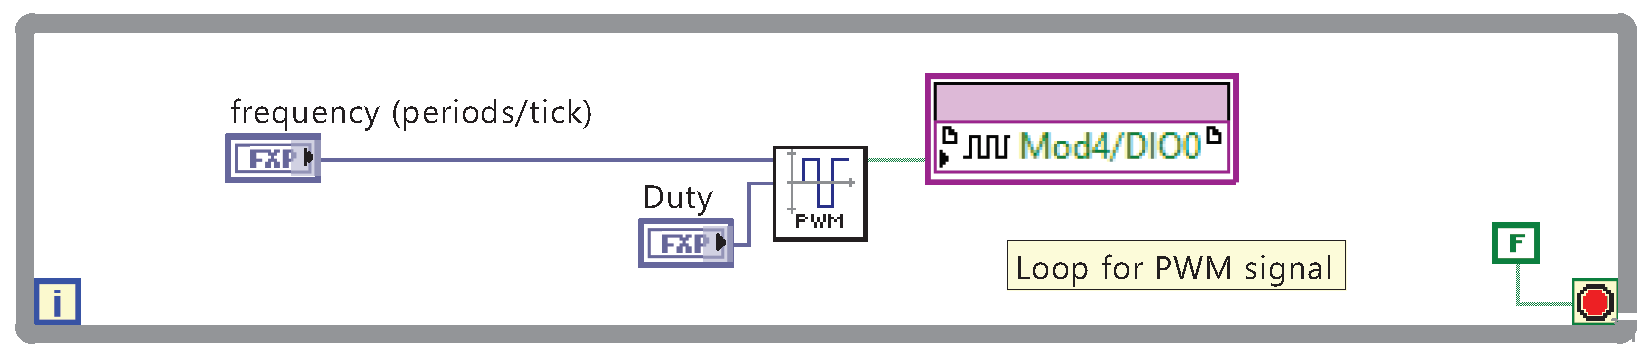
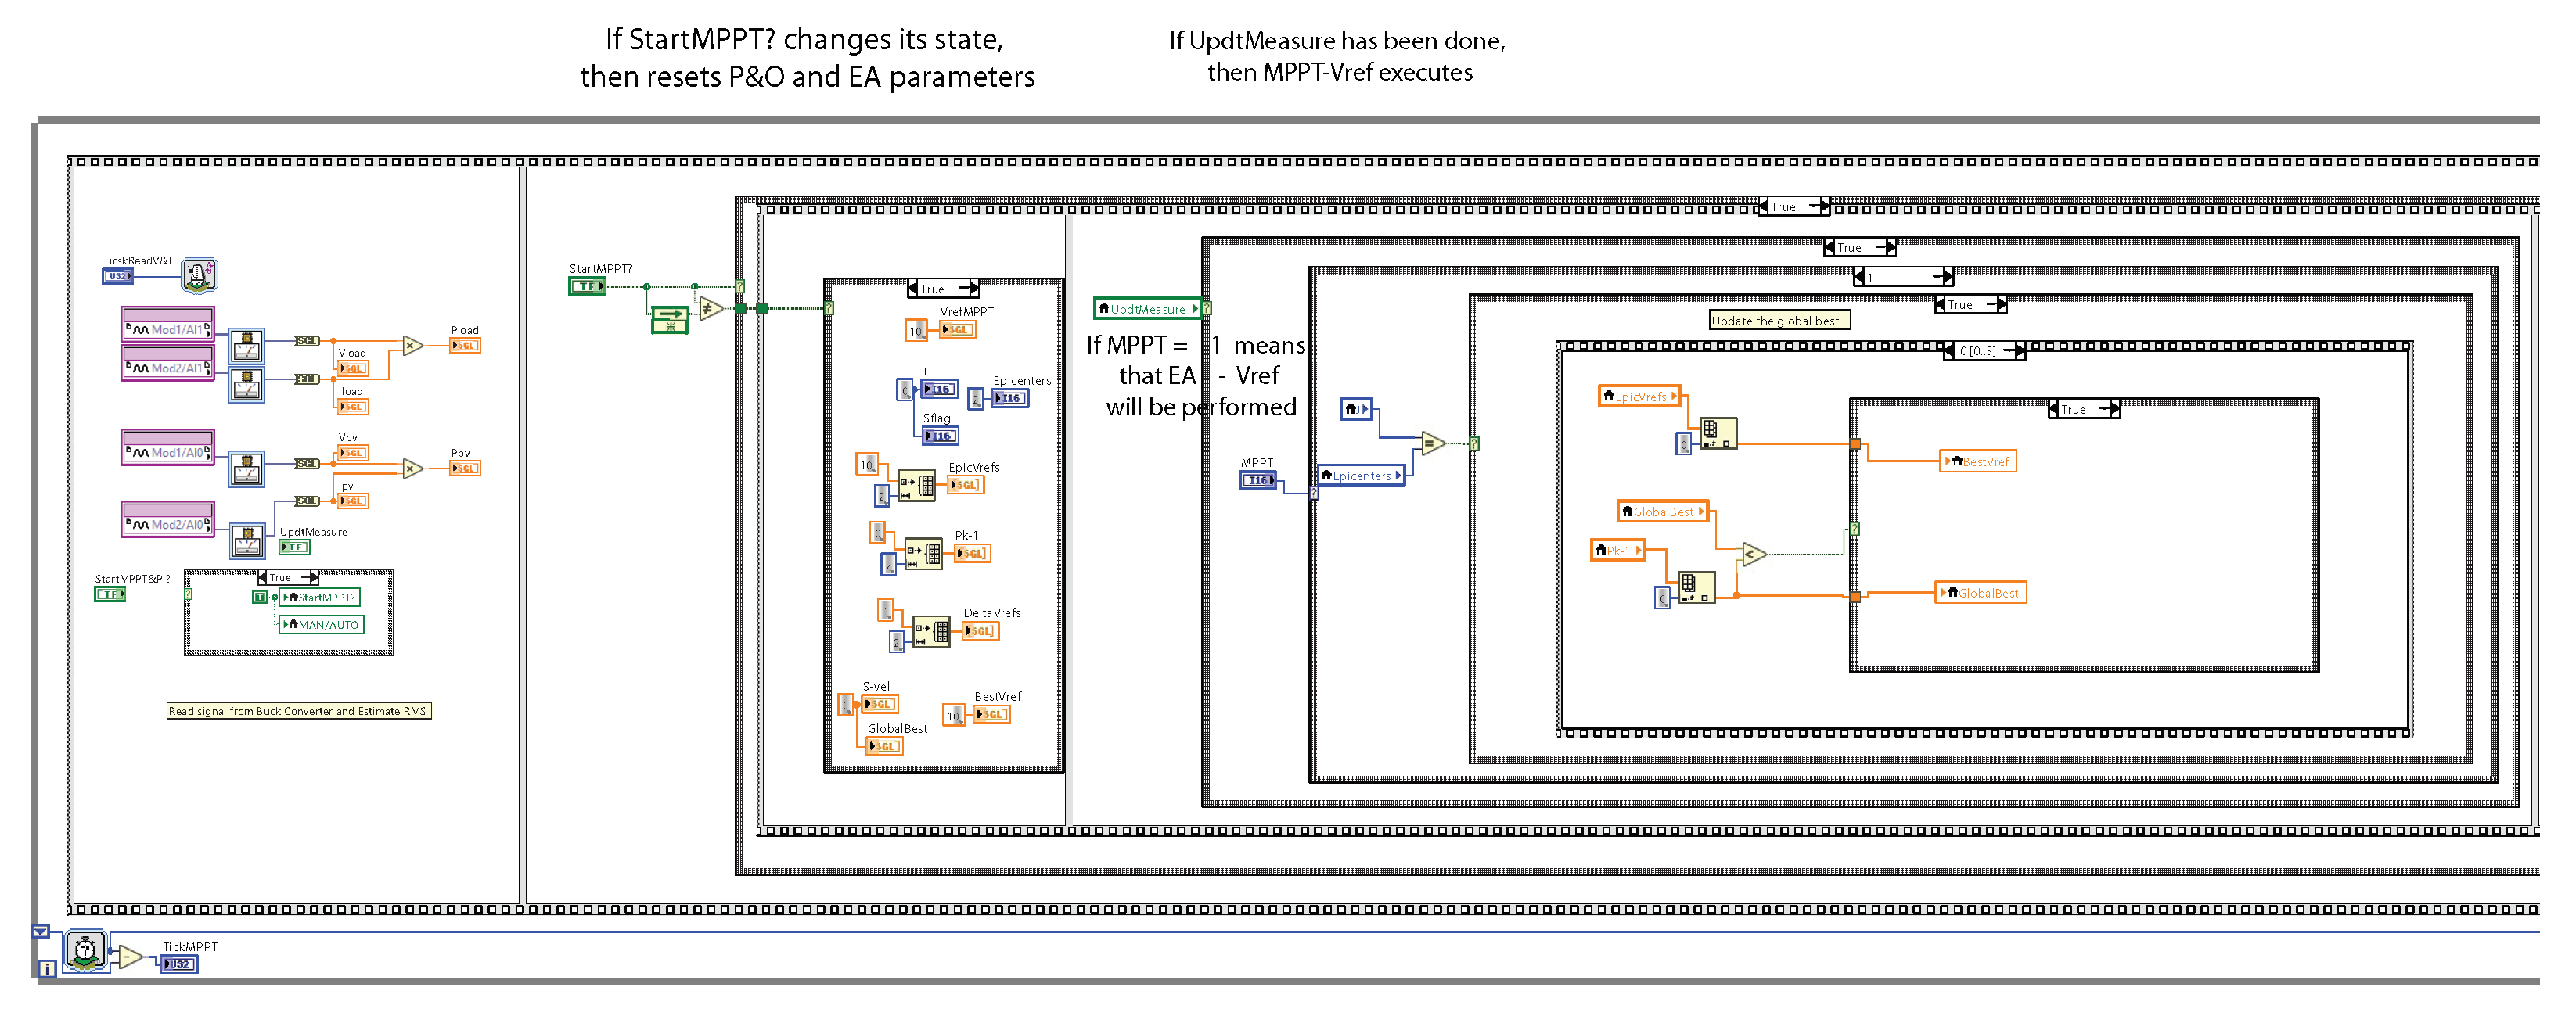
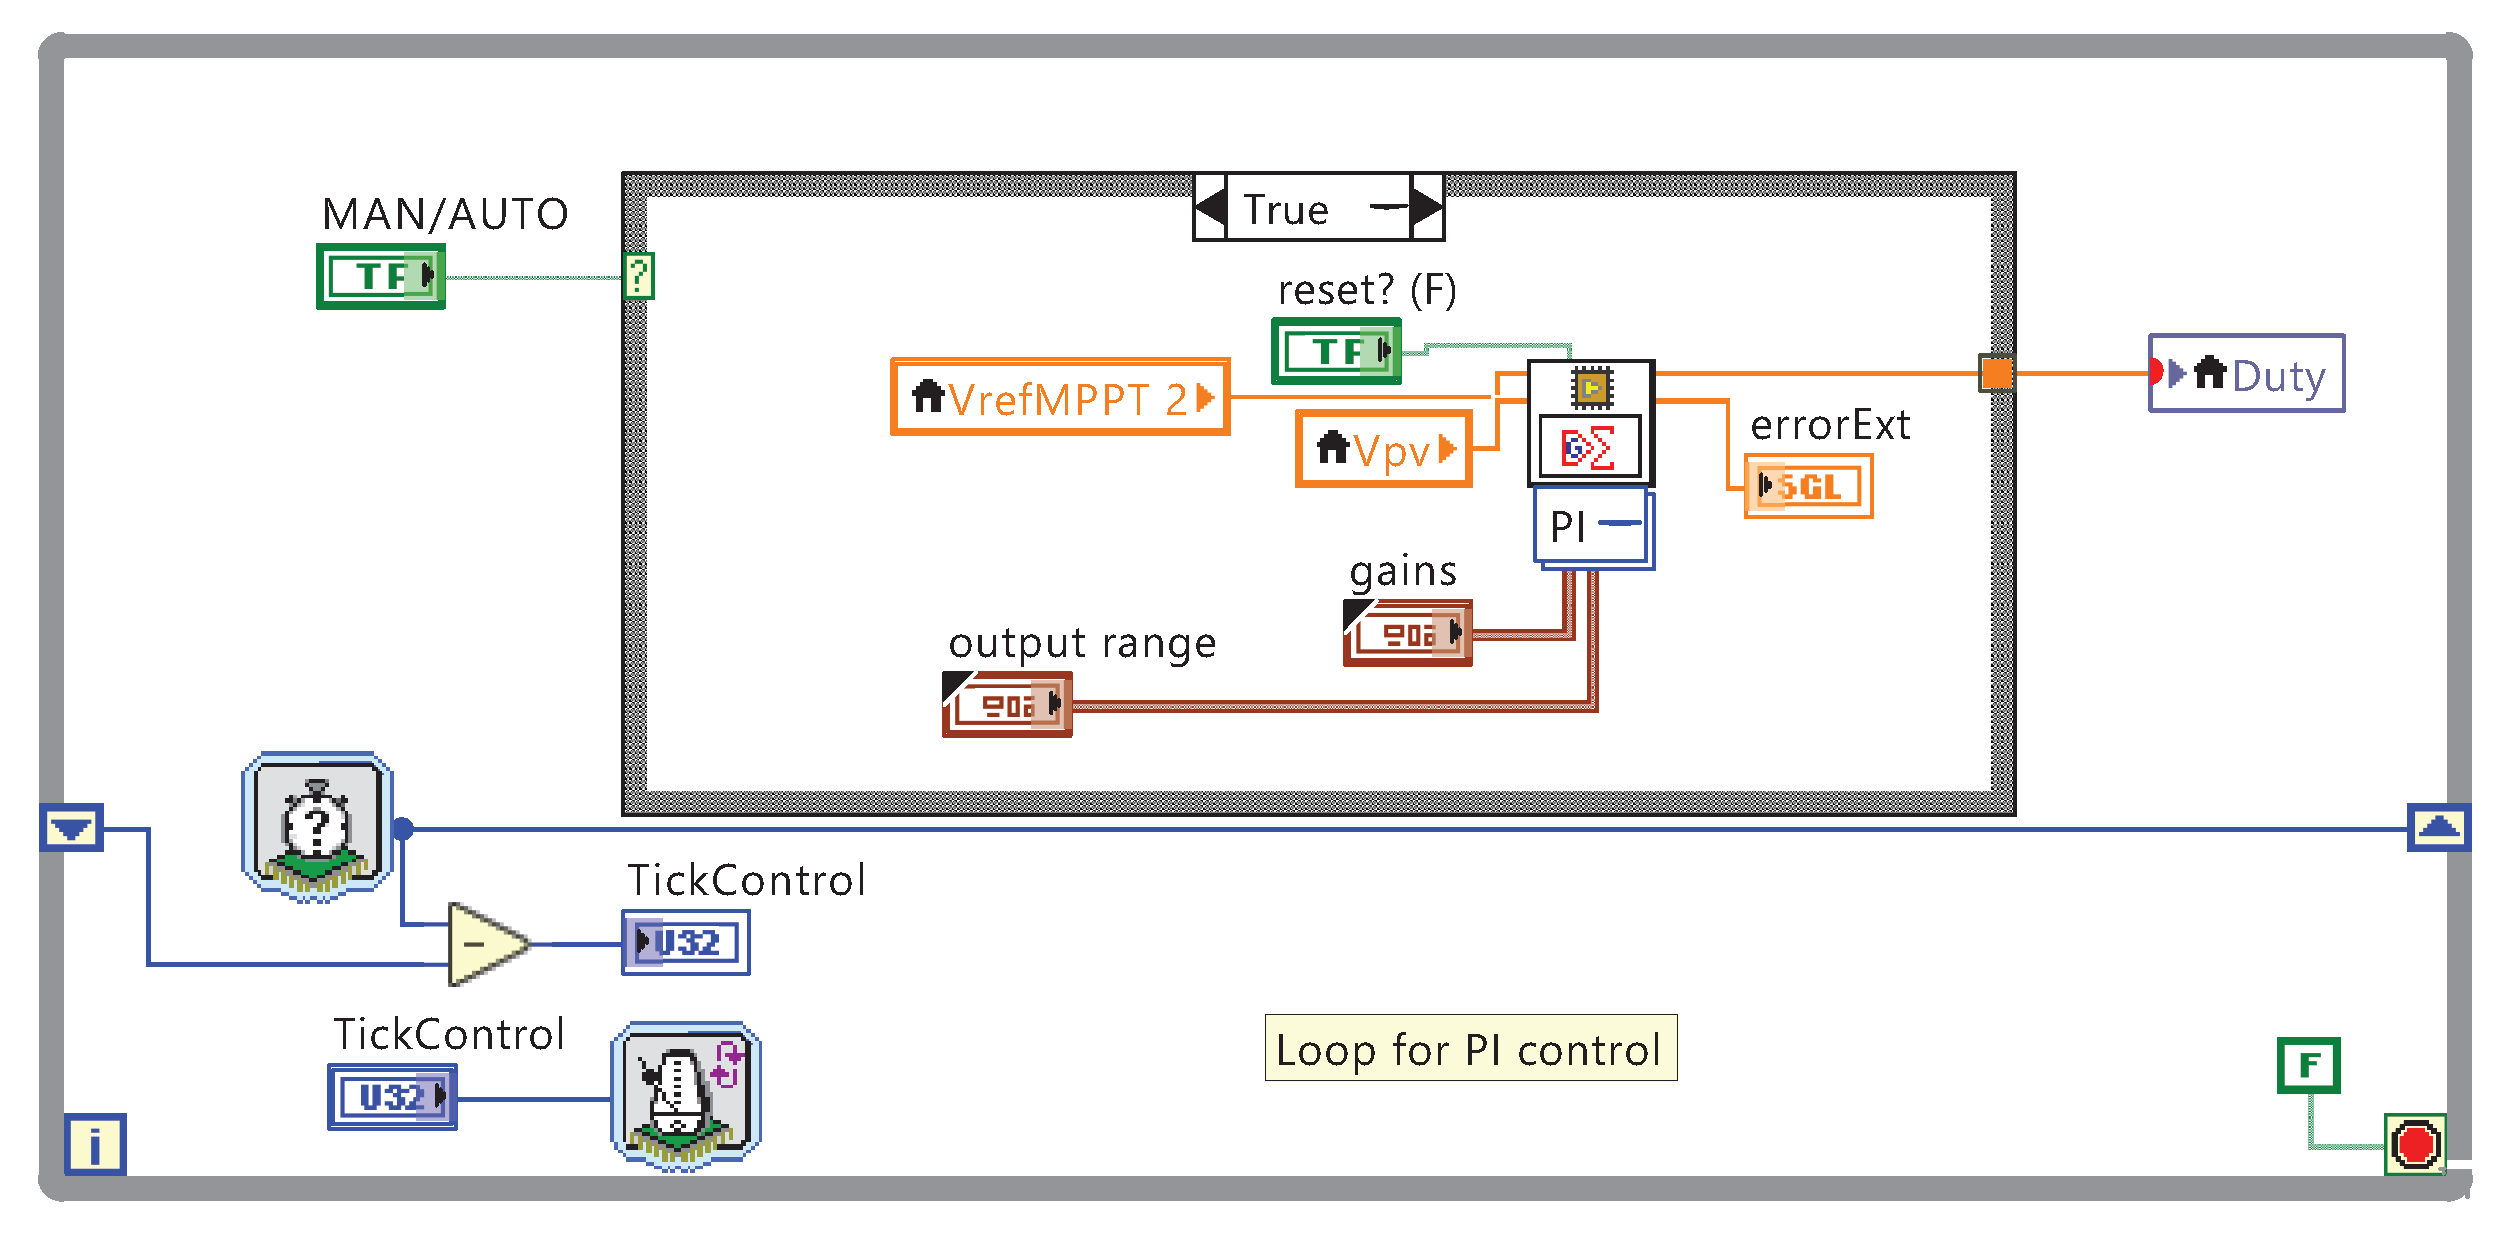
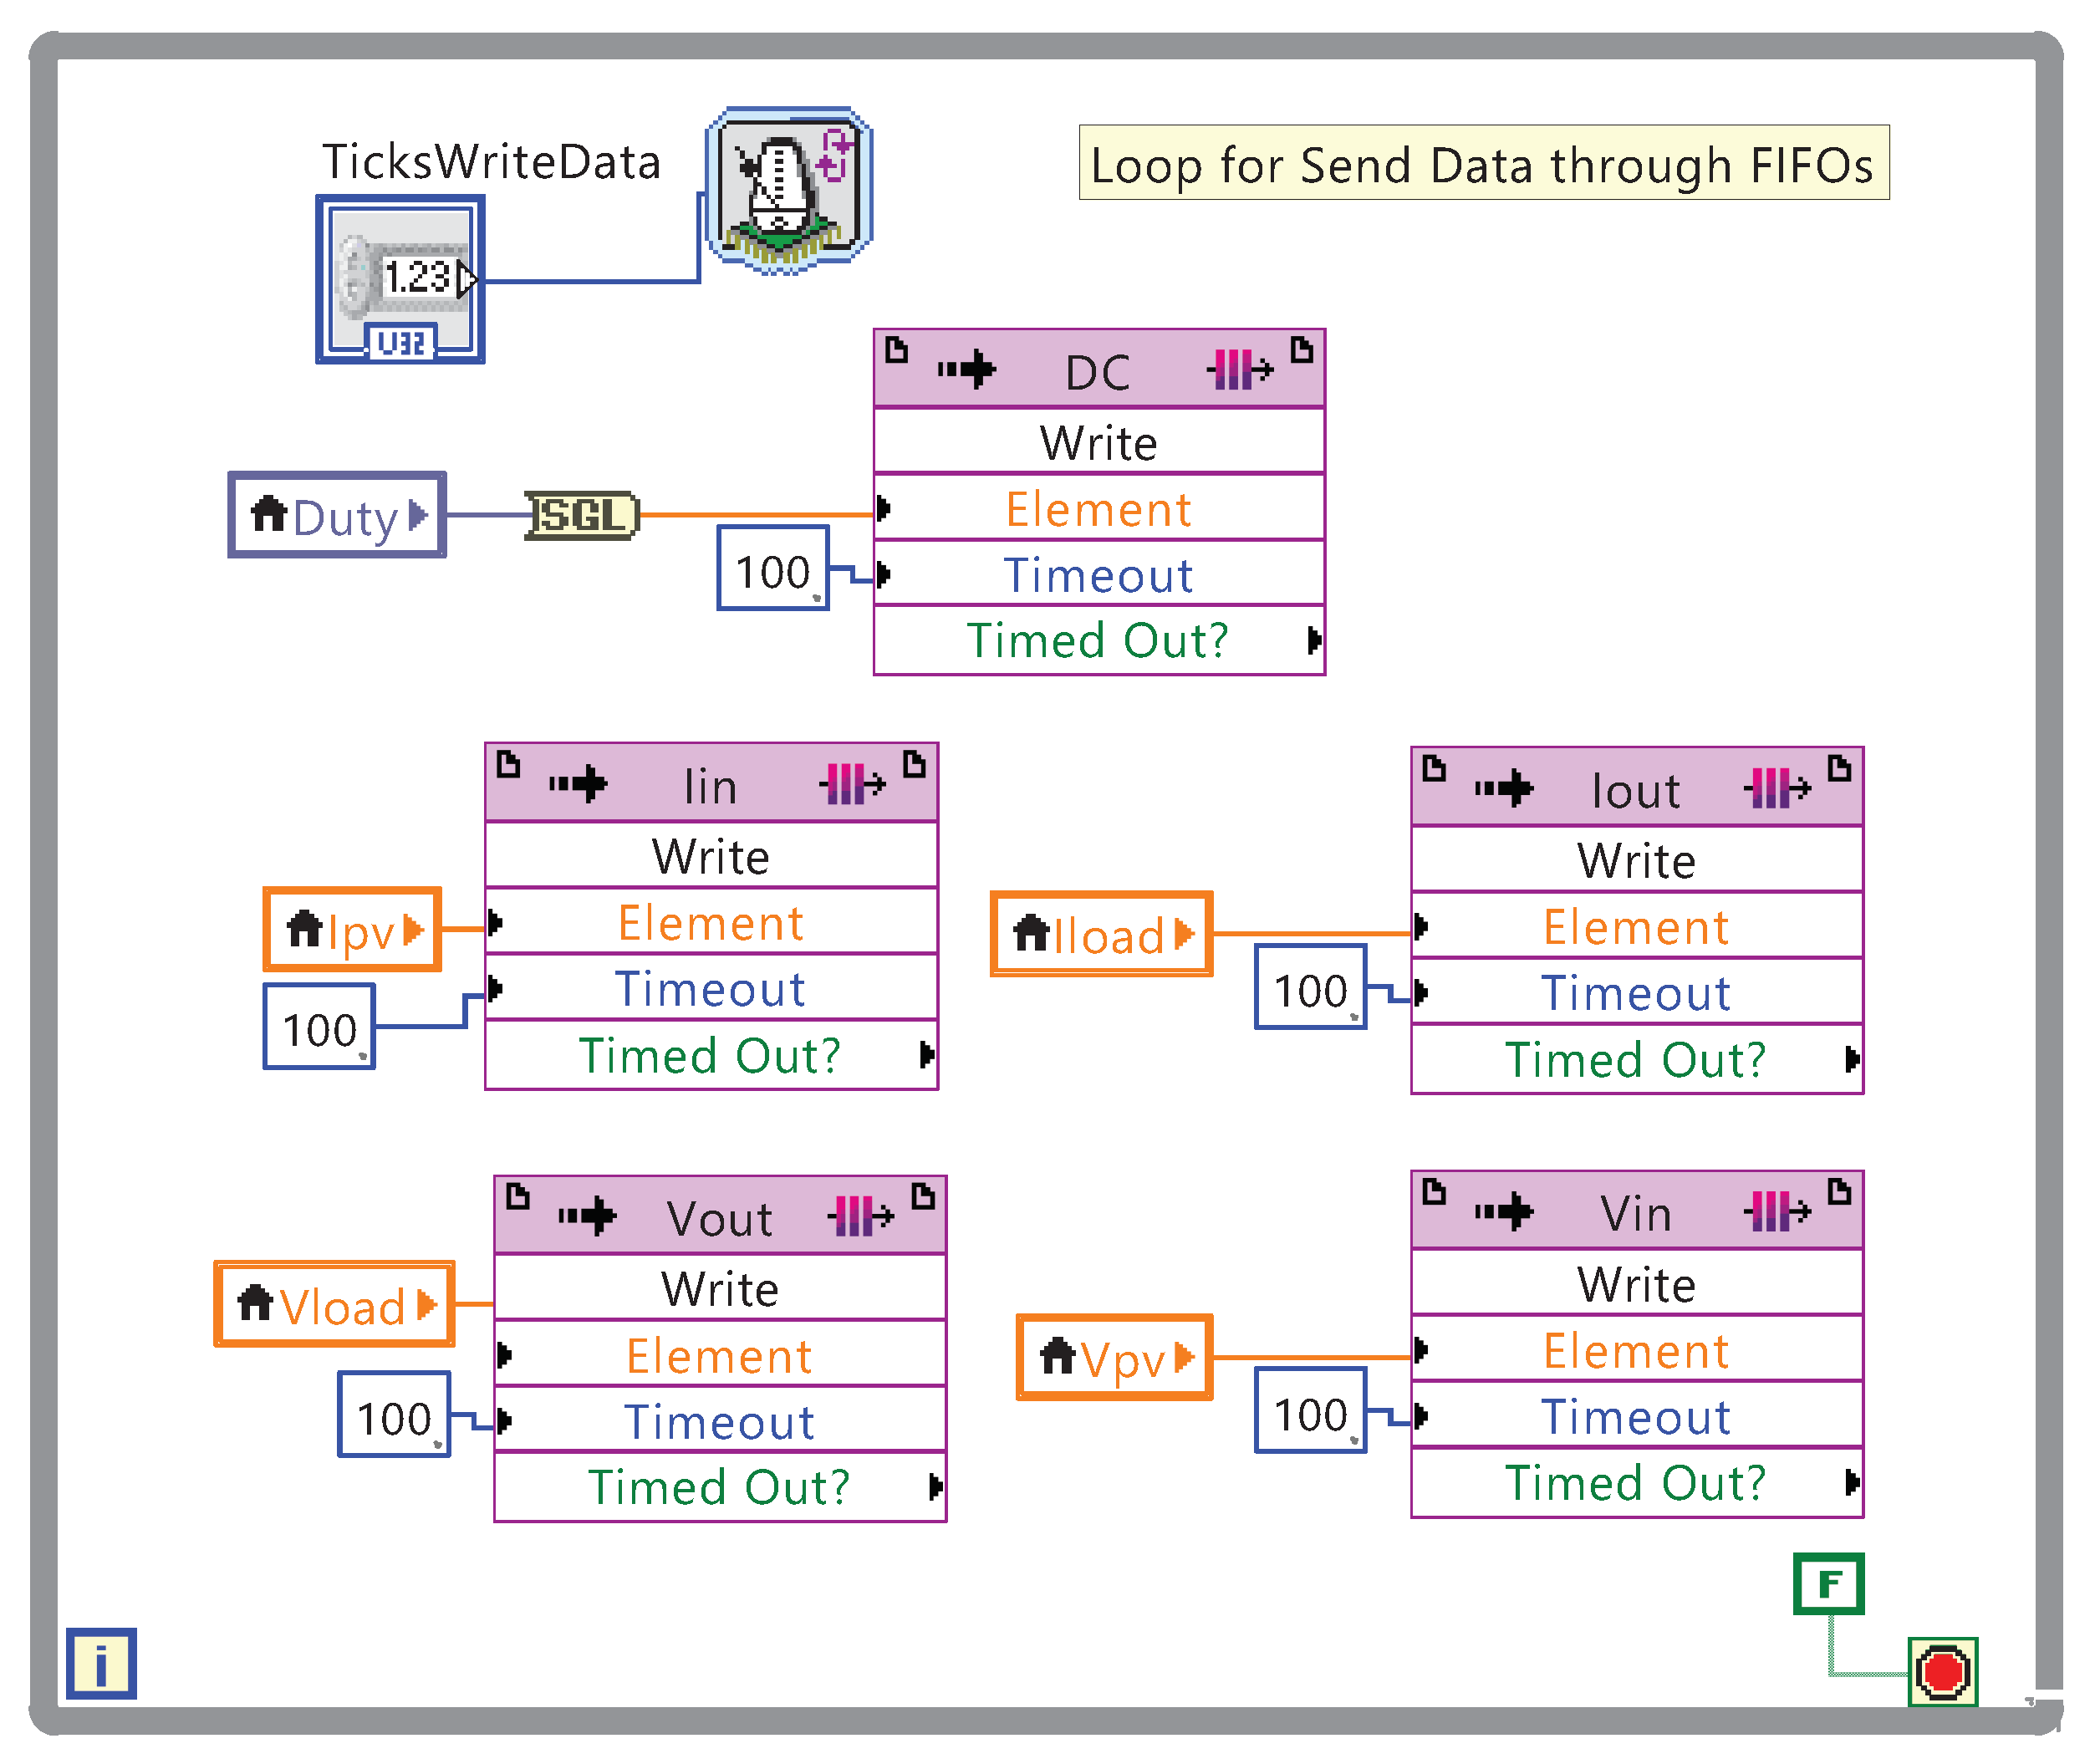
4.4. LabVIEW FPGA
5. EN50530 Test
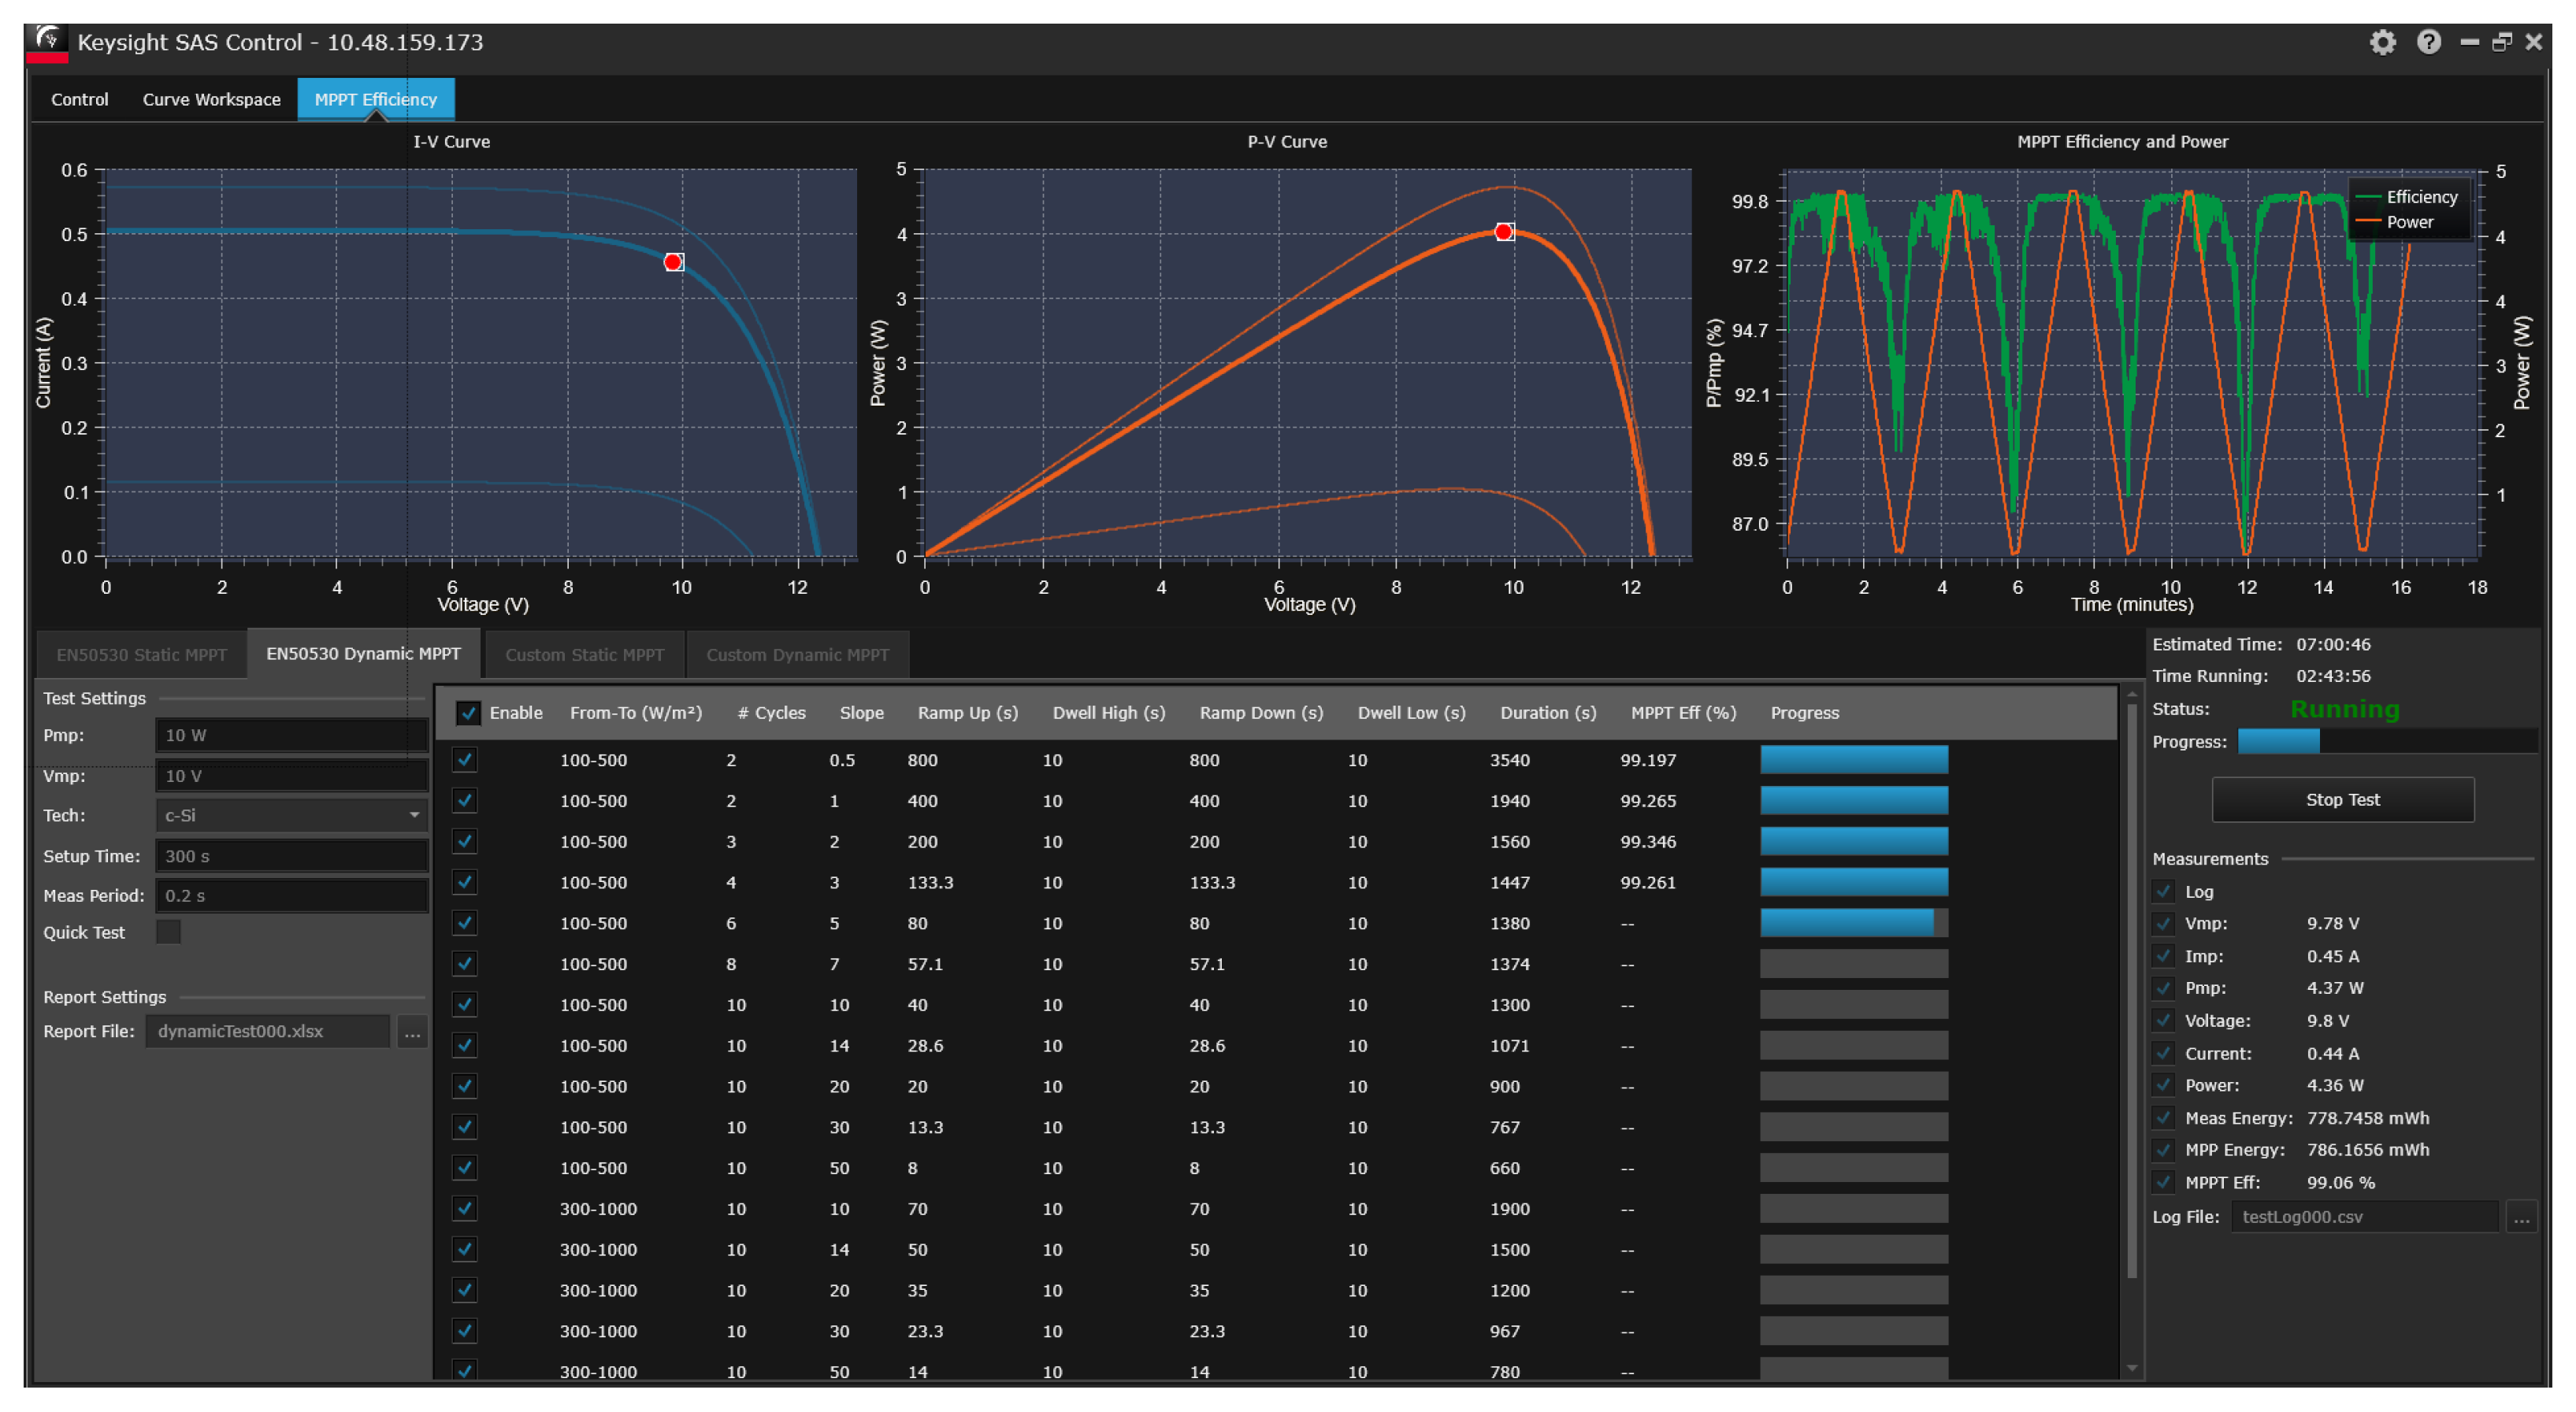
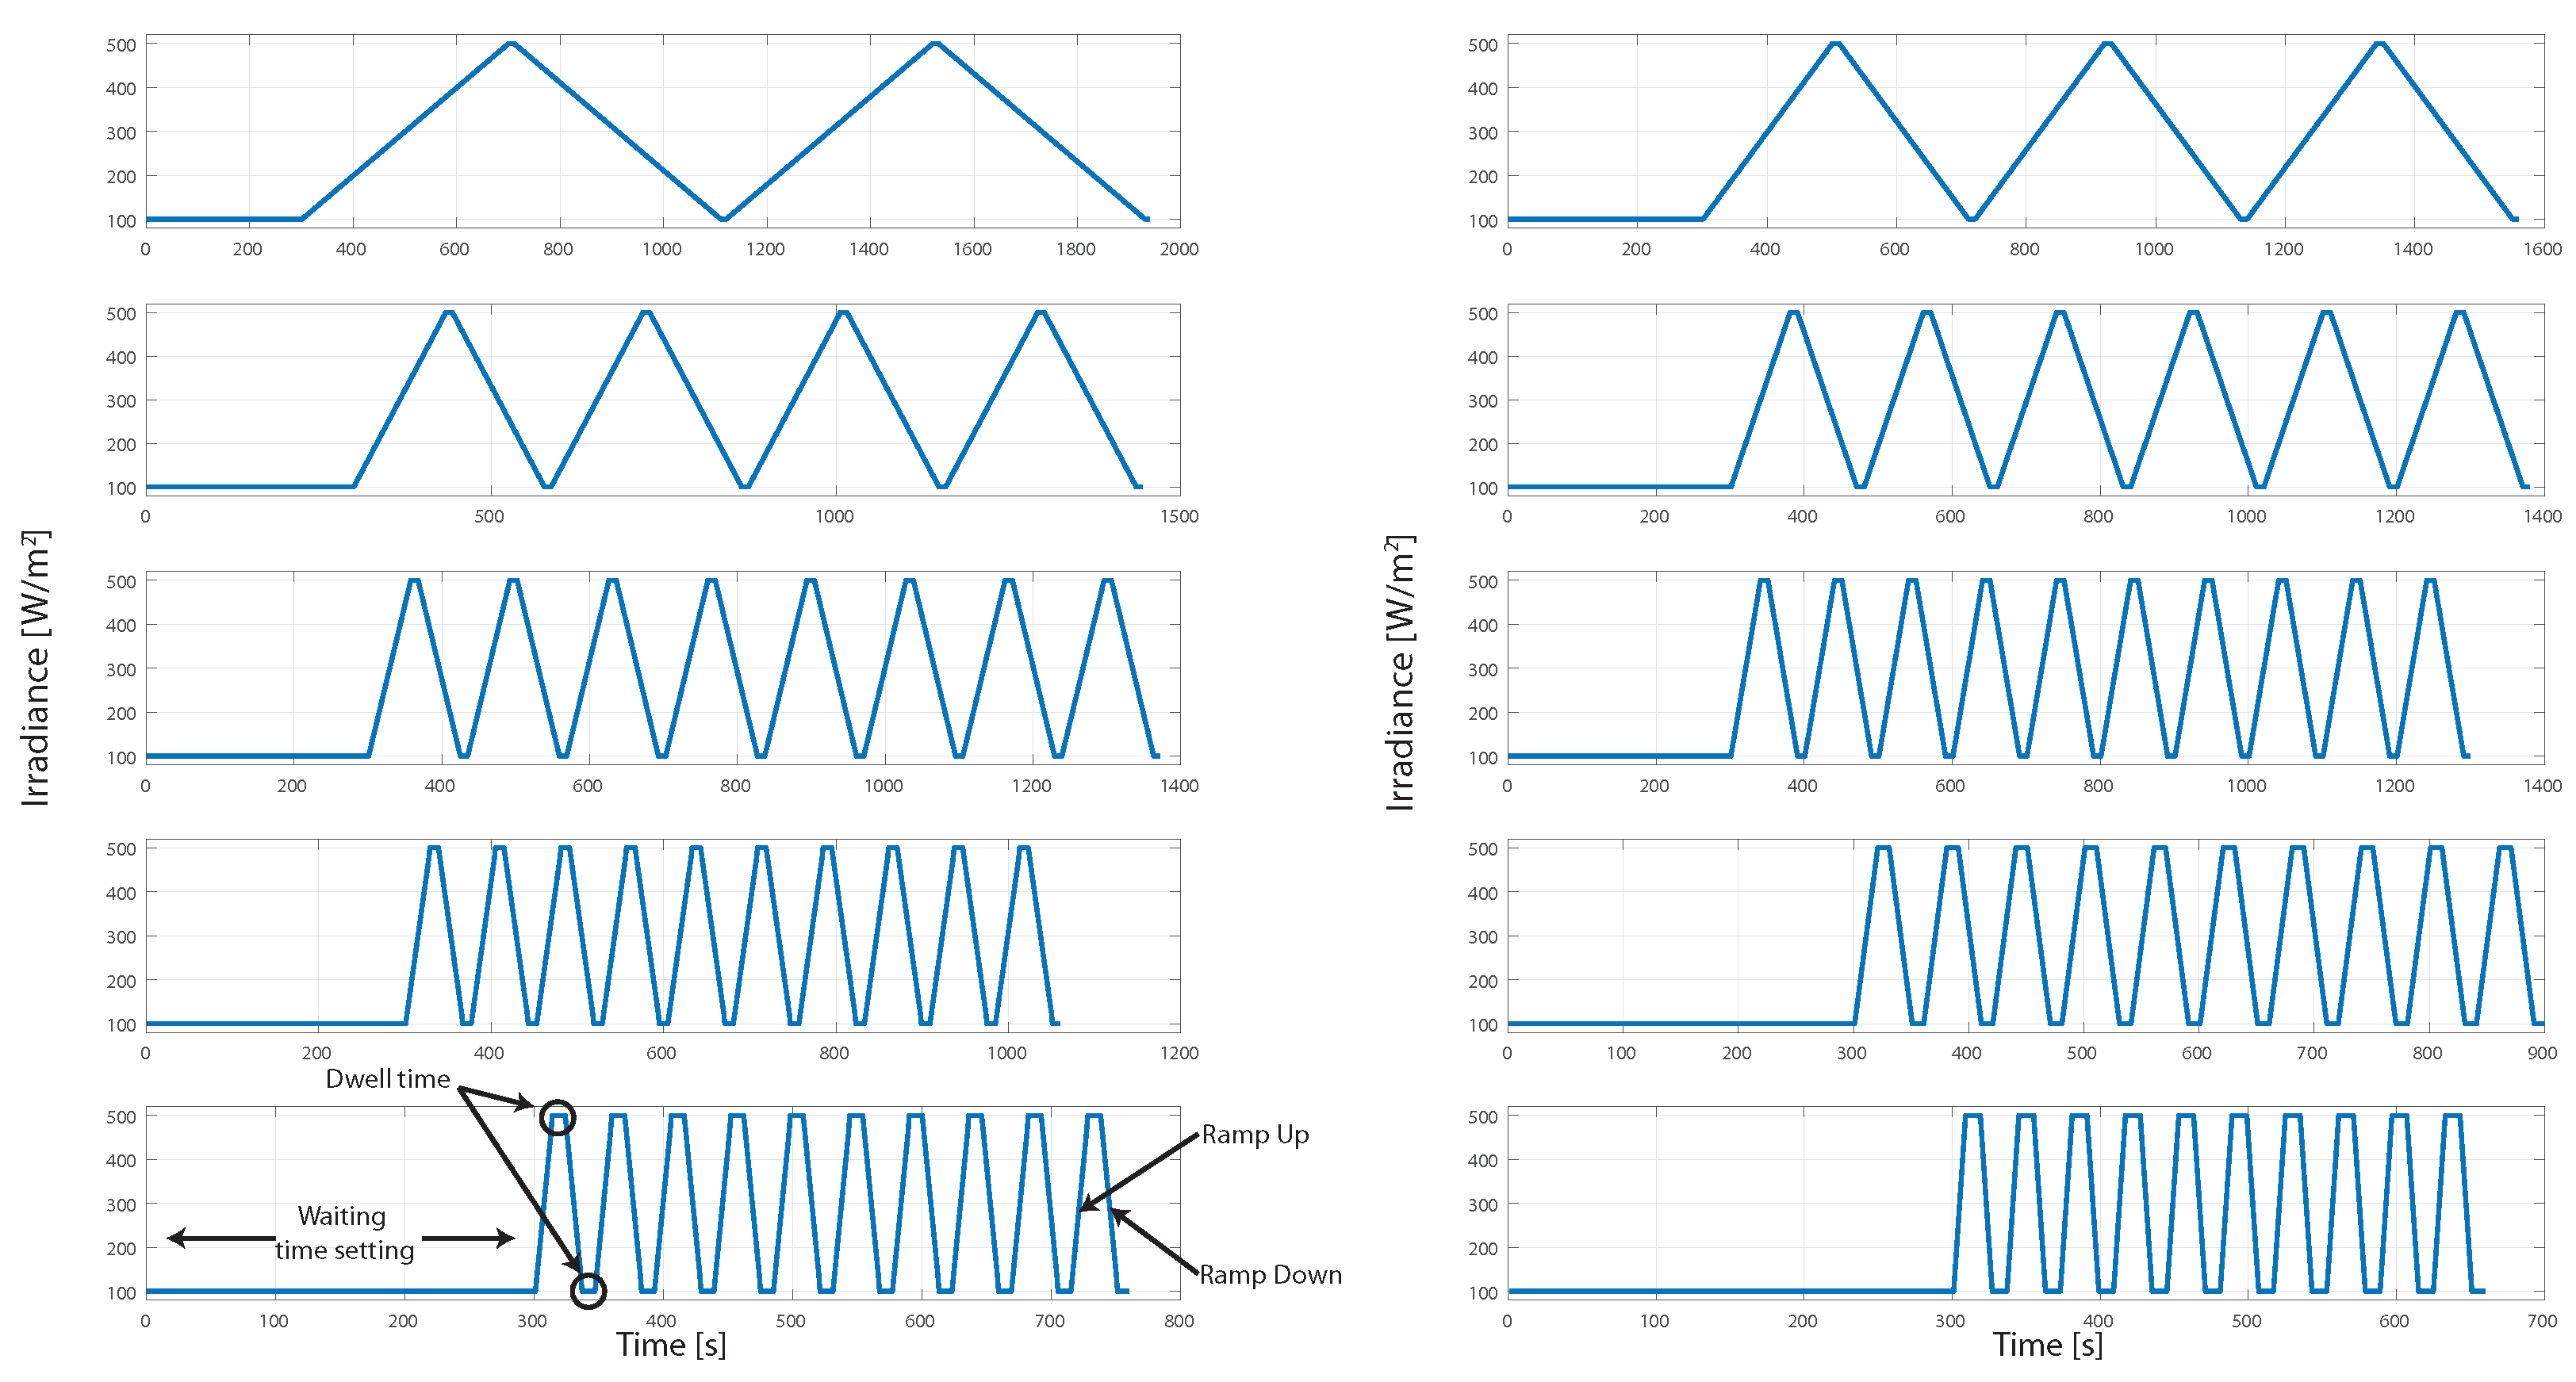
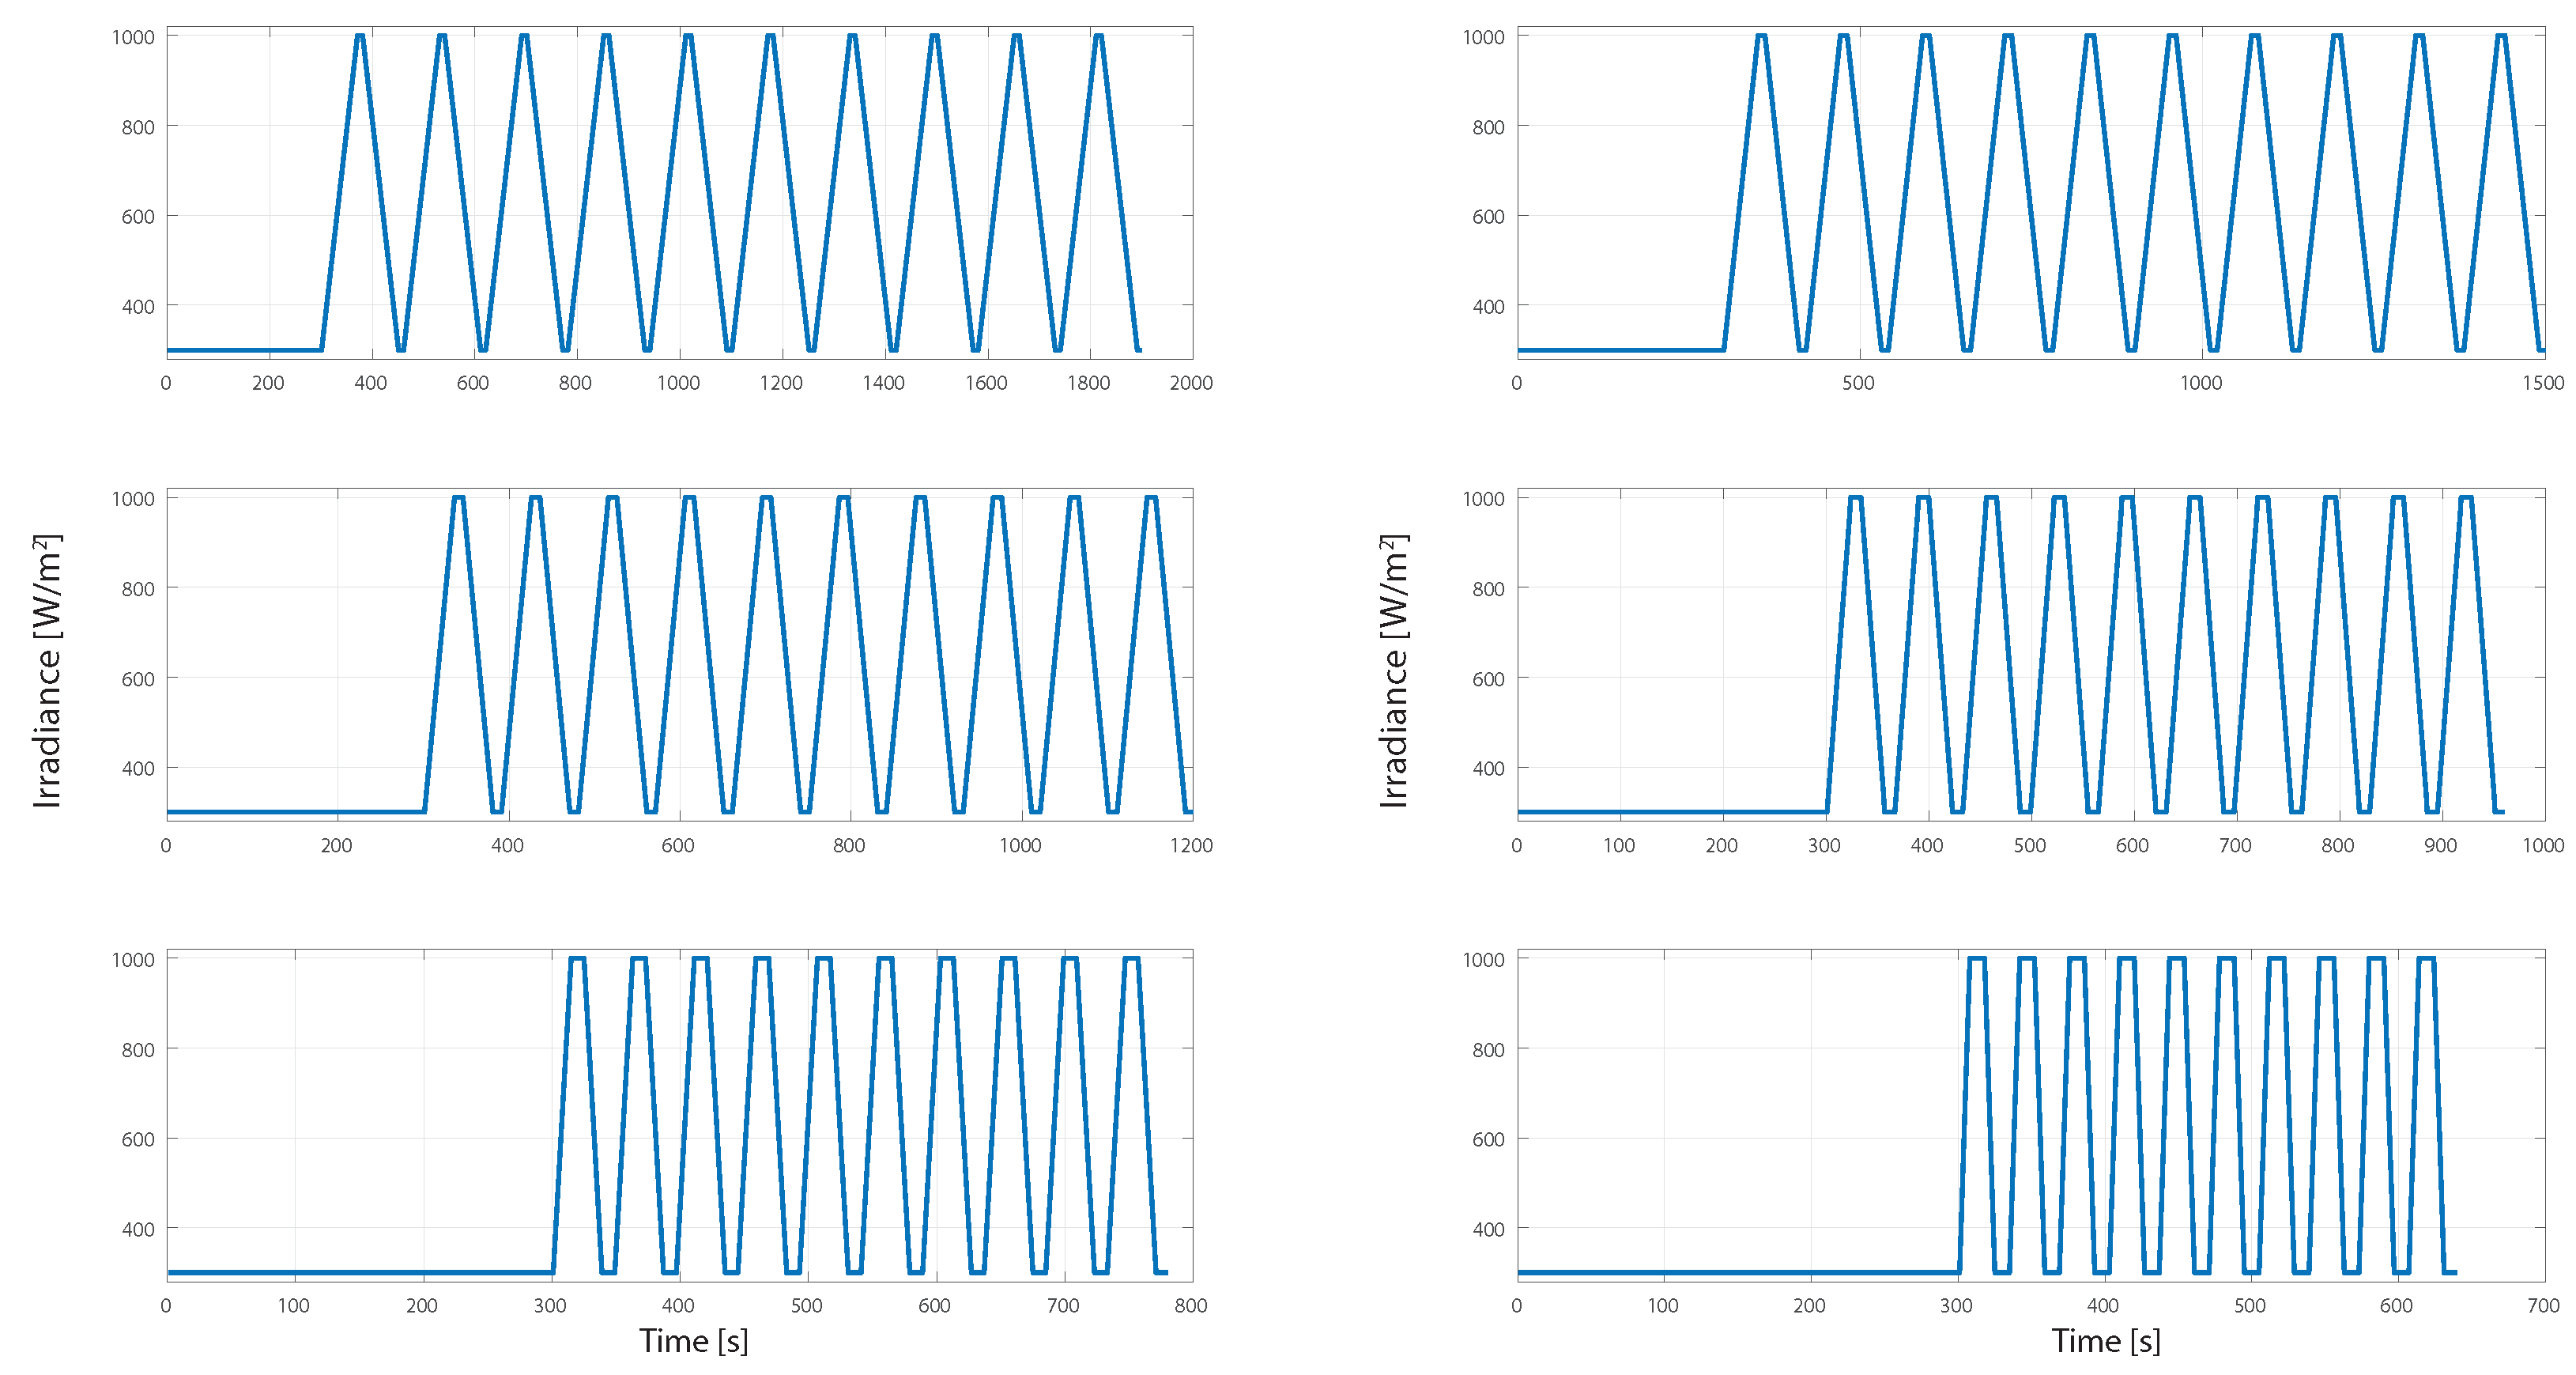
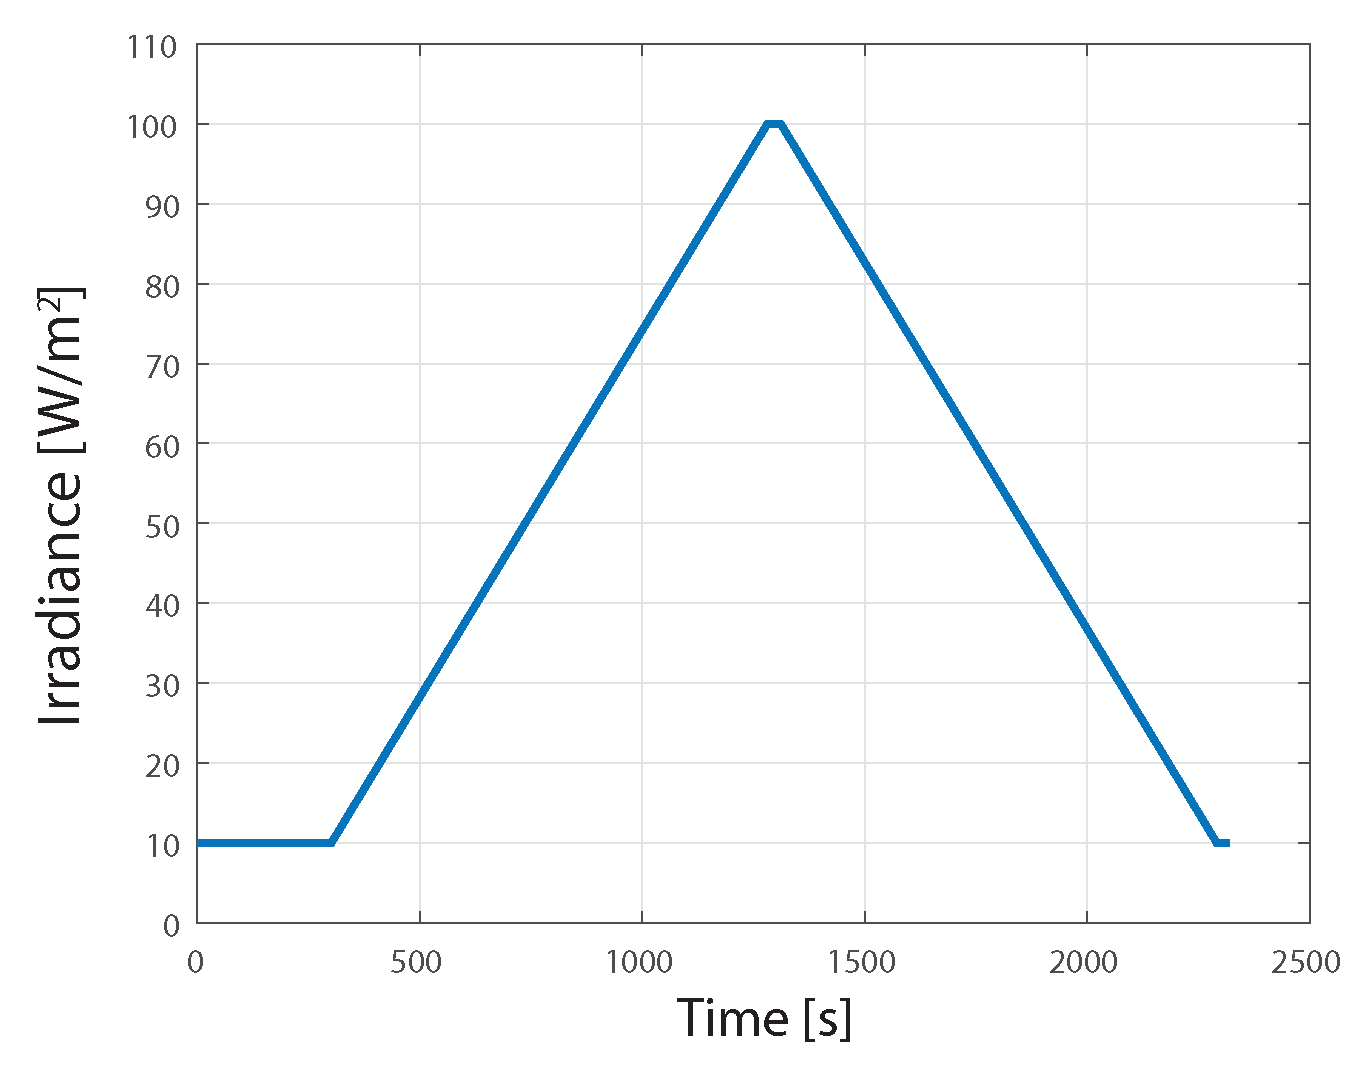
5.1. Dynamic Test
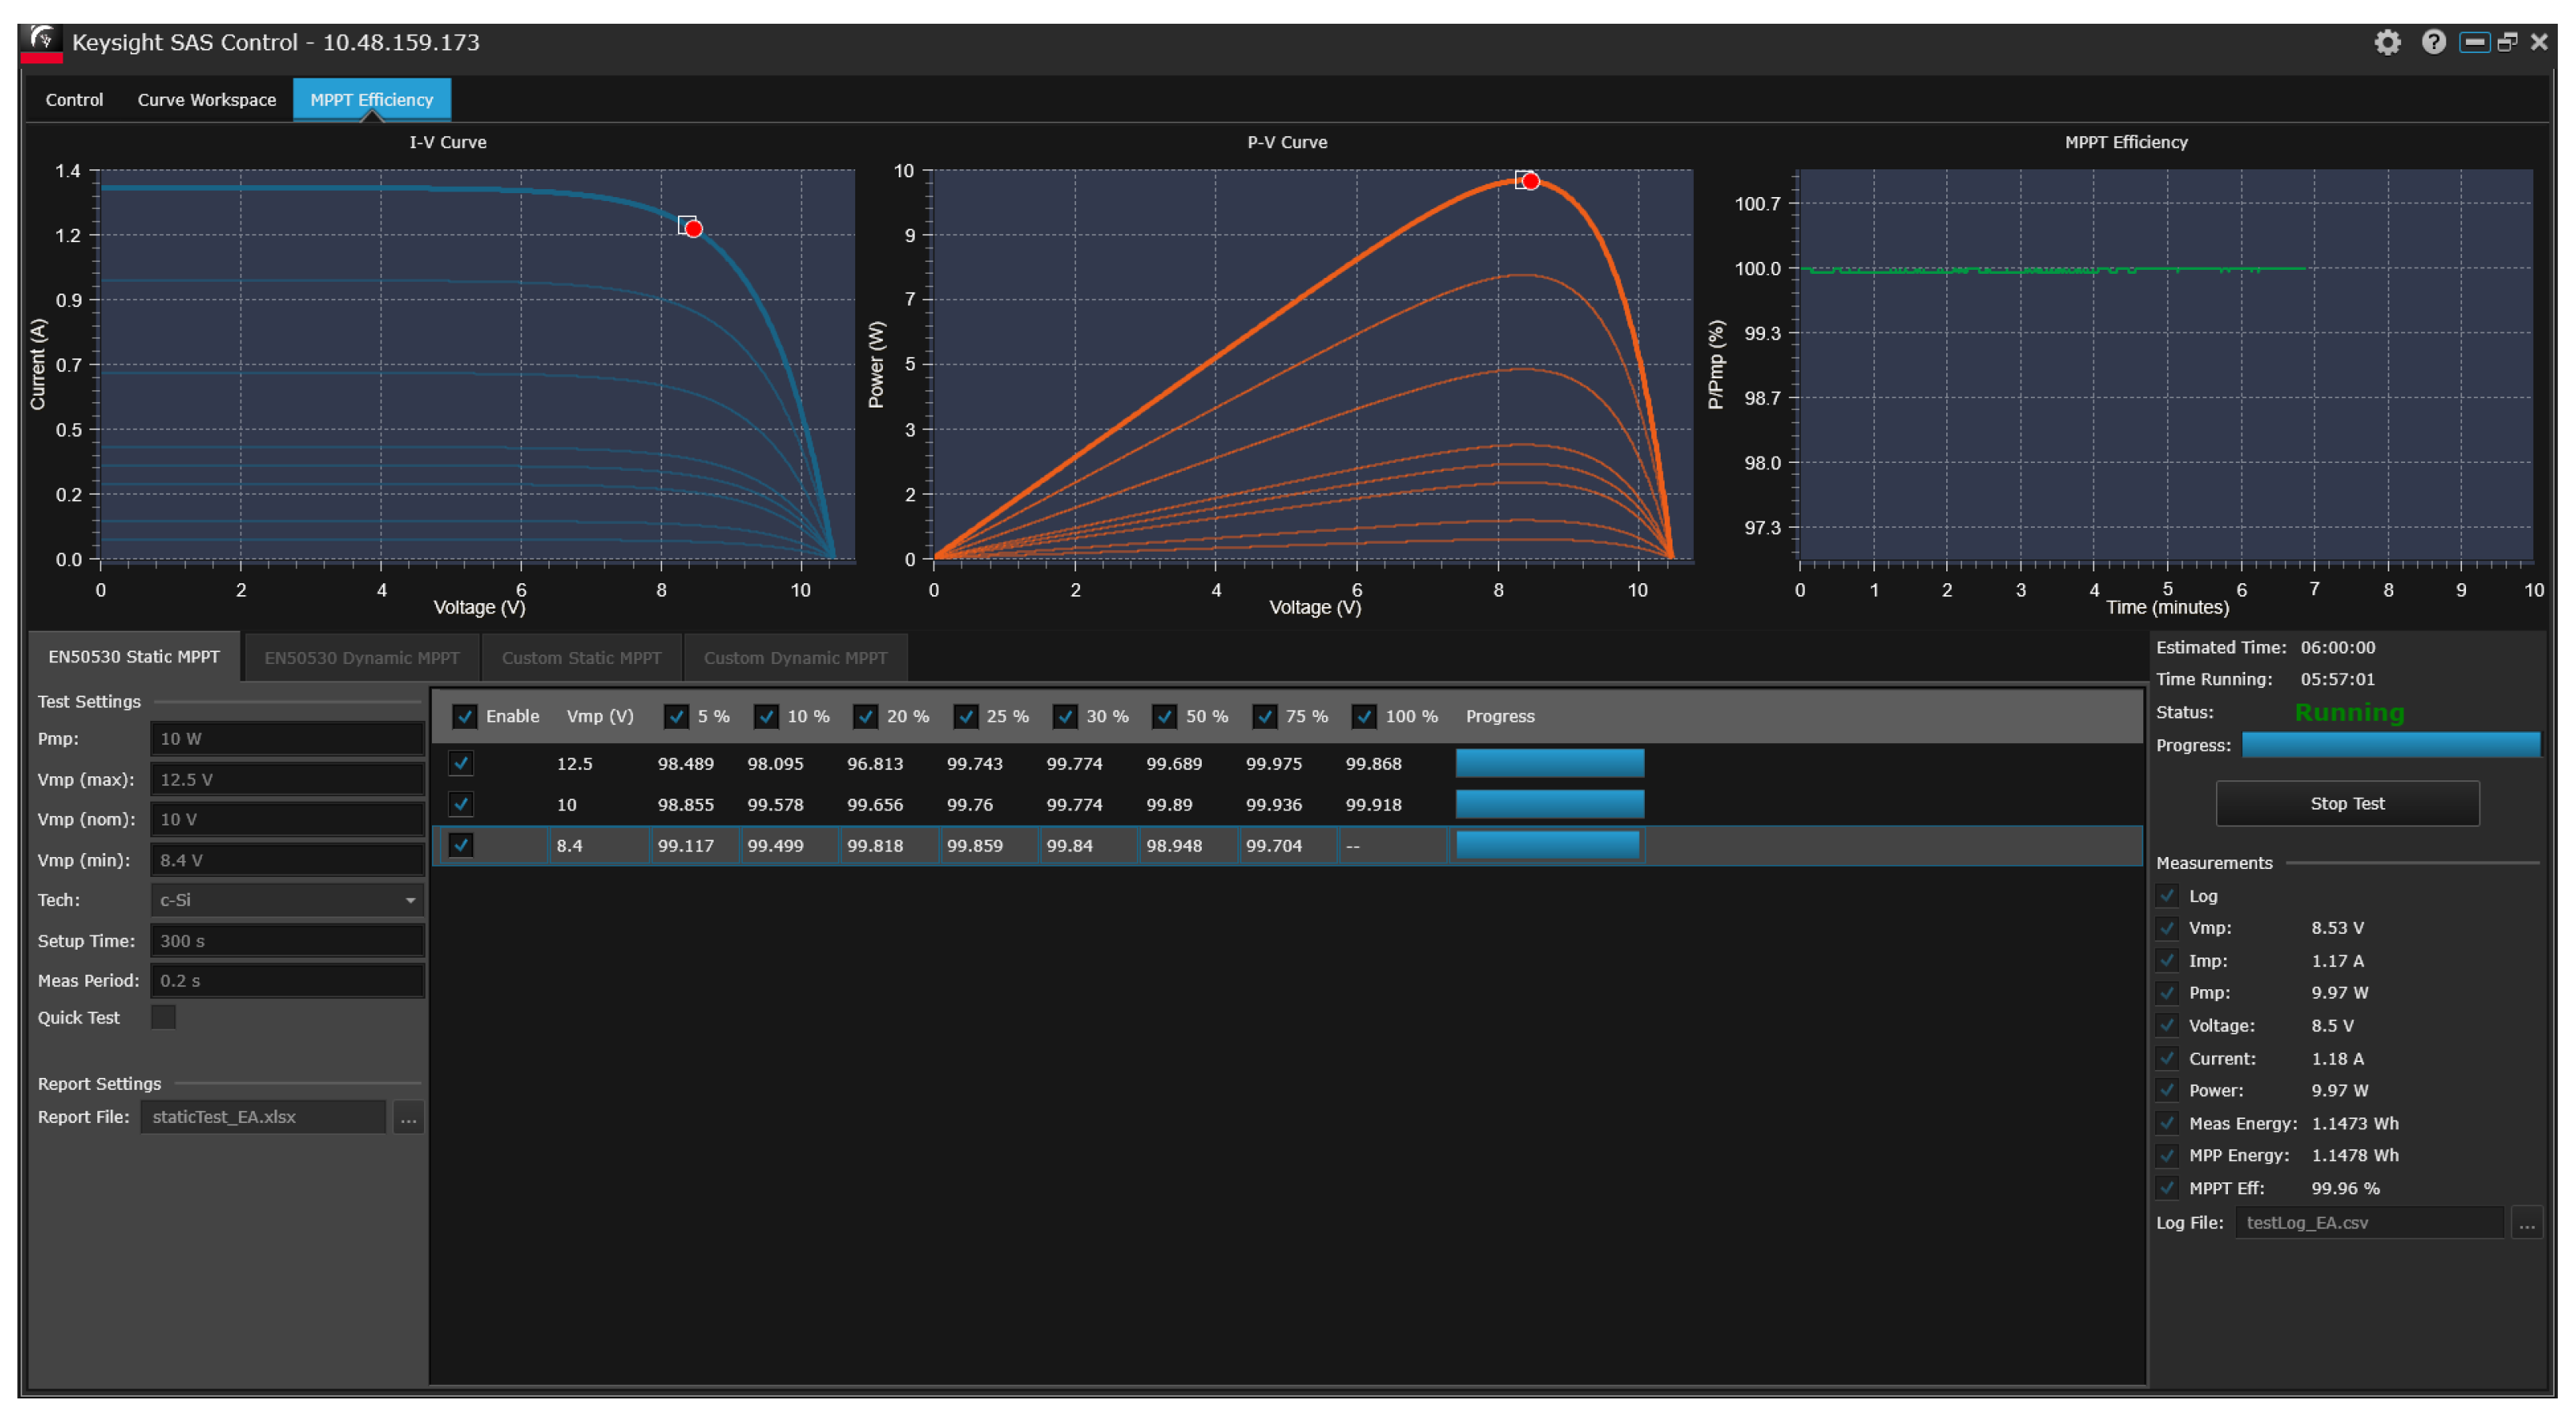
5.2. Static Test
6. Results
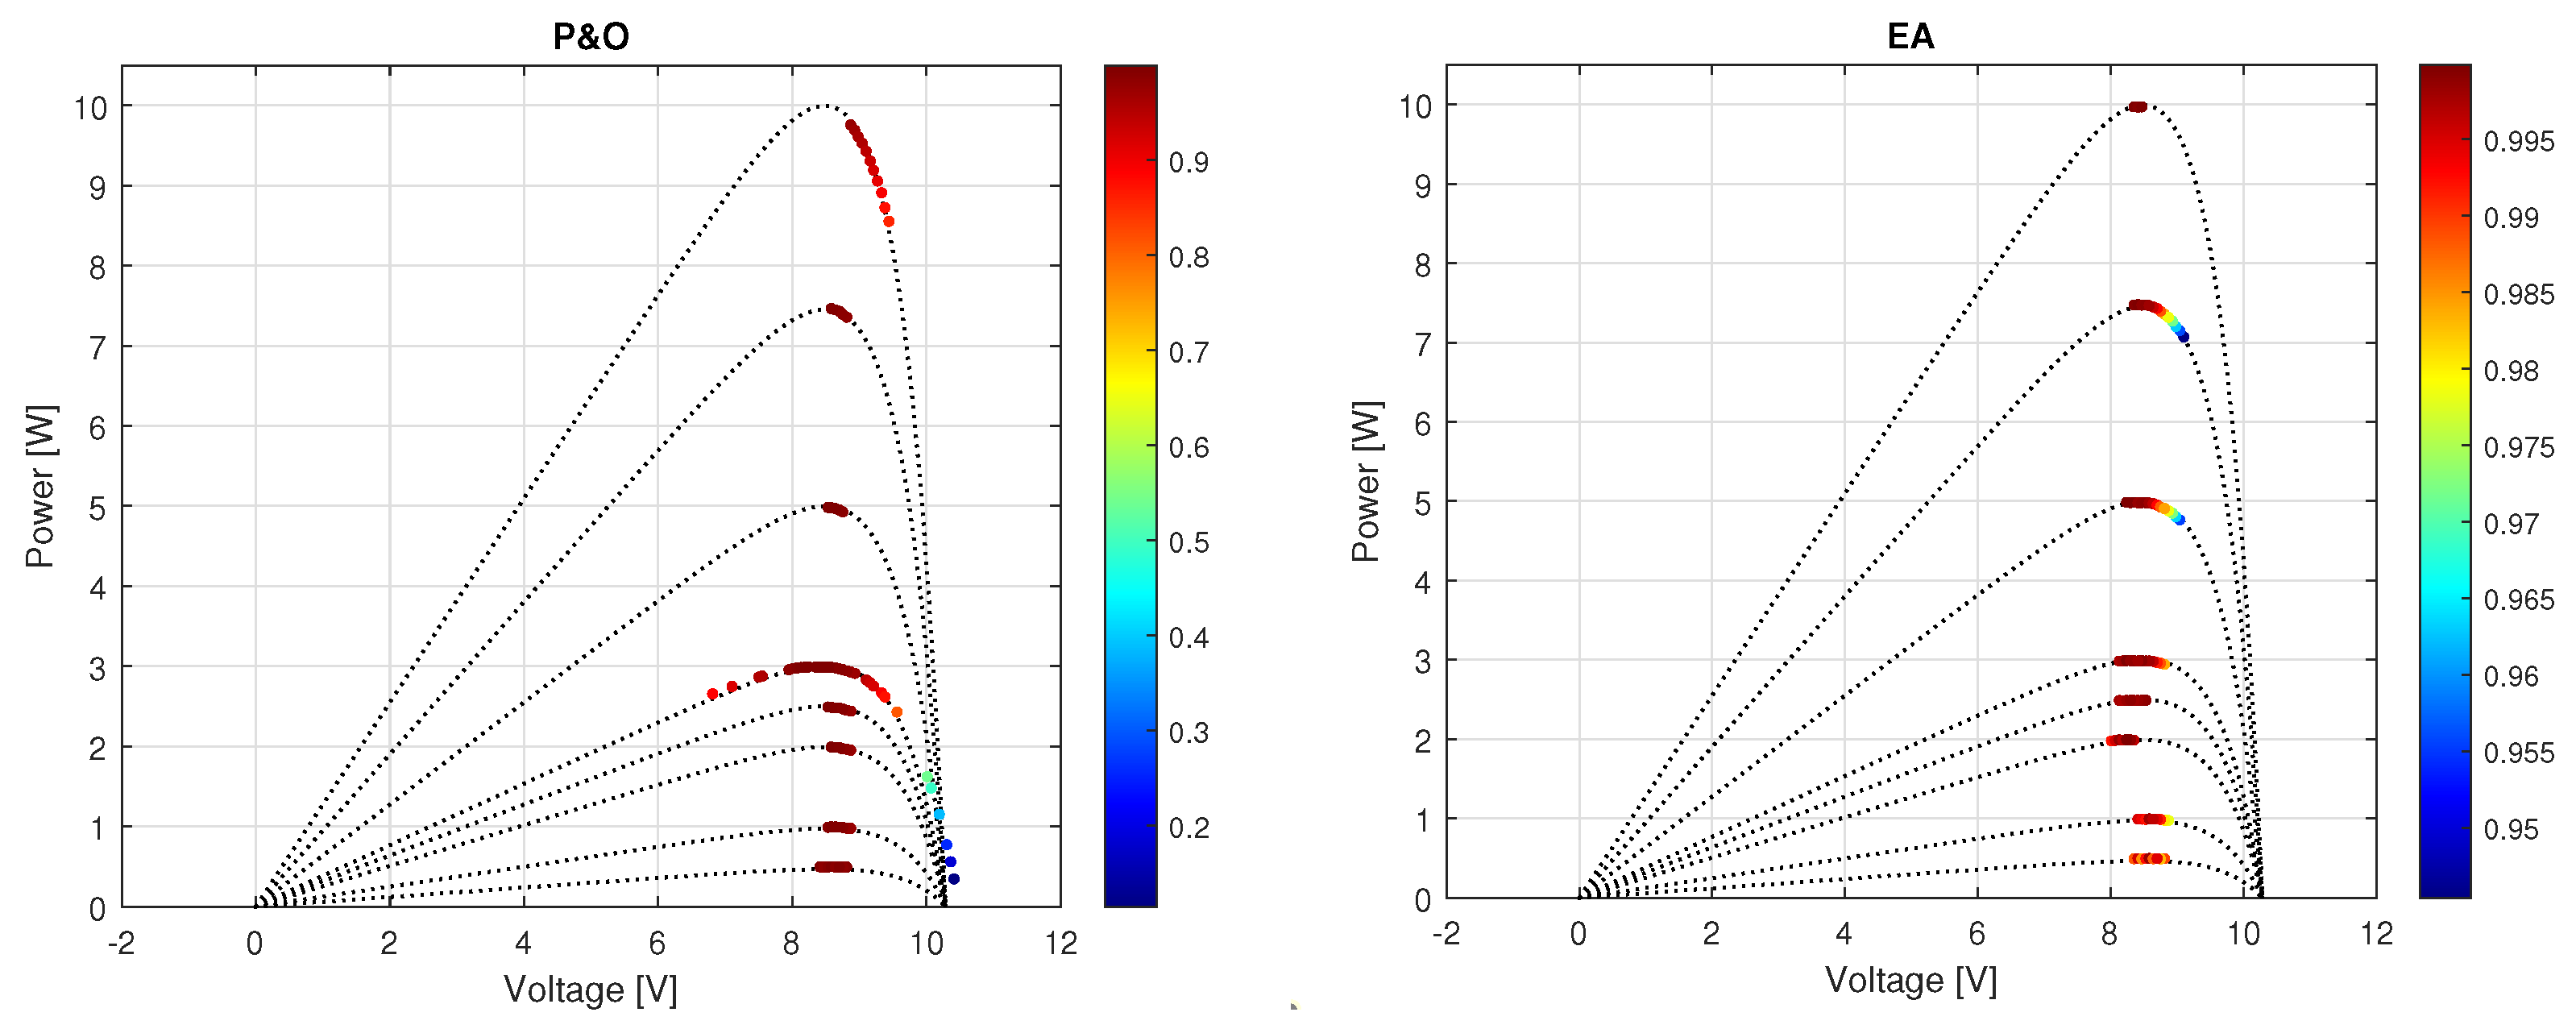
6.1. Static Report
6.2. Dynamic Report
7. Conclusions
Author Contributions
Funding
Conflicts of Interest
Abbreviations
| ABC | Artificial bee colony |
| ACO | Ant colony optimization |
| ADC | Analog-to-digital converter |
| AI | Artificial intelligence |
| ANN | Artificial neural network |
| BA | Bat algorithm |
| CEC | California energy commission |
| cRIO | CompactRIO embedded controller |
| CS | Chaotic search |
| CSO | Cuckoo search optimization |
| DC | Direct current |
| DE | Differential evolution |
| Incremental current | |
| DO | Digital output |
| Incremental voltage | |
| EA | Earthquake optimization algorithm |
| FA | Firefly algorithm |
| FIFO | First-in, First-out |
| FL | Fuzzy-logic |
| FOCV | Fractional open-circuit voltage |
| FPGA | Field-programmable gate array |
| GA | Genetic algorithm |
| GWO | Grey wolf optimizer |
| I | Current |
| Current at maximum power | |
| IC | Incremental conductance |
| IEC | International electrotechnical commission |
| Voltage factor constant | |
| KF | Kalman-filter |
| MKE | Monkey king evolution |
| MPP | Maximum power point |
| MPPT | Maximum power point tracking |
| MPPT- | Reference voltage-based maximum power point tracking |
| P | Power |
| P&O | Perturb and observe |
| Maximum power | |
| PC | Personal computer |
| PI | proportional-integral controller |
| PSO | Particle swarm optimization |
| PVsim | Photovoltaic array simulator |
| PWM | pulse-width modulation |
| RMS | Root mean square |
| ROA | Remora optimization algorithm |
| Searching flag | |
| S-range | |
| SAS | Solar array simulator |
| SCPI | Standard commands for programmable instruments |
| SFLA | Shuffled frog-leaping algorithm |
| SSA | Salp swarm algorithm |
| US | United states |
| V | Voltage |
| Voltage at maximum power | |
| Open-circuit voltage | |
| Voltage of photovoltaic system | |
| Reference voltage | |
| Velocity of P-wave | |
| Velocity of S-wave | |
| VISA | Virtual instrument software architecture |
References
- Kapilan, N.; Nithin, K.; Chiranth, K. Challenges and opportunities in solar photovoltaic system. Mater. Today Proc. 2022, 62, 3538–3543. [Google Scholar] [CrossRef]
- Boghdady, T.A.; Kotb, Y.E.; Aljumah, A.; Sayed, M.M. Comparative Study of Optimal PV Array Configurations and MPPT under Partial Shading with Fast Dynamical Change of Hybrid Load. Sustainability 2022, 14, 2937. [Google Scholar] [CrossRef]
- Lu, S.D.; Lin, C.H.; Huang, L.Y.; Lee, Y.L.; Liu, H.D.; Liao, P.C.; Gao, G.J.; Hsu, C.M. Novel Global-MPPT Control Strategy Considering the Variation in the Photovoltaic Module Output Power and Loads for Solar Power Systems. Processes 2022, 10, 367. [Google Scholar] [CrossRef]
- Chao, K.H.; Chang, L.Y.; Wang, K.W. Global Maximum Power Point Tracking of Photovoltaic Module Arrays Based on Improved Cuckoo Search Algorithm. Electronics 2022, 11, 1247. [Google Scholar] [CrossRef]
- Ahmed, M.; Harbi, I.; Kennel, R.; Rodríguez, J.; Abdelrahem, M. Maximum Power Point Tracking-Based Model Predictive Control for Photovoltaic Systems: Investigation and New Perspective. Sensors 2022, 22, 3069. [Google Scholar] [CrossRef] [PubMed]
- Saravanan, D.; Singh, D.; Sinha, S.; Shaw, R.N.; Prabu, K. A comprehensive study of well-konown maximum power point tracking techniques. In Proceedings of the 2020 IEEE International Conference on Computing, Power and Communication Technologies (GUCON), Greater Noida, India, 2–4 October 2020; pp. 829–837. [Google Scholar] [CrossRef]
- Verma, D.; Nema, S.; Agrawal, R.; Sawle, Y.; Kumar, A. A Different Approach for Maximum Power Point Tracking (MPPT) Using Impedance Matching through Non-Isolated DC-DC Converters in Solar Photovoltaic Systems. Electronics 2022, 11, 1053. [Google Scholar] [CrossRef]
- Andrejasic, T.; Jankovec, M.; Topic, M. Comparison of direct maximum power point tracking algorithms using EN 50530 dynamic test procedure. IET Renew. Power Gener. 2011, 5, 281–286. [Google Scholar] [CrossRef]
- Bendib, B.; Belmili, H.; Krim, F. A survey of the most used MPPT methods: Conventional and advanced algorithms applied for photovoltaic systems. Renew. Sustain. Energy Rev. 2015, 45, 637–648. [Google Scholar] [CrossRef]
- Dileep, G.; Singh, S. Application of soft computing techniques for maximum power point tracking of SPV system. Sol. Energy 2017, 141, 182–202. [Google Scholar] [CrossRef]
- Motahhir, S.; El Hammoumi, A.; El Ghzizal, A. The most used MPPT algorithms: Review and the suitable low-cost embedded board for each algorithm. J. Clean. Prod. 2020, 246, 118983. [Google Scholar] [CrossRef]
- Femia, N.; Petrone, G.; Spagnuolo, G.; Vitelli, M. Optimization of perturb and observe maximum power point tracking method. IEEE Trans. Power Electron. 2005, 20, 963–973. [Google Scholar] [CrossRef]
- Femia, N.; Granozio, D.; Petrone, G.; Spagnuolo, G.; Vitelli, M. Predictive & adaptive MPPT perturb and observe method. IEEE Trans. Aerosp. Electron. Syst. 2007, 43, 934–950. [Google Scholar]
- Piegari, L.; Rizzo, R. Adaptive perturb and observe algorithm for photovoltaic maximum power point tracking. IET Renew. Power Gener. 2010, 4, 317–328. [Google Scholar] [CrossRef]
- Sharma, D.; Purohit, G. Advanced perturbation and observation (P&O) based maximum power point tracking (MPPT) of a solar photo-voltaic system. In Proceedings of the 2012 IEEE 5th India International Conference on Power Electronics (IICPE), Delhi, India, 6–8 December 2012; pp. 1–5. [Google Scholar]
- Jie, D.; Chun-jiang, Z.; Yan-bang, L. Comparison of duty ratio perturbation & observation and reference voltage perturbation & observation methods applied in MPPT. In Proceedings of the 7th International Power Electronics and Motion Control Conference, Harbin, China, 2–5 June 2012; Volume 2, pp. 1358–1362. [Google Scholar]
- Sera, D.; Mathe, L.; Kerekes, T.; Spataru, S.V.; Teodorescu, R. On the perturb-and-observe and incremental conductance MPPT methods for PV systems. IEEE J. Photovolt. 2013, 3, 1070–1078. [Google Scholar] [CrossRef]
- Ishaque, K.; Salam, Z.; Lauss, G. The performance of perturb and observe and incremental conductance maximum power point tracking method under dynamic weather conditions. Appl. Energy 2014, 119, 228–236. [Google Scholar] [CrossRef]
- Harrag, A.; Messalti, S. Variable step size modified P&O MPPT algorithm using GA-based hybrid offline/online PID controller. Renew. Sustain. Energy Rev. 2015, 49, 1247–1260. [Google Scholar]
- Verma, D.; Nema, S.; Nema, R. Implementation of perturb and observe method of maximum power point tracking in SIMSCAPE/MATLAB. In Proceedings of the 2017 International Conference on Intelligent Sustainable Systems (ICISS), Palladam, India, 7–8 December 2017; pp. 148–152. [Google Scholar]
- Amarnath, R.; Verma, D. Harmonics mitigation of P&O MPPT based solar powered five-level diode-clamped multilevel inverter. In Proceedings of the IEEE International Conference on Innovations in Control, Communication and Information System, Greater Noida, India, 12–13 August 2017. [Google Scholar]
- Jain, K.; Gupta, M.; Bohre, A.K. Implementation and comparative analysis of P&O and INC MPPT method for PV system. In Proceedings of the 2018 8th IEEE India International Conference on Power Electronics (IICPE), Jaipur, India, 13–15 December 2018; pp. 1–6. [Google Scholar]
- Liu, B.; Duan, S.; Liu, F.; Xu, P. Analysis and improvement of maximum power point tracking algorithm based on incremental conductance method for photovoltaic array. In Proceedings of the 2007 7th International Conference on Power Electronics and Drive Systems, Bangkok, Thailand, 27–30 November 2007; pp. 637–641. [Google Scholar]
- Liu, F.; Duan, S.; Liu, F.; Liu, B.; Kang, Y. A Variable Step Size INC MPPT Method for PV Systems. IEEE Trans. Ind. Electron. 2008, 55, 2622–2628. [Google Scholar] [CrossRef]
- Lin, C.H.; Huang, C.H.; Du, Y.C.; Chen, J.L. Maximum photovoltaic power tracking for the PV array using the fractional-order incremental conductance method. Appl. Energy 2011, 88, 4840–4847. [Google Scholar] [CrossRef]
- Kumar, K.K.; Bhaskar, R.; Koti, H. Implementation of MPPT algorithm for solar photovoltaic cell by comparing short-circuit method and incremental conductance method. Procedia Technol. 2014, 12, 705–715. [Google Scholar] [CrossRef]
- Tey, K.S.; Mekhilef, S. Modified incremental conductance MPPT algorithm to mitigate inaccurate responses under fast-changing solar irradiation level. Sol. Energy 2014, 101, 333–342. [Google Scholar] [CrossRef]
- Radjai, T.; Rahmani, L.; Mekhilef, S.; Gaubert, J.P. Implementation of a modified incremental conductance MPPT algorithm with direct control based on a fuzzy duty cycle change estimator using dSPACE. Sol. Energy 2014, 110, 325–337. [Google Scholar] [CrossRef]
- Sivakumar, P.; Kader, A.A.; Kaliavaradhan, Y.; Arutchelvi, M. Analysis and enhancement of PV efficiency with incremental conductance MPPT technique under non-linear loading conditions. Renew. Energy 2015, 81, 543–550. [Google Scholar] [CrossRef]
- Hua, C.C.; Fang, Y.H.; Chen, W.T. Hybrid maximum power point tracking method with variable step size for photovoltaic systems. IET Renew. Power Gener. 2016, 10, 127–132. [Google Scholar] [CrossRef]
- Baimel, D.; Tapuchi, S.; Levron, Y.; Belikov, J. Improved fractional open circuit voltage MPPT methods for PV systems. Electronics 2019, 8, 321. [Google Scholar] [CrossRef]
- Mahmoud, A.; Mashaly, H.; Kandil, S.; El Khashab, H.; Nashed, M. Fuzzy logic implementation for photovoltaic maximum power tracking. In Proceedings of the 2000 26th Annual Conference of the IEEE Industrial Electronics Society. IECON 2000. 2000 IEEE International Conference on Industrial Electronics, Control and Instrumentation. 21st Century Technologies, Nagoya, Japan, 22–28 October 2000; Volume 1, pp. 735–740. [Google Scholar]
- Veerachary, M.; Senjyu, T.; Uezato, K. Feedforward maximum power point tracking of PV systems using fuzzy controller. IEEE Trans. Aerosp. Electron. Syst. 2002, 38, 969–981. [Google Scholar] [CrossRef]
- Khaehintung, N.; Pramotung, K.; Tuvirat, B.; Sirisuk, P. RISC-microcontroller built-in fuzzy logic controller of maximum power point tracking for solar-powered light-flasher applications. In Proceedings of the 30th Annual Conference of IEEE Industrial Electronics Society, 2004. IECON 2004, Busan, Korea, 2–6 November 2004; Volume 3, pp. 2673–2678. [Google Scholar]
- Patcharaprakiti, N.; Premrudeepreechacharn, S.; Sriuthaisiriwong, Y. Maximum power point tracking using adaptive fuzzy logic control for grid-connected photovoltaic system. Renew. Energy 2005, 30, 1771–1788. [Google Scholar] [CrossRef]
- Masoum, M.; Sarvi, M. Design, simulation and implementation of a fuzzybased maximum power point tracker under variable irradiance and temperature conditions. Iran J. Sci. Technol. 2005, 29, 27–32. [Google Scholar]
- Kottas, T.L.; Boutalis, Y.S.; Karlis, A.D. New maximum power point tracker for PV arrays using fuzzy controller in close cooperation with fuzzy cognitive networks. IEEE Trans. Energy Convers. 2006, 21, 793–803. [Google Scholar] [CrossRef]
- Varnham, A.; Al-Ibrahim, A.M.; Virk, G.S.; Azzi, D. Soft-computing model-based controllers for increased photovoltaic plant efficiencies. IEEE Trans. Energy Convers. 2007, 22, 873–880. [Google Scholar] [CrossRef]
- Luo, W. The research of photovoltaic charging system based on fuzzy controller. In Proceedings of the 2009 Asia-Pacific Power and Energy Engineering Conference, Wuhan, China, 28–30 March 2009; pp. 1–4. [Google Scholar]
- Syafaruddin; Karatepe, E.; Hiyama, T. Artificial neural network-polar coordinated fuzzy controller based maximum power point tracking control under partially shaded conditions. IET Renew. Power Gener. 2009, 3, 239–253. [Google Scholar] [CrossRef]
- Chiu, C.S. TS fuzzy maximum power point tracking control of solar power generation systems. IEEE Trans. Energy Convers. 2010, 25, 1123–1132. [Google Scholar] [CrossRef]
- Alajmi, B.N.; Ahmed, K.H.; Finney, S.J.; Williams, B.W. Fuzzy-logic-control approach of a modified hill-climbing method for maximum power point in microgrid standalone photovoltaic system. IEEE Trans. Power Electron. 2010, 26, 1022–1030. [Google Scholar] [CrossRef]
- Messai, A.; Mellit, A.; Guessoum, A.; Kalogirou, S.A. Maximum power point tracking using a GA optimized fuzzy logic controller and its FPGA implementation. Sol. Energy 2011, 85, 265–277. [Google Scholar] [CrossRef]
- Alabedin, A.Z.; El-Saadany, E.; Salama, M. Maximum power point tracking for Photovoltaic systems using fuzzy logic and artificial neural networks. In Proceedings of the 2011 IEEE Power and Energy Society General Meeting, Detroit, MI, USA, 24–28 July 2011; pp. 1–9. [Google Scholar]
- Purnama, I.; Lo, Y.K.; Chiu, H.J. A fuzzy control maximum power point tracking photovoltaic system. In Proceedings of the 2011 IEEE International Conference on Fuzzy Systems (FUZZ-IEEE 2011), Taipei, Taiwan, 27–30 June 2011; pp. 2432–2439. [Google Scholar]
- Algazar, M.M.; AL-monier, H.; Abd El-Halim, H.; Salem, M.E.E.K. Maximum power point tracking using fuzzy logic control. Int. J. Electr. Power Energy Syst. 2012, 39, 21–28. [Google Scholar] [CrossRef]
- Othman, A.M.; El-arini, M.M.; Ghitas, A.; Fathy, A. Realworld maximum power point tracking simulation of PV system based on Fuzzy Logic control. NRIAG J. Astron. Geophys. 2012, 1, 186–194. [Google Scholar] [CrossRef]
- Canny, D.; Yusivar, F. Maximum power point tracking (MPPT) algorithm simulation based on fuzzy logic controller on solar cell with boost converter. In Proceedings of the 2018 2nd International Conference on Smart Grid and Smart Cities (ICSGSC), Kuala Lumpur, Malaysia, 12–14 August 2018; pp. 117–121. [Google Scholar] [CrossRef]
- Harrag, A.; Messalti, S. IC-based Variable Step Size Neuro-Fuzzy MPPT Improving PV System Performances. Energy Procedia 2019, 157, 362–374. [Google Scholar] [CrossRef]
- Rezk, H.; Aly, M.; Al-Dhaifallah, M.; Shoyama, M. Design and Hardware Implementation of New Adaptive Fuzzy Logic-Based MPPT Control Method for Photovoltaic Applications. IEEE Access 2019, 7, 106427–106438. [Google Scholar] [CrossRef]
- Ge, X.; Ahmed, F.W.; Rezvani, A.; Aljojo, N.; Samad, S.; Foong, L.K. Implementation of a novel hybrid BAT-Fuzzy controller based MPPT for grid-connected PV-battery system. Control Eng. Pract. 2020, 98, 104380. [Google Scholar] [CrossRef]
- Ocran, T.A.; Cao, J.; Cao, B.; Sun, X. Artificial neural network maximum power point tracker for solar electric vehicle. Tsinghua Sci. Technol. 2005, 10, 204–208. [Google Scholar] [CrossRef]
- Lin, W.M.; Hong, C.M.; Chen, C.H. Neural-Network-Based MPPT Control of a Stand-Alone Hybrid Power Generation System. IEEE Trans. Power Electron. 2011, 26, 3571–3581. [Google Scholar] [CrossRef]
- Asiful Islam, M.; Ashfanoor Kabir, M. Neural network based maximum power point tracking of photovoltaic arrays. In Proceedings of the TENCON 2011—2011 IEEE Region 10 Conference, Bali, Indonesia, 21–24 November 2011; pp. 79–82. [Google Scholar] [CrossRef]
- Jie, L.; Ziran, C. Research on the MPPT algorithms of photovoltaic system based on PV neural network. In Proceedings of the 2011 Chinese Control and Decision Conference (CCDC), Mianyang, China, 23–25 May 2011; pp. 1851–1854. [Google Scholar]
- Subiyanto, S.; Mohamed, A.; Hannan, M. Intelligent maximum power point tracking for PV system using Hopfield neural network optimized fuzzy logic controller. Energy Build. 2012, 51, 29–38. [Google Scholar] [CrossRef]
- Liu, Y.H.; Liu, C.L.; Huang, J.W.; Chen, J.H. Neural-network-based maximum power point tracking methods for photovoltaic systems operating under fast changing environments. Sol. Energy 2013, 89, 42–53. [Google Scholar] [CrossRef]
- Punitha, K.; Devaraj, D.; Sakthivel, S. Artificial neural network based modified incremental conductance algorithm for maximum power point tracking in photovoltaic system under partial shading conditions. Energy 2013, 62, 330–340. [Google Scholar] [CrossRef]
- Sahnoun, M.A.; Ugalde, H.M.R.; Carmona, J.C.; Gomand, J. Maximum Power point Tracking Using P&O Control Optimized by a Neural Network Approach: A Good Compromise between Accuracy and Complexity. Energy Procedia 2013, 42, 650–659. [Google Scholar] [CrossRef]
- Seyedmahmoudian, M.; Horan, B.; Soon, T.K.; Rahmani, R.; Than Oo, A.M.; Mekhilef, S.; Stojcevski, A. State of the art artificial intelligence-based MPPT techniques for mitigating partial shading effects on PV systems—A review. Renew. Sustain. Energy Rev. 2016, 64, 435–455. [Google Scholar] [CrossRef]
- Verma, D.; Nema, S.; Shandilya, A.; Dash, S.K. Maximum power point tracking (MPPT) techniques: Recapitulation in solar photovoltaic systems. Renew. Sustain. Energy Rev. 2016, 54, 1018–1034. [Google Scholar] [CrossRef]
- Kumar P.K., V.; Manjunath, K. A comparitive analysis of MPPT algorithms for solar photovoltaic systems to improve the tracking accuracy. In Proceedings of the 2018 International Conference on Control, Power, Communication and Computing Technologies (ICCPCCT), Kannur, India, 23–24 March 2018; pp. 540–547. [Google Scholar] [CrossRef]
- Al-Wesabi, I.; Fang, Z.; Farh, H.M.H.; Al-Shamma’a, A.A.; Al-Shaalan, A.M.; Kandil, T.; Ding, M. Cuckoo Search Combined with PID Controller for Maximum Power Extraction of Partially Shaded Photovoltaic System. Energies 2022, 15, 2513. [Google Scholar] [CrossRef]
- Banakhr, F.A.; Mosaad, M.I. High performance adaptive maximum power point tracking technique for off-grid photovoltaic systems. Sci. Rep. 2021, 11, 20400. [Google Scholar] [CrossRef]
- Cruz, P.P.; Gutiérrez, A.M.; Ramírez-Mendoza, R.A.; Flores, E.M.; Espinoza, A.A.O.; Silva, D.C.B. A Practical Approach to Metaheuristics Using LabVIEW and MATLAB®; Chapman and Hall/CRC: Boca Raton, FL, USA, 2020. [Google Scholar]
- Torres-Jiménez, J.; Pavón, J. Applications of metaheuristics in real-life problems. Prog. Artif. Intell. 2014, 2, 175–176. [Google Scholar] [CrossRef]
- Alanazi, A.; Alanazi, M.; Arabi, S.; Sarker, S. A New Maximum Power Point Tracking Framework for Photovoltaic Energy Systems Based on Remora Optimization Algorithm in Partial Shading Conditions. Appl. Sci. 2022, 12, 3828. [Google Scholar] [CrossRef]
- Kuo, J.L.; Chao, K.L.; Lee, L.S. Dual Mechatronic MPPT Controllers With PN and OPSO Control Algorithms for the Rotatable Solar Panel in PHEV System. IEEE Trans. Ind. Electron. 2010, 57, 678–689. [Google Scholar] [CrossRef]
- Miyatake, M.; Veerachary, M.; Toriumi, F.; Fujii, N.; Ko, H. Maximum Power Point Tracking of Multiple Photovoltaic Arrays: A PSO Approach. IEEE Trans. Aerosp. Electron. Syst. 2011, 47, 367–380. [Google Scholar] [CrossRef]
- Fu, Q.; Tong, N. A new fuzzy control method based on PSO for Maximum power point tracking of photovoltaic system. In Proceedings of the 2011 International Conference on Computer Science and Network Technology, Harbin, China, 24–26 December 2011; Volume 3, pp. 1487–1491. [Google Scholar] [CrossRef]
- Liu, Y.H.; Huang, S.C.; Huang, J.W.; Liang, W.C. A Particle Swarm Optimization-Based Maximum Power Point Tracking Algorithm for PV Systems Operating Under Partially Shaded Conditions. IEEE Trans. Energy Convers. 2012, 27, 1027–1035. [Google Scholar] [CrossRef]
- Ishaque, K.; Salam, Z.; Shamsudin, A.; Amjad, M. A direct control based maximum power point tracking method for photovoltaic system under partial shading conditions using particle swarm optimization algorithm. Appl. Energy 2012, 99, 414–422. [Google Scholar] [CrossRef]
- Ishaque, K.; Salam, Z.; Amjad, M.; Mekhilef, S. An improved particle swarm optimization (PSO)–based MPPT for PV with reduced steady-state oscillation. IEEE Trans. Power Electron. 2012, 27, 3627–3638. [Google Scholar] [CrossRef]
- Ishaque, K.; Salam, Z. A Deterministic Particle Swarm Optimization Maximum Power Point Tracker for Photovoltaic System Under Partial Shading Condition. IEEE Trans. Ind. Electron. 2013, 60, 3195–3206. [Google Scholar] [CrossRef]
- Seyedmahmoudian, M.; Rahmani, R.; Mekhilef, S.; Maung Than Oo, A.; Stojcevski, A.; Soon, T.K.; Ghandhari, A.S. Simulation and Hardware Implementation of New Maximum Power Point Tracking Technique for Partially Shaded PV System Using Hybrid DEPSO Method. IEEE Trans. Sustain. Energy 2015, 6, 850–862. [Google Scholar] [CrossRef]
- Shi, J.; Zhang, W.; Zhang, Y.; Xue, F.; Yang, T. MPPT for PV systems based on a dormant PSO algorithm. Electr. Power Syst. Res. 2015, 123, 100–107. [Google Scholar] [CrossRef]
- Pragallapati, N.; Sen, T.; Agarwal, V. Adaptive Velocity PSO for Global Maximum Power Control of a PV Array Under Nonuniform Irradiation Conditions. IEEE J. Photovolt. 2017, 7, 624–639. [Google Scholar] [CrossRef]
- Ramaprabha, R.; Mathur, B. Intelligent controller based maximum power point tracking for solar PV system. Int. J. Comput. Appl. 2011, 12, 37–41. [Google Scholar] [CrossRef]
- Daraban, S.; Petreus, D.; Morel, C. A novel MPPT (maximum power point tracking) algorithm based on a modified genetic algorithm specialized on tracking the global maximum power point in photovoltaic systems affected by partial shading. Energy 2014, 74, 374–388. [Google Scholar] [CrossRef]
- Rezvani, A.; Izadbakhsh, M.; Gandomkar, M.; Vafaei, S. Investigation of ANN-GA and modified perturb and observe MPPT techniques for photovoltaic system in the grid connected mode. Indian J. Sci. Technol. 2015, 8, 87. [Google Scholar] [CrossRef]
- Kumar, P.; Jain, G.; Palwalia, D.K. Genetic algorithm based maximum power tracking in solar power generation. In Proceedings of the 2015 International Conference on Power and Advanced Control Engineering (ICPACE), Bengaluru, India, 12–14 August 2015; pp. 1–6. [Google Scholar] [CrossRef]
- Badis, A.; Mansouri, M.N.; Sakly, A. PSO and GA-based maximum power point tracking for partially shaded photovoltaic systems. In Proceedings of the 2016 7th International Renewable Energy Congress (IREC), Hammamet, Tunisia, 22–24 March 2016; pp. 1–6. [Google Scholar] [CrossRef]
- Taheri, H.; Salam, Z.; Ishaque, K.; Syafaruddin. A novel maximum power point tracking control of photovoltaic system under partial and rapidly fluctuating shadow conditions using Differential Evolution. In Proceedings of the 2010 IEEE Symposium on Industrial Electronics and Applications (ISIEA), Penang, Malaysia, 3–5 October 2010; pp. 82–87. [Google Scholar] [CrossRef]
- Joisher, M.; Singh, D.; Taheri, S.; Espinoza-Trejo, D.R.; Pouresmaeil, E.; Taheri, H. A hybrid evolutionary-based MPPT for photovoltaic systems under partial shading conditions. IEEE Access 2020, 8, 38481–38492. [Google Scholar] [CrossRef]
- Ahmed, J.; Salam, Z. A soft computing MPPT for PV system based on Cuckoo Search algorithm. In Proceedings of the 4th International Conference on Power Engineering, Energy and Electrical Drives, Istanbul, Turkey, 13–17 May 2013; pp. 558–562. [Google Scholar] [CrossRef]
- Nugraha, D.A.; Lian, K.L.; Suwarno. A Novel MPPT Method Based on Cuckoo Search Algorithm and Golden Section Search Algorithm for Partially Shaded PV System. Can. J. Electr. Comput. Eng. 2019, 42, 173–182. [Google Scholar] [CrossRef]
- Adly, M.; Besheer, A. An optimized fuzzy maximum power point tracker for stand alone photovoltaic systems: Ant colony approach. In Proceedings of the 2012 7th IEEE Conference on Industrial Electronics and Applications (ICIEA), Singapore, 18–20 July 2012; pp. 113–119. [Google Scholar] [CrossRef]
- Jiang, L.L.; Maskell, D.L.; Patra, J.C. A novel ant colony optimization-based maximum power point tracking for photovoltaic systems under partially shaded conditions. Energy Build. 2013, 58, 227–236. [Google Scholar] [CrossRef]
- Titri, S.; Larbes, C.; Toumi, K.Y.; Benatchba, K. A new MPPT controller based on the Ant colony optimization algorithm for Photovoltaic systems under partial shading conditions. Appl. Soft Comput. 2017, 58, 465–479. [Google Scholar] [CrossRef]
- Sundareswaran, K.; Peddapati, S.; Palani, S. MPPT of PV Systems Under Partial Shaded Conditions Through a Colony of Flashing Fireflies. IEEE Trans. Energy Convers. 2014, 29, 463–472. [Google Scholar] [CrossRef]
- Teshome, D.F.; Lee, C.H.; Lin, Y.W.; Lian, K.L. A Modified Firefly Algorithm for Photovoltaic Maximum Power Point Tracking Control Under Partial Shading. IEEE J. Emerg. Sel. Top. Power Electron. 2017, 5, 661–671. [Google Scholar] [CrossRef]
- Zhou, L.; Chen, Y.; Guo, K.; Jia, F. New Approach for MPPT Control of Photovoltaic System With Mutative-Scale Dual-Carrier Chaotic Search. IEEE Trans. Power Electron. 2011, 26, 1038–1048. [Google Scholar] [CrossRef]
- Oshaba, A.; Ali, E.; Abd Elazim, S. Artificial bee colony algorithm based maximum power point tracking in photovoltaic system. WSEAS Trans. Power Syst 2015, 10, 22. [Google Scholar]
- Mohanty, S.; Subudhi, B.; Ray, P.K. A New MPPT Design Using Grey Wolf Optimization Technique for Photovoltaic System Under Partial Shading Conditions. IEEE Trans. Sustain. Energy 2016, 7, 181–188. [Google Scholar] [CrossRef]
- Kaced, K.; Larbes, C.; Ramzan, N.; Bounabi, M.; elabadine Dahmane, Z. Bat algorithm based maximum power point tracking for photovoltaic system under partial shading conditions. Sol. Energy 2017, 158, 490–503. [Google Scholar] [CrossRef]
- Sridhar, R.; Jeevananthan, S.; Dash, S.S.; Vishnuram, P. A new maximum power tracking in PV system during partially shaded conditions based on shuffled frog leap algorithm. J. Exp. Theor. Artif. Intell. 2017, 29, 481–493. [Google Scholar] [CrossRef]
- Kumar, N.; Hussain, I.; Singh, B.; Panigrahi, B.K. Maximum power peak detection of partially shaded PV panel by using intelligent monkey king evolution algorithm. In Proceedings of the 2016 IEEE International Conference on Power Electronics, Drives and Energy Systems (PEDES), Trivandrum, India, 14–17 December 2016; pp. 1–6. [Google Scholar] [CrossRef]
- Yang, B.; Zhong, L.; Zhang, X.; Shu, H.; Yu, T.; Li, H.; Jiang, L.; Sun, L. Novel bio-inspired memetic salp swarm algorithm and application to MPPT for PV systems considering partial shading condition. J. Clean. Prod. 2019, 215, 1203–1222. [Google Scholar] [CrossRef]
- Mendez, E.; Ortiz, A.; Ponce, P.; Macias, I.; Balderas, D.; Molina, A. Improved MPPT algorithm for photovoltaic systems based on the earthquake optimization algorithm. Energies 2020, 13, 3047. [Google Scholar] [CrossRef]
- Mendez, E.; Ortiz, A.; Ponce, P.; Acosta, J.; Molina, A. Mobile phone usage detection by ann trained with a metaheuristic algorithm. Sensors 2019, 19, 3110. [Google Scholar] [CrossRef]
- Zhang, L.; Sun, K.; Hu, H.; Xing, Y. A System-Level Control Strategy of Photovoltaic Grid-Tied Generation Systems for European Efficiency Enhancement. IEEE Trans. Power Electron. 2014, 29, 3445–3453. [Google Scholar] [CrossRef]
- Kalathil, A.; Krishnamurthy, H. Quantification of solar inverter efficiency for Indian tropical climatic conditions. In Proceedings of the 2014 IEEE Region 10 Humanitarian Technology Conference (R10 HTC), Chennai, India, 6–9 August 2014; pp. 14–18. [Google Scholar] [CrossRef]
- Abdelsalam, A.K.; Massoud, A.M.; Ahmed, S.; Enjeti, P.N. High-Performance Adaptive Perturb and Observe MPPT Technique for Photovoltaic-Based Microgrids. IEEE Trans. Power Electron. 2011, 26, 1010–1021. [Google Scholar] [CrossRef]
- Eltawil, M.A.; Zhao, Z. MPPT techniques for photovoltaic applications. Renew. Sustain. Energy Rev. 2013, 25, 793–813. [Google Scholar] [CrossRef]
- Villalva, M.G.; Ruppert F., E. Analysis and simulation of the P&O MPPT algorithm using a linearized PV array model. In Proceedings of the 2009 35th Annual Conference of IEEE Industrial Electronics, Porto, Portugal, 3–5 November 2009; pp. 231–236. [Google Scholar] [CrossRef]
- Femia, N.; Petrone, G.; Spagnuolo, G.; Vitelli, M. Optimizing sampling rate of P&O MPPT technique. In Proceedings of the 2004 IEEE 35th Annual Power Electronics Specialists Conference (IEEE Cat. No.04CH37551), Aachen, Germany, 20–25 June 2004; Volume 3, pp. 1945–1949. [Google Scholar] [CrossRef]
- Rezoug, M.R.; Chenni, R.; Taibi, D. Fuzzy Logic-Based Perturb and Observe Algorithm with Variable Step of a Reference Voltage for Solar Permanent Magnet Synchronous Motor Drive System Fed by Direct-Connected Photovoltaic Array. Energies 2018, 11, 462. [Google Scholar] [CrossRef]
- Ortiz, A.; Mendez, E.; Balderas, D.; Ponce, P.; Macias, I.; Molina, A. Hardware implementation of metaheuristics through LabVIEW FPGA. Appl. Soft Comput. 2021, 113, 107908. [Google Scholar] [CrossRef]
- Ortiz, A.; Molina, A.; Macias, I.; Ramirez, M. Plataforma Integral para el Analisis Fuera de Linea de Patrones de Consumo Electrico en Sistemas Distribuidos de Energia. MX Request Patent MXa/2019/00700, 2019. [Google Scholar]
- Technologies, K. Keysight N8900 Series Autoranging System DC Power Supply. 2019. Available online: https://www.keysight.com/us/en/support/N8937APV/photovoltaic-array-simulator-1500vdc-208vac.html (accessed on 1 October 2022).
- Mendez, E.; Macias, I.; Ortiz, A.; Ponce, P.; Vargas-Martinez, A.; Lozoya-Santos, J.d.J.; Ramirez-Mendoza, R.A.; Morales-Menendez, R.; Molina, A. Novel design methodology for DC-DC converters applying metaheuristic optimization for inductance selection. Appl. Sci. 2020, 10, 4377. [Google Scholar] [CrossRef]


| MPP Voltage (V) | Irradiance (%) |
|---|---|
| 12.5 | |
| 10.0 | 5, 10, 20, 25, 30, 50, 75, 100 |
| 8.4 |
| MPPT Algorithm | MPP Voltage | Irradiance (%) | European Efficiency | CEC Efficiency | |||||||
|---|---|---|---|---|---|---|---|---|---|---|---|
| 5 | 10 | 20 | 25 | 30 | 50 | 75 | 100 | ||||
| P&O | 12.5 | 97.671 | 76.264 | 92.949 | 94.356 | 94.383 | 94.813 | 99.319 | 99.252 | 94.402 | 96.536 |
| EA | 98.489 | 98.095 | 96.813 | 99.743 | 99.774 | 99.689 | 99.975 | 99.868 | 99.249 | 99.652 | |
| P&O | 10.0 | 91.469 | 77.385 | 75.210 | 81.177 | 97.992 | 99.392 | 98.901 | 97.325 | 94.452 | 96.771 |
| EA | 98.855 | 99.578 | 99.656 | 99.760 | 99.774 | 99.890 | 99.936 | 99.918 | 99.807 | 99.878 | |
| P&O | 8.4 | 99.227 | 99.130 | 99.307 | 99.344 | 99.265 | 99.556 | 99.367 | 92.557 | 99.421 | 99.042 |
| EA | 99.117 | 99.499 | 99.812 | 99.859 | 99.840 | 98.948 | 99.704 | 99.962 | 99.340 | 99.572 | |
| Irradiance (W/m2) | No. of Ramps | Duration (s) | P&O Efficiency (%) | EA Efficiency (%) |
|---|---|---|---|---|
| 100–500 | 2 | 1940 | 99.905 | 99.592 |
| 3 | 1560 | 99.884 | 99.520 | |
| 4 | 1447 | 99.895 | 99.824 | |
| 6 | 1380 | 99.892 | 99.685 | |
| 8 | 1374 | 99.857 | 99.627 | |
| 10 | 1300 | 99.427 | 99.630 | |
| 10 | 1071 | 99.129 | 99.589 | |
| 10 | 900 | 99.039 | 99.497 | |
| 10 | 767 | 98.755 | 99.282 | |
| 10 | 660 | 98.325 | 99.066 | |
| 300–1000 | 10 | 1900 | 99.571 | 99.905 |
| 10 | 1500 | 99.665 | 99.884 | |
| 10 | 1200 | 99.745 | 99.895 | |
| 10 | 967 | 99.809 | 99.892 | |
| 10 | 780 | 99.762 | 99.857 | |
| 10 | 640 | 99.677 | 99.427 | |
| 10–100 | 1 | 2320 | 95.129 | 99.093 |
Publisher’s Note: MDPI stays neutral with regard to jurisdictional claims in published maps and institutional affiliations. |
© 2022 by the authors. Licensee MDPI, Basel, Switzerland. This article is an open access article distributed under the terms and conditions of the Creative Commons Attribution (CC BY) license (https://creativecommons.org/licenses/by/4.0/).
Share and Cite
Ortiz, A.; Mendez, E.; Macias, I.; Molina, A. Earthquake Algorithm-Based Voltage Referenced MPPT Implementation through a Standardized Validation Frame. Energies 2022, 15, 8971. https://doi.org/10.3390/en15238971
Ortiz A, Mendez E, Macias I, Molina A. Earthquake Algorithm-Based Voltage Referenced MPPT Implementation through a Standardized Validation Frame. Energies. 2022; 15(23):8971. https://doi.org/10.3390/en15238971
Chicago/Turabian StyleOrtiz, Alexandro, Efrain Mendez, Israel Macias, and Arturo Molina. 2022. "Earthquake Algorithm-Based Voltage Referenced MPPT Implementation through a Standardized Validation Frame" Energies 15, no. 23: 8971. https://doi.org/10.3390/en15238971
APA StyleOrtiz, A., Mendez, E., Macias, I., & Molina, A. (2022). Earthquake Algorithm-Based Voltage Referenced MPPT Implementation through a Standardized Validation Frame. Energies, 15(23), 8971. https://doi.org/10.3390/en15238971