
Innovation Input, Climate Change, and Energy-Environment-Growth Nexus: Evidence from OECD and Non-OECD Countries


Abstract
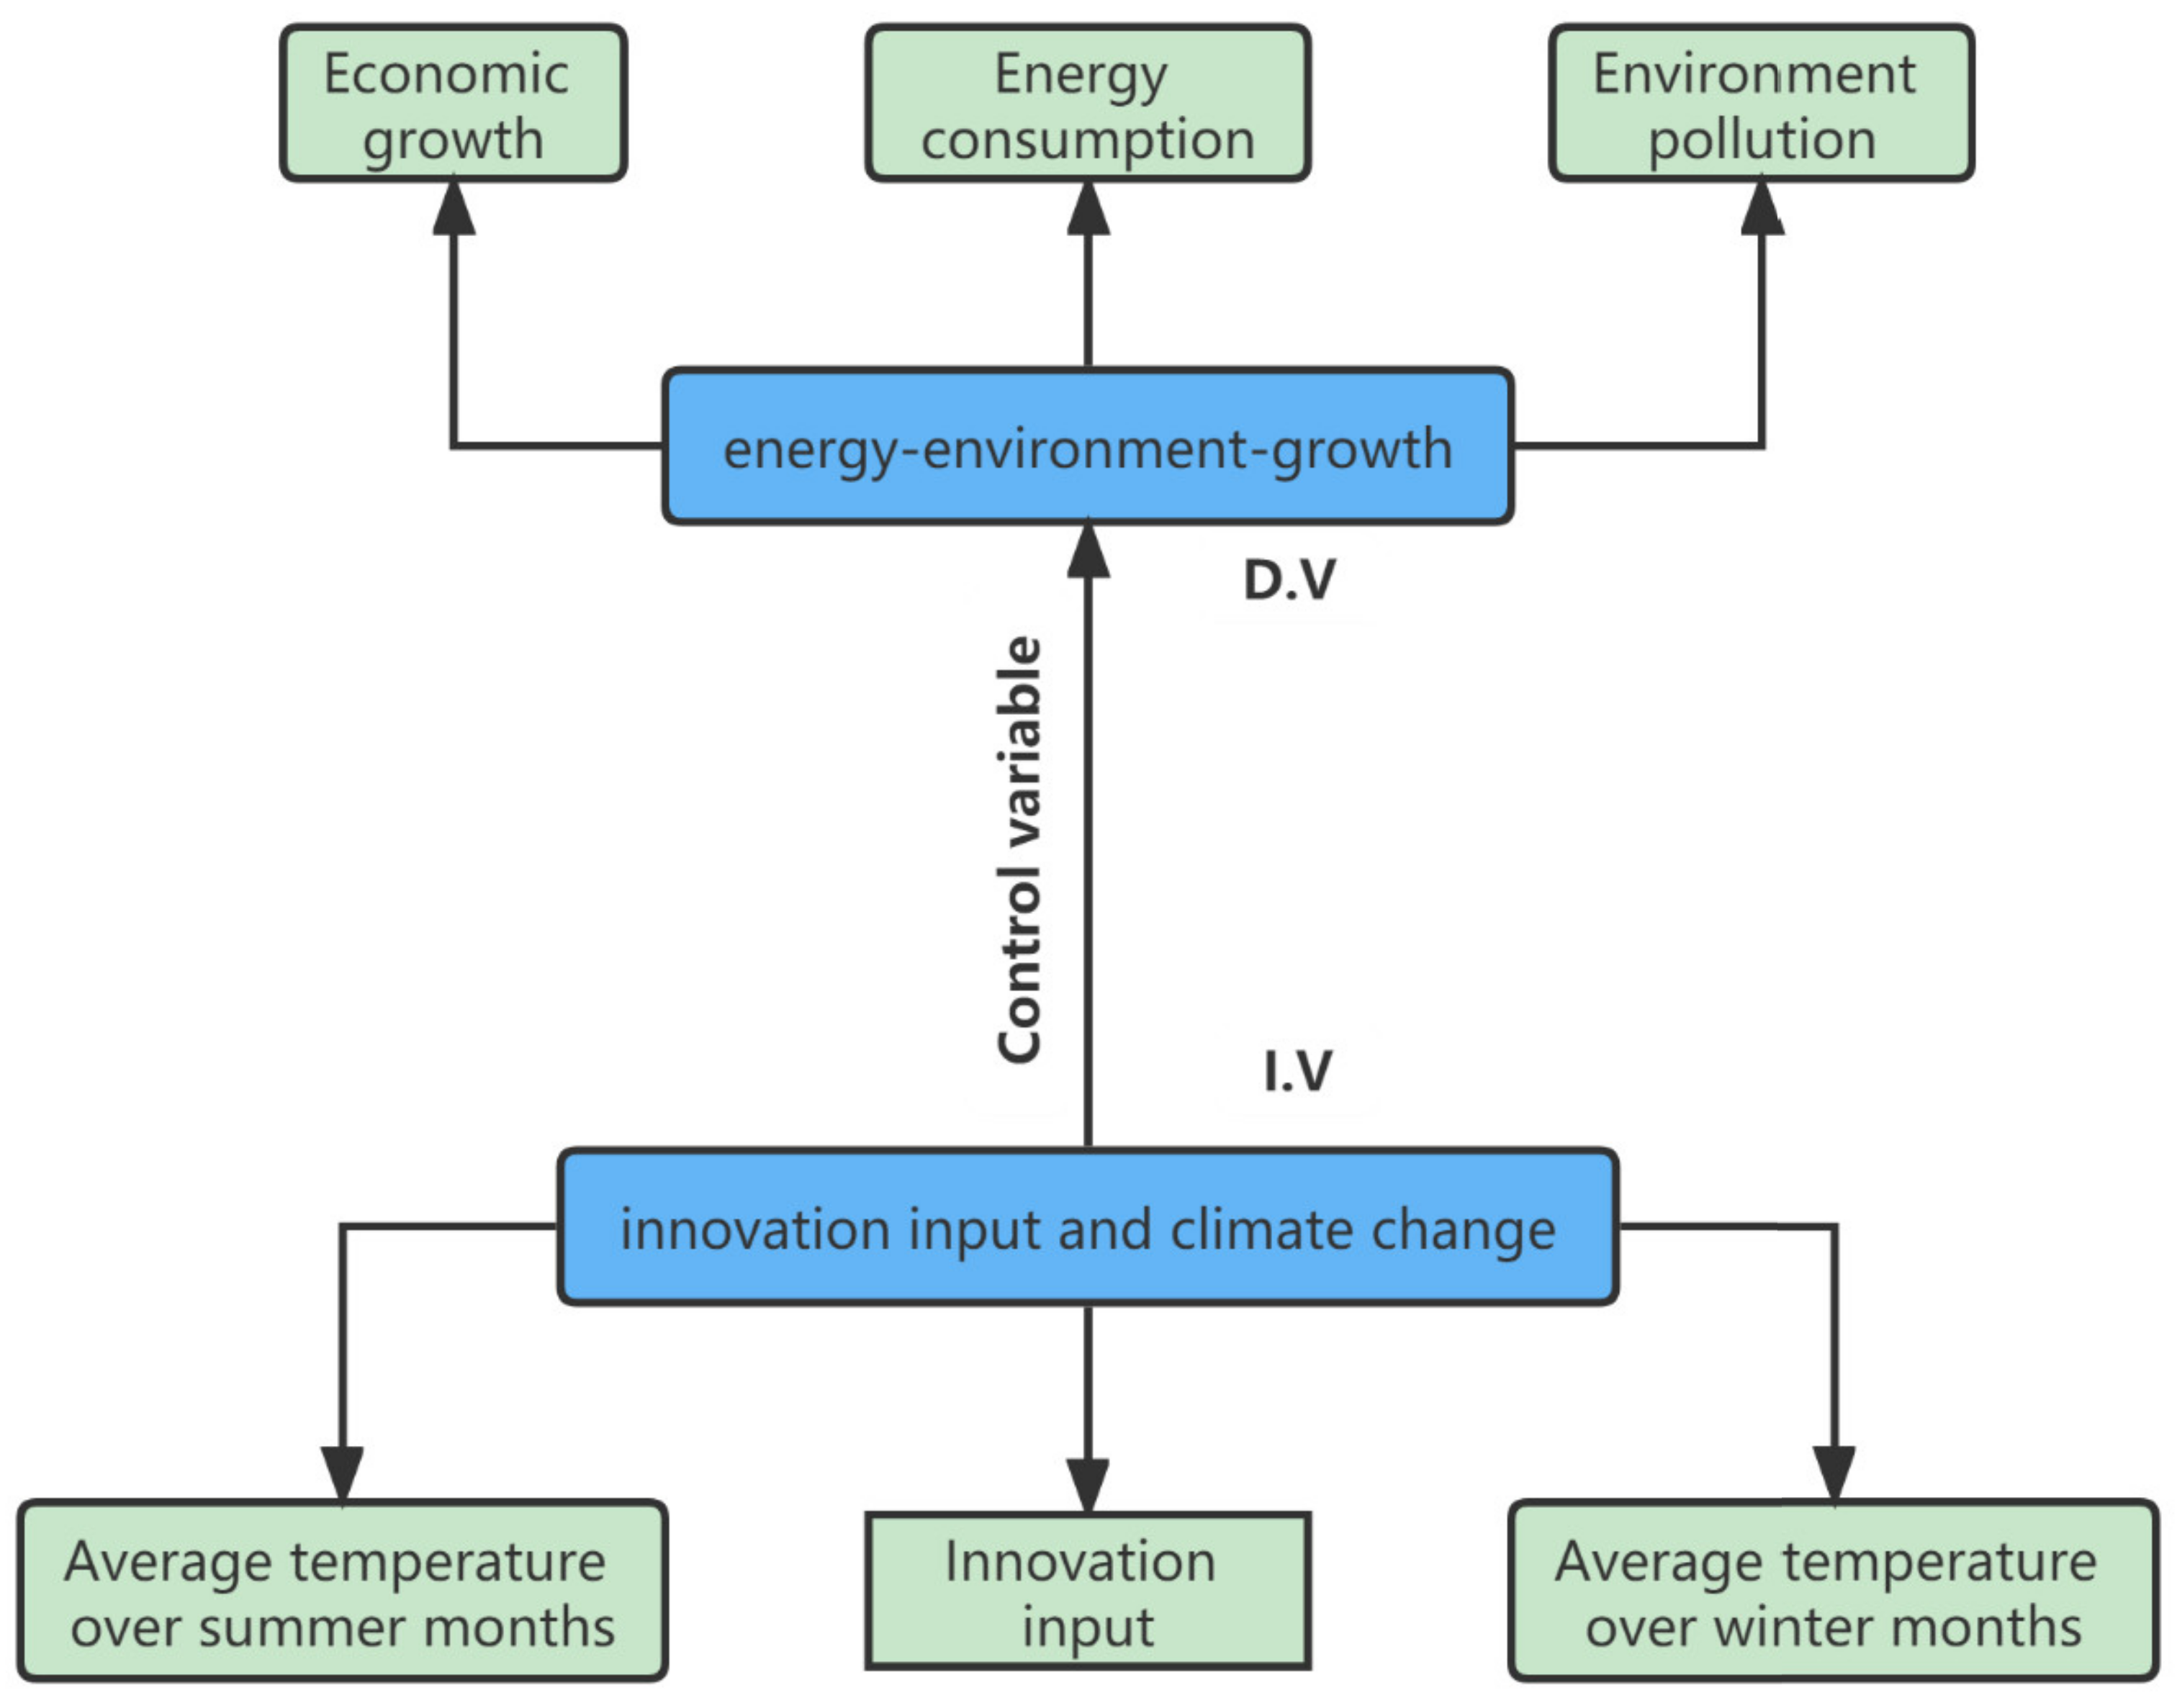
1. Introduction
2. Literature Review
2.1. Climate Change and the Energy-Environment-Growth Nexus
2.2. Innovation Input and the Energy-Environment-Growth Nexus
2.2.1. Innovation Input and Economic Growth
2.2.2. Innovation Input and Environment Pollution
2.2.3. Innovation Input and Energy Consumption
3. Methodology
3.1. Production Function
3.2. Energy Consumption Function
3.3. Pollution Function
3.4. The Estimation Method
4. Results
4.1. Data Source
4.2. The Results of the Production Function
4.3. The Results of Energy Consumption Function
4.4. The Results of the Pollution Function
4.5. The Heterogeneity of Sample Interval
5. Conclusions and Policy Recommendations
- (1)
- Renewable energy consumption promotes green economic growth and vice versa. Therefore, OECD and non-OECD countries should speed up the transformation and upgrading, increase the proportion of new and renewable energy sources, promote the low carbonization of the energy system, fully develop and utilize renewable energy such as solar energy, thermal energy, wind energy, biofuels and nuclear energy, and build an efficient and clean energy consumption system. In addition, OECD countries can also build an industrial chain system for energy storage and then to the application link, realize the coordinated development of the upstream, middle and downstream, and produce high-quality, high-tech, and high-value-added green products, to achieve green economic growth.
- (2)
- Renewable energy consumption reduces greenhouse gas emissions caused by climate change. Therefore, OECD and non-OECD countries should give priority to promoting the development of renewable energy and adjusting the energy structure, gradually increasing the proportion of non-fossil energy consumption, and accelerating the construction of a clean, low-carbon, safe, and efficient energy system. At the same time, non-OECD countries should also strengthen the macro policy guidance and legal protection functions related to renewable energy development and set sustainable development goals and strategic ideas.
- (3)
- Innovation investment promotes green economy growth in OECD and non-OECD countries. Therefore, OECD and non-OECD countries should pay close attention to the iterative trend of global renewable energy technologies and increase financial support for renewable energy technology R&D, increase support for energy conservation and emission reduction technology R&D through financial allocations, tax exemptions, simplified administrative approvals, and scientific and technological innovation incentives, support the development of high-tech industries, establish and improve the energy conservation and emission reduction technology industrial system, thus achieving continuous innovation and development of technology. In addition, OECD and non-OECD countries should also strengthen the guiding role of financial funds in technology research and development, enrich the construction of research and development mechanisms, open up production, learning, and research channels, and attach importance to the long-term applicability and social effects of renewable technology selection and deployment.
- (4)
- The impact of innovation input on the energy-environment-growth nexus is greater in the short term and more significant in the medium and long term. Therefore, OECD and non-OECD countries should set up a long-term renewable energy development strategy, clarify the long-term goals of renewable energy development and make long-term arrangements for the research and development of key renewable energy technologies such as solar and nuclear energy. At the same time, OECD countries should increase innovation investment, pay attention to renewable energy talent training, research and development, and industrial system construction, establish specialized R&D institutions, support the development of renewable energy scientific research, technology development, and industrial services, and train generations of talents with innovative consciousness, core technologies, and challenging spirit, thus promoting the long-term development of renewable energy technology progress and industrialization.
- (5)
- The impact of climate change on the energy-environment nexus is more significant in the medium and long term. Therefore, OECD and non-OECD countries should formulate long-term sustainable policies to cope with climate change, closely follow the implementation of policy objectives, and give flexibility to dynamic adjustment of policies. OECD countries should pay attention to the binding role of laws, timely study and launch climate law, and “legalize” the medium and long-term emission reduction targets. At the same time, OECD and non-OECD countries should strengthen practical cooperation with countries along the belt and road in the fields of green production capacity cooperation and green financial standards, to build a fair and reasonable global climate governance system with win-win cooperation.
Author Contributions
Funding
Data Availability Statement
Conflicts of Interest
References
- Xu, X.-l.; Chen, H.H. Examining the efficiency of biomass energy: Evidence from the Chinese recycling industry. Energy Policy 2018, 119, 77–86. [Google Scholar] [CrossRef]
- Mauree, D.; Naboni, E.; Coccolo, S.; Perera, A.T.D.; Nik, V.M.; Scartezzini, J.-L. A review of assessment methods for the urban environment and its energy sustainability to guarantee climate adaptation of future cities. Renew. Sustain. Energy Rev. 2019, 112, 733–746. [Google Scholar] [CrossRef]
- Reder, A.; Iturbide, M.; Herrera, S.; Rianna, G.; Mercogliano, P.; Gutiérrez, J.M. Assessing variations of extreme indices inducing weather-hazards on critical infrastructures over Europe—The INTACT framework. Clim. Change 2018, 148, 123–138. [Google Scholar] [CrossRef]
- Creti, A.; Nguyen, D.K. Energy, Climate and Environment: Policies and International Coordination. Energy Policy 2020, 140, 111226. [Google Scholar] [CrossRef]
- Zhang, H. Antinomic policy-making under the fragmented authoritarianism: Regulating China’s electricity sector through the energy-climate-environment dimension. Energy Policy 2019, 128, 162–169. [Google Scholar] [CrossRef]
- Ulucak, R.; Danish, O.B. Relationship between energy consumption and environmental sustainability in OECD countries: The role of natural resources rents. Resour. Policy 2020, 69, 101803. [Google Scholar] [CrossRef]
- Sanquist, T.F.; Orr, H.; Shui, B.; Bittner, A.C. Lifestyle factors in U.S. residential electricity consumption. Energy Policy 2012, 42, 354–364. [Google Scholar] [CrossRef]
- Auffhammer, M. Climate Adaptive Response Estimation: Short and long run impacts of climate change on residential electricity and natural gas consumption. J. Environ. Econ. Manag. 2022, 114, 102669. [Google Scholar] [CrossRef]
- Arminen, H.; Menegaki, A.N. Corruption, climate and the energy-environment-growth nexus. Energy Econ. 2019, 80, 621–634. [Google Scholar] [CrossRef]
- Bashir, M.F.; Ma, B.; Bashir, M.A.; Bilal; Shahzad, L. Scientific data-driven evaluation of academic publications on environmental Kuznets curve. Environ. Sci. Pollut. Res. Int. 2021, 28, 16982–16999. [Google Scholar] [CrossRef]
- Chen, Y.; Lee, C.-C. Does technological innovation reduce CO2 emissions? Cross-country evidence. J. Clean. Prod. 2020, 263, 121550. [Google Scholar] [CrossRef]
- Auffhammer, M.; Mansur, E.T. Measuring climatic impacts on energy consumption: A review of the empirical literature. Energy Econ. 2014, 46, 522–530. [Google Scholar] [CrossRef]
- Omri, A.; Ben Mabrouk, N.; Sassi-Tmar, A. Modeling the causal linkages between nuclear energy, renewable energy and economic growth in developed and developing countries. Renew. Sustain. Energy Rev. 2015, 42, 1012–1022. [Google Scholar] [CrossRef]
- Zhang, M.; Zhang, K.; Hu, W.; Zhu, B.; Wang, P.; Wei, Y.-M. Exploring the climatic impacts on residential electricity consumption in Jiangsu, China. Energy Policy 2020, 140, 111398. [Google Scholar] [CrossRef]
- Omri, A. CO2 emissions, energy consumption and economic growth nexus in MENA countries: Evidence from simultaneous equations models. Energy Econ. 2013, 40, 657–664. [Google Scholar] [CrossRef]
- Khan, S.; Peng, Z.; Li, Y. Energy consumption, environmental degradation, economic growth and financial development in globe: Dynamic simultaneous equations panel analysis. Energy Rep. 2019, 5, 1089–1102. [Google Scholar] [CrossRef]
- Omri, A.; Kahouli, B. Causal relationships between energy consumption, foreign direct investment and economic growth: Fresh evidence from dynamic simultaneous-equations models. Energy Policy 2014, 67, 913–922. [Google Scholar] [CrossRef]
- Adewuyi, A.O.; Awodumi, O.B. Biomass energy consumption, economic growth and carbon emissions: Fresh evidence from West Africa using a simultaneous equation model. Energy 2017, 119, 453–471. [Google Scholar] [CrossRef]
- Granger, C.W.J. Investigating causal relations by econometric models and cross-spectral methods. Econom. J. Econom. Soc. 1969, 37, 424–438. [Google Scholar] [CrossRef]
- Stern, D.I. The Rise and Fall of the Environmental Kuznets Curve. World Dev. 2004, 32, 1419–1439. [Google Scholar] [CrossRef]
- Naseem, S.; Guang Ji, T. A system-GMM approach to examine the renewable energy consumption, agriculture and economic growth’s impact on CO2 emission in the SAARC region. GeoJournal 2020, 86, 2021–2033. [Google Scholar] [CrossRef]
- Nasir, M.; Ur-Rehman, F. Environmental Kuznets Curve for carbon emissions in Pakistan: An empirical investigation. Energy Policy 2011, 39, 1857–1864. [Google Scholar] [CrossRef]
- Saboori, B.; Sulaiman, J.; Mohd, S. Economic growth and CO2 emissions in Malaysia: A cointegration analysis of the Environmental Kuznets Curve. Energy Policy 2012, 51, 184–191. [Google Scholar] [CrossRef]
- Kraft, J.; Kraft, A. On the relationship between energy and GNP. J. Energy Dev. 1978, 3, 401–403. [Google Scholar]
- Shahbaz, M.; Destek, M.A.; Okumus, I.; Sinha, A. An empirical note on comparison between resource abundance and resource dependence in resource abundant countries. Resour. Policy 2019, 60, 47–55. [Google Scholar] [CrossRef]
- Khan, A.; Chenggang, Y.; Hussain, J.; Bano, S.; Nawaz, A. Natural resources, tourism development, and energy-growth-CO2 emission nexus: A simultaneity modeling analysis of BRI countries. Resour. Policy 2020, 68, 101962. [Google Scholar] [CrossRef]
- Wang, R.; Tan, J.; Yao, S. Are natural resources a blessing or a curse for economic development? The importance of energy innovations. Resour. Policy 2021, 72, 102042. [Google Scholar] [CrossRef]
- Soytas, U.; Sari, R. Energy consumption, economic growth, and carbon emissions: Challenges faced by an EU candidate member. Ecol. Econ. 2009, 68, 1667–1675. [Google Scholar] [CrossRef]
- Huang, B.-N.; Hwang, M.J.; Yang, C.W. Causal relationship between energy consumption and GDP growth revisited: A dynamic panel data approach. Ecol. Econ. 2008, 67, 41–54. [Google Scholar] [CrossRef]
- Saidi, K.; Hammami, S. The impact of energy consumption and CO2 emissions on economic growth: Fresh evidence from dynamic simultaneous-equations models. Sustain. Cities Soc. 2015, 14, 178–186. [Google Scholar] [CrossRef]
- Lee, C.-C. The causality relationship between energy consumption and GDP in G-11 countries revisited. Energy Policy 2006, 34, 1086–1093. [Google Scholar] [CrossRef]
- Apergis, N.; Payne, J.E. Energy consumption and economic growth: Evidence from the Commonwealth of Independent States. Energy Econ. 2009, 31, 641–647. [Google Scholar] [CrossRef]
- Jalil, A.; Mahmud, S.F. Environment Kuznets curve for CO2 emissions: A cointegration analysis for China. Energy Policy 2009, 37, 5167–5172. [Google Scholar] [CrossRef]
- Waheed, R.; Sarwar, S.; Wei, C. The survey of economic growth, energy consumption and carbon emission. Energy Rep. 2019, 5, 1103–1115. [Google Scholar] [CrossRef]
- Pandey, S.; Dogan, E.; Taskin, D. Production-based and consumption-based approaches for the energy-growth-environment nexus: Evidence from Asian countries. Sustain. Prod. Consum. 2020, 23, 274–281. [Google Scholar] [CrossRef]
- Considine, T.J. The impacts of weather variations on energy demand and carbon emissions. Resour. Energy Econ. 2000, 22, 295–314. [Google Scholar] [CrossRef]
- Jin, T.; Kim, J. Coal Consumption and Economic Growth: Panel Cointegration and Causality Evidence from OECD and Non-OECD Countries. Sustainability 2018, 10, 660. [Google Scholar] [CrossRef]
- Chang, C.P.; Hao, Y. Environmental performance, corruption and economic growth: Global evidence using a new data set. Appl. Econ. 2017, 49, 498–514. [Google Scholar] [CrossRef]
- Niu, J.; Chang, C.P.; Yang, X.Y.; Wang, J.S. The long-run relationships between energy efficiency and environmental performance: Global evidence. Energy Environ. 2017, 28, 706–724. [Google Scholar] [CrossRef]
- Fankhauser, S.; Tol, R.S.J. On climate change and economic growth. Resour. Energy Econ. 2005, 27, 1–17. [Google Scholar] [CrossRef]
- Zhao, X.; Gerety, M.; Kuminoff, N.V. Revisiting the temperature-economic growth relationship using global subnational data. J. Environ. Manag. 2018, 223, 537–544. [Google Scholar] [CrossRef] [PubMed]
- Rezai, A.; Taylor, L.; Foley, D. Economic Growth, Income Distribution, and Climate Change. Ecol. Econ. 2018, 146, 164–172. [Google Scholar] [CrossRef]
- Magazzino, C.; Mutascu, M.; Sarkodie, S.A.; Adedoyin, F.F.; Owusu, P.A. Heterogeneous effects of temperature and emissions on economic productivity across climate regimes. Sci. Total Environ. 2021, 775, 145893. [Google Scholar] [CrossRef]
- Chen, W.H.; Lei, Y. The impacts of renewable energy and technological innovation on environment-energy-growth nexus: New evidence from a panel quantile regression. Renew. Energy 2018, 123, 1–14. [Google Scholar] [CrossRef]
- Zakari, A.; Tawiah, V.; Oyewo, B.; Alvarado, R. The impact of corruption on green innovation: The case of OECD and non-OECD countries. J. Environ. Plan. Manag. 2022, 65, 1–33. [Google Scholar] [CrossRef]
- Maneejuk, P.; Yamaka, W. An analysis of the impacts of telecommunications technology and innovation on economic growth. Telecommun. Policy 2020, 44, 102038. [Google Scholar] [CrossRef]
- Assi, A.F.; Zhakanova Isiksal, A.; Tursoy, T. Renewable energy consumption, financial development, environmental pollution, and innovations in the ASEAN + 3 group: Evidence from (P-ARDL) model. Renew. Energy 2021, 165, 689–700. [Google Scholar] [CrossRef]
- Thompson, M. Social capital, innovation and economic growth. J. Behav. Exp. Econ. 2018, 73, 46–52. [Google Scholar] [CrossRef]
- Adak, M. Technological Progress, Innovation and Economic Growth; the Case of Turkey. Procedia Soc. Behav. Sci. 2015, 195, 776–782. [Google Scholar] [CrossRef]
- Töbelmann, D.; Wendler, T. The impact of environmental innovation on carbon dioxide emissions. J. Clean. Prod. 2020, 244, 118787. [Google Scholar] [CrossRef]
- Nguyen, T.T.; Pham, T.A.T.; Tram, H.T.X. Role of information and communication technologies and innovation in driving carbon emissions and economic growth in selected G-20 countries. J. Environ. Manag. 2020, 261, 110162. [Google Scholar] [CrossRef]
- Erdogan, S.; Yildirim, S.; Yildirim, D.C.; Gedikli, A. The effects of innovation on sectoral carbon emissions: Evidence from G20 countries. J. Environ. Manag. 2020, 267, 110637. [Google Scholar] [CrossRef]
- Carrión-Flores, C.E.; Innes, R. Environmental innovation and environmental performance. J. Environ. Econ. Manag. 2010, 59, 27–42. [Google Scholar] [CrossRef]
- Sun, H.; Edziah, B.K.; Kporsu, A.K.; Sarkodie, S.A.; Taghizadeh-Hesary, F. Energy efficiency: The role of technological innovation and knowledge spillover. Technol. Forecast. Soc. Change 2021, 167, 120659. [Google Scholar] [CrossRef]
- Wurlod, J.-D.; Noailly, J. The impact of green innovation on energy intensity: An empirical analysis for 14 industrial sectors in OECD countries. Energy Econ. 2018, 71, 47–61. [Google Scholar] [CrossRef]
- Wang, D.; Tian, S.; Fang, L.; Xu, Y. A functional index model for dynamically evaluating China’s energy security. Energy Policy 2020, 147, 111706. [Google Scholar] [CrossRef]
- Xu, X.L.; Chen, Y.J. A comprehensive model to analyze straw recycling logistics costs for sustainable development: Evidence from biomass power generation. Environ. Prog. Sustain. Energy 2020, 39, e13394. [Google Scholar] [CrossRef]
- Khan, I.; Hou, F.; Zakari, A.; Tawiah, V.K. The dynamic links among energy transitions, energy consumption, and sustainable economic growth: A novel framework for IEA countries. Energy 2021, 222, 119935. [Google Scholar] [CrossRef]
- Zhou, G.; Zhu, J.; Luo, S. The impact of fintech innovation on green growth in China: Mediating effect of green finance. Ecol. Econ. 2022, 193, 107308. [Google Scholar] [CrossRef]
- Xu, X.L.; Shen, T.; Zhang, X.; Chen, H.H. The role of innovation investment and executive incentive on financial sustainability in tech-capital-labor intensive energy company: Moderate effect. Energy Rep. 2020, 6, 2667–2675. [Google Scholar] [CrossRef]
- Liu, S.J.; Xu, X.L. The pollution halo effect of technology spillover and pollution haven effect of economic growth in agricultural foreign trade: Two sides of the same coin? Environ. Sci. Pollut. Res. Int. 2021, 28, 20157–20173. [Google Scholar] [CrossRef] [PubMed]
- Xu, X.L.; Chen, H.H.; Li, Y.; Chen, Q.X. The role of equity balance and executive stock ownership in the innovation efficiency of renewable energy enterprises. J. Renew. Sustain. Energy 2019, 11, 055901. [Google Scholar] [CrossRef]
- Arellano, M.; Bond, S. Some tests of specification for panel data: Monte Carlo evidence and an application to employment equations. Rev. Econ. Stud. 1991, 58, 277–297. [Google Scholar] [CrossRef]
- Arellano, M.; Bover, O. Another look at the instrumental variable estimation of error-components models. J. Econom. 1995, 68, 29–51. [Google Scholar] [CrossRef]
- Blundell, R.; Bond, S. Initial conditions and moment restrictions in dynamic panel data models. J. Econom. 1998, 87, 115–143. [Google Scholar] [CrossRef]
- Saidi, K.; Hammami, S. Economic growth, energy consumption and carbone dioxide emissions: Recent evidence from panel data analysis for 58 countries. Qual. Quant. 2015, 50, 361–383. [Google Scholar] [CrossRef]
- Sekrafi, H.; Sghaier, A. Examining the Relationship Between Corruption, Economic Growth, Environmental Degradation, and Energy Consumption: A Panel Analysis in MENA Region. J. Knowl. Econ. 2016, 9, 963–979. [Google Scholar] [CrossRef]
- Bhattacharya, M.; Awaworyi Churchill, S.; Paramati, S.R. The dynamic impact of renewable energy and institutions on economic output and CO2 emissions across regions. Renew. Energy 2017, 111, 157–167. [Google Scholar] [CrossRef]
- Farhadi, M.; Islam, M.R.; Moslehi, S. Economic Freedom and Productivity Growth in Resource-rich Economies. World Dev. 2015, 72, 109–126. [Google Scholar] [CrossRef]
- Roodman, D. How to do xtabond2: An introduction to difference and system GMM in Stata. Stata J. 2009, 9, 86–136. [Google Scholar] [CrossRef]


| Primary Index | Secondary Index | Tertiary Indicators | Symbol | Unit |
|---|---|---|---|---|
| Per capita GDP | X1 | Dollar | ||
| Economic | Final consumption expenditure | X2 | Dollar | |
| development | Inflation consumer Prices Taxes on income, profits, and capital gains | X3 X4 | Dollar | |
| Green economic growth index | Resource environment | Per capita energy consumption Total natural resources rents in GDP CO2 emissions Forest area | X5 X6 X7 X8 | kg of oil % Kt Sq.km |
| Globalization Urban construction | Proportion of exports of goods and services in GDP Proportion of trade in GDP Agriculture, forestry, and fishing, value added per worker Population growth | X9 X10 X11 X12 | % % Dollar % |
| Variables | Definition | Source | Calculation by the Author |
|---|---|---|---|
| Dependent variable | |||
| Energy consumption | Renewable energy consumption (% of total) | IEA | |
| Economic growth | It covers four aspects: Economic development, Resource environment, Globalization, and Urban Construction | Khan et al. (2021) and Zhou et al. (2022) | Calculation by PCA |
| Environment pollution | Total greenhouse gas emissions (kt of CO2 equivalent) | World Bank’s World Development Indicators | |
| Independent variable | |||
| Innovation input | % Research and development expenditure of total GDP | World Bank’s World Development Indicators | |
| Average temperature over summer months | Average temperatures in June, July, and August for countries with capitals in the Northern Hemisphere, and January, February, and December for countries with capitals in the Southern Hemisphere | World Bank: monthly average temperatures for countries; CIA (2018): latitudes of country capitals | Calculation of average temperatures over summer months based on monthly data |
| Average temperature over winter months | Average temperatures in January, February, and December for countries with capitals in the Northern Hemisphere, and June, July, and August for countries with capitals in the Southern Hemisphere | World Bank: monthly average temperatures for countries; CIA (2018): latitudes of country capitals | Calculation of average temperatures over winter months based on monthly data |
| Control variable | |||
| Climate Policy | Signing Kyoto Protocol before 2016 or Joining the Paris Agreement after 2016 | Kyoto Protocol and The Paris Agreement | The number 1 represents joining the Paris Agreement or Kyoto Protocol and the number 0 represents no joining |
| Industrialization | % Value added of industry of total GDP | World Bank’s World Development Indicators | Interpolated Divided by population |
| Capital | Capital stock at constant 2010 national prices (in mil. 2010USD) | Penn World Table | |
| Urbanization | % Urban population of the total population | Penn World Table |
| Variable | Group | Obs | Mean | Std.Dev | Min | Max |
|---|---|---|---|---|---|---|
| pol | OECD | 700 | 11.21 | 1.852 | 4.094 | 13.81 |
| Non-OECD | 720 | 11.35 | 1.800 | 7.534 | 16.33 | |
| geg | OECD | 700 | 1.173 | 0.575 | 0.345 | 3.222 |
| Non-OECD | 720 | 0.656 | 0.577 | 0.211 | 11.37 | |
| k | OECD | 700 | 2.851 | 1.537 | 0.860 | 14.49 |
| Non-OECD | 720 | 1.288 | 1.008 | −2.232 | 3.633 | |
| e | OECD | 700 | 2.568 | 0.926 | −0.368 | 4.113 |
| Non-OECD | 720 | 2.617 | 1.755 | −5.021 | 4.545 | |
| ino | OECD | 700 | 0.277 | 0.756 | −2.040 | 1.600 |
| Non-OECD | 720 | −1.156 | 1.203 | −5.482 | 0.954 | |
| ind | OECD | 700 | 3.249 | 0.245 | 2.353 | 3.856 |
| Non-OECD | 720 | 3.360 | 0.287 | 2.301 | 4.252 | |
| stemp | OECD | 700 | 19.91 | 3.663 | 12.86 | 31.42 |
| Non-OECD | 720 | 24.62 | 5.416 | 8.830 | 37.01 | |
| wtemp | OECD | 700 | 4.326 | 7.432 | −14.19 | 26.62 |
| Non-OECD | 720 | 12.60 | 12.23 | −26.85 | 31.01 | |
| urb | OECD | 700 | 4.379 | 0.593 | 4.020 | 8.946 |
| Non-OECD | 720 | 4.031 | 0.353 | 2.901 | 4.605 | |
| poli | OECD | 700 | 0.844 | 0.363 | 0 | 1 |
| Non-OECD | 720 | 0.850 | 0.357 | 0 | 1 |
| Variables | Group (1) | Group (2) | Group (3) | Group (4) |
|---|---|---|---|---|
| Diff-GMM | Sys-GMM | Diff-GMM | Sys-GMM | |
| L.geg | 0.925 *** | 0.919 *** | 0.934 *** | 0.910 *** |
| (0.00407) | (0.00218) | (0.00574) | (0.00301) | |
| k | 0.0251 *** | 0.0124 *** | 0.0282 *** | 0.0104 *** |
| (0.00329) | (0.000664) | (0.00499) | (0.000803) | |
| e | −0.0369 *** | −0.0289 *** | −0.0382 *** | −0.0271 *** |
| (0.00255) | (0.00170) | (0.00277) | (0.00203) | |
| ino | 0.00769 * | 0.0184 *** | ||
| (0.00412) | (0.00166) | |||
| Constant | 0.146 *** | 0.150 *** | ||
| (0.00436) | (0.00571) | |||
| Observations | 630 | 665 | 630 | 665 |
| Sample | 35 | 35 | 35 | 35 |
| AR(1) | 0.00221 | 0.00183 | 0.00223 | 0.00189 |
| AR(2) | 0.785 | 0.597 | 0.808 | 0.598 |
| Hansen test | 0.427 | 0.586 | 0.381 | 0.658 |
| Variables | Group (1) | Group (2) | Group (3) | Group (4) |
|---|---|---|---|---|
| Diff-GMM | Sys-GMM | Diff-GMM | Sys-GMM | |
| L.geg | 0.130 *** | 0.493 *** | 0.185 *** | 0.489 *** |
| (0.00928) | (0.00724) | (0.0102) | (0.00730) | |
| k | 0.249 *** | 0.202 *** | 0.322 *** | 0.178 *** |
| (0.00274) | (0.00327) | (0.00372) | (0.00462) | |
| e | 0.0471 *** | 0.0691 *** | 0.0839 *** | 0.0595 *** |
| (0.00548) | (0.00283) | (0.00586) | (0.00529) | |
| ino | 0.124 *** | 0.0306 *** | ||
| (0.00298) | (0.00391) | |||
| Constant | −0.103 *** | −0.00680 | ||
| (0.00524) | (0.0129) | |||
| Observations | 648 | 684 | 648 | 684 |
| Sample | 36 | 36 | 36 | 36 |
| AR(1) | 0.248 | 0.230 | 0.256 | 0.228 |
| AR(2) | 0.310 | 0.303 | 0.306 | 0.306 |
| Hansen test | 0.385 | 0.527 | 0.358 | 0.531 |
| Variables | Group (1) | Group (2) | Group (3) | Group (4) | Group (5) | Group (6) | Group (7) | Group (8) |
|---|---|---|---|---|---|---|---|---|
| Diff-GMM | Sys-GMM | Diff-GMM | Sys-GMM | Diff-GMM | Sys-GMM | Diff-GMM | Sys-GMM | |
| L.e | 0.835 *** | 0.947 *** | 0.844 *** | 0.939 *** | 0.767 *** | 0.943 *** | 0.774 *** | 0.947 *** |
| (0.0649) | (0.0187) | (0.0534) | (0.0274) | (0.0820) | (0.0316) | (0.0852) | (0.0288) | |
| geg | 0.171 *** | 0.117 *** | 0.0328 | 0.0581 | 0.217 *** | 0.0977 *** | 0.0791 | 0.0673 |
| (0.0482) | (0.0371) | (0.0634) | (0.0460) | (0.0499) | (0.0323) | (0.0691) | (0.0438) | |
| ind | −0.131 | 0.0472 | 0.122 | 0.143 *** | −0.223 * | −2.92 × 10⁻⁵ | −0.0136 | 0.135 ** |
| (0.0982) | (0.0434) | (0.141) | (0.0523) | (0.118) | (0.0420) | (0.173) | (0.0529) | |
| ino | 0.213 *** | 0.126 *** | 0.186 *** | 0.108 ** | ||||
| (0.0664) | (0.0488) | (0.0696) | (0.0500) | |||||
| stemp | −0.00681 | −0.00893 ** | −0.00251 | −0.00668 * | ||||
| (0.00440) | (0.00444) | (0.00445) | (0.00401) | |||||
| wtemp | 0.00502 * | −9.13 × 10⁻⁵ | 0.00399 | 0.000999 | ||||
| (0.00288) | (0.00292) | (0.00296) | (0.00237) | |||||
| Constant | −0.138 | −0.391 ** | 0.225 | −0.265 | ||||
| (0.208) | (0.186) | (0.172) | (0.195) | |||||
| Observations | 630 | 665 | 630 | 665 | 630 | 665 | 630 | 665 |
| Sample | 35 | 35 | 35 | 35 | 35 | 35 | 35 | 35 |
| AR(1) | 0.00326 | 0.00193 | 0.00108 | 0.00109 | 0.00320 | 0.00189 | 0.00170 | 0.00111 |
| AR(2) | 0.865 | 0.816 | 0.959 | 0.843 | 0.915 | 0.840 | 0.976 | 0.850 |
| Hansen test | 0.481 | 0.734 | 0.696 | 0.621 | 0.495 | 0.676 | 0.545 | 0.525 |
| Variables | Group (1) | Group (2) | Group (3) | Group (4) | Group (5) | Group (6) | Group (7) | Group (8) |
|---|---|---|---|---|---|---|---|---|
| Diff-GMM | Sys-GMM | Diff-GMM | Sys-GMM | Diff-GMM | Sys-GMM | Diff-GMM | Sys-GMM | |
| L.e | 0.672 *** | 0.871 *** | 0.403 *** | 0.873 *** | 0.726 *** | 0.824 *** | 0.409 *** | 0.815 *** |
| (0.0493) | (0.0318) | (0.0728) | (0.0332) | (0.0570) | (0.0309) | (0.103) | (0.0339) | |
| geg | −0.137 ** | −0.0291 | −0.0146 | −0.0326 | −0.101 | −0.0954 | 0.0125 | −0.0488 |
| (0.0665) | (0.0462) | (0.0720) | (0.0499) | (0.0633) | (0.0592) | (0.0884) | (0.0581) | |
| ind | 0.0184 | −0.259 *** | 0.161 | −0.246 *** | −0.0459 | −0.297 *** | 0.272 | −0.279 *** |
| (0.0845) | (0.0494) | (0.130) | (0.0544) | (0.0882) | (0.0533) | (0.201) | (0.0551) | |
| ino | −0.108 *** | 0.00606 | −0.146 *** | −0.00251 | ||||
| (0.0307) | (0.0223) | (0.0509) | (0.0266) | |||||
| stemp | −0.0185 *** | −0.0337 *** | 0.00104 | −0.0373 *** | ||||
| (0.00691) | (0.00695) | (0.0123) | (0.00831) | |||||
| wtemp | 0.0142 *** | 0.00416 | 0.0264 *** | 0.00360 | ||||
| (0.00432) | (0.00558) | (0.00594) | (0.00652) | |||||
| Constant | 1.231 *** | 1.195 *** | 2.328 *** | 2.352 *** | ||||
| (0.244) | (0.251) | (0.286) | (0.287) | |||||
| Observations | 648 | 684 | 648 | 684 | 648 | 684 | 648 | 684 |
| Sample | 36 | 36 | 36 | 36 | 36 | 36 | 36 | 36 |
| AR(1) | 0.273 | 0.234 | 0.371 | 0.234 | 0.270 | 0.232 | 0.345 | 0.231 |
| AR(2) | 0.164 | 0.149 | 0.226 | 0.145 | 0.192 | 0.154 | 0.953 | 0.160 |
| Hansen test | 0.192 | 0.212 | 0.349 | 0.176 | 0.133 | 0.106 | 0.0967 | 0.0597 |
| Variables | Group (1) | Group (2) | Group (3) | Group (4) | Group (5) | Group (6) | Group (7) | Group (8) | Group (9) | Group (10) |
|---|---|---|---|---|---|---|---|---|---|---|
| Diff-GMM | Sys-GMM | Diff-GMM | Sys-GMM | Diff-GMM | Sys-GMM | Diff-GMM | Sys-GMM | Diff-GMM | Sys-GMM | |
| L.pol | 0.486 *** | 0.932 *** | 0.396 *** | 0.929 *** | 0.434 *** | 0.939 *** | 0.337 *** | 0.933 *** | 0.339 *** | 0.949 *** |
| (0.0190) | (0.0123) | (0.0231) | (0.0212) | (0.0278) | (0.00804) | (0.0382) | (0.00834) | (0.0407) | (0.0121) | |
| geg | 0.246 *** | 0.0218 | 0.666 *** | 0.186 *** | 0.263 *** | 0.142 *** | 0.577 *** | 0.202 *** | 0.523 *** | 0.170 *** |
| (0.0293) | (0.0390) | (0.0777) | (0.0488) | (0.0310) | (0.0283) | (0.0789) | (0.0462) | (0.0971) | (0.0522) | |
| geg2 | −0.0591 *** | −0.0283 ** | −0.173 *** | −0.0754 *** | −0.0640 *** | −0.0582 *** | −0.146 *** | −0.0753 *** | −0.126 *** | −0.0727 *** |
| (0.00847) | (0.0131) | (0.0239) | (0.0165) | (0.00909) | (0.0111) | (0.0277) | (0.0159) | (0.0356) | (0.0138) | |
| e | −0.0750 *** | −0.0211 *** | −0.0844 *** | −0.00393 | −0.0864 *** | −0.0114 *** | −0.0873 *** | −0.0115 *** | −0.0772 *** | −0.000620 |
| (0.00550) | (0.00226) | (0.00746) | (0.00409) | (0.00914) | (0.00208) | (0.0107) | (0.00270) | (0.0105) | (0.00468) | |
| ino | −0.0715 *** | −0.0288 *** | −0.0462 ** | −0.00687 | −0.0503 ** | −0.00740 | ||||
| (0.0205) | (0.00779) | (0.0208) | (0.00558) | (0.0223) | (0.00756) | |||||
| stemp | −0.00797 *** | −0.00295 *** | −0.00763 *** | −0.00273 *** | −0.00844 *** | −0.00160 | ||||
| (0.000931) | (0.000890) | (0.00110) | (0.000725) | (0.00118) | (0.00104) | |||||
| wtemp | 0.000670 | 0.00482 *** | 0.000523 | 0.00544 *** | 0.000498 | 0.00389 *** | ||||
| (0.000535) | (0.000776) | (0.000819) | (0.000740) | (0.000924) | (0.000853) | |||||
| urb | 0.0255 ** | 0.0282 *** | ||||||||
| (0.0112) | (0.00645) | |||||||||
| poli | 0.0105 ** | |||||||||
| (0.00415) | ||||||||||
| Constant | 0.847 *** | 0.720 *** | 0.684 *** | 0.700 *** | 0.374 *** | |||||
| (0.139) | (0.230) | (0.0934) | (0.0829) | (0.124) | ||||||
| Observations | 630 | 665 | 630 | 665 | 630 | 665 | 630 | 665 | 630 | 665 |
| Sample | 35 | 35 | 35 | 35 | 35 | 35 | 35 | 35 | 35 | 35 |
| AR(1) | 0.000294 | 0.000137 | 0.000385 | 0.000123 | 0.000526 | 0.000150 | 0.00126 | 0.000158 | 0.00188 | 0.000112 |
| AR(2) | 0.597 | 0.474 | 0.927 | 0.522 | 0.639 | 0.281 | 0.939 | 0.261 | 0.976 | 0.392 |
| Hansen test | 0.977 | 0.995 | 0.985 | 0.989 | 0.980 | 0.998 | 0.993 | 0.998 | 0.993 | 0.997 |
| Variables | Group (1) | Group (2) | Group (3) | Group (4) | Group (5) | Group (6) | Group (7) | Group (8) | Group (9) | Group (10) |
|---|---|---|---|---|---|---|---|---|---|---|
| Diff-GMM | Sys-GMM | Diff-GMM | Sys-GMM | Diff-GMM | Sys-GMM | Diff-GMM | Sys-GMM | Diff-GMM | Sys-GMM | |
| L.pol | 0.928 *** | 1.009 *** | 0.914 *** | 0.980 *** | 0.923 *** | 0.995 *** | 0.913 *** | 1.002 *** | 0.785 *** | 0.986 *** |
| (0.00832) | (0.00982) | (0.0149) | (0.0109) | (0.00801) | (0.00855) | (0.0226) | (0.00978) | (0.0334) | (0.0155) | |
| geg | 0.0553 *** | −0.113 *** | 0.0641 *** | −0.0139 | 0.0687 *** | −0.0865 *** | 0.0822 *** | −0.0356 ** | 0.0755 *** | −0.0398 *** |
| (0.0137) | (0.0179) | (0.0205) | (0.0149) | (0.0155) | (0.0238) | (0.0270) | (0.0175) | (0.0231) | (0.0129) | |
| geg2 | −0.00377 *** | 0.00968 *** | −0.00447 ** | 0.000539 | −0.00492 *** | 0.00721 *** | −0.00611 *** | 0.00294 * | −0.00585 *** | 0.00317 *** |
| (0.00129) | (0.00176) | (0.00185) | (0.00145) | (0.00147) | (0.00210) | (0.00210) | (0.00158) | (0.00178) | (0.00111) | |
| e | −0.0403 *** | −0.0143 *** | −0.0421 *** | −0.0384 *** | −0.0390 *** | −0.0273 *** | −0.0408 *** | −0.0324 *** | −0.0325 *** | −0.0351 *** |
| (0.00229) | (0.00160) | (0.00281) | (0.00360) | (0.00328) | (0.00547) | (0.00238) | (0.00464) | (0.00448) | (0.00574) | |
| ino | 0.00475 ** | −0.00849 ** | 0.000567 | −0.0100 *** | 0.0105 | 0.00264 | ||||
| (0.00214) | (0.00368) | (0.00572) | (0.00318) | (0.00685) | (0.00542) | |||||
| stemp | 0.00342 ** | −0.00264 * | 0.00331 | −0.00414 *** | 0.000712 | −0.00359 ** | ||||
| (0.00173) | (0.00159) | (0.00220) | (0.000676) | (0.00174) | (0.00143) | |||||
| wtemp | −0.00223 ** | 0.00148 *** | −0.000910 | 0.00217 *** | −0.00149 | 0.00163 *** | ||||
| (0.000971) | (0.000520) | (0.00195) | (0.000287) | (0.00151) | (0.000352) | |||||
| urb | 0.356 *** | −0.0749 *** | ||||||||
| (0.0519) | (0.0281) | |||||||||
| poli | 0.0121 ** | |||||||||
| Constant | 0.0237 | 0.342 *** | 0.243 *** | 0.161 | 0.655 *** | |||||
| (0.103) | (0.129) | (0.0891) | (0.117) | (0.169) | ||||||
| Observations | 648 | 684 | 648 | 684 | 648 | 684 | 648 | 684 | 648 | 684 |
| Sample | 36 | 36 | 36 | 36 | 36 | 36 | 36 | 36 | 36 | 36 |
| AR(1) | 0.000407 | 0.000177 | 0.000378 | 0.000353 | 0.000253 | 0.000351 | 0.000283 | 0.000522 | 0.000548 | 0.000468 |
| AR(2) | 0.425 | 0.482 | 0.420 | 0.419 | 0.341 | 0.526 | 0.350 | 0.551 | 0.382 | 0.561 |
| Hansen test | 0.971 | 0.988 | 0.965 | 0.997 | 0.965 | 0.997 | 0.967 | 0.997 | 0.966 | 0.997 |
| Sample Interval | Variables | Production | Energy Consumption | Pollution | |||
|---|---|---|---|---|---|---|---|
| Diff-GMM | Sys-GMM | Diff-GMM | Sys-GMM | Diff-GMM | Sys-GMM | ||
| 2015–2019 | ino | 1.190 *** | −0.0164 | 0.402 * | 0.447 ** | −0.582 ** | 0.0229 |
| (0.370) | (0.0182) | (0.244) | (0.208) | (0.582) | (0.0154) | ||
| stemp Wt | 0.0108 | 0.0149 | 0.0173 * | −0.00528 | |||
| (0.0126) | (0.0143) | (0.0103) | (0.00387) | ||||
| wtemp | −0.00319 | −0.00367 | 0.000773 | −0.00652 ** | |||
| (0.00414) | (0.00483) | (0.00647) | (0.00264) | ||||
| 2010–2019 | ino | 0.486 ** | −0.00290 | 0.121 | −0.0371 | −0.186 ** | −0.00415 |
| (0.197) | (0.0190) | (0.245) | (0.152) | (0.0759) | (0.00392) | ||
| stemp Wt | −0.00888 | −0.00320 | 0.00403 | 0.00378 *** | |||
| (0.0155) | (0.0128) | (0.00409) | (0.00102) | ||||
| wtemp | 0.0120 ** | 0.0171 *** | −0.00161 | −0.0021 *** | |||
| (0.00561) | (0.00566) | (0.00115) | (0.00042) | ||||
| 2000–2019 | ino | 0.00769 * | 0.0184 *** | 0.186 *** | 0.108 ** | −0.0503 ** | −0.00740 |
| (0.00412) | (0.00166) | (0.0696) | (0.0500) | (0.0223) | (0.00756) | ||
| stemp Wt | −0.00251 | −0.00668 * | −0.00844 *** | −0.00160 | |||
| (0.00445) | (0.00401) | (0.00118) | (0.00104) | ||||
| wtemp | 0.00399 | 0.000999 | 0.000498 | 0.00389 *** | |||
| (0.00296) | (0.00237) | (0.000924) | (0.000853) | ||||
| Sample Interval | Variables | Production | Energy Consumption | Pollution | |||
|---|---|---|---|---|---|---|---|
| Diff-GMM | Sys-GMM | Diff-GMM | Sys-GMM | Diff-GMM | Sys-GMM | ||
| 2015–2019 | ino | 1.014 * | −0.0358 | 0.0137 * | −0.00337 | 0.0131 | −0.0206 * |
| (1.181) | (0.0355) | (0.0786) | (0.0546) | (0.0602) | (0.0117) | ||
| stemp Wt | −0.00278 | 0.0103 | −0.00128 | −0.000340 | |||
| (0.0137) | (0.00646) | (0.00662) | (0.00331) | ||||
| wtemp | −0.0180 | −0.00542 | −8.57 × 10⁻⁵ | 0.00107 | |||
| (0.0118) | (0.00447) | (0.0100) | (0.00152) | ||||
| 2010–2019 | ino | 0.563 *** | 0.0882 *** | 0.0304 | 0.0838 * | −0.0961 *** | −0.00994 ** |
| (0.0976) | (0.0200) | (0.126) | (0.0745) | (0.0260) | (0.00431) | ||
| stemp Wt | −0.0270 | −0.0318 * | 0.00655 * | 0.000566 | |||
| (0.0260) | (0.0167) | (0.00362) | (0.000621) | ||||
| wtemp | 0.0504 ** | 0.0394 *** | −0.00647 *** | 2.57 × 10⁻⁵ | |||
| (0.0207) | (0.0116) | (0.00189) | (0.000346) | ||||
| 2000–2019 | ino | 0.124 *** | 0.0306 *** | −0.146 *** | −0.00251 | 0.0105 | 0.00264 |
| (0.00298) | (0.00391) | (0.0509) | (0.0266) | (0.00685) | (0.00542) | ||
| stemp Wt | 0.00104 | −0.0373 *** | 0.000712 | −0.00359 ** | |||
| (0.0123) | (0.00831) | (0.00174) | (0.00143) | ||||
| wtemp | 0.0264 *** | 0.00360 | −0.00149 | 0.00163 *** | |||
| (0.00594) | (0.00652) | (0.00151) | (0.000352) | ||||
Publisher’s Note: MDPI stays neutral with regard to jurisdictional claims in published maps and institutional affiliations. |
© 2022 by the authors. Licensee MDPI, Basel, Switzerland. This article is an open access article distributed under the terms and conditions of the Creative Commons Attribution (CC BY) license (https://creativecommons.org/licenses/by/4.0/).
Share and Cite
Li, Z.; Shen, T.; Yin, Y.; Chen, H.H. Innovation Input, Climate Change, and Energy-Environment-Growth Nexus: Evidence from OECD and Non-OECD Countries. Energies 2022, 15, 8927. https://doi.org/10.3390/en15238927
Li Z, Shen T, Yin Y, Chen HH. Innovation Input, Climate Change, and Energy-Environment-Growth Nexus: Evidence from OECD and Non-OECD Countries. Energies. 2022; 15(23):8927. https://doi.org/10.3390/en15238927
Chicago/Turabian StyleLi, Zhuohang, Tao Shen, Yifen Yin, and Hsing Hung Chen. 2022. "Innovation Input, Climate Change, and Energy-Environment-Growth Nexus: Evidence from OECD and Non-OECD Countries" Energies 15, no. 23: 8927. https://doi.org/10.3390/en15238927
APA StyleLi, Z., Shen, T., Yin, Y., & Chen, H. H. (2022). Innovation Input, Climate Change, and Energy-Environment-Growth Nexus: Evidence from OECD and Non-OECD Countries. Energies, 15(23), 8927. https://doi.org/10.3390/en15238927