Article

Optimization of Energy Production from Two-Stage Mesophilic–Thermophilic Anaerobic Digestion of Cheese Whey Using a Response Surface Methodology Approach

by
Andrey A. Kovalev
1,2,*,
Elza R. Mikheeva
1,
Vladimir Panchenko
3,
Inna V. Katraeva
1,4,
Dmitriy A. Kovalev
2,
Elena A. Zhuravleva
5 and
Yuriy V. Litti
5
1
Federal State Autonomous Educational Institution of Higher Education, Lobachevsky State University of Nizhny Novgorod, Gagarin Ave., Nizhny Novgorod 603950, Russia
2
Federal State Budgetary Scientific Institution “Federal Scientific Agroengineering Center VIM”, 1st Institutskiy proezd, 5, Moscow 109428, Russia
3
Department of Theoretical and Applied Mechanics, Russian University of Transport, Moscow 127994, Russia
4
Federal State Budgetary Educational Institution of Higher Education, Nizhny Novgorod State University of Architecture and Civil Engineering, St. Ilyinskaya, 65, Nizhny Novgorod 603950, Russia
5
Federal Research Center “Fundamentals of Biotechnology” of the Russian Academy of Sciences, Leninsky Prospekt, 33, 2, Moscow 119071, Russia
*
Author to whom correspondence should be addressed.
Energies 2022, 15(23), 8928; https://doi.org/10.3390/en15238928
Submission received: 1 November 2022 / Revised: 17 November 2022 / Accepted: 21 November 2022 / Published: 25 November 2022

Abstract

:
Spatial separation into acidogenic and methanogenic stages is considered a viable option to ensure process stability, energy efficiency and the better control of key anaerobic digestion (AD) parameters. The elucidation of the optimal modes of two-stage AD for the maximization of the recovery of biofuels (H2 and CH4) is still an urgent task, the main optimization criteria being the highest energy yield (EY) and energy production rate (EPR). In this work, a response surface methodology was used for an optimization of energy production from the two-stage mesophilic–thermophilic AD of cheese whey (CW). Three dilution rates of CW, providing values of 10.9, 14.53 and 21.8 g for the chemical oxygen demand (COD)/L in the influent and three hydraulic retention times (HRTs) (1, 2 and 3 days) in methanogenic biofilters at a constant HRT in an acidogenic biofilter of 0.42 days, were tested to optimize the EY and EPR. The desirability approach produced combined optimum conditions as follows: the dilution rate of the CW provided 17.58 g COD/L (corresponding to OLR of 6.5 g COD/(L·day)) in the influent and a HRT in the methanogenic biofilter of 2.28 days, both of which provided a maximum EPR of 80.263 kJ/(L·day) and EY of 9.56 kJ/g COD, with an overall desirability value of 0.883.

1. Introduction

The dairy industry has experienced tremendous growth in recent years in many countries, as the demand for meat, milk and dairy products is growing steadily. Dairy processing is usually considered the largest industrial food wastewater source [1]. Dairy effluents are distinguished by their relatively high temperature, high organic content and wide pH range [2]. Around the world, approximately 4–11 million tons of dairy processing by-products is discharged into the environment every year, which poses a serious threat to biodiversity and requires the administration of special treatments to eliminate or reduce environmental damage [3].
Cheese whey (CW) is considered the main by-product of dairy processing. The production of cottage cheese and cheese is a large-capacity mature technological process, the demand for which among the population is increasing. CW contains approximately 93–94% water, lactose, soluble proteins and minerals, lactic acid and lipids, with an average chemical oxygen demand (COD) value in the range of 50,000–102,000 mg/L. In the production of 1 kg of cheese, 7–8 kg of CW is formed [4]. The world production of CW is estimated at approximately 157 million tons [5].
The best way to manage dairy processing is to create waste-free technologies for the production of cheese, cottage cheese and casein [6]. However, traditionally, CW has been considered waste and disposed of in the cheapest possible way, such as being fed to animals, sprayed on the ground or treated as wastewater [7]. The discharge of CW today is unacceptable, due to the realization of its strong polluting impact on ecosystems; therefore, technologies that involve the proper disposal of CW are taken more seriously [5]. Anaerobic digestion (AD) is a common technology for the treatment of high-strength wastewater. CW typically has a pH in the range of 3.0–6.5 [8,9] and is often challenging to process in its native form in conventional AD [10,11] as methanogenic archaea are very sensitive to low pH [12]. It is known that the use of two-stage AD with a spatial separation of acidogenesis and methanogenesis creates more optimal conditions for the respective microbial communities and improves energy recovery [13,14,15]. At the first stage, biohydrogen is produced as a result of acidogenesis in the process of dark fermentation (DF). Various feedstocks rich in simple sugars [16], starch [17] and cellulose [18] can be used for dark fermentative hydrogen production. The resulting effluent from the DF reactor is then fed into a methanogenic reactor to produce methane-rich biogas. The mixture of biogas from acidogenic and methanogenic reactors is called biohythane. Biohythane is gaining considerable attention as a valuable fuel for vehicles. It is reported that burning biohythane in internal combustion engines could reduce the release of NOx into the atmosphere, with a comparable energy efficiency to compressed natural gas (CNG) [19]. The use of biohythane is beneficial due to being relatively inexpensive, not requiring a specific storage system and allowing for an alternative to CNG engines, changing infrastructures. Biohythane is significantly advantageous over CNG in terms of its high flammability range due to the presence of H2, which has a seven-fold higher flame speed than CH4. Moreover, it is environmentally friendly, with its use resulting in reduced greenhouse gas emissions into the atmosphere as H2 replaces and reduces CO2 in a mixture of gaseous products. However, from a scaling-up point of view, two-stage AD plants correspond to only <1% of full-scale AD plants at present [20].
There are several factors influencing the continuous one- and two-stage AD process, viz. pH [21], temperature [22], reactor configuration [23], the organic loading rate (OLR), hydraulic retention time (HRT), COD dilution rate, etc. [24]. Venetsaneas et al. used alternative pH-controlling approaches to optimize hydrogen production in a two-stage mesophilic AD of CW. The addition of alkali (NaHCO3) was found to be a better approach than an automatic pH control in terms of H2 production rates and yields [25]. The OLR-based optimization of the two-stage mesophilic AD of cheese permeate was performed by Kisielewska et al. At a constant HRT in a DF reactor of 24 h and OLRs of 20, 25, 30 and 35 kg COD/(m3·day), the highest hydrogen production was obtained at an OLR of 30 kg COD/(m3·day). For the methanogenic stage at a constant HRT of 3 days, the optimal OLR in terms of a maximum methane production rate and yield was 6.9 kg COD/(m3·day) [26]. The HRT is one of the most important parameters governing the activity of the hydrogen-producing and methanogenic microbial community. The HRT can affect the metabolic pathway of microorganisms, as well as the composition of subdominant microorganisms [11,27]. Moreover, the composition of soluble metabolite products and the yield of gaseous products (H2 and CH4) can be controlled by changing the HRT [28]. At n HRT in an acidogenic continuously stirred tank reactor of 24 h, the optimal HRT for a methanogenic periodic anaerobic baffled reactor was found to be 4.4 days, at which the highest hydrogen and methane production from CW was obtained [29].
Thus, there is a large scatter in the optimal values of factors affecting the two-stage AD of CW, such as the HRT and OLR. This can be explained through the differences in the temperature modes of AD stages, the design features of the reactors and the characteristics of CW (pH, indigenous microbial community, etc.). Therefore, the elucidation of the optimal modes of two-stage AD of CW for maximizing the recovery of biohythane is still an urgent task, the main optimization criteria being the highest energy yield (EY) and energy production rate (EPR). Various methods, such as the Taguchi fractional design method or response surface methodology (RSM), can be applied to more precisely optimize the operation parameters of one-stage [30,31,32] and two-stage [33] AD. In this work, we aimed to study, for the first time, the effect of the HRT, OLR and COD dilution rate on energy production in the mesophilic–thermophilic two-stage AD of native CW and the RSM-based optimization of energy production.

2. Materials and Methods

2.1. Substrate and Inoculum

Cheese whey (CW) was collected at a cottage cheese production enterprise (JSC “Gorodets dairy plant” Nizhny Novgorod region, Russia). CW (pH 4.64; TS 10.58%; VS 92.9% TS, COD 109 g/L) was stored in a refrigerator at 4 °C before use. The pH of the CW was adjusted to a pH of 11.0 with 2 M NaOH before being fed into the reactor. CW was not pretreated; therefore, together with the CW, the indigenous microflora was introduced into the reactor.
For the dark fermentation reactor (RH) (the first stage of AD), the effluent from a mesophilic dark fermentation reactor fed with cheese whey from another enterprise was used as an inoculum [34]. Methanogens were inactivated using heat shock (100 °C for 30 min).
The effluent from a thermophilic methanogenic reactor fed with a simulated organic fraction of municipal solid waste was used as inoculum for the methanogenic reactors (R1-3) (the second stage of AD).

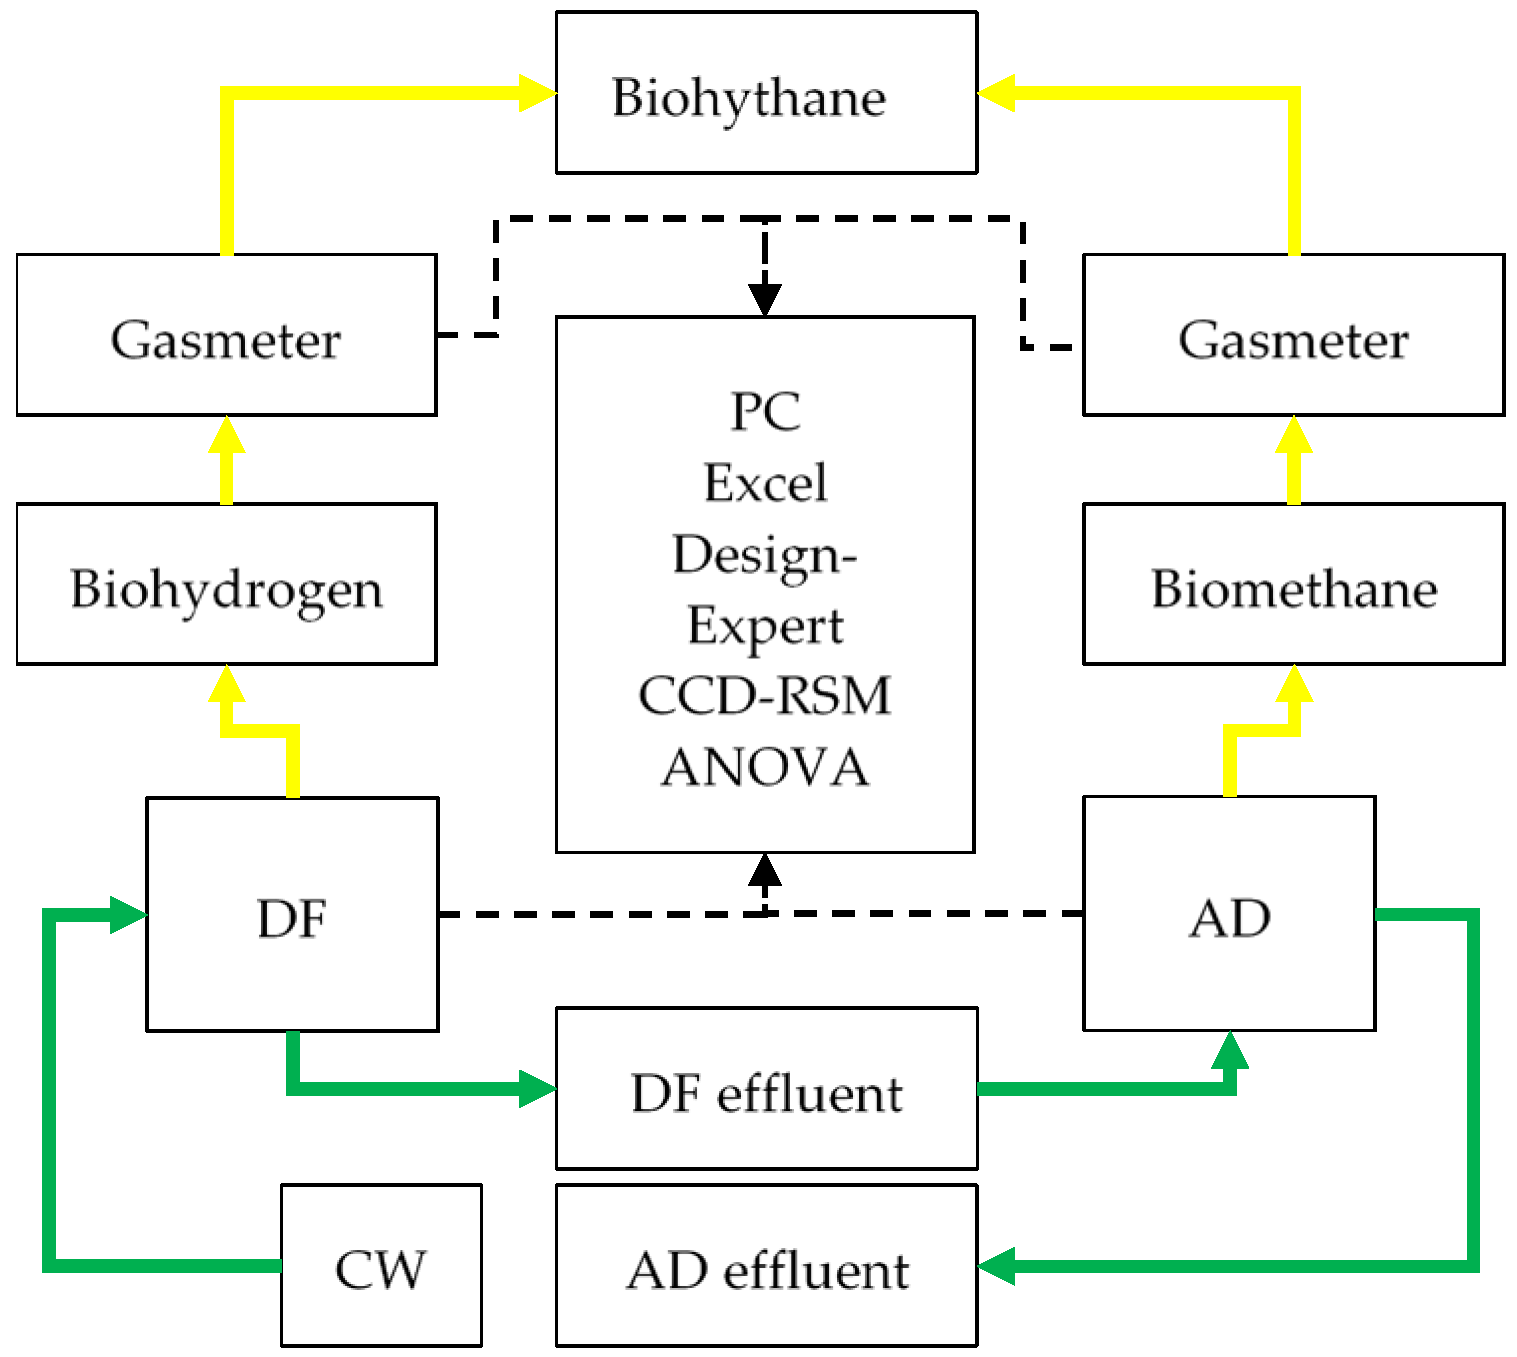
2.2. Description of the Laboratory Setup

To study the effect of the OLR on energy production during the mesophilic–thermophilic two-stage AD of CW, an automated laboratory setup was used, consisting of four identical 900 mL biofilters fabricated from polypropylene with an upward liquid flow rate of 3 m/h. Since the immobilization of anaerobic sludge can significantly improve the process at high organic loads (high OLRs and short HRTs) [35], pieces of polyurethane foam 0.9 × 0.9 × 0.9 cm in size were used as the carrier material [36,37], the total volume of which was 260 mL in each reactor.
Figure 1 shows a flowchart for optimizing the energy production during the mesophilic–thermophilic two-stage AD of CW.

2.3. Operation of the Laboratory Setup: Dark Fermentation (DF) and Anaerobic Digestion (AD)

The operation of a laboratory setup for the continuous two-stage AD of CW was divided into a start-up and three experimental periods (Table 1). The CW after proper dilution was fed into the DF reactor operated at a HRT of 0.42 days. The resulting effluent was then fed into three methanogenic reactors operated at different HRTs (3, 2 and 1 days), according to Table 1. Obtained hydrogen and methane were converted into energy equivalents. The total energy recovery after two stages of AD to produce biohythane was calculated, taking into account the calorific value of hydrogen (142 MJ/kg) and methane (55.5 MJ/kg). The calculated energy production rate (EPR, kJ/(L·day)) and energy yield (EY, kJ/g COD) were determined in accordance with [9]. The OLR was determined with the value of the COD of the diluted CW and HRT in accordance with Equation (1):
OLR = COD HRT   ,
The OLR values calculated using Equation (1) are shown in Figure 2, and the dilution rate (DR) and HRT values corresponding to the calculated OLR are given in Table 2.

2.4. Analytical Methods

The total solid (TS) content was determined through drying to a constant weight, and the volatile solid (VS) content was determined as the difference between the TS and the amount of nonvolatile solids formed after the sample was burned at 600 °C. For this, analytical balances Vibra HT 224 RCE with a readability and repeatability of 0.1 mg were used.
The amount of biogas was measured with MilliGascupper gas meters (Ritter, Bochum, Germany) Ritter MGC-1 V3. 3 PMMA with a measuring chamber volume of 3.2 mL. The determination of the amount of H2, CO2 and CH4 in the biogas was carried out with gas chromatography (Shimadzu GC-2010) as described earlier [35]. The absolute error of the chromatograph did not exceed 10%. The chemical oxygen demand (COD) was determined with the dichromate method.

2.5. Design of Experiment Using RSM

The energy yield and energy production rate in the AD systems are closely related to technological factors. The HRT and dilution rate (or COD dilution rate) are the main factors for maximum energy recovery from the AD of CW and should be optimized. The current study focused on the optimization of the HRT and dilution rate (DR) as independent variables, whereas the energy yield (EY) and energy production rate (EPR) were chosen as the dependent variables. To perform the optimization based on the central composite design (CCD), the DesignExpert program was used. This method involves only a few operations to optimize the response variable and provides an easy way to study the interactions between several parameters. In addition, the regression model was validated using a regression analysis with a 95% confidence probability using DesignExpert software.
The CCD with two level-two factors was selected to optimize the EY and EPR and consisted of 9 runs. The design was mainly based on an OLR ranging from 3.18 to 15.55 g COD/(L·day), with concurrently different DRs and HRTs. Table 3 shows the minimum and maximum values for the DR and HRT to design the OLR ratios through CCD-RSM.
Interactions between independent variables and their effective relationships with responses were analyzed by performing an ANOVA to check the model adequacy. The optimized parameters for obtaining the maximum EPR and EY were determined using two-dimensional and three-dimensional plotting, conducted on DesignExpert 13.0 [38].

3. Results

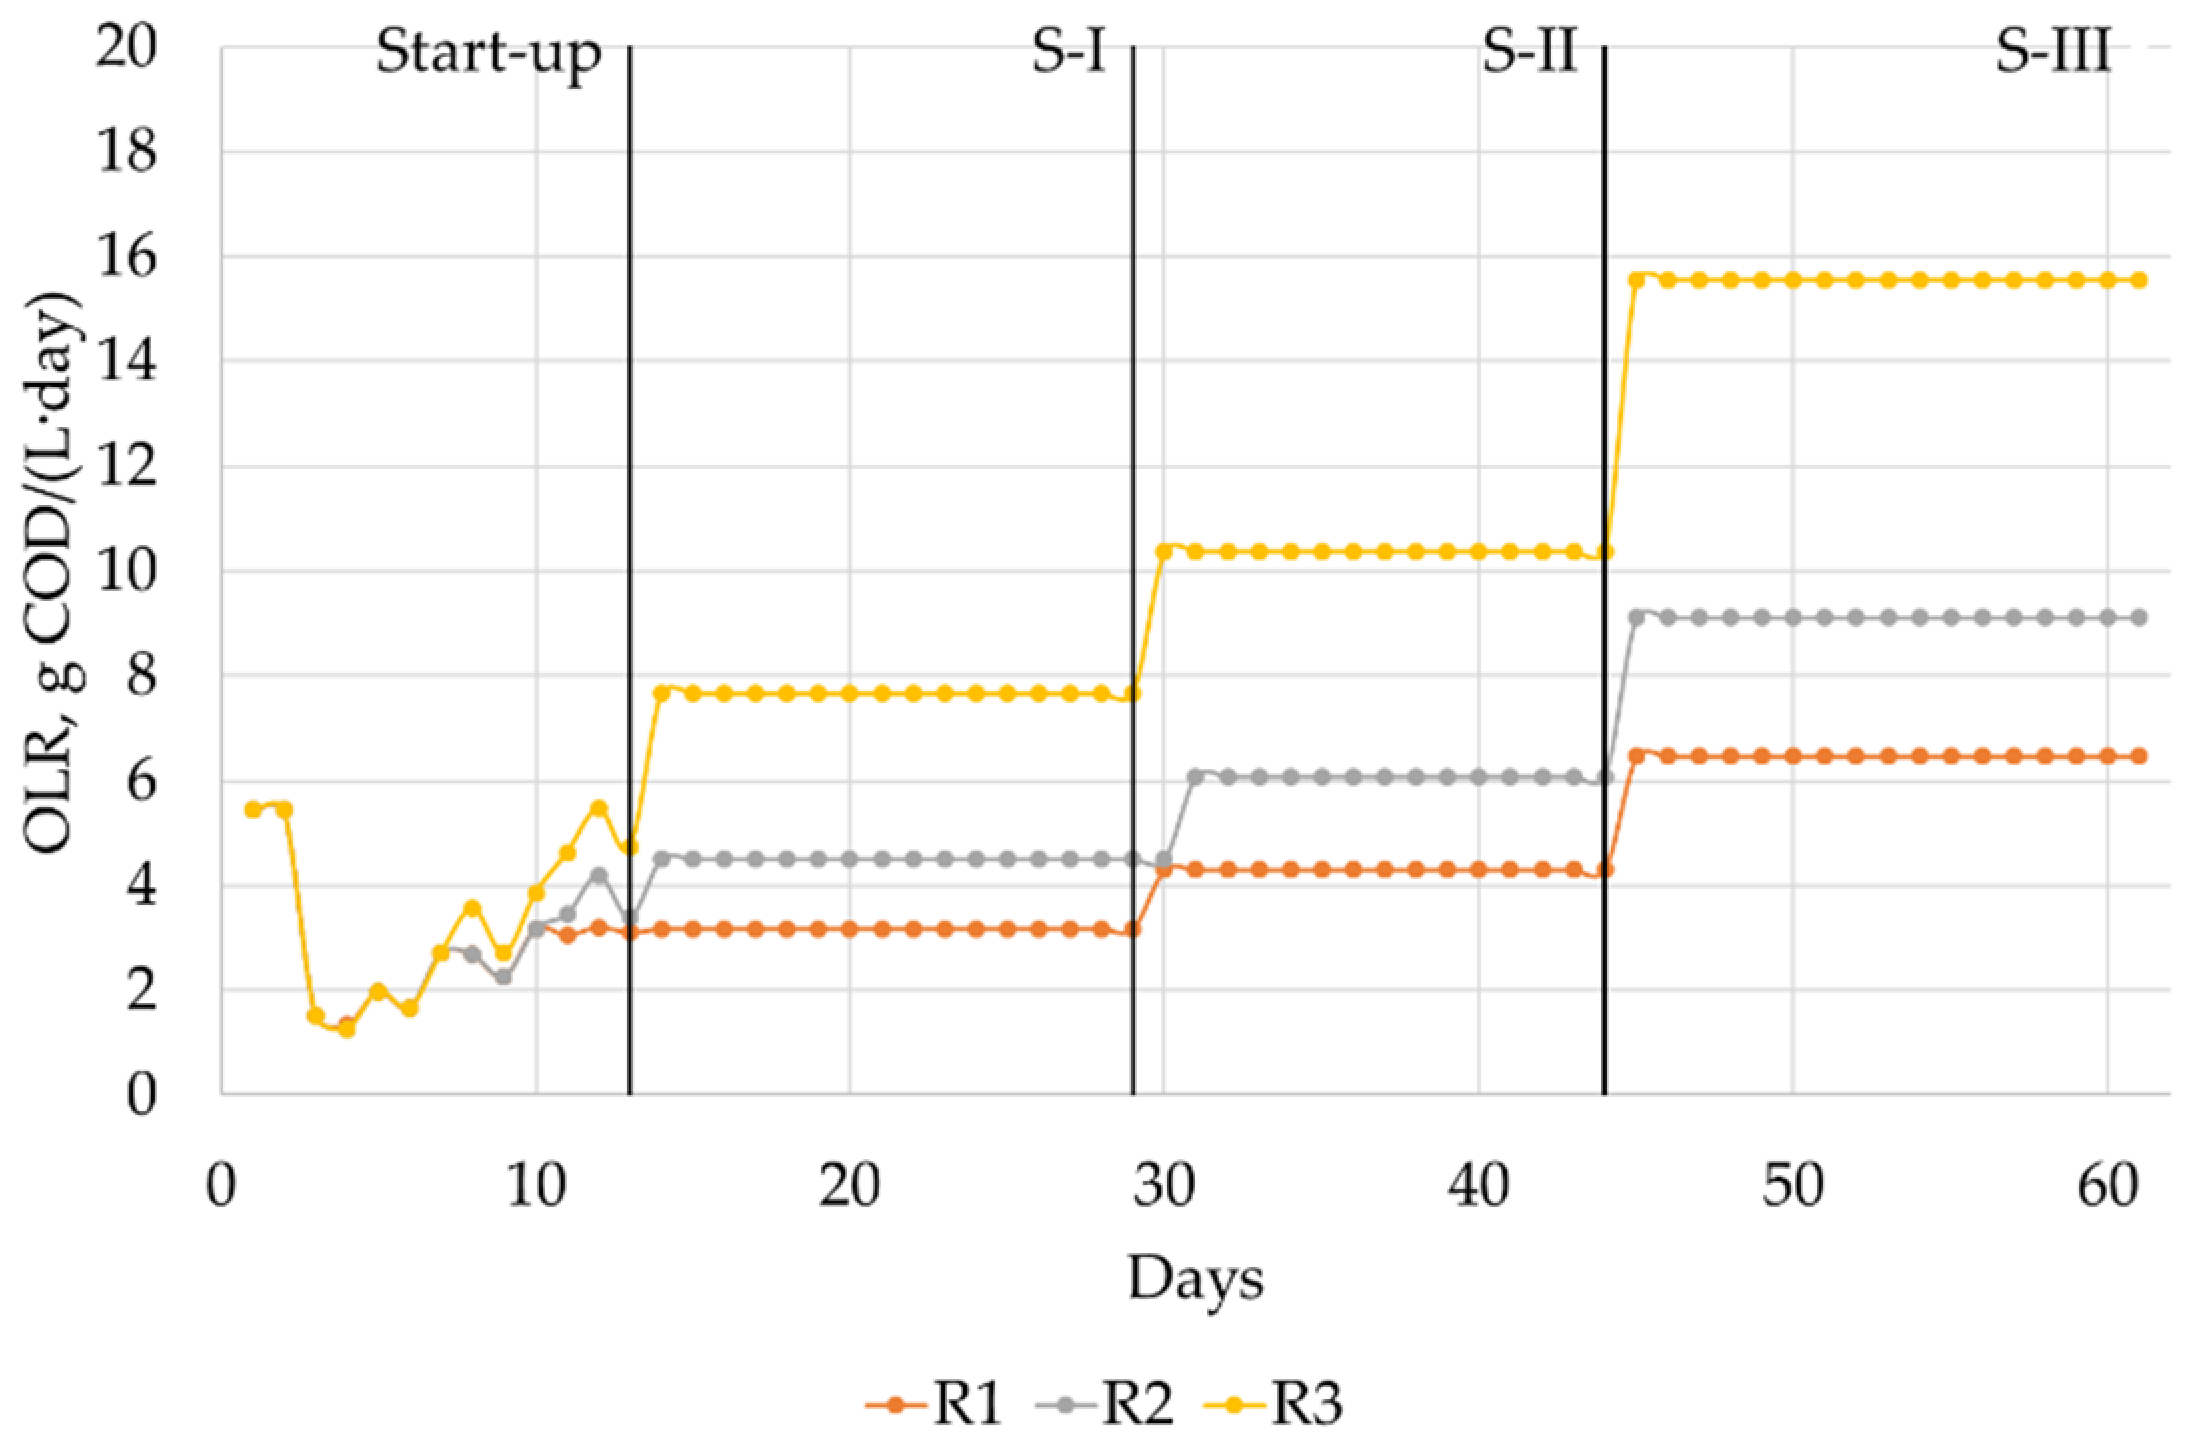
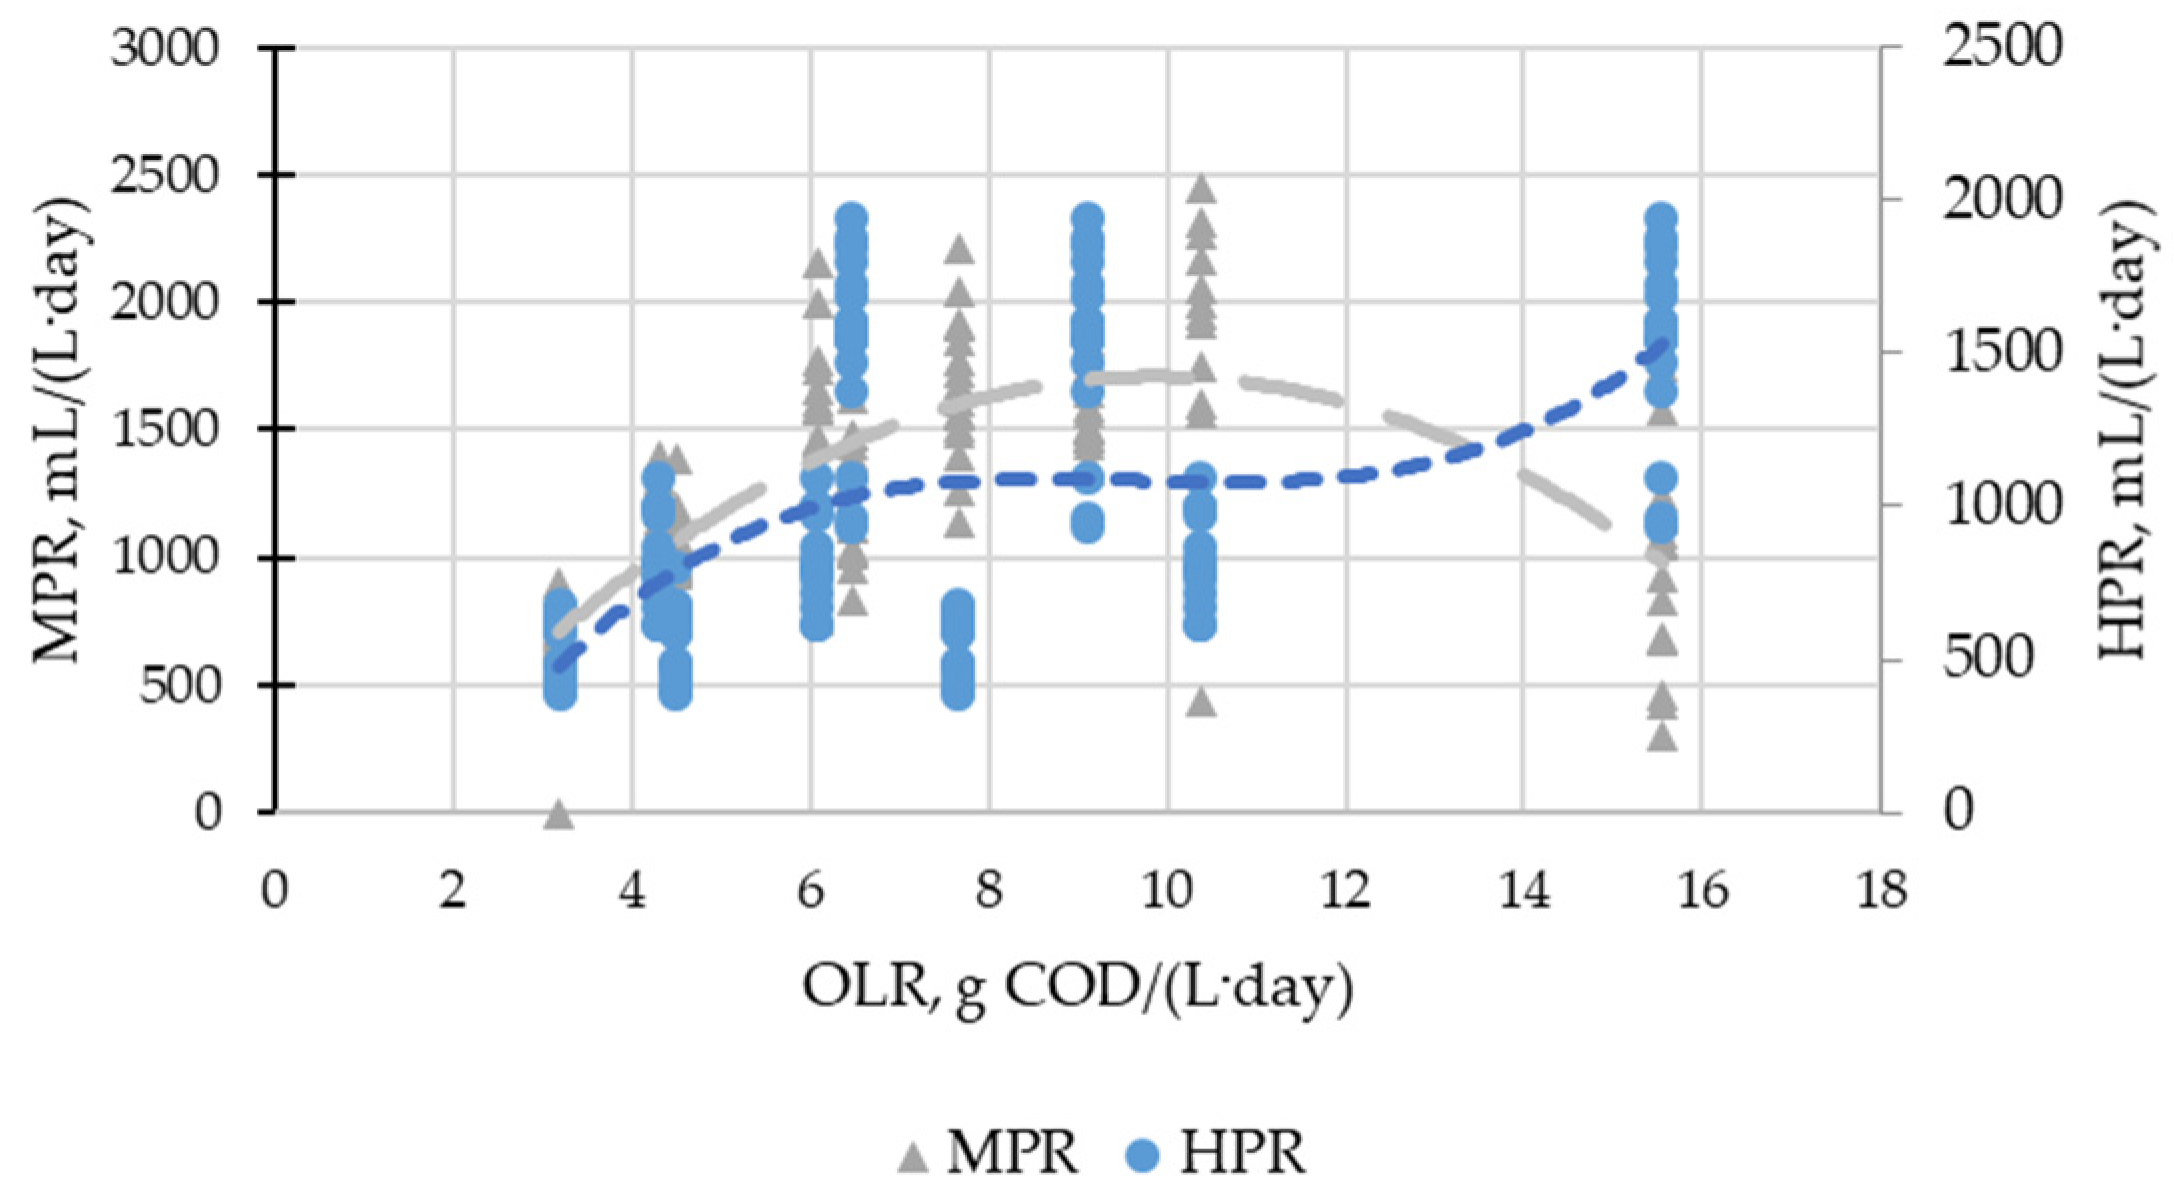
3.1. Biogas Production

Figure 3 shows the yields of methane and hydrogen depending on the OLR, and Figure 4 shows their volumetric production rates.
The obtained values were further recalculated, taking into account the calorific value for each of the obtained biogases, which is shown in Section 3.2.

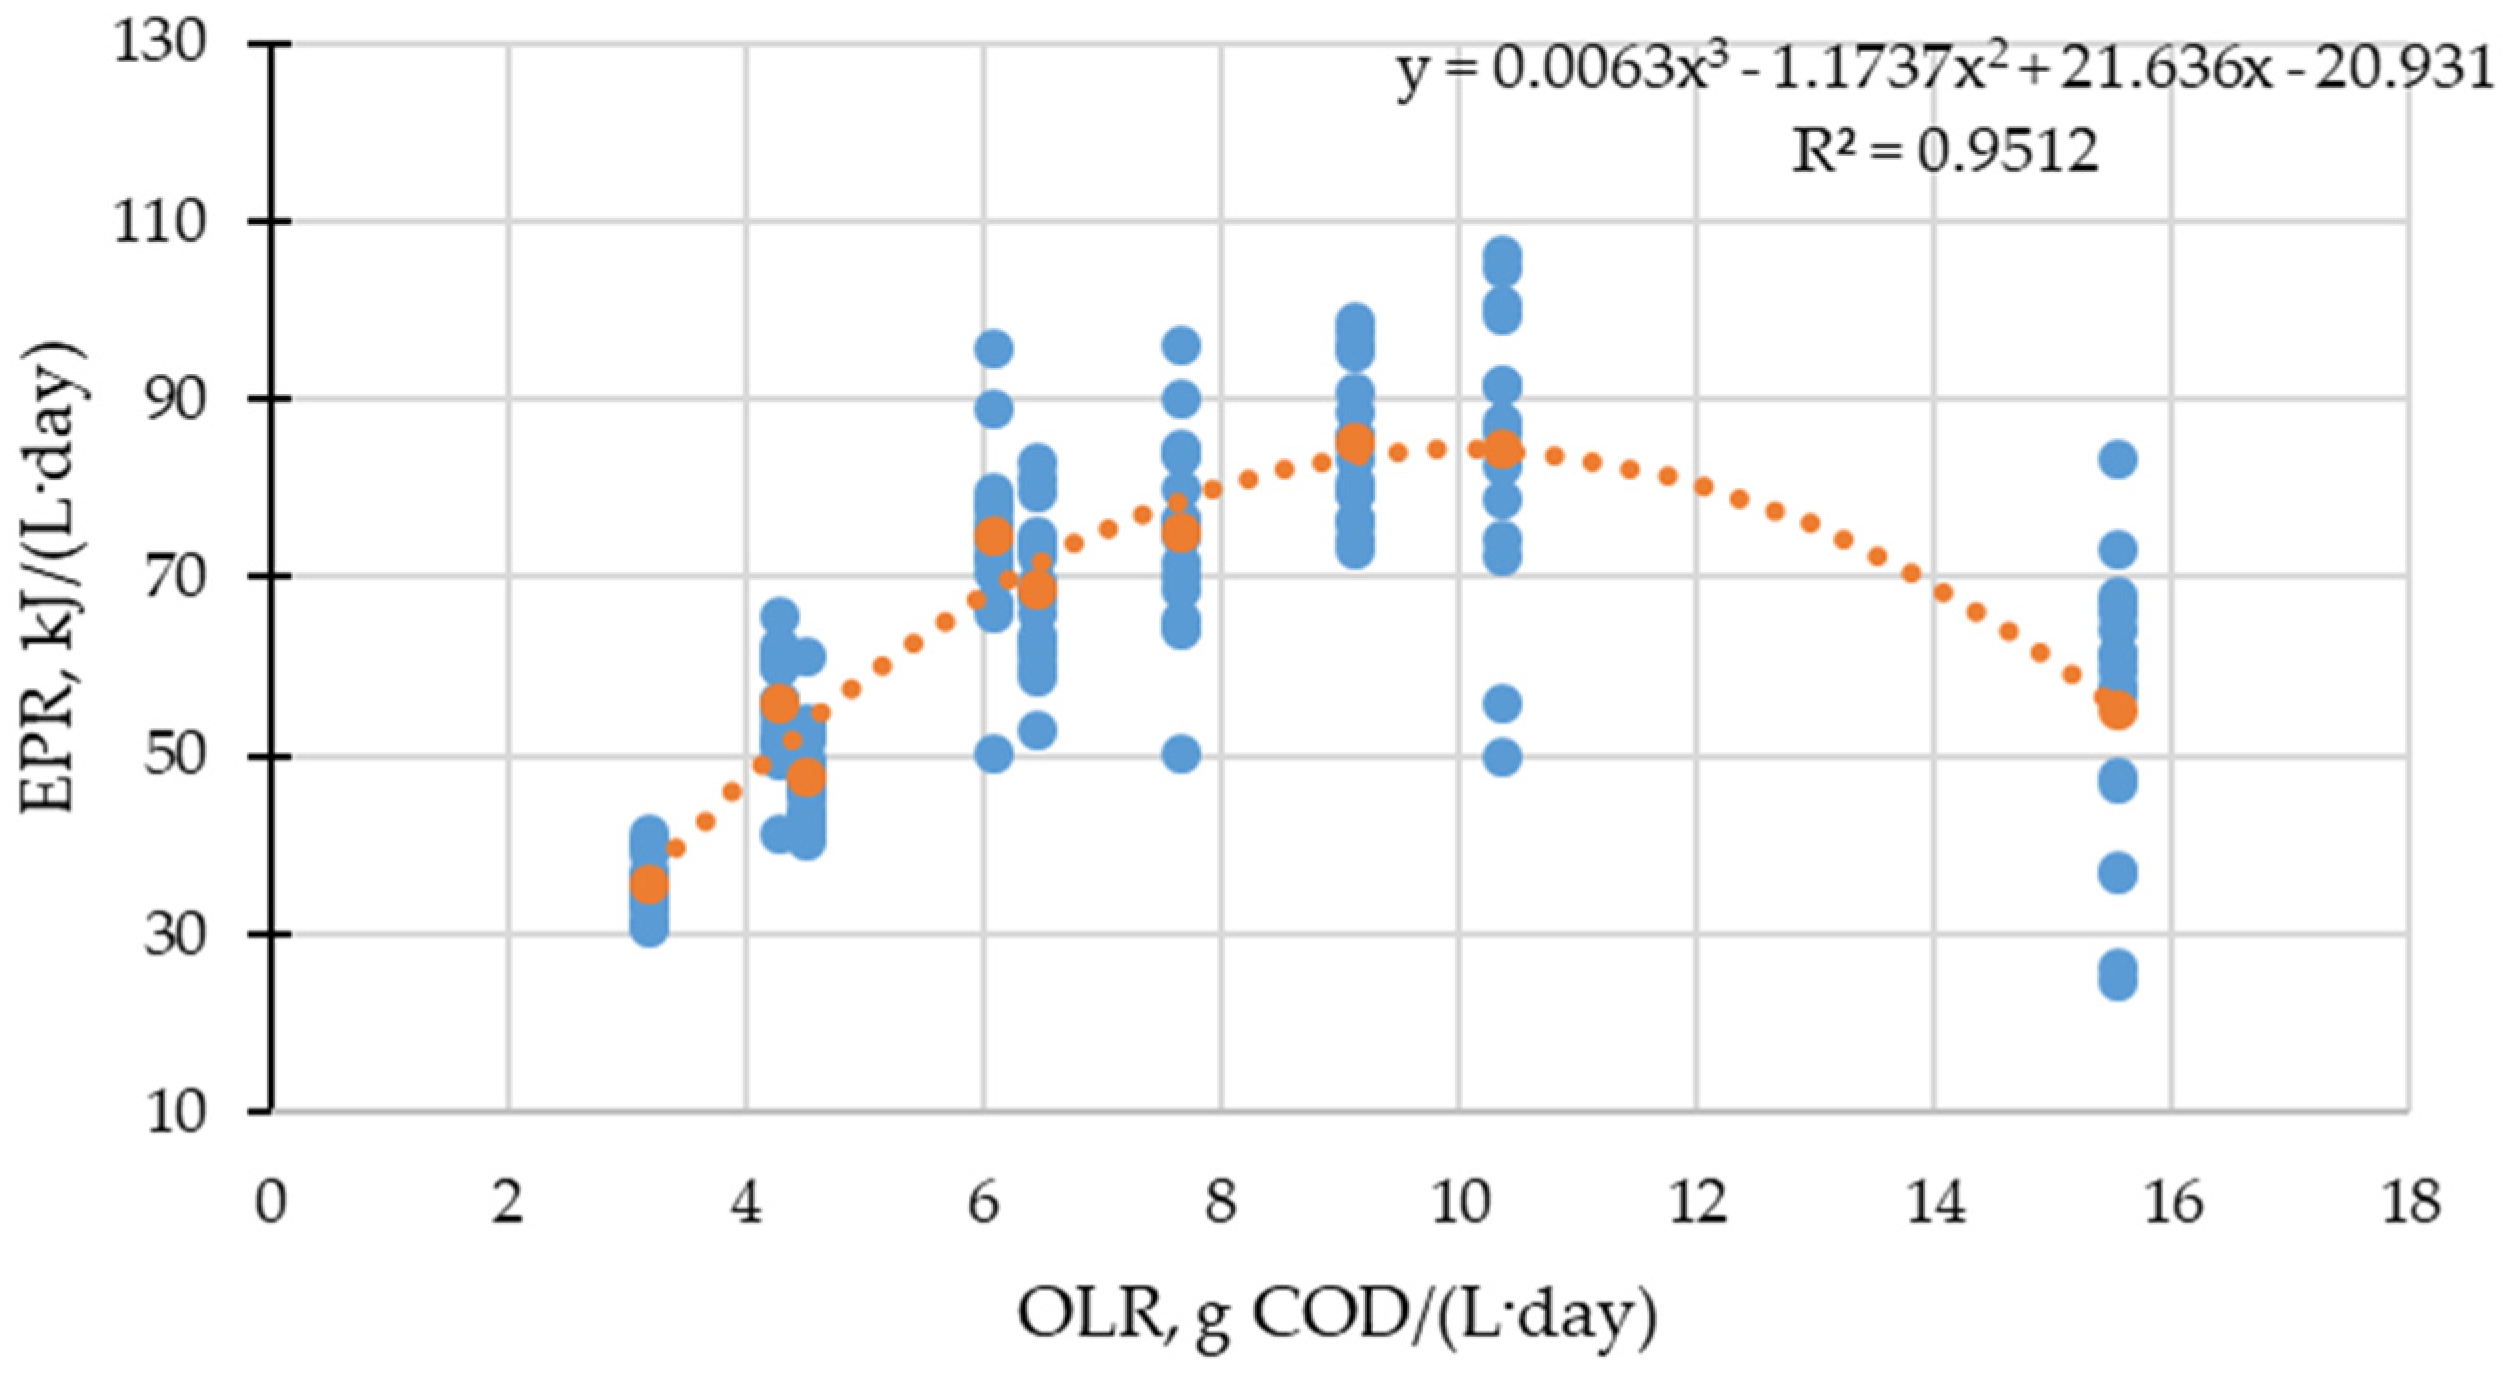
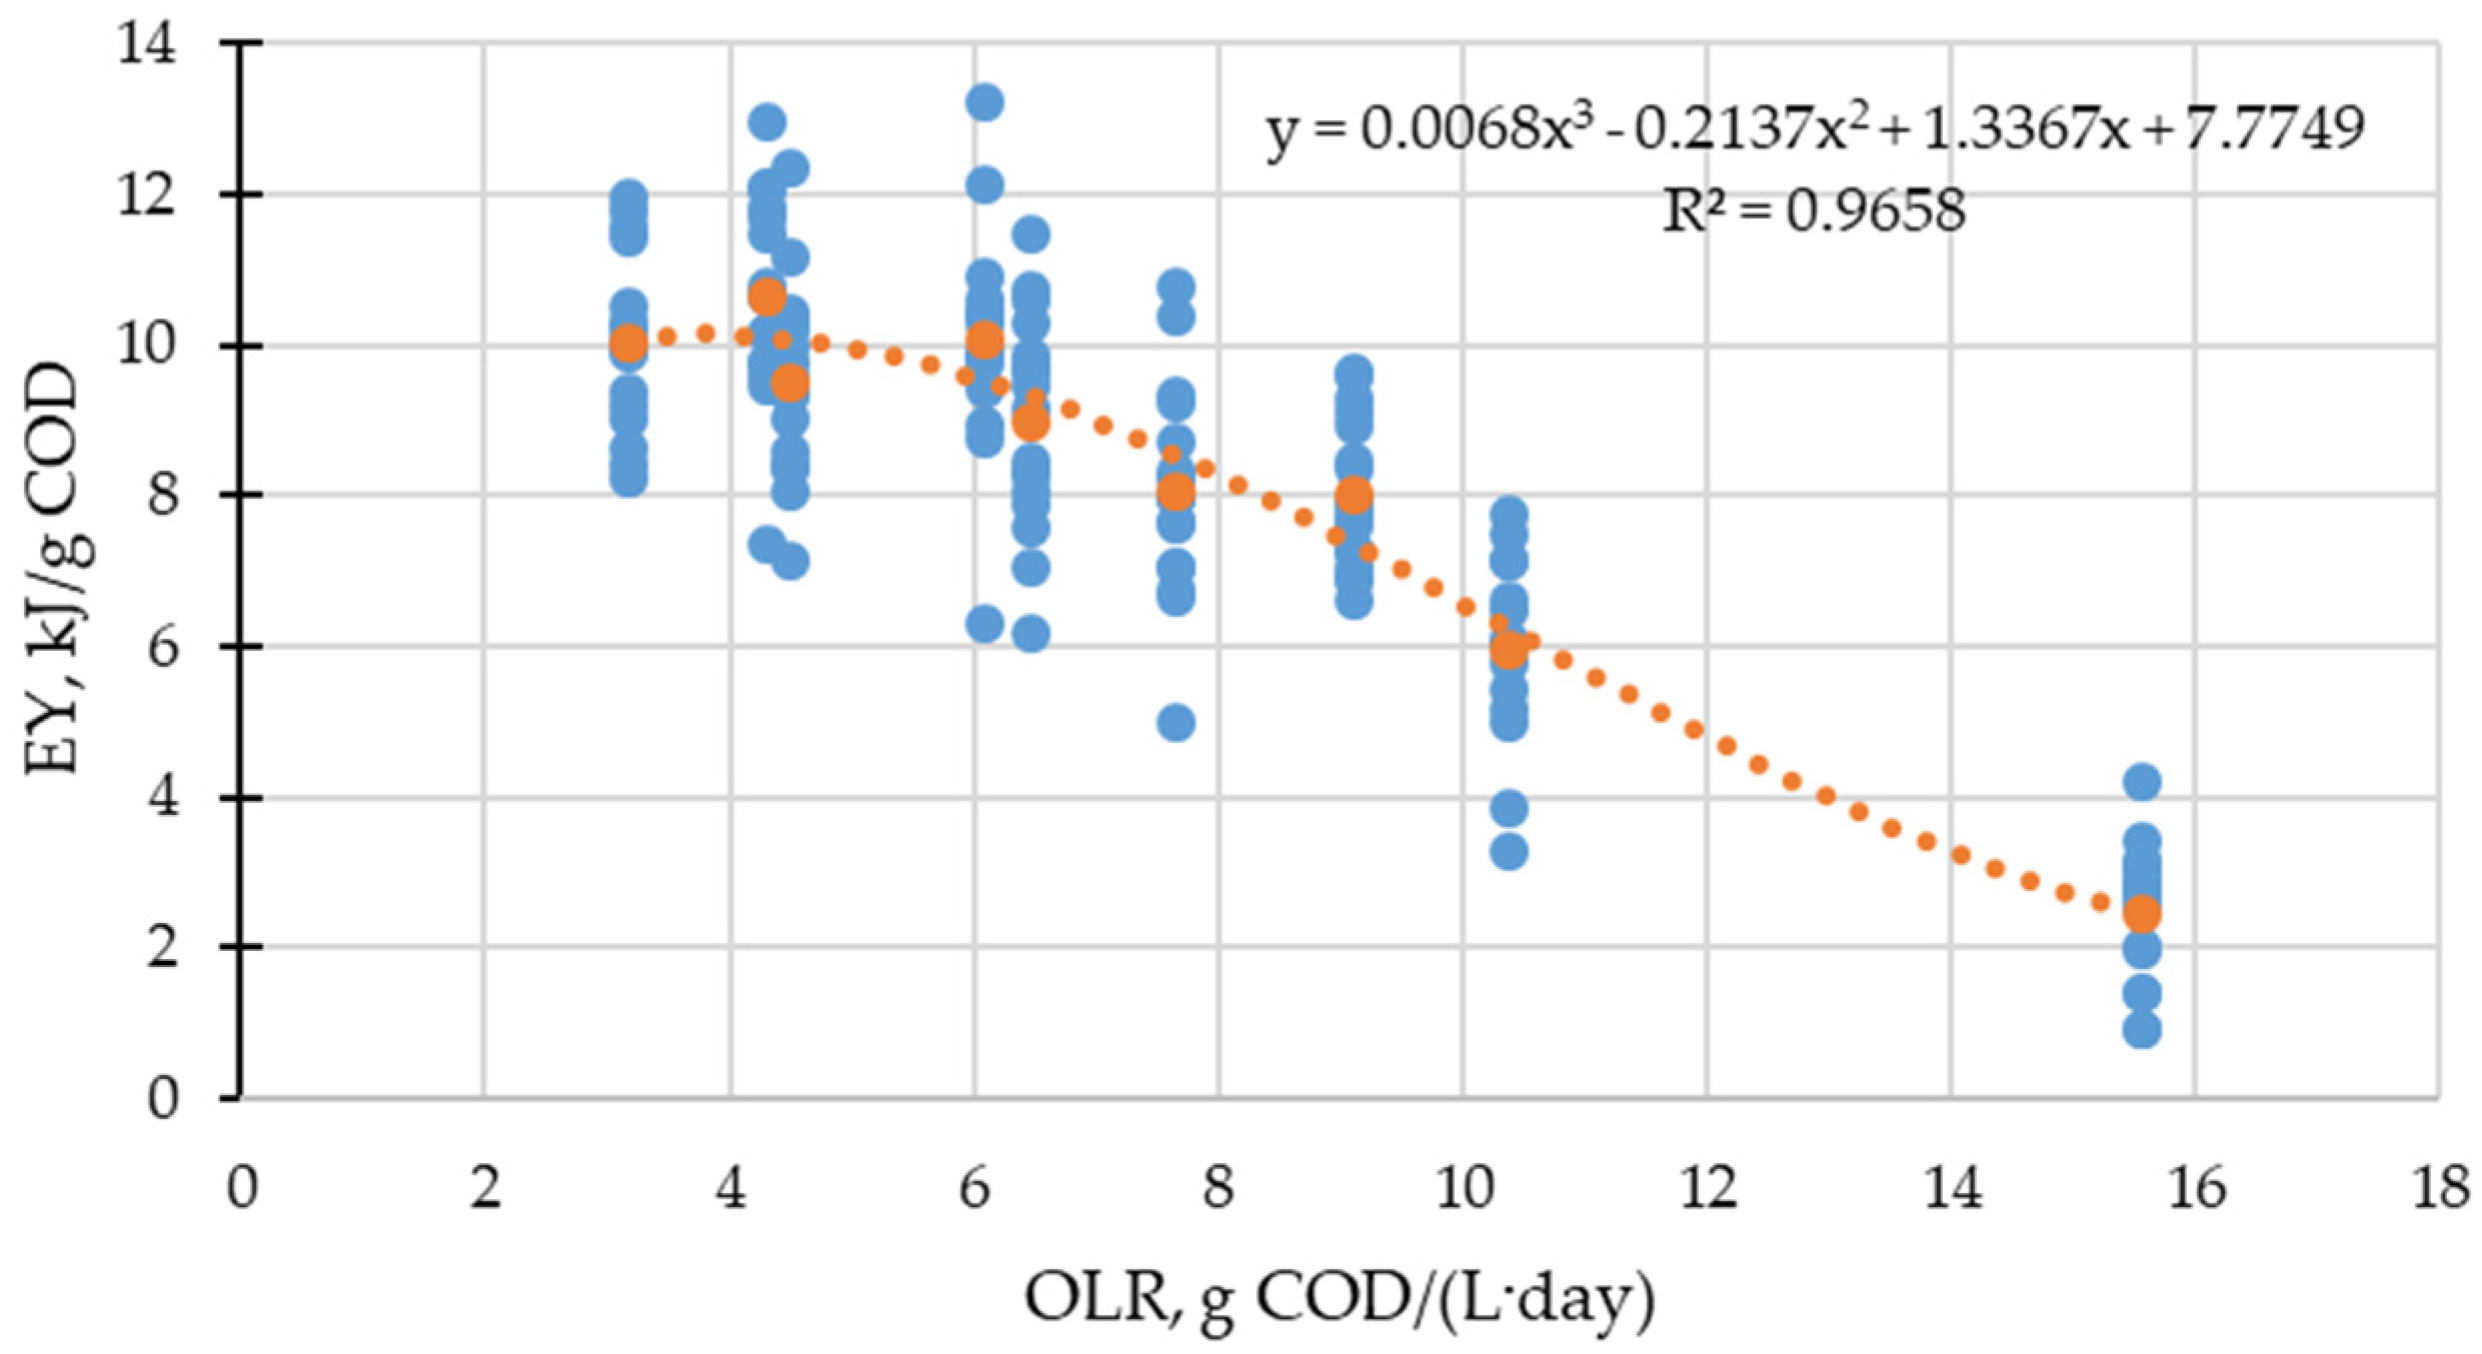
3.2. Energy Recovery

The EPR and EY during the mesophilic–thermophilic two-stage anaerobic digestion of CW is shown in Figure 5 and in Figure 6, respectively. The total energy recovery was calculated from the respective biofuel recovery (H2 and CH4) and their conversion to energy equivalents. At the stage of the dark fermentation (HRT of 0.42 days), the maximum hydrogen yield was 36.86 mL/g COD (the corresponding hydrogen content in the biogas was 37% vol.) and the hydrogen production rate was 1938 mL/(L·day) (the corresponding hydrogen content in the biogas was 33% vol.), which were obtained at a DR of five. For the second (methanogenic) stage, the maximum methane yield was 325 mL/g COD (the corresponding methane content in the biogas was 77% vol.), which was obtained at a HRT of 2 days and a DR of 7.5. The maximum methane production rate was 2453 mL/(L·day) (the corresponding methane content in the biogas was 77 vol%), which was obtained at a HRT of 1 day and a DR of 7.5.
The mean values of the EPR and EY that were used for the optimization using the RSM were highest at an OLR of 9.12 g COD/(L·day) and 4.3 g COD/(L·day) for the EPR (85.14 kJ/(L·day)) and EY (10.66 kJ/g COD), respectively.

3.3. Optimization of Energy Recovery of a Two-Stage AD of CW Using RSM

Table 4 shows the complete experimental design matrix built in DesignExpert and the responses obtained during the experiment and mathematical processing of the experimental data. Figure 7 and Figure 8 show the EPR and EY as the responses, with HRT and DR as independent variables.
Figure 7 shows the response surface for the EPR with various combinations of HRT and DR. The figure shows that the obtained response surface for the EPR was a crest surface.
Table 5 and Table 6 show the ANOVA results of the design for the EPR and EY, respectively.
Table 5 shows that the model was significant, because the model F-value was 338.28. There was a 4.18% chance that an F-value this large could occur due to noise. A, B, AB, A2 and AB2 were significant model terms due to their p-values of less than 0.0500. The determination coefficient R2 was 0.9996. The difference between the predicted R2 of 0.9231 and the adjusted R2 of 0.9966 was less than 0.2, so they were in reasonable agreement.
Table 6 shows that the model was significant, because the model F-value was 24.80. There was a 1.21% chance that an F-value this large could occur due to noise. A, B, AB and B2 were significant model terms due to their p-values of less than 0.0500. A2 was not a significant model term due to its p-value of more than 0.1000. The determination coefficient R2 was 0.9764. The difference between the predicted R2 of 0.7177 was not as close to the adjusted R2 of 0.9370.
Figure 8 shows the response surface plots for the EY with various combinations of HRTs and DRs. The figure shows that the obtained response surface for the EPR was a crest surface.
For both models, factor coding was coded and the sum of squares was type III—partial.
Figure 7e and Figure 8e show the predicted vs. actual EPRs and EYs, respectively. The plots show that there were no abnormalities in the experimentation work; therefore, the model was successful in predicting both the EPR and EY.
To perform the multiobjective optimization, all responses were considered simultaneously; the RSM used the desirability analysis, which allowed for the optimization of more than one response. In this case, the objective function was the geometric mean of all responses, while the parameter closest to one was considered the optimal condition. In this experimental study, the optimization of the input parameters in the form of the HRT and DR was evaluated as the EPR maximization and EY maximization. The ramp plot is given in Figure 9.
The mathematical models for the EPR and EY were given in Equations (2) and (3), respectively:
EPR = 0 · HRT 3 + 0 · DR 3 + 15.36 · DR · HRT 2 + 5.96 · DR 2 · HRT 7.34 · HRT 2 9.09 · DR 2 13.24 · HRT · DR 12.43 · HRT 18.69 · DR + 75.22
EY = 1.50883 · HRT 2 0.167253 · DR 2 0.452 · HRT · DR + + 11.6295 · HRT + 3.95333 · DR 20.79078
As can be seen from Equation (2), the model for the EPR had aliased cubic coefficients for variables; however, when compared with a quadratic model, the cubic model had better coefficients of determination.

4. Discussion

4.1. Energy Recovery

According to the obtained trend lines (cubic polynomial) shown in Figure 5 and Figure 6, the highest values of the EPR (85.14 kJ/(L·day) and EY (10.66 kJ/g COD) were obtained at OLRs of 9.12 g COD/(L·day) and 4.3 g COD/(L·day), respectively. For comparison, Kumari and Das obtained a maximum energy recovery of 8.97 kJ/g COD (approximately 61% of the energy potential of the introduced substrate (14.7 kJ/g COD)) from the two-stage AD of sugarcane bagasse and water hyacinth [39].

4.2. Two-Stage AD Energy Recovery Optimization Using RSM

In this experimental investigation, the optimization of input parameters in the form of the HRT and DR was evaluated as the EPR and EY maximization. The ramp plot given in Figure 9 shows the predicted output responses were achieved at optimum input values, which were a DR of 6.2 and a HRT of 2.28 days at a desirability value of 0.883.
In general, the trend of the obtained model was consistent with the data obtained by other authors. The effect of two operating parameters, the pH and HRT, on the hydrogen yield and microbial community structure was evaluated by Silva-Illanes et al. It was found that the hydrogen yield and productivity were mainly influenced by the HRT with an observed optimum at a pH of 5.5 and HRT of 12 h [40]. The effect of the HRT (2–10 days) on biohythane production via single-stage anaerobic fermentation in a two-compartment bioreactor was studied by Vo et al. A HRT of 2 days resulted in (1) the maximum removal of COD and biopolymers; (2) peak hydrogen and methane production rates of 714 and 254 mL/(L·day), respectively; and (3) hydrogen contents of 8.6% and methane of 48.0% in the produced biohythane [41]. The authors [42] showed that increasing the concentration and the duration of the pretreatment increased the yield of biogas and, hence, the energy recovery. Ibrahim et al. showed a similar trend in obtaining biogas from cassava vinasse from a bioethanol distillery through mathematical modelling and parametric optimization of biomethane production with RSM. The optimum conditions established for biomethane production were 55% cassava vinasse, a 10% OLR, 30% inoculum to substrate percentage and 20 days of HRT with a methane yield of 254.4 mL/g VS [43]. Table 7 shows the comparison of energy recovery in this study and in various AD systems.
Ghimire et al. showed, on a batch scale, that a mesophilic DF resulted in a higher hydrogen yield of 53.5 mL H2/g VSadded compared to a thermophilic DF (37.6 mL H2/g VSadded). However, higher methane yields, i.e., 307.5 mL CH4/g VS, were obtained from the thermophilic AD compared to the mesophilic AD (276.5 mL CH4/g VS). Therefore, the total energy recovery from the thermophilic DF + AD was higher (11.4 MJ/kg VS) than from the mesophilic (10.4 MJ/kg VS) [49].

5. Conclusions

An experimental investigation on energy production through the two-stage anaerobic digestion of cheese whey was carried out, employing a RSM-based optimization approach. The conclusions obtained from the analysis were as follows:
  • For the energy production rate, the values A, B, AB, A2 and AB2 (A was the dilution rate of the COD and B was the HRT) were significant model terms with an R2 value of 99%. The surface plot showed a nonlinear decrease in the EPR for an increase in the DR or HRT.
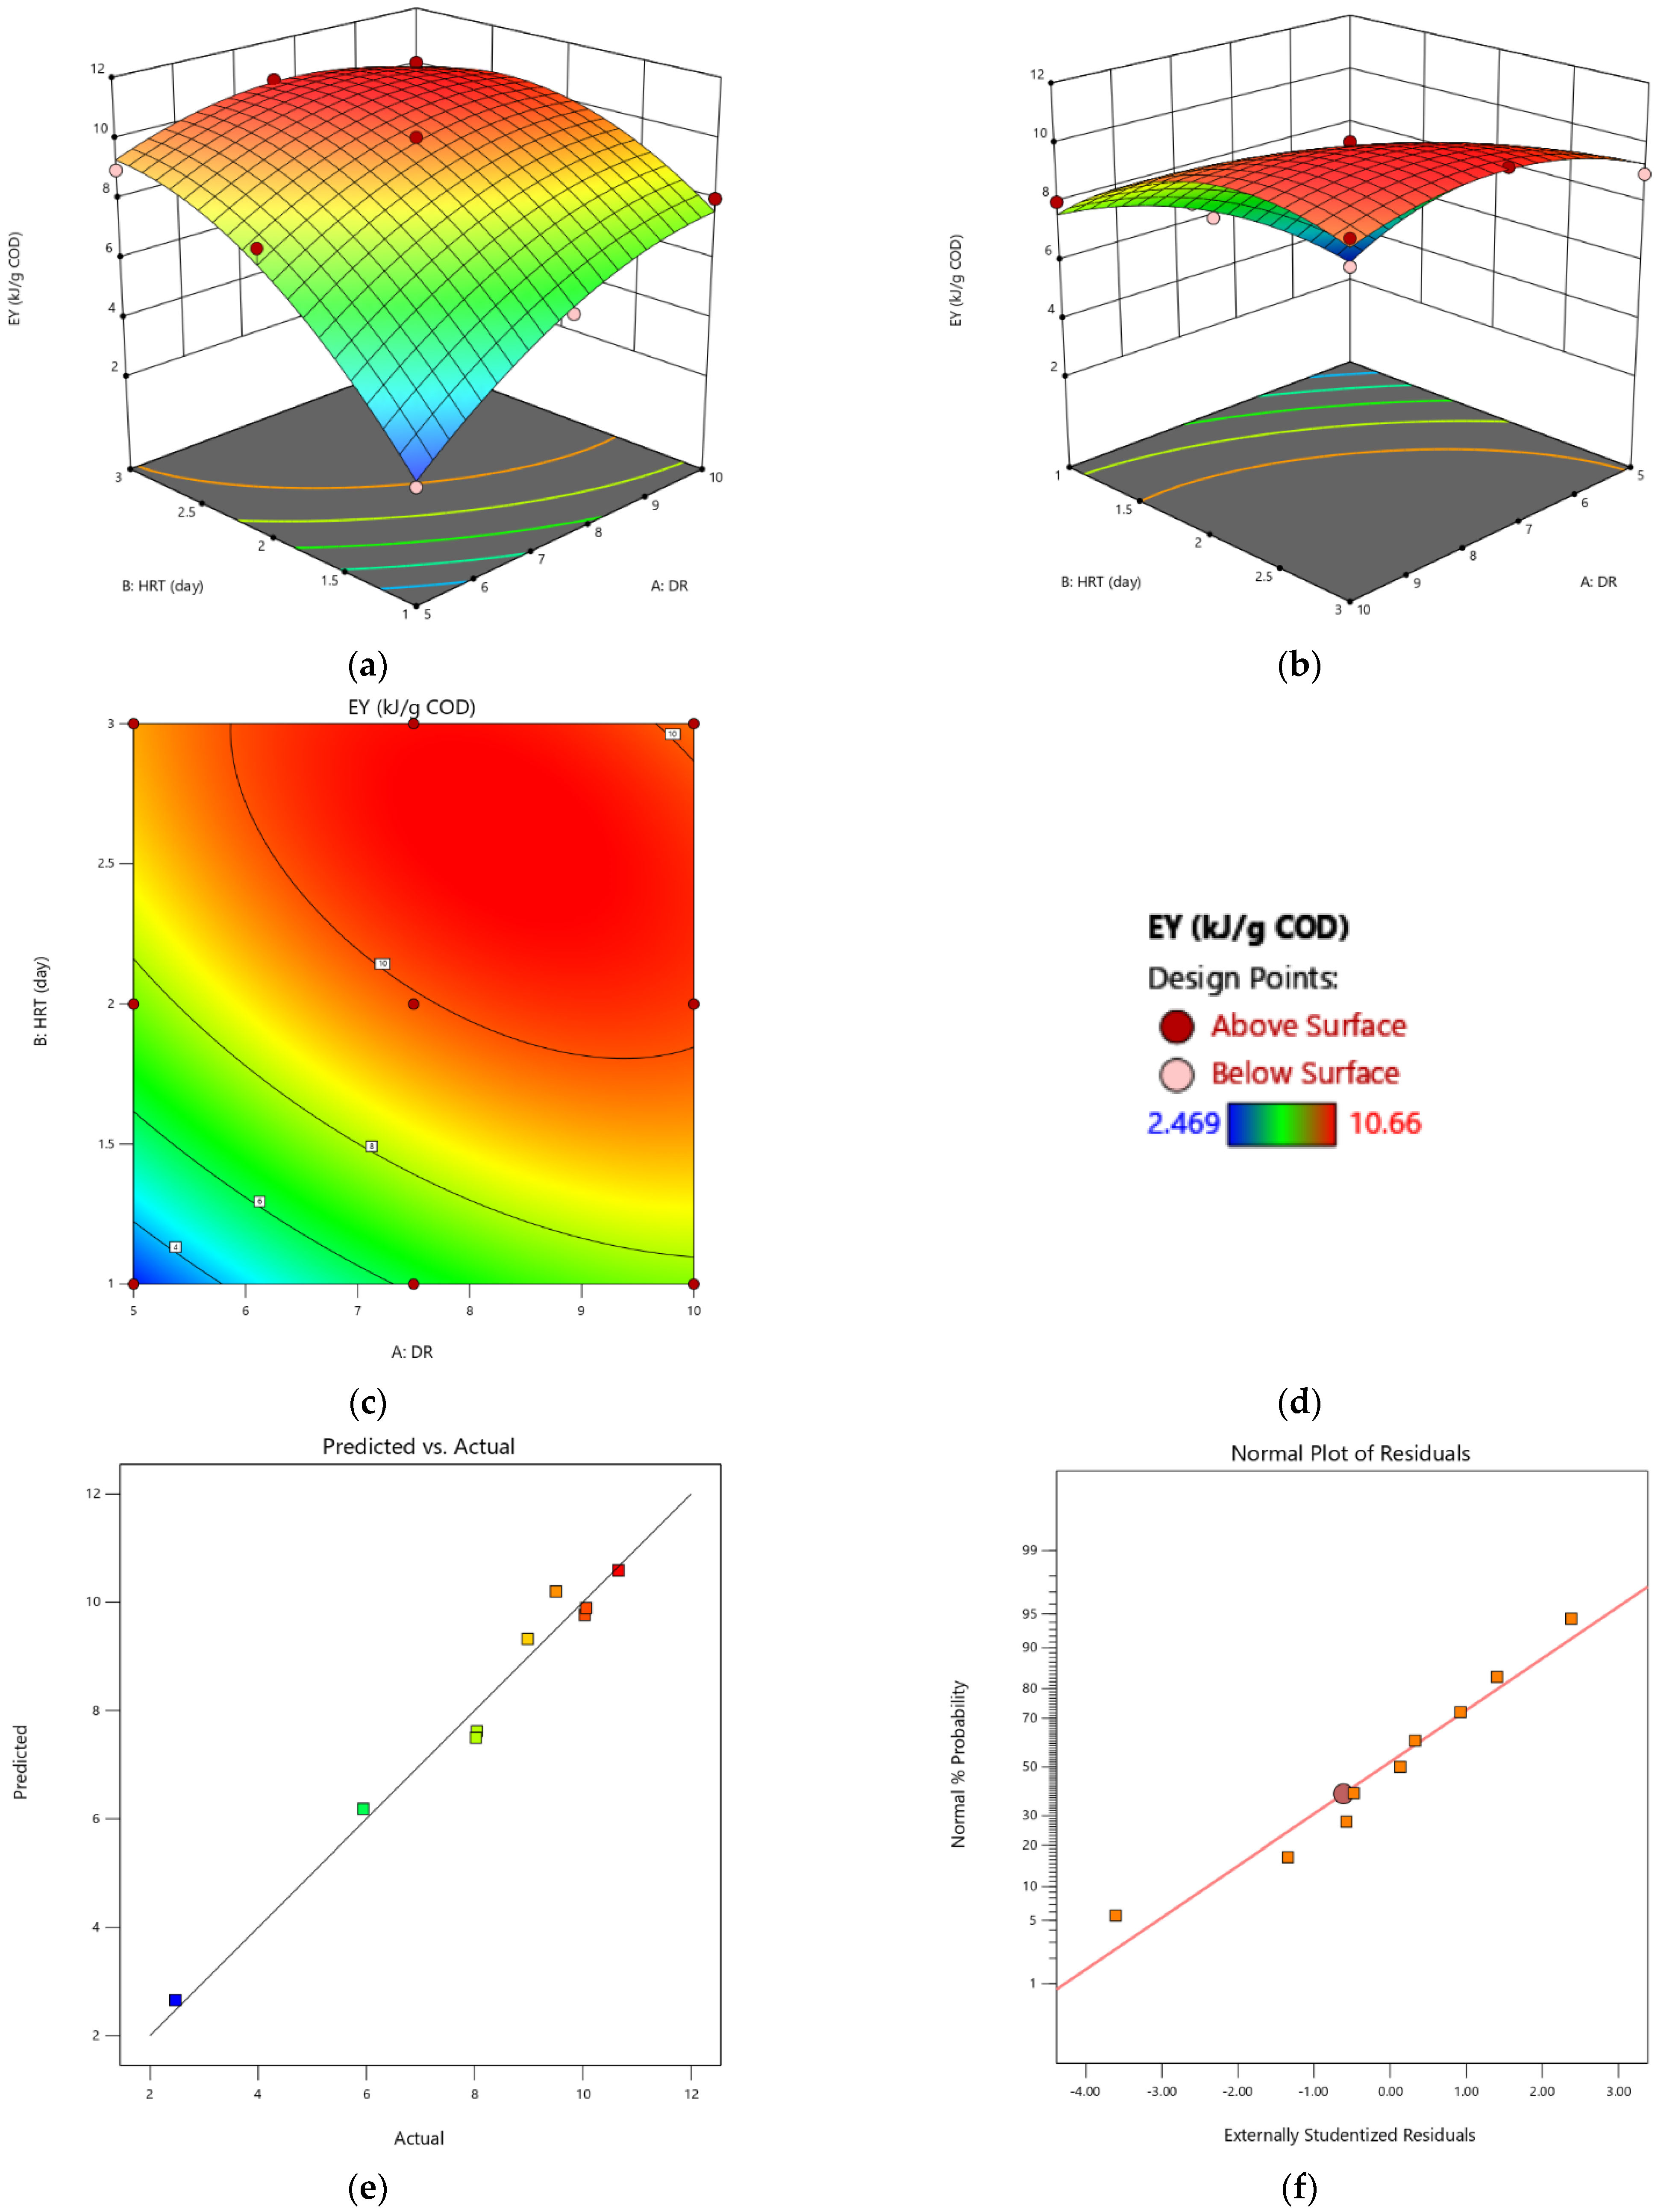
  • For the energy yield, the values A, B, AB and B2 (A were the dilution rate of the COD and B was the HRT) were significant model terms with an R2 value of 97%. The surface plot showed a nonlinear increase in the EY for an increase in the DR or HRT.
  • The desirability approach produced a combined optimum condition as follows: a DR of 6.2 and a HRT of 2.28, which allowed us to achieve both a maximum EPR and EY (80.263 kJ/(L·day) and 9.56 kJ/g COD, respectively), with an overall desirability value of 0.883.
Thus, a HRT in a methanogenic reactor of 2.28 days and COD content in the diluted CW of 17.58 g/L, which corresponded to an OLR of 6.5 g COD/(L·day), can be recommended for obtaining a maximum energy production rate and yield from the continuous two-stage mesophilic–thermophilic anaerobic digestion of cheese whey.

Author Contributions

Conceptualization, A.A.K. and D.A.K.; methodology, Y.V.L. and E.R.M.; software, V.P.; validation, Y.V.L. and I.V.K.; investigation, E.A.Z. and I.V.K.; resources, E.R.M.; data curation, A.A.K.; writing—original draft preparation, A.A.K., E.R.M. and Y.V.L.; writing—review and editing, A.A.K., E.R.M. and Y.V.L.; visualization, A.A.K.; supervision, Y.V.L.; project administration, E.R.M.; funding acquisition, E.R.M. All authors have read and agreed to the published version of the manuscript.

Funding

This research was supported by the Russian Science Foundation grant no. 21-79-10153 (https://rscf.ru/project/21-79-10153/, accessed on 1 November 2022). V.P., D.A.K., Y.V.L. and E.A.Z. were supported by the Ministry of Science and Higher Education of the Russian Federation.

Conflicts of Interest

The authors declare no conflict of interest. The funders had no role in the design of the study; in the collection, analyses or interpretation of data; in the writing of the manuscript or in the decision to publish the results.

References

  1. Slavov, A. Dairy Wastewaters–General Characteristics and Treatment Possibilities—A Review. Food Technol. Biotechnol. 2017, 55, 14–28. [Google Scholar] [CrossRef] [PubMed]
  2. Farizoglu, B.; Keskinler, B.; Yildiz, E.; Nuhoglu, A. Simultaneous Removal of C, N, P from Cheese Whey by Jet Loop Membrane Bioreactor (JLMBR). J. Hazard. Mater. 2007, 146, 399–407. [Google Scholar] [CrossRef] [PubMed]
  3. Ahmad, T.; Aadil, R.M.; Ahmed, H.; Rahman, U.U.; Soares, B.C.V.; Souza, S.L.Q.; Pimentel, T.C.; Scudino, H.; Guimarães, J.T.; Esmerino, E.A.; et al. Treatment and Utilization of Dairy Industrial Waste: A Review. Trends Food Sci. Technol. 2019, 88, 361–372. [Google Scholar] [CrossRef]
  4. Carvalho, F.; Prazeres, A.R.; Rivas, J. Cheese Whey Wastewater: Characterization and Treatment. Sci. Total Environ. 2013, 445–446, 385–396. [Google Scholar] [CrossRef] [PubMed]
  5. Macwan, S.; Dabhi, B.; Parmar, S.; Aparnathi, K. Whey and Its Utilization. Int. J. Curr. Microbiol. Appl. Sci. 2016, 5, 134–155. [Google Scholar] [CrossRef]
  6. Pires, A.F.; Marnotes, N.G.; Rubio, O.D.; Garcia, A.C.; Pereira, C.D. Dairy By-Products: A Review on the Valorization of Whey and Second Cheese Whey. Foods 2021, 10, 1067. [Google Scholar] [CrossRef]
  7. Fox, P.F.; Guinee, T.P.; Cogan, T.M.; McSweeney, P.L.H. Whey and Whey Products BT—Fundamentals of Cheese Science; Fox, P.F., Guinee, T.P., Cogan, T.M., McSweeney, P.L.H., Eds.; Springer US: Boston, MA, USA, 2017; pp. 755–769. [Google Scholar] [CrossRef]
  8. Escalante, H.; Castro, L.; Amaya, M.P.; Jaimes, L.; Jaimes-Estévez, J. Anaerobic Digestion of Cheese Whey: Energetic and Nutritional Potential for the Dairy Sector in Developing Countries. Waste Manag. 2018, 71, 711–718. [Google Scholar] [CrossRef]
  9. Imeni, S.M.; Pelaz, L.; Corchado-Lopo, C.; Maria Busquets, A.; Ponsá, S.; Colón, J. Techno-Economic Assessment of Anaerobic Co-Digestion of Livestock Manure and Cheese Whey (Cow, Goat & Sheep) at Small to Medium Dairy Farms. Bioresour. Technol. 2019, 291, 121872. [Google Scholar] [CrossRef]
  10. Kim, I.S.; Hwang, M.H.; Jang, N.J.; Hyun, S.H.; Lee, S.T. Effect of Low PH on the Activity of Hydrogen Utilizing Methanogen in Bio-Hydrogen Process. Int. J. Hydrogen Energy 2004, 29, 1133–1140. [Google Scholar] [CrossRef]
  11. Fontana, A.; Campanaro, S.; Treu, L.; Kougias, P.; Cappa, F.; Morelli, L.; Angelidaki, I. Performance and Genome-Centric Metagenomics of Thermophilic Single and Two-Stage Anaerobic Digesters Treating Cheese Wastes. Water Res. 2018, 134, 181–191. [Google Scholar] [CrossRef] [PubMed]
  12. Nozhevnikova, A.N.; Russkova, Y.I.; Litti, Y.V.; Parshina, S.N.; Zhuravleva, E.A.; Nikitina, A.A. Syntrophy and Interspecies Electron Transfer in Methanogenic Microbial Communities. Microbiology 2020, 89, 129–147. [Google Scholar] [CrossRef]
  13. Kovalev, A.A.; Kovalev, D.A.; Nozhevnikova, A.N.; Zhuravleva, E.A.; Katraeva, I.V.; Grigoriev, V.S.; Litti, Y.V. Effect of Low Digestate Recirculation Ratio on Biofuel and Bioenergy Recovery in a Two-Stage Anaerobic Digestion Process. Int. J. Hydrogen Energy 2021, 46, 39688–39699. [Google Scholar] [CrossRef]
  14. De Gioannis, G.; Muntoni, A.; Polettini, A.; Pomi, R.; Spiga, D. Energy Recovery from One- and Two-Stage Anaerobic Digestion of Food Waste. Waste Manag. 2017, 68, 595–602. [Google Scholar] [CrossRef]
  15. Fu, S.-F.; Liu, R.; Sun, W.-X.; Zhu, R.; Zou, H.; Zheng, Y.; Wang, Z.-Y. Enhancing Energy Recovery from Corn Straw via Two-Stage Anaerobic Digestion with Stepwise Microaerobic Hydrogen Fermentation and Methanogenesis. J. Clean. Prod. 2020, 247, 119651. [Google Scholar] [CrossRef]
  16. Tunçay, E.G.; Erguder, T.H.; Eroğlu, İ.; Gündüz, U. Dark Fermentative Hydrogen Production from Sucrose and Molasses. Int. J. Energy Res. 2017, 41, 1891–1902. [Google Scholar] [CrossRef]
  17. Cheng, J.; Lin, R.; Ding, L.; Song, W.; Li, Y.; Zhou, J.; Cen, K. Fermentative Hydrogen and Methane Cogeneration from Cassava Residues: Effect of Pretreatment on Structural Characterization and Fermentation Performance. Bioresour. Technol. 2015, 179, 407–413. [Google Scholar] [CrossRef] [PubMed]
  18. Kumar, G.; Bakonyi, P.; Sivagurunathan, P.; Kim, S.-H.; Nemestóthy, N.; Bélafi-Bakó, K. Lignocellulose Biohydrogen: Practical Challenges and Recent Progress. Renew. Sustain. Energy Rev. 2015, 44, 728–737. [Google Scholar] [CrossRef]
  19. Bolzonella, D.; Battista, F.; Cavinato, C.; Gottardo, M.; Micolucci, F.; Lyberatos, G.; Pavan, P. Recent Developments in Biohythane Production from Household Food Wastes: A Review. Bioresour. Technol. 2018, 257, 311–319. [Google Scholar] [CrossRef]
  20. Hans, M.; Kumar, S. Biohythane Production in Two-Stage Anaerobic Digestion System. Int. J. Hydrogen Energy 2019, 44, 17363–17380. [Google Scholar] [CrossRef]
  21. Alexandropoulou, M.; Antonopoulou, G.; Trably, E.; Carrere, H.; Lyberatos, G. Continuous Biohydrogen Production from a Food Industry Waste: Influence of Operational Parameters and Microbial Community Analysis. J. Clean. Prod. 2018, 174, 1054–1063. [Google Scholar] [CrossRef] [Green Version]
  22. Alibardi, L.; Cossu, R. Effects of Carbohydrate, Protein and Lipid Content of Organic Waste on Hydrogen Production and Fermentation Products. Waste Manag. 2016, 47, 69–77. [Google Scholar] [CrossRef] [PubMed]
  23. Distefano, T.; Palomar, A. Effect of Anaerobic Reactor Process Configuration on Useful Energy Production. Water Res. 2010, 44, 2583–2591. [Google Scholar] [CrossRef] [PubMed]
  24. Carrillo-Reyes, J.; Cortés-Carmona, M.A.; Bárcenas-Ruiz, C.D.; Razo-Flores, E. Cell Wash-out Enrichment Increases the Stability and Performance of Biohydrogen Producing Packed-Bed Reactors and the Community Transition along the Operation Time. Renew. Energy 2016, 97, 266–273. [Google Scholar] [CrossRef]
  25. Venetsaneas, N.; Antonopoulou, G.; Stamatelatou, K.; Kornaros, M.; Lyberatos, G. Using Cheese Whey for Hydrogen and Methane Generation in a Two-Stage Continuous Process with Alternative PH Controlling Approaches. Bioresour. Technol. 2009, 100, 3713–3717. [Google Scholar] [CrossRef] [PubMed]
  26. Kisielewska, M.; Wysocka, I.; Rynkiewicz, M. Continuous Biohydrogen and Biomethane Production from Whey Permeate in a Two-Stage Fermentation Process. Environ. Prog. Sustain. Energy 2013, 33, 1411–1418. [Google Scholar] [CrossRef]
  27. Dareioti, M.A.; Kornaros, M. Effect of Hydraulic Retention Time (HRT) on the Anaerobic Co-Digestion of Agro-Industrial Wastes in a Two-Stage CSTR System. Bioresour. Technol. 2014, 167, 407–415. [Google Scholar] [CrossRef]
  28. Zhang, H.; Bruns, M.A.; Logan, B.E. Biological Hydrogen Production by Clostridium Acetobutylicum in an Unsaturated Flow Reactor. Water Res. 2006, 40, 728–734. [Google Scholar] [CrossRef]
  29. Antonopoulou, G.; Stamatelatou, K.; Venetsaneas, N.; Kornaros, M.; Lyberatos, G. Biohydrogen and Methane Production from Cheese Whey in a Two-Stage Anaerobic Process. Ind. Eng. Chem. Res. 2008, 47, 5227–5233. [Google Scholar] [CrossRef]
  30. Naghavi, R.; Abdoli, M.A.; Karbassi, A.; Adl, M. Determining the Appropriate Mixing Ratio in a Multi-Substrate Anaerobic Digestion of Organic Solid Wastes Employing Taguchi Method. J. Environ. Health Sci. Eng. 2022, 20, 545–554. [Google Scholar] [CrossRef]
  31. Kainthola, J.; Kalamdhad, A.S.; Goud, V.V. Optimization of Methane Production during Anaerobic Co-Digestion of Rice Straw and Hydrilla Verticillata Using Response Surface Methodology. Fuel 2019, 235, 92–99. [Google Scholar] [CrossRef]
  32. Yılmaz, Ş.; Şahan, T. Improved Anaerobic Digestion Activity of Poultry Dung with Pumice-Supported Trace Elements: Focus on the Statistical Optimization Approach. Biomass Convers. Biorefin. 2022. [Google Scholar] [CrossRef]
  33. Lin, C.-Y.; Chai, W.S.; Lay, C.-H.; Chen, C.-C.; Lee, C.-Y.; Show, P.-L. Optimization of Hydrolysis-Acidogenesis Phase of Swine Manure for Biogas Production Using Two-Stage Anaerobic Fermentation. Processes 2021, 9, 1324. [Google Scholar] [CrossRef]
  34. Mikheeva, E.R.; Katraeva, I.V.; Kovalev, A.A.; Kovalev, D.A.; Nozhevnikova, A.N.; Panchenko, V.; Fiore, U.; Litti, Y.V. The Start-Up of Continuous Biohydrogen Production from Cheese Whey: Comparison of Inoculum Pretreatment Methods and Reactors with Moving and Fixed Polyurethane Carriers. Appl. Sci. 2021, 11, 510. [Google Scholar] [CrossRef]
  35. Bär, K.; Merkle, W.; Tuczinski, M.; Saravia, F.; Horn, H.; Ortloff, F.; Graf, F.; Lemmer, A.; Kolb, T. Development of an Innovative Two-Stage Fermentation Process for High-Calorific Biogas at Elevated Pressure. Biomass Bioenergy 2018, 115, 186–194. [Google Scholar] [CrossRef]
  36. Mikheeva, E.R.; Katraeva, I.V.; Vorozhtsov, D.L.; Kovalev, D.A.; Kovalev, A.A.; Grigoriev, V.S.; Litti, Y.V. Dark Fermentative Biohydrogen Production from Confectionery Wastewater in Continuous-Flow Reactors. Int. J. Hydrogen Energy 2022, 47, 22348–22358. [Google Scholar] [CrossRef]
  37. Mikheeva, E.R.; Katraeva, I.V.; Kovalev, A.A.; Kovalev, D.A.; Litti, Y.V. Effects of Pretreatment in a Vortex Layer Apparatus on the Properties of Confectionery Wastewater and Its Dark Fermentation. Int. J. Hydrogen Energy 2022, 47, 23165–23174. [Google Scholar] [CrossRef]
  38. Ghaleb, A.A.S.; Kutty, S.R.M.; Ho, Y.-C.; Jagaba, A.H.; Noor, A.; Al-Sabaeei, A.M.; Almahbashi, N.M.Y. Response Surface Methodology to Optimize Methane Production from Mesophilic Anaerobic Co-Digestion of Oily-Biological Sludge and Sugarcane Bagasse. Sustainability 2020, 12, 2116. [Google Scholar] [CrossRef] [Green Version]
  39. Kumari, S.; Das, D. Biohythane Production from Sugarcane Bagasse and Water Hyacinth: A Way towards Promising Green Energy Production. J. Clean. Prod. 2018, 207, 689–701. [Google Scholar] [CrossRef]
  40. Silva-Illanes, F.; Tapia-Venegas, E.; Schiappacasse, M.C.; Trably, E.; Ruiz-Filippi, G. Impact of Hydraulic Retention Time (HRT) and PH on Dark Fermentative Hydrogen Production from Glycerol. Energy 2017, 141, 358–367. [Google Scholar] [CrossRef]
  41. Vo, T.-P.; Lay, C.-H.; Lin, C.-Y. Effects of Hydraulic Retention Time on Biohythane Production via Single-Stage Anaerobic Fermentation in a Two-Compartment Bioreactor. Bioresour. Technol. 2019, 292, 121869. [Google Scholar] [CrossRef]
  42. Onu, C.E.; Nweke, C.N.; Nwabanne, J.T. Modeling of Thermo-Chemical Pretreatment of Yam Peel Substrate for Biogas Energy Production: RSM, ANN, and ANFIS Comparative Approach. Appl. Surf. Sci. Adv. 2022, 11, 100299. [Google Scholar] [CrossRef]
  43. Ibrahim, T.H.; Betiku, E.; Solomon, B.O.; Oyedele, J.O.; Dahunsi, S.O. Mathematical Modelling and Parametric Optimization of Biomethane Production with Response Surface Methodology: A Case of Cassava Vinasse from a Bioethanol Distillery. Renew. Energy 2022, 200, 395–404. [Google Scholar] [CrossRef]
  44. Ramos, L.R.; de Menezes, C.A.; Soares, L.A.; Sakamoto, I.K.; Varesche, M.B.A.; Silva, E.L. Controlling Methane and Hydrogen Production from Cheese Whey in an EGSB Reactor by Changing the HRT. Bioprocess Biosyst. Eng. 2020, 43, 673–684. [Google Scholar] [CrossRef] [PubMed]
  45. Ramos, L.R.; Silva, E.L. Improving EGSB Reactor Performance for Simultaneous Bioenergy and Organic Acid Production from Cheese Whey via Continuous Biological H2 Production. Biotechnol. Lett. 2017, 39, 983–991. [Google Scholar] [CrossRef] [PubMed]
  46. Lembo, G.; Rosa, S.; Mazzurco Miritana, V.; Marone, A.; Massini, G.; Fenice, M.; Signorini, A. Thermophilic Anaerobic Digestion of Second Cheese Whey: Microbial Community Response to H2 Addition in a Partially Immobilized Anaerobic Hybrid Reactor. Processes 2021, 9, 43. [Google Scholar] [CrossRef]
  47. Dareioti, M.A.; Vavouraki, A.I.; Tsigkou, K.; Kornaros, M. Assessment of Single- vs. Two-Stage Process for the Anaerobic Digestion of Liquid Cow Manure and Cheese Whey. Energies 2021, 14, 5423. [Google Scholar] [CrossRef]
  48. Castelló, E.; García y Santos, C.; Iglesias, T.; Paolino, G.; Wenzel, J.; Borzacconi, L.; Etchebehere, C. Feasibility of Biohydrogen Production from Cheese Whey Using a UASB Reactor: Links between Microbial Community and Reactor Performance. Int. J. Hydrogen Energy 2009, 34, 5674–5682. [Google Scholar] [CrossRef]
  49. Ghimire, A.; Luongo, V.; Frunzo, L.; Lens, P.N.L.; Pirozzi, F.; Esposito, G. Biohythane Production from Food Waste in a Two-Stage Process: Assessing the Energy Recovery Potential. Environ. Technol. 2022, 43, 2190–2196. [Google Scholar] [CrossRef]
Figure 1. Flowchart of energy production optimization in mesophilic–thermophilic two-stage AD of CW. Note: Green lines indicate liquid flow, yellow lines indicate gas flow and dotted lines indicate information flow.
Energies 15 08928 g001
Figure 2. OLR values during the experiment.
Energies 15 08928 g002
Figure 3. Dependence of methane yield (MY) and hydrogen yield (HY) on OLR.
Energies 15 08928 g003
Figure 4. Dependence of methane production rate (MPR) and hydrogen production rate (HPR) on OLR.
Energies 15 08928 g004
Figure 5. Dependence of EPR on OLR: blue—experimental data for semicontinuous two-stage digestion; orange—mean values and model.
Energies 15 08928 g005
Figure 6. Dependence of EY on OLR: blue—experimental data for semicontinuous two-stage digestion; orange—mean values and model.
Energies 15 08928 g006
Figure 7. Interactive effect of DR and HRT on EPR: (a,b) 3D response surface; (c) contour plots; (d) color legend; (e) plot of actual vs. predicted values; (f) normal plot of residuals.
Energies 15 08928 g007
Figure 8. Interactive effect of DR and HRT on EY: (a,b) 3D response surface; (c) contour plots; (d) color legend; (e) plot of actual vs. predicted values; (f) normal plot of residuals.
Energies 15 08928 g008
Figure 9. Ramp plot for desirability analysis: maximization of EPR and EY with variables DR and HRT.
Energies 15 08928 g009
Table 1. Operating parameters of two-stage AD of CW.
ParameterReactorTemperature, °CPeriod #1Period #2Period #3
HRT, dayRH37 ± 10.42
R155 ± 13
R22
R31
Dilution rate (DR), parts of water per part CW--107.55
COD of diluted CW, g/L--10.914.5321.8
Table 2. OLR values depending on the DR and HRT.
OLR, g COD/(L·day)DRHRT, day
3.18103
4.307.53
4.5102
6.087.52
6.4653
7.66101
9.1252
10.377.51
15.5551
Table 3. DR and HRT values used to design the OLR through CCD-RSM.
FactorNameLow LevelHigh Level
ADR5.0010.00
BHRT1.003.00
Table 4. Experimental design of the model.
StdRunFactor 1 A:DRFactor 2 B:HRT, dayResponse 1 EPR, kJ/(L·day)Response 2 EY, kJ/g COD
717.5180.6355.943
125155.1932.469
4310335.59410.037
2410175.0238.043
6510247.779.505
365368.7398.983
575285.1458.025
987.5274.58310.064
897.5355.77810.66
Table 5. ANOVA for cubic model response 1: EPR.
SourceSum of SquaresdfMean SquareF-Valuep-Value
Model2193.687313.38338.280.0418Significant
A-DR698.451698.45753.930.0232Significant
B-HRT308.941308.94333.480.0348Significant
AB701.591701.59757.320.0231Significant
A2165.181165.18178.310.0476Significant
B2107.721107.72116.280.0589
A2B47.33147.3351.090.0885
AB2314.521314.52339.510.0345Significant
A30.00000
B30.00000
Residual0.926410.9264
Cor Total2194.608
Table 6. ANOVA for quadratic model response 2: EY.
SourceSum of SquaresdfMean SquareF-Valuep-Value
Model51.95510.3924.800.0121Significant
A-DR10.96110.9626.150.0145Significant
B-HRT29.15129.1569.570.0036Significant
AB5.1115.1112.190.0397Significant
A22.1912.195.220.1066
B24.5514.5510.870.0459Significant
Residual1.2630.4190
Cor Total53.218
Table 7. Energy recovery from different one- and two-stage AD.
HRT, dayTemperature, °COLR, g COD/(L·day)EPR, kJ/(L·day)EY, kJ/g CODNoteReference
0.33–0.013020–61025.42–14.42 *8.98–1.46 * [44]
0.1730135 -2102.93–3.96 * DF only[45]
15552.18–2.4-13.11AD only[46]
20372.36–3.83 7.17–11.56AD only[47]
0.530201.56 DF only[48]
2.2837/556.580.269.56 This study
* Calculated.
Publisher’s Note: MDPI stays neutral with regard to jurisdictional claims in published maps and institutional affiliations.

