Article

Real-Time Measurement of NOx Emissions from Modern Diesel Vehicles Using On-Board Sensors

by
Tommaso Selleri
1,2,*,
Christian Ferrarese
1,
Jacopo Franzetti
1,
Ricardo Suarez-Bertoa
1 and
Dario Manara
1,*
1
European Commission, Joint Research Centre (JRC), 21027 Ispra, Italy
2
European Environmental Agency (EEA), 1050 Copenhagen, Denmark
*
Authors to whom correspondence should be addressed.
Energies 2022, 15(22), 8766; https://doi.org/10.3390/en15228766
Submission received: 24 October 2022 / Revised: 15 November 2022 / Accepted: 18 November 2022 / Published: 21 November 2022
(This article belongs to the Section I2: Energy and Combustion Science)

Abstract

:
In this work, the performance of on-board vehicle exhaust emission sensors is investigated and compared to reference laboratory and on-road instrumentation for two modern diesel light-duty commercial vehicles, type-approved as Euro 6d-TEMP-EVAP-ISC and Euro 6d-ISC-FCM. The first step of the analysis was to perform emissions tests in the laboratory and compare the NOx concentrations registered by the vehicle sensors available at the engine-out and tailpipe positions with those recorded by reference laboratory instrumentation. In a second step, tests were also conducted on road, comparing the performance of on-board sensors with those of Portable Emission Measurement System (PEMS) analysers, which were taken as references. The uncertainty related to exhaust flow measurements was also addressed. In particular, emissions factors calculated using the flow rates measured either in the laboratory or on-road were compared to those obtained by computing exhaust flows with on-board recorded data available from the vehicle electronic control unit. Results showed maximum deviations on the order of 34% in laboratory tests and of 21% during on-road measurements. Finally, measurements were also carried out during a diesel particulate filter regeneration event, showing the good performance of the on-board sensors even when high NOx concentrations were present. These conditions can be similar to those experienced in the case of an after-treatment system malfunction or of a high-emitting event, and can thus be of interest for real-time malfunction identification and monitoring.

1. Introduction

Since the early 1990s, the European Union (EU) has introduced a series of progressively more stringent regulations addressing pollutant emissions in order to control air pollution from the transport sector, commonly known as Euro standards [1]. More recently, with the European Green Deal [2], the Commission has indicated the intention to review the current air pollutant emissions limits, in particular with the proposal of a new Euro 7 standard [3]. In addition, already today, in order to avoid a systematic disparity between vehicle emissions recorded during type approval and those recorded during use in the real world, it should be ensured that vehicle emissions comply with pollutant limits throughout the vehicles’ normal useful life and under normal operating conditions. In the EU, this is achieved through market surveillance (MaSu) and in-service conformity (ISC) programmes. In this framework, there is a growing interest in exploring the possibility of using sensors and the information already available on board the vehicle to monitor its emissions performance, not only for diagnostic purposes but also for environmental aspects.
Common vehicles are nowadays equipped with on-board sensors which monitor several kinds of parameters related to various aspects of the vehicle functioning in real time. Through controller area networks (CANs) and the vehicle’s electronic control unit (ECU), these sensors permit On-Board Diagnostics (OBD) to be carried out. This can be used, among other things, to indicate possible malfunctions in the exhaust after-treatment system (ATS). When a serious single-point malfunction is detected, the system must automatically switch on the Malfunction Indicator Lamp (MIL) on the dashboard.
On modern diesel vehicles equipped with selective catalytic reduction systems, among the different signals available at the OBD port, it is possible to find those related to nitrogen oxides (NOx) concentration in the vehicle’s exhaust. The readings coming from these particular sensors can in principle be used for continuous on-board monitoring (OBM) of emissions. A similar concept, requiring however, on new cars, the introduction of a dedicated device for fuel consumption metering, is already used in recent Euro 6 light-duty vehicles for on-board fuel consumption monitoring (OBFCM). OBFCM is an important tool to keep vehicle performance under control in terms of CO2 emissions. In particular, starting in 2021 with registered passenger cars and light commercial vehicles [4], the European Commission regularly collects data on the real-world CO2 emissions and fuel or energy consumption using on-board fuel and/or energy consumption monitoring devices.
The OBM approach is promising for monitoring other emissions, and has numerous potential applications, both for heavy- and light-duty vehicles. Recent developments in the field of real-time monitoring worldwide, such as OBFCM in the European Union, REAL (real emissions assessment logging) in the United States, and remote OBD in China already indicate the significant possible benefits of the use of more advanced vehicle emission monitoring. On-board NOx monitoring also plays a central role in the Heavy-Duty Engine and Vehicle Standards scheme, an American Environment Protection Agency (EPA) proposal for air pollution control [5]. California [6] and China [7] have already adopted OBM-like regulations requiring heavy-duty vehicle (HDV) OBD systems to collect and store emissions data from the vehicle’s sensors. In particular, the Chinese government, has developed a local standard that has required vehicle manufacturers to design China VI-like on-board monitoring (OBM) systems for new China V HDVs since September 2018 [8]. Additionally, China has been a pioneer in retrofitting in-use China IV and China V HDDVs with OBM systems since 2017. These systems are particularly used for the real-time monitoring of nitrogen oxide emissions. OBM could be applied to vehicle screening activities for market surveillance purposes, or to fast monitoring for periodic technical inspections. OBM signals may complement the OBD system in the monitoring of vehicle emissions, by means, for example, not only of malfunction detection, but also by providing emission-related incentives. Moreover, on-board monitoring could be used to check the emissions over a vehicle’s lifetime, addressing the durability of exhaust after-treatment systems.
Identifying the technical feasibility and requirements of an OBM system constitutes a key factor of the OBM approach. A detailed analysis of sensors is necessary to understand the short-term, mid-term and long-term capabilities for emission sensing. Modern vehicles are equipped with a limited number of sensors that can be used for OBM. These mainly include standalone sensors for NOx.
The present work focusses on the analysis of NOx sensors used to control the status and the proper functioning of deNOx after-treatment systems, such as selective catalytic reduction (SCR) units. These NOx sensors can be advantageously employed for on-board monitoring of nitrogen oxide emissions at various stages of the exhaust after-treatment system, such as at engine-out, SCR-out, and at the tailpipe.
Studies on the applicability of on-board NOx sensors for monitoring real-time emissions in heavy-duty vehicles have been performed in the last few years [9,10,11]. Recently, Cheng et al. studied the performance of on-board sensors for evaluating NOx emissions from HDVs in an inspection and maintenance program [12].
A recent assessment reported by Zhang et al. [13] has shown that NOx OBM data are consistent with portable emission measuring system (PEMS) results in manufacturer-installed OBM systems in HDVs. In contrast, data are less sound in HDVs equipped with retrofitted OBM systems. Zhang et al.’s assessment shows the high potential of the OBM approach when this is adopted directly by the vehicle manufacturers. Zhang et al.’s work also gives significant hints about the technical points that need to be clarified in order to fully implement the OBM approach for the real-time on-board monitoring of engine emissions. In particular, consistency between on-board measured emissions and chassis dynamometer/constant volume sampler (CVS)- or PEMS-measured data should be thoroughly checked.
The current research deals with real-time monitoring of NOx emissions through the signals collected by on-board sensors in two example light-duty commercial vehicles. An approach similar to the one proposed for evaluating the performance of on-board NOx sensors in HDVs by Cheng et al. in 2019 [10] is thus largely extended and applied for the first time, to the authors’ knowledge, to light-duty vehicles (LDV).
NOx concentrations recorded by on-board sensors are collected and compared with laboratory (CVS)-measured data registered in parallel during the same tests carried out using a chassis dynamometer at the European Commission’s Joint Research Centre Vehicle Emission Laboratory (VELA). Consistency and discrepancies between OBM and laboratory reference measurements are thus highlighted. Moreover, the same approach has been applied to further exploratory on-road tests, whereby OBM data have been compared with PEMS results collected in parallel. The performance of on-board NOx sensors is thus evaluated in the investigated LDVs. In addition, similar measurements were also carried out during a diesel particulate filter (DPF) regeneration event in order to test the performance of on-board sensors even in the presence of high NOx concentrations. These conditions can be similar to those experienced in the case of an after-treatment system malfunction or of any other high-emission event. Therefore, it is of great interest to evaluate the suitability of on-board NOx sensors for monitoring the long-term performance and real-time malfunctions of emission after-treatment systems in LDVs, applications that are envisaged in the newly proposed Euro 7 standard [3].

2. Materials and Methods

Two N1 Class III diesel light-duty commercial vehicles, hereinafter Vehicle 1 and Vehicle 2, were tested at the Joint Research Centre (JRC) of the European Commission. Both vehicles met recent emission standards: Vehicle 1 was type-approved as Euro 6d-TEMP-EVAP-ISC and Euro 6d-ISC-FCM. Their after-treatment systems (ATSs) consisted of an exhaust gas recirculation (EGR) system, a diesel oxidation catalyst (DOC), a diesel particulate filter (DPF) and a selective catalytic reduction unit (SCR). Both vehicles’ ATSs were equipped with NOx commercial sensors at the engine-out and at the tailpipe-out positions. Table 1 summarises the main characteristics of the tested vehicles.
Vehicle 1 was tested using diesel B7 commercial fuel at the Vehicle Emissions Laboratories (VELA 2) over four double worldwide harmonised light-duty vehicle test cycles (WLTC; first: cold WLTC, second: hot WLTC) and one hot WLTC (starting with a coolant temperature above 70 °C). The speed trace followed by the vehicle during the double WLTC cycle is shown in Figure 1. All tests were performed at an ambient temperature of 23 °C except for one test at 0 °C. The temperature during the cycles was monitored and measured with a VAISALA temperature and humidity transmitter. Testing the vehicle over a double WLTC ensured that for the second WLTC the NOx sensors were hot enough to read continuously for the whole duration of the test, as will be discussed later in the Results and Discussion section. Herein, cold indicates that the coolant and emission control system temperatures are both within ±3 °C of the ambient one.
Vehicle 2 was tested according to the most recent real driving emissions (RDE) regulation [14] procedures using diesel B7 commercial fuel. Two on-road tests were conducted. The trip duration was ~108 min and was composed of an urban (~34.9 km), a rural (~28.1 km), and a highway (~26.8 km) section according to the regulation requirements. The average ambient temperature was between 24.7 °C and 29.0 °C. The speed profile followed by the vehicle during the on-road cycle is illustrated in Figure 1.
For both laboratory and on-road tests, NOx tailpipe mass emissions were calculated using the 1 Hz exhaust flow rate (m3 s−1) and the 1 Hz NOx concentration (ppm) at the tailpipe. In particular, NOx mass emissions were obtained using both flow rates and concentrations measured by the standard laboratory and PEMS equipment. Additionally, NOx tailpipe mass emissions were also calculated using the NOx concentration measured by the on-board NOx tailpipe sensors and either the same flow rate obtained from the laboratory measurements or the flow rate obtained from the MAF (mass air flow rate) signal acquired at the standard OBD port.
Laboratory tests on Vehicle 1 were conducted at the VELA 2 testing facility. VELA 2 is a 4WD chassis dynamometer climatic test cell operating under controlled humidity and temperature conditions. The technical features of the test cell are described elsewhere [10]. The exhaust gases were sampled at engine-out and at the tailpipe of Vehicle 1 and they were analysed by two analytical systems: MEXA 7100 and MEXA 7400, respectively (Horiba, Kyoto, Japan). Both analysers are equipped with a heated sampling line and heated pre-filters at 190 °C and they exploit chemiluminescence detection (CLD) to measure NOx. Dynamic single-range mode was used for both NOx analysers. Additional details on the MEXA 7000 series are provided in [15]. However, it is important to mention that due to the technical limitations of the measuring equipment, it was not possible to connect the engine-out sampling point with a heated line. The line was insulated but not actively heated and we cannot exclude that some water condensation might have occurred.
Additionally, VELA 2 is also equipped with a laboratory-grade Fourier transform infrared spectrometer (FTIR; Nicolet Antaris IGS Analyzer—Thermo Electron Scientific Instruments LLC, Madison, WI, USA), here used for measuring NOx concentrations at the tailpipe along with a MEXA 7400. This SESAM FTIR is specifically designed for vehicle emissions measurements and uses a heated PTFE sampling line (191 °C). The sampling rate is 6.5 L/min. This FTIR device consists of a cell with a 2 m optical path and a Michelson interferometer with a 0.5 cm−1 spectral resolution and 650–4000 cm−1 spectral range. It uses a liquid-nitrogen-cooled mercury cadmium telluride (MCT) detector. Additional details about this technique are provided elsewhere [16,17].
The exhaust flow rate of Vehicle 1 was calculated as the difference between the total flow of the constant volume sampler (CVS), measured with a Venturi system, and the total flow of the dilution air introduced into the tunnel, measured with a smooth approach orifice (SAO).
OBD signals, including those related to NOx sensors and the mass air flow rate, were recorded at the OBD port of the vehicle in the laboratory by means of an in-house developed tool and through the reference PEMS during the on-road tests.
On-road tests were performed at the JRC on Vehicle 2 using an AVL MOVE (AVL, Graz, Austria) PEMS. This system consists of a tailpipe attachment, an exhaust flow meter (EFM), heated exhaust sampling lines, exhaust gas analysers, a GPS, and a weather station for ambient temperature and humidity measurements. The AVL MOVE gas analyser measured exhaust gas concentrations of NOx by non-dispersive ultra-violet spectroscopy (NDUV). The EFM (2.5″) uses a Pitot tube to measure the exhaust mass flow rate. All relevant emissions data were recorded at a frequency of 1 Hz. Additional details on the current technique can be found elsewhere [18]. The AVL MOVE PEMS is also equipped with a data logger connected to the vehicle OBD port. The logger allowed for the retrieval of all the data published by the vehicle at the OBD port, including the NOx sensors and mass air flow rate signals at engine-out and tailpipe-out.

3. Results and Discussion

3.1. Flow Rate Validation

Figure 2 shows the results of the correlation between the exhaust flow rate measured experimentally by two different systems (i.e., obtained by subtracting the dilution air flow from the total CVS flow rate in the laboratory or with the EFM of a PEMS during an on-road test) and the mass air flow (MAF) signal acquired at the vehicles’ OBD ports. It is worth mentioning that the MAF was the only signal related to flow rate available for both vehicles and easily accessible via standard OBD. The whole set of time-aligned 1 Hz measurements, acquired during different double WLTCs with Vehicle 1, was used for the laboratory intercomparison. This included low ambient temperature (0 °C) and cold tests (for additional details refer to the Materials and Methods section). Similarly, for the on-road part, all the tests performed on Vehicle 2 were used. The left-hand panel in Figure 2 shows that the MAF signal and flow rate measured in the laboratory correlated excellently, with an R2 > 0.9 and very good linearity, with an angular coefficient and y-intercept equal to 1.01 ± 0.00, whereby the y-intercept was not forced to zero in the linear regression (neither here nor in the following regressions). Similarly, the right-hand panel shows that the MAF signal and flow rate measured with the PEMS also correlate nicely, with an R2 > 0.9 and equally good linearity, with an angular coefficient and y-intercept equal to 0.99 ± 0.00. Interestingly, data points were qualitatively more dispersed in the laboratory case, which is somewhat unexpected considering that the PEMS has an accuracy different to that of the laboratory equipment. However, two things must be noticed: (i) two different vehicles (thus with different sensors) were tested in very different conditions (i.e., laboratory and on-road); and (ii) two different systems to acquire the OBD signals were used in the two cases, as detailed in the Materials and Methods section. Overall, the MAF signal acquired from OBD is in good agreement with two totally different and independent experimental measurement systems, supporting the possibility of using it as a reliable indicator of the vehicle exhaust flow rate.

3.2. NOx Sensor Validation

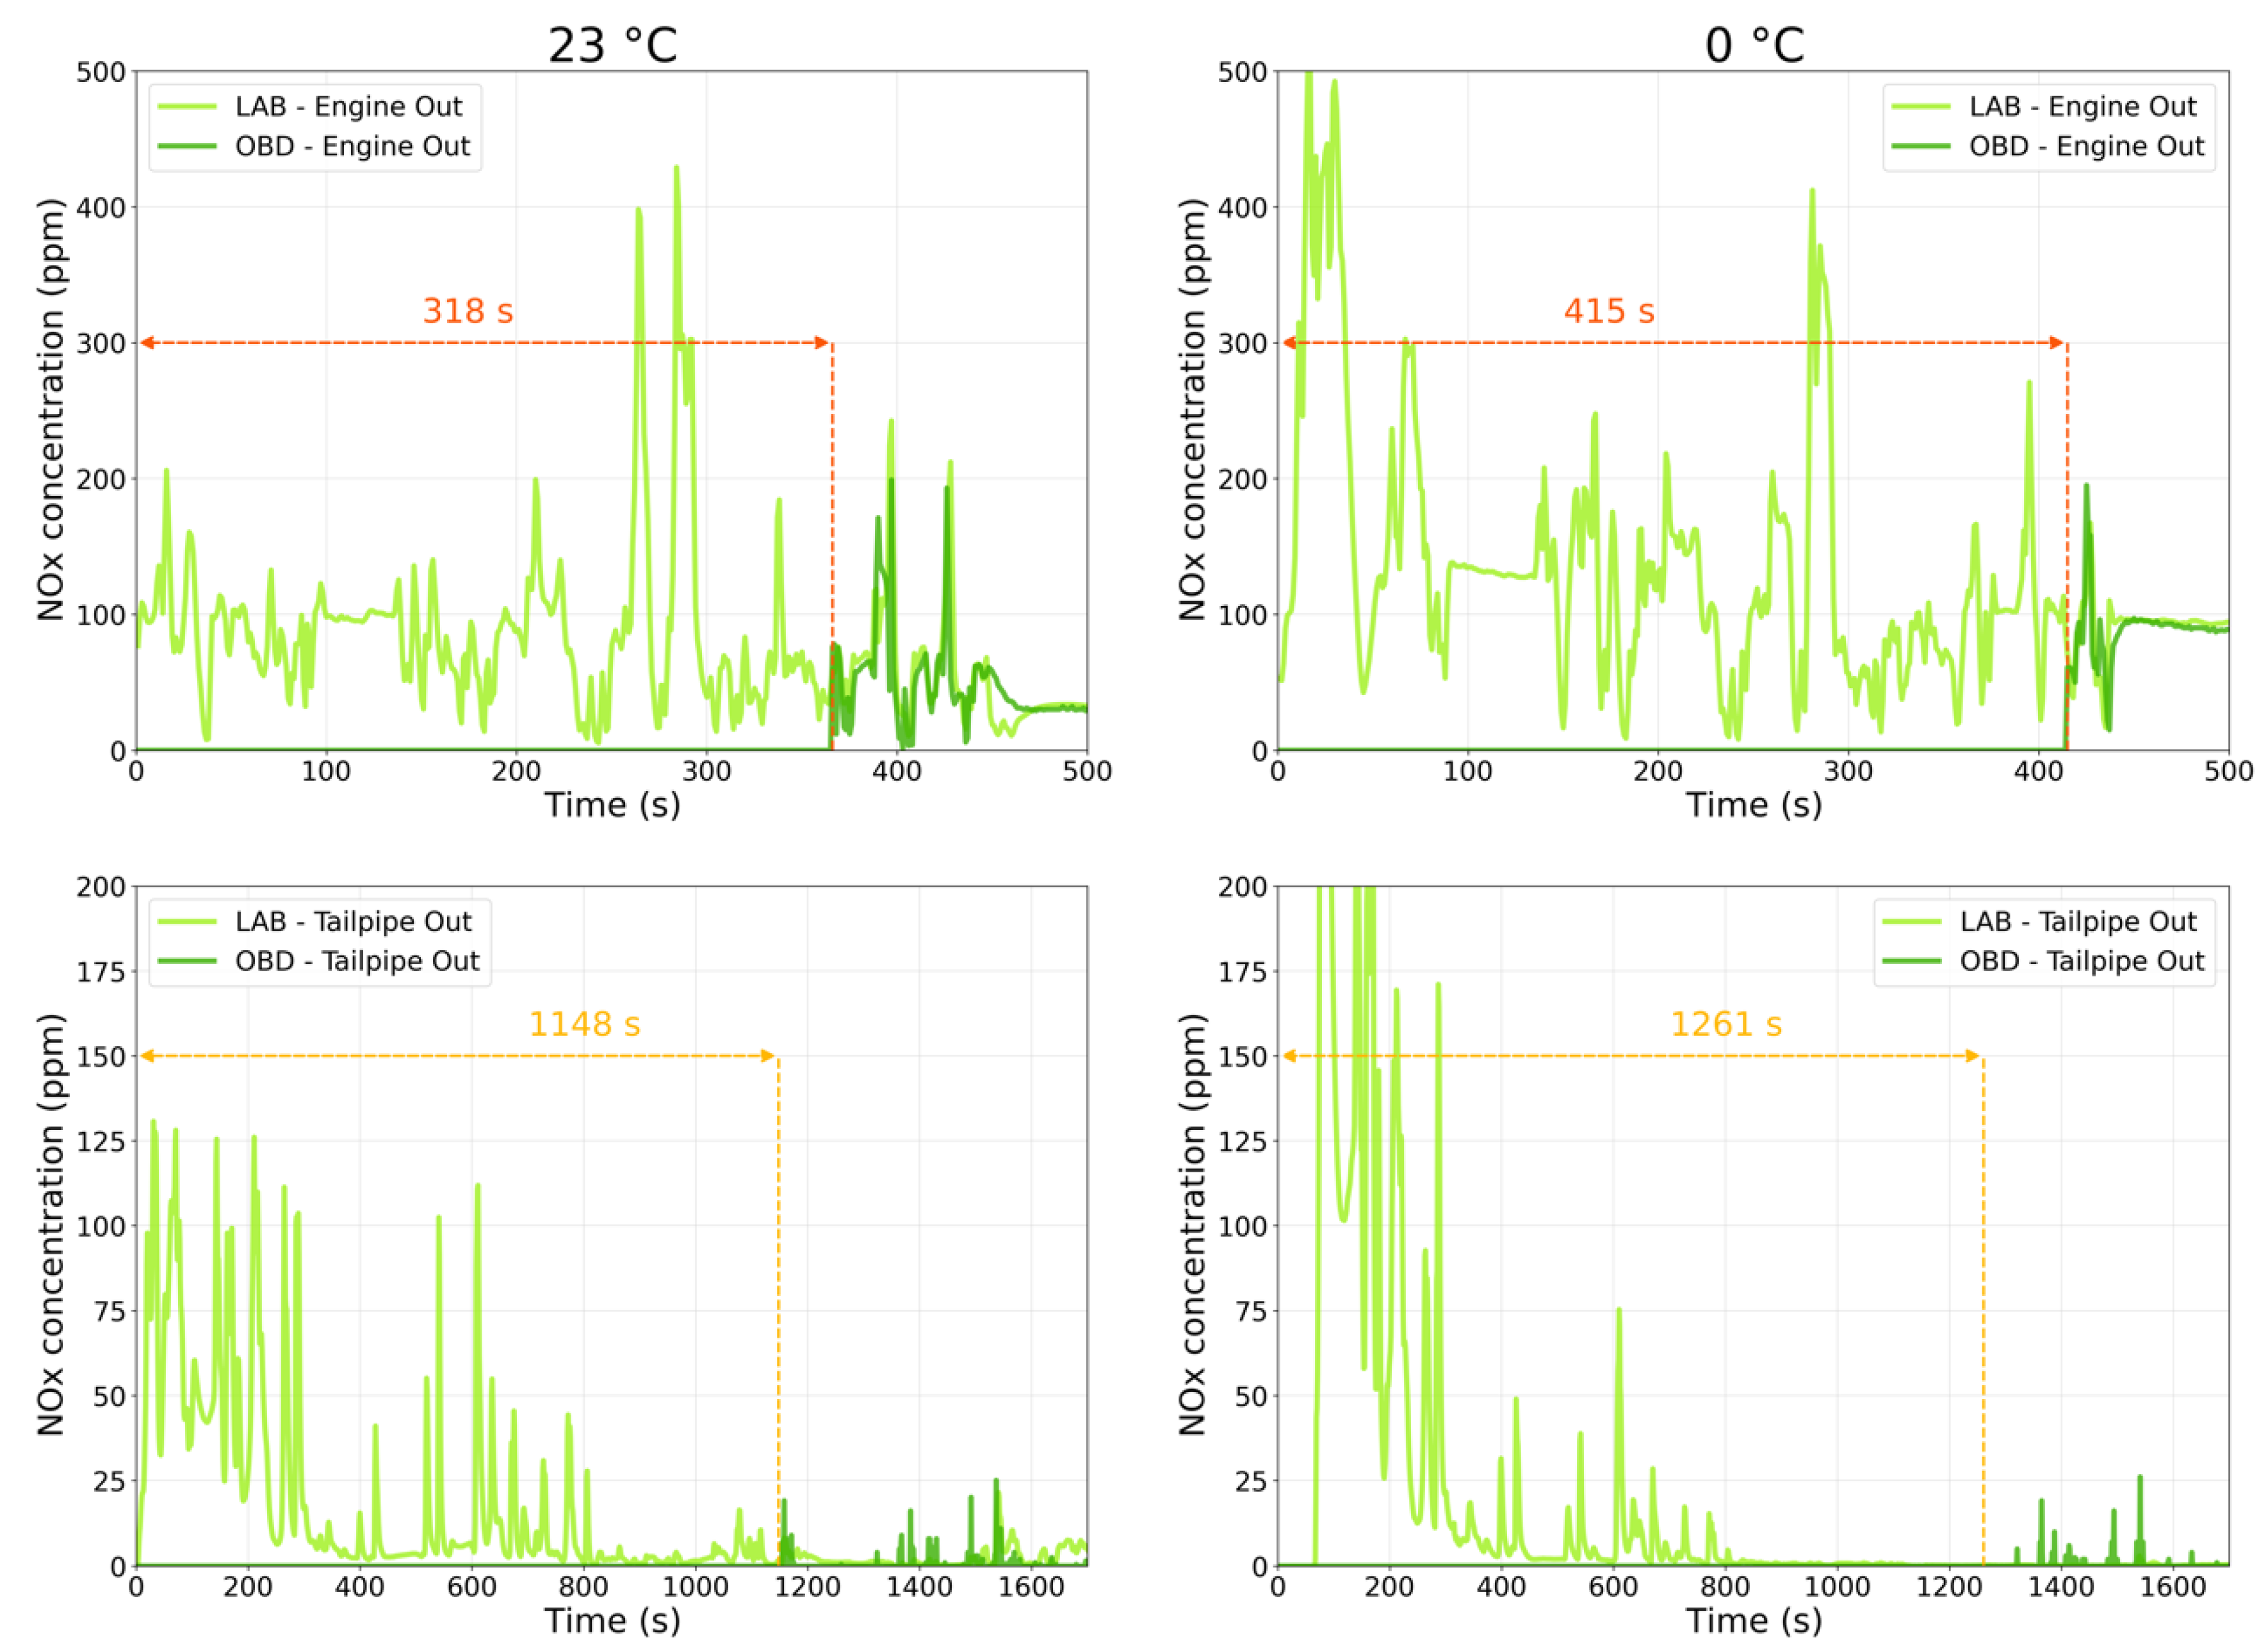
Figure 3 shows the comparison between the NOx concentration signal acquired through the OBD port of Vehicle 1 during two cold WLTC cycles at different temperatures, both at engine-out and at tailpipe, and the values measured by laboratory instruments. Two important aspects should be highlighted; first of all, there was a consistent delay between the start of the test and the moment a valid signal was available at the OBD port. This delay is both a function of the temperature and the position of the considered sensor, and went from 318 s in the most favourable situation (engine-out NOx sensor, test temperature equal to 23 °C) to as much as 1261 s in the least favourable (tailpipe NOx sensor, test temperature equal to 0 °C). This behaviour is associated with the time required for the sensor to reach the optimal operating temperature, as also discussed in [12,19,20]. Li et al. determined that 200–800 s of NOx data were lost during the period in which the temperature was below the sensor activation temperature.
This additional induction period may be relevant in the context of on-board real-time monitoring of vehicles emissions, where there is an obvious interest in having sensor readings as soon as the engine is started in order to properly capture challenging situations like the cold start. However, in case sensors are used for monitoring real-time after-treatment system malfunctions, this limitation could be less relevant. In fact, in the most common case of diesel vehicles equipped with SCR units, a comparable amount of time is also required for these units to reach their optimal operational temperature. Therefore, in such cases, cold start events are also less relevant to the real-time monitoring of ATS performances.
The plots reported in Figure 4 show the correlation between OBD signals and 1-Hz laboratory measurements at engine-out (upper graphs of each figure) and tailpipe (lower graphs of each figure) using different correlation methods. The left-hand-side graphs show the direct correlations with raw 1-Hz data, while in the right-hand-side panels, results obtained using moving average windows (MAWs) of 10 s are shown. The whole set of time-aligned 1 Hz measurements acquired during different hot WLTCs with Vehicle 1 was used for the laboratory intercomparison, except for one hot WLTC test at 23 °C, for which the tailpipe sensor was not available.
The direct 1 Hz correlation between engine-out signals was rather poor, with an R2 close to 0.7. The angular coefficient and y-intercept of the regression line are equal to 0.77 + 12.26. This could be due to the high dynamicity of the flow at the engine-out position and the relatively poor dynamic response of the on-board sensors. It could also be due to the system used to acquire the OBD signal in the laboratory setting, as already discussed above. Another possible cause of the poor correlation may be the difficulty in accurately measuring engine-out concentrations with laboratory equipment due to water condensation on the sampling lines, as already explained in the Materials and Method section above. The correlation largely improved when a 10 s MAW approach was used. In this case, the R2 increased to above 0.8 and the linearity also improved, with an angular coefficient equal to 0.80 and a y-intercept of 8.07. It should be mentioned here that from both a real-time vehicle emissions perspective or an after-treatment malfunction monitoring perspective, the engine-out position is the less relevant one. For this reason, in the following paragraphs we have focussed the analysis on tailpipe measurements.
The direct 1 Hz correlation between tailpipe signals was already significantly better than that between the engine-out data, even without the use of a MAW. Indeed, in this case R2 > 0.9, with excellent linearity. The angular coefficient and y-intercept of the regression line were equal to 0.99 and 0.24, respectively. This is in good agreement with a previous study conducted with a Euro VI heavy-duty vehicle [20]. Despite some qualitatively relevant scatter, these results seem to support the possibility of using on-board sensors as reliable indicators of vehicle NOx emissions at the tailpipe. The situation further improved when a 10 s MAW was applied. In this case, both the R2 and the overall scatter improved, with an excellent agreement between state-of-the-art laboratory equipment and on-board NOx sensors that are already commercially available. Tailpipe NOx measurements are less dispersed. On the one hand, this may be due to the fact that less water condensation is likely to occur on heated tailpipe sampling lines, as already discussed, and on the other hand, this may be related to the faster signal dynamics at engine-out, which are more complex to closely follow with an on-board sensor.

3.3. Mass Emissions Comparison

Figure 5 shows the average of the cumulative tailpipe NOx emissions for Vehicle 1, calculated through multiple approaches over two different hot WLTC cycles. LAB emissions were obtained using both flow rate and concentration measured by the already described standard laboratory equipment. To compute FTIR emissions, an independent measurement realised with a lab-grade FTIR spectrometer was used instead of the one measured with the standard laboratory instrument, although the same flow rate was used in the LAB and FTIR cases. The two OBD bars were obtained using the NOx concentration measured by the on-board tailpipe sensors and either the same flow rate used for the LAB case or the flow rate obtained from the MAF signal acquired at the standard OBD port.
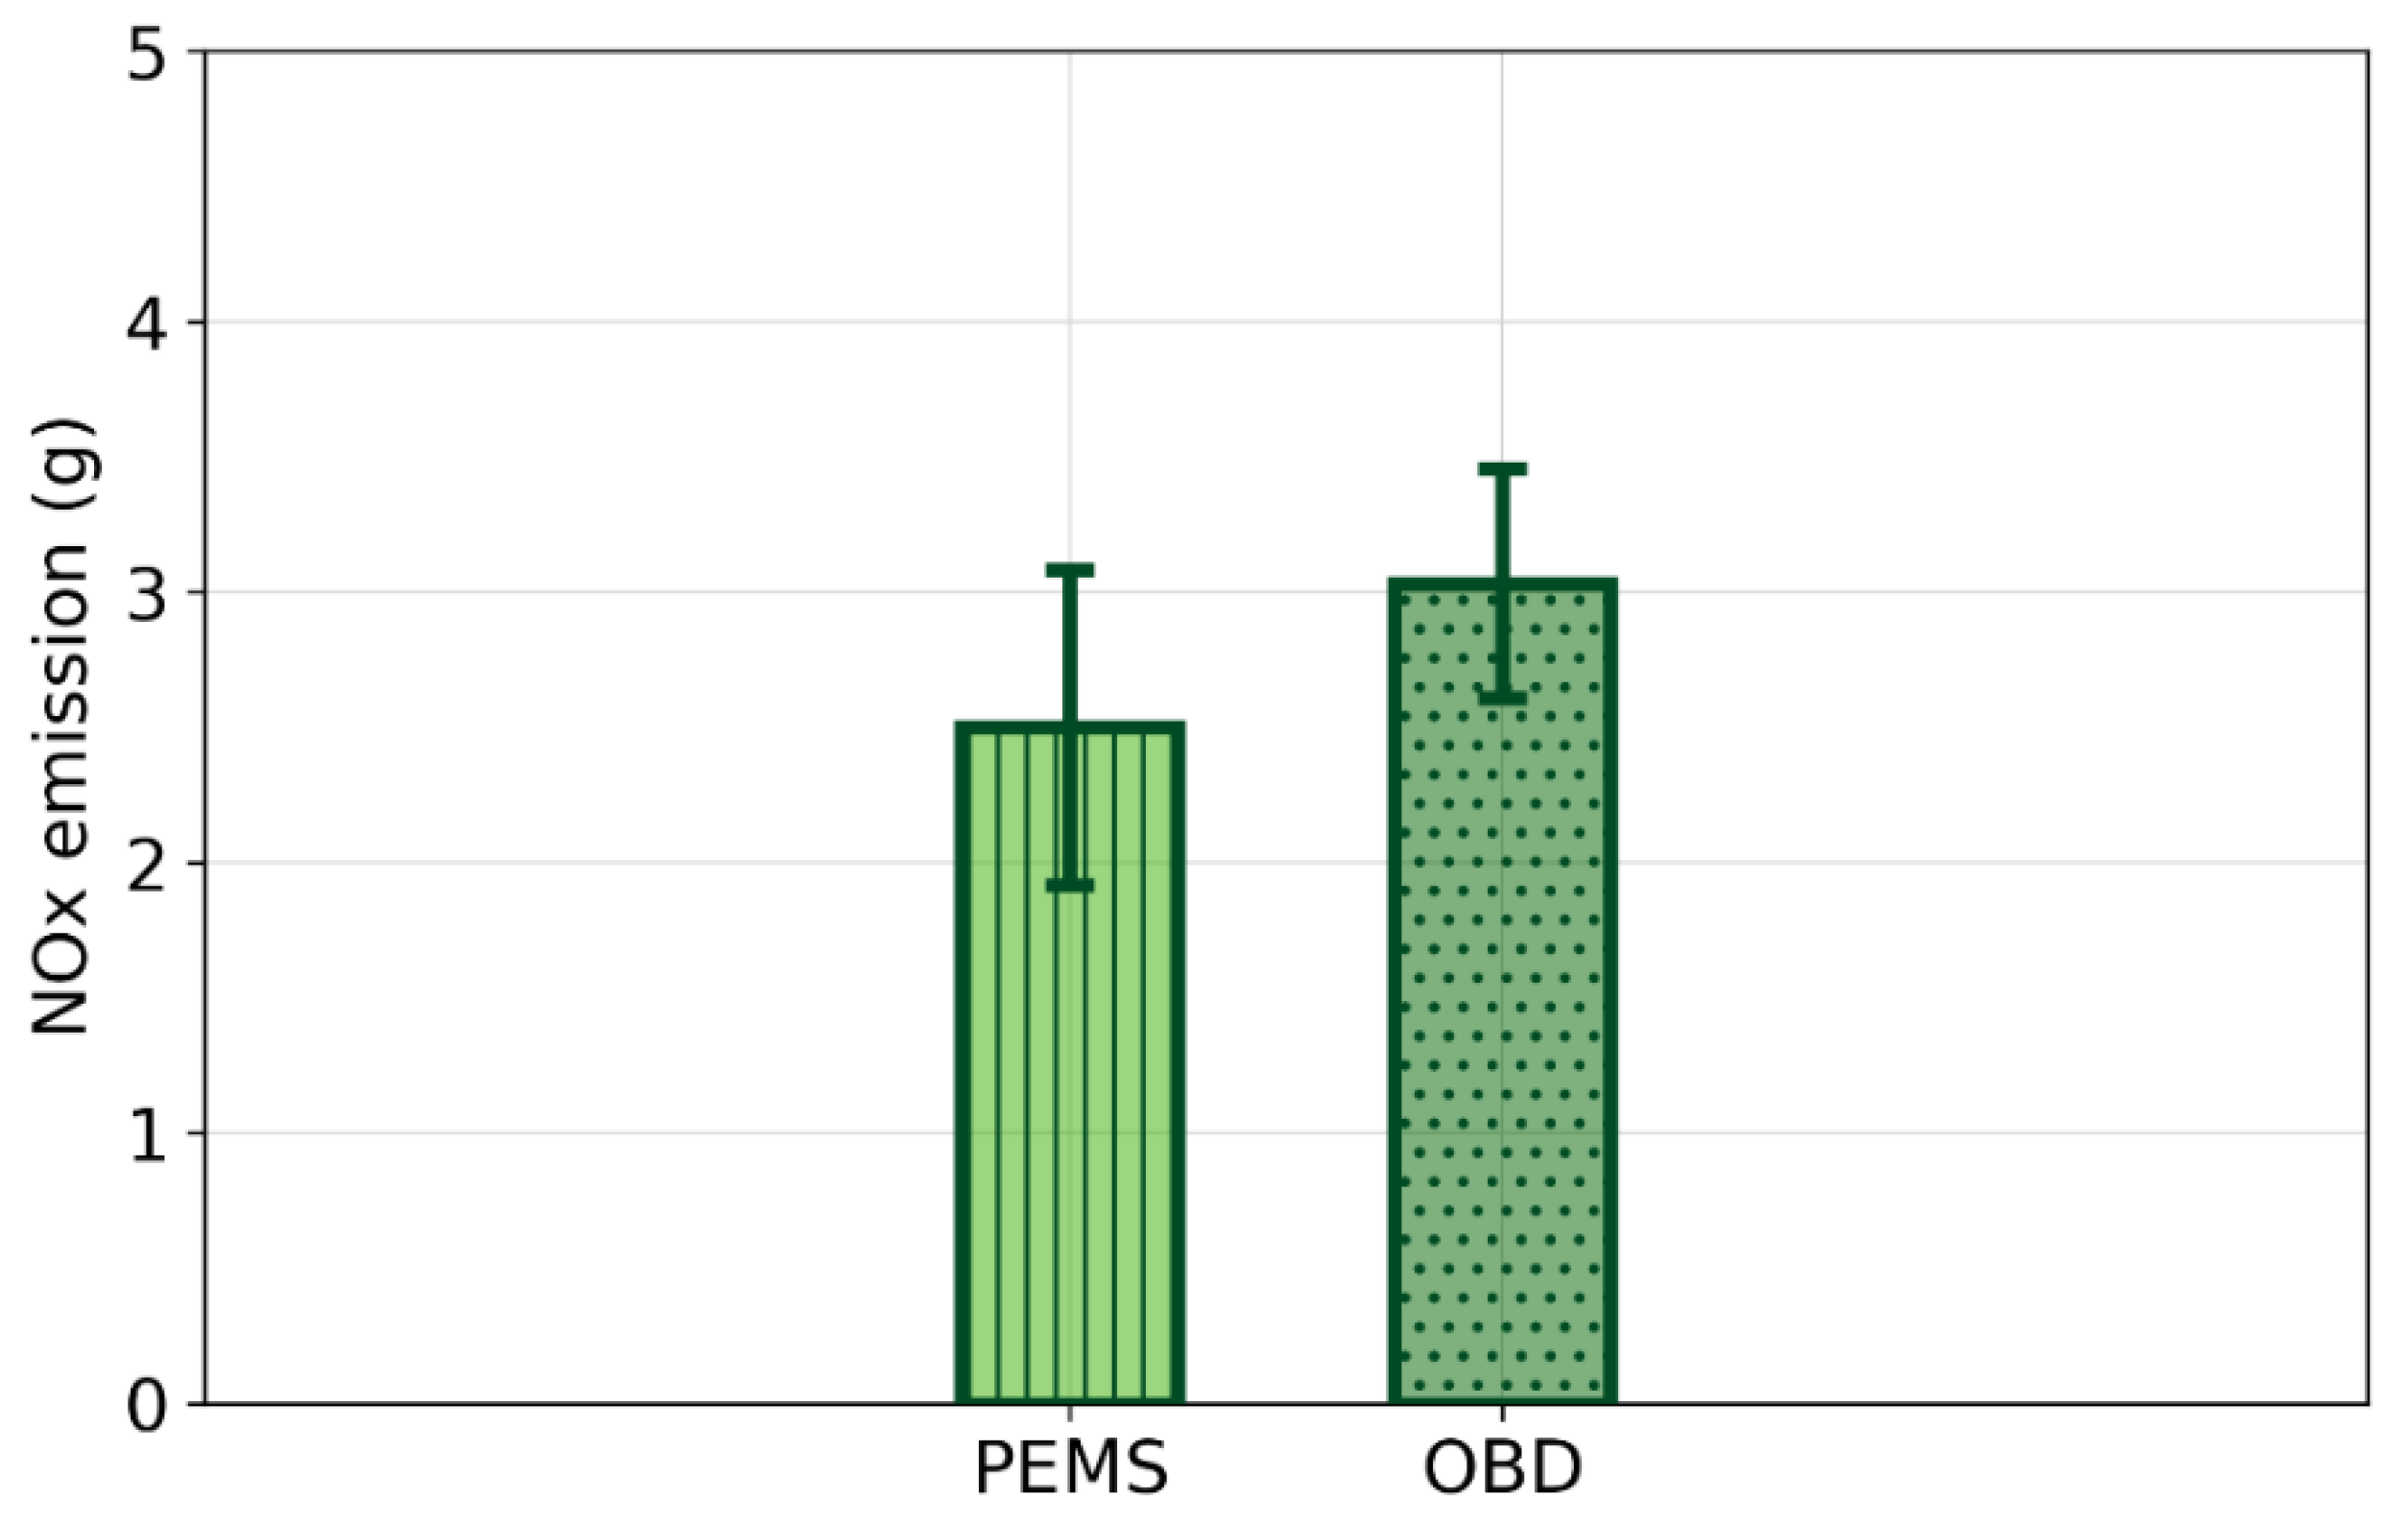
First, it can be noticed that the two cumulative emissions calculated using the NOx concentration signal available at the OBD port are very similar, independently of the flow rate used (laboratory or recorded at OBD), with a difference of only 1%. This suggests that there is a minor deviation between the flow rates measured by the two methods, at least with the specific vehicle tested, as also demonstrated by the results already presented in Figure 1. The deviations increase when the results are compared with those achieved by two different laboratory-grade instruments, reaching 23% when compared to the FTIR results and 34% when compared to the standard analysis by the laboratory-grade instruments. When comparing these results with the on-road tests performed on Vehicle 2 and shown in Figure 6, one realises that in this case, the deviation between the on-board sensors and the reference PEMS instrumentation is only 21%. This can be considered as excellent agreement when one considers the intrinsic complexities of an on-road test, such as higher dynamicity and variabilities, longer duration and other factors. To put these deviations into the right context, a few details should be considered. First, these results were obtained using information available at the OBD ports of two different vehicles and based exclusively on already available on-board components, with no need for additional expensive instruments. Obviously, on-board sensors are likely to behave differently for the two investigated vehicles, which were incidentally of different brands. Secondly, as already discussed, the OBD signals were acquired with two different acquisition systems in the laboratory and on road. These considerations may help to explain the differences observed among the various tests.
It should be pointed out here that in the present work, emissions were intentionally measured with on-board sensors on different vehicles and under different conditions in order to give a reasonable idea of the general deviations that can be estimated for this kind of approach when compared with the reference methods, i.e., laboratory and PEMS testing. The discrepancies reported in this section are comparable to those nowadays allowed between laboratory and on-road measurements in the current EU Regulation [14].
Finally, we have also tested the performance of the on-board sensors during a laboratory test in which a diesel particulate filter regeneration event occurred. These results are reported in Figure 7. In this case, the deviation between on-board sensor and laboratory data was approximately 7%. During the regeneration, NOx concentrations were on the order of approximately 110 ppm (not shown). Interestingly, the on-board sensor was perfectly capable of operating correctly, with comparable accuracy even in these conditions, where much higher NOx concentrations were observed relative to those measured during the normal hot operation of the vehicle. The bar plot in Figure 7 clearly shows that the current on-board NOx sensor is indeed able to identify a situation where NOx emissions are higher than normally measured. This point is remarkable, because such high NOx concentrations are expected, for example, in the event of an after-treatment system malfunction. Therefore, this suggests that such a scenario can already be correctly identified by on-board sensors currently used in modern vehicles.

4. Conclusions

In this work, real-time on-board monitoring of NOx emissions was performed on two Euro 6d-ISC diesel light duty vehicles in the laboratory and on-road. Recorded signals were compared with data collected with state-of-the-art laboratory-grade instruments or PEMS during the same tests. The following conclusions can be drawn:
  • Altogether, OBM signals were in fair agreement with emissions measured by PEMS and laboratory equipment.
  • OBM signals were available only after the sensor warm-up time (in this study lasting from 318 s to 1261 s). The warm-up time needed depended on the sensor position and ambient temperature.
  • OBM exhaust flow data correlated well with both laboratory-measured (CVS) and PEMS-measured flow rates.
  • The correlation between 1 Hz recorded tailpipe OBM NOx concentration data and the laboratory measurements can be improved using moving average window statistics.
  • Cumulative emissions calculated from the data measured by default on-board sensors are in fair agreement with both state-of-the-art laboratory and PEMS instruments, especially considering the relative simplicity of the measuring device.
  • OBM results obtained during a DPF regeneration event were consistent with the laboratory reference, indicating that it would be possible to monitor malfunctioning ATSs by using properly functioning on-board sensors.
Overall, the present results showed that with the exception of cold-start emissions, OBM is a promising approach for the real-time on-board detection of NOx emissions in vehicles of the type investigated here, and also for recording possible high NOx concentration events (such as those induced by a malfunctioning ATS).
It is essential to extend the present type of analysis to various kinds of vehicles and build up a sounder database in order to highlight the main advantages and shortcomings of the OBM approach, including its extension to other pollutants.

Author Contributions

Conceptualization, T.S. and R.S.-B.; methodology, T.S. and R.S.-B.; formal analysis, T.S., C.F., J.F., R.S.-B. and D.M.; data curation, T.S., C.F. and J.F.; writing—original draft preparation, T.S., C.F., J.F., R.S.-B. and D.M.; writing—review and editing, T.S., C.F., J.F., R.S.-B. and D.M.; visualization, C.F. and J.F.; supervision, D.M. All authors have read and agreed to the published version of the manuscript.

Funding

This research received no external funding.

Acknowledgments

The authors would like to acknowledge the support and collaboration of A. Bonamin (AVL Italia) for their technical assistance in the management of laboratory and PEMS equipment, P. Bonnel (JRC) for his advice and supervision, F. Forloni (JRC) for his help in data acquisition and analysis, V. Valverde Morales (JRC) for his scientific advice and for managing some of the testing plans, S. Quadri for his advice, and the whole JRC-VELA staff for the technical and administrative support provided.

Conflicts of Interest

The authors declare no conflict of interest. The opinions expressed in this manuscript are those of the authors and should in no way be considered to represent an official opinion of the European Commission. Mention of trade names or commercial products does not constitute endorsement or recommendation by the European Commission or the authors.

References

  1. Selleri, T.; Melas, A.D.; Joshi, A.; Manara, D.; Perujo, A.; Suarez-Bertoa, R. An overview of lean exhaust denox aftertreatment technologies and nox emission regulations in the european union. Catalysts 2021, 11, 404. [Google Scholar] [CrossRef]
  2. COM(2019) 640 Final: Communication from the Commission to the European Parliament, the European Council, the Council, the European Economic and Social Committee and the Committee of the Regions: The European Green Deal. Available online: https://eur-lex.europa.eu/legal-content/EN/TXT/?uri=COM%3A2019%3A640%3AFIN (accessed on 23 October 2022).
  3. Proposal for a Regulation of the European Parliament and of the Council on Type-Approval of Motor Vehicles and Engines and of Systems, Components and Separate Technical Units Intended for Such Vehicles, with Respect to Their Emissions and Battery Durability (Euro 7) and Repealing Regulations (EC) No 715/2007 and (EC) No 595/2009, Brussels, 10.11.2022 COM(2022) 586 Final 2022/0365 (COD). Available online: https://single-market-economy.ec.europa.eu/publications/euro-7-standard-proposal_en (accessed on 23 October 2022).
  4. Regulation (EU) 2019/631 of the European Parliament and of the Council of 17 April 2019 Setting CO2 Emission Performance Standards for New Passenger Cars and for New Light Commercial Vehicles, and Repealing Regulations (EC) No 443/2009 and (EU) No 510/2011 (Recast) (Text with EEA Relevance.). Available online: http://data.europa.eu/eli/reg/2019/631/oj (accessed on 23 October 2022).
  5. Environmental Protection Agency (EPA). Control of Air Pollution From New Motor Vehicles: Heavy-Duty Engine and Vehicle Standards. Federal Register Vol. 87, No. 59, Monday, 28 March 2022. Proposed Rules. Available online: https://www.federalregister.gov/documents/2022/03/28/2022-04934/control-of-air-pollution-from-new-motor-vehicles-heavy-duty-engine-and-vehicle-standards (accessed on 23 October 2022).
  6. California Air Resources Board. CARB Gets ‘REAL’ to Further Cut Pollution from Diesel and Gas Vehicles. 2018. Available online: https://ww2.arb.ca.gov/news/carb-gets-real-further-cut-pollution-diesel-and-gas-vehicles (accessed on 23 October 2022).
  7. International Council on Clean Transportation (ICCT). China’s Stage VI Emission Standard for Heavy-Duty Vehicles (Final Rule). Available online: https://theicct.org/wp-content/uploads/2021/06/China_VI_Policy_Update_20180720.pdf (accessed on 23 October 2022).
  8. Beijing Municipal Bureau of Ecological Environment, Measures of the Installation and Management of Vehicle Remote Emission Terminals on Beijing Municipal Mobile Sources. Available online: http://lawinfochina.com/display.aspx?id=37236&lib=law&EncodingName=big5 (accessed on 23 October 2022).
  9. Tan, Y.; Henderick, P.; Yoon, S.; Herner, J.; Montes, T.; Boriboonsomsin, K.; Johnson, K.; Scora, G.; Sandez, D.; Durbin, T.D. On-Board Sensor-Based NOx Emissions from Heavy-Duty Diesel Vehicles. Environ. Sci. Technol. 2019, 53, 5504–5511. [Google Scholar] [CrossRef] [PubMed] [Green Version]
  10. Cheng, Y.; He, L.; He, W.; Zhao, P.; Wang, P.; Zhao, J.; Zhang, K.; Zhang, S. Evaluating on-board sensing-based nitrogen oxides (NOX) emissions from a heavy-duty diesel truck in China. Atmos. Environ. 2019, 216, 116908. [Google Scholar] [CrossRef]
  11. Mendoza-Villafuerte, P.; Suarez-Bertoa, R.; Giechaskiel, B.; Riccobono, F.; Bulgheroni, C.; Astorga, C.; Perujo, A. NOx, NH3, N2O and PN real driving emissions from a Euro VI heavy-duty vehicle. Impact of regulatory on-road test conditions on emissions. Sci. Total Environ. 2017, 609, 546–555. [Google Scholar] [CrossRef]
  12. Li, C.; Ma, T.; Karavalakis, G.; Johnson, K.C.; Durbin, T.D. Evaluation of On-Board Sensor-Based NOx emissions from the heavy-duty vehicles in an inspection and Maintenance program. Emiss. Control. Sci. Technol. 2022; In press. [Google Scholar] [CrossRef]
  13. Zhang, S.; Zhao, P.; He, L.; Yang, Y.; Liu, B.; He, W.; Cheng, Y.; Liu, Y.; Liu, S.; Hu, Q.; et al. On-board monitoring (OBM) for heavy-duty vehicle emissions in China: Regulations, early-stage evaluation and policy recommendations. Sci. Total Environ. 2020, 731, 139045. [Google Scholar] [CrossRef]
  14. Commission Regulation (EU) 2017/1151 of 1 June 2017 supplementing Regulation (EC) No 715/2007 of the European Parliament and of the Council on Type-Approval of Motor Vehicles with Respect to Emissions from Light Passenger and Commercial Vehicles (Euro 5 and Euro 6) and on Access to Vehicle Repair and Maintenance Information, Amending Directive 2007/46/EC of the European Parliament and of the Council, Commission Regulation (EC) No 692/2008 and Commission Regulation (EU) No 1230/2012 and Repealing Commission Regulation (EC) No 692/2008. Available online: http://data.europa.eu/eli/reg/2017/1151/2020-01-25 (accessed on 23 October 2022).
  15. Sherman, M.T.; Chase, R.; Mauti, A.; Rauker, Z.; Silvis, W. Evaluation of Horiba MEXA 7000 Bag Bench Analyzers for Single Range Operation; SAE Technical Paper 1999-01-0147; SAE International: Warrendale, PN, USA, 1999. [Google Scholar] [CrossRef]
  16. Suarez-Bertoa, R.; Astorga, C. Impact of cold temperature on Euro 6 passenger car emissions. Environ. Pollut. 2018, 234, 318–329. [Google Scholar] [CrossRef] [PubMed]
  17. Suarez-Bertoa, R.; Selleri, T.; Gioria, R.; Melas, A.D.; Ferrarese, C.; Franzetti, J.; Arlitt, B.; Nagura, N.; Hanada, T.; Giechaskiel, B. Real-Time Measurements of Formaldehyde Emissions from Modern Vehicles. Energies 2022, 15, 7680. [Google Scholar] [CrossRef]
  18. Suarez-Bertoa, R.; Gioria, R.; Selleri, T.; Lilova, V.; Melas, A.; Onishi, Y.; Franzetti, J.; Forloni, F.; Perujo, A. NH3 and N2O Real World Emissions Measurement from a CNG Heavy Duty Vehicle Using On-Board Measurement Systems. Appl. Sci. 2021, 11, 10055. [Google Scholar] [CrossRef]
  19. Kato, N.; Kurachi, H.; Hamada, Y. Thick film ZrO2 NOx sensor for the measurement of low NOx concentration. SAE Trans. 1998, 107, 312–320. [Google Scholar] [CrossRef]
  20. Selleri, T.; Gioria, R.; Melas, A.D.; Giechaskiel, B.; Forloni, F.; Mendoza Villafuerte, P.; Demuynck, J.; Bosteels, D.; Wilkes, T.; Simons, O.; et al. Measuring Emissions from a Demonstrator Heavy-Duty Diesel Vehicle under Real-World Conditions—Moving Forward to Euro VII. Catalysts 2022, 12, 184. [Google Scholar] [CrossRef]
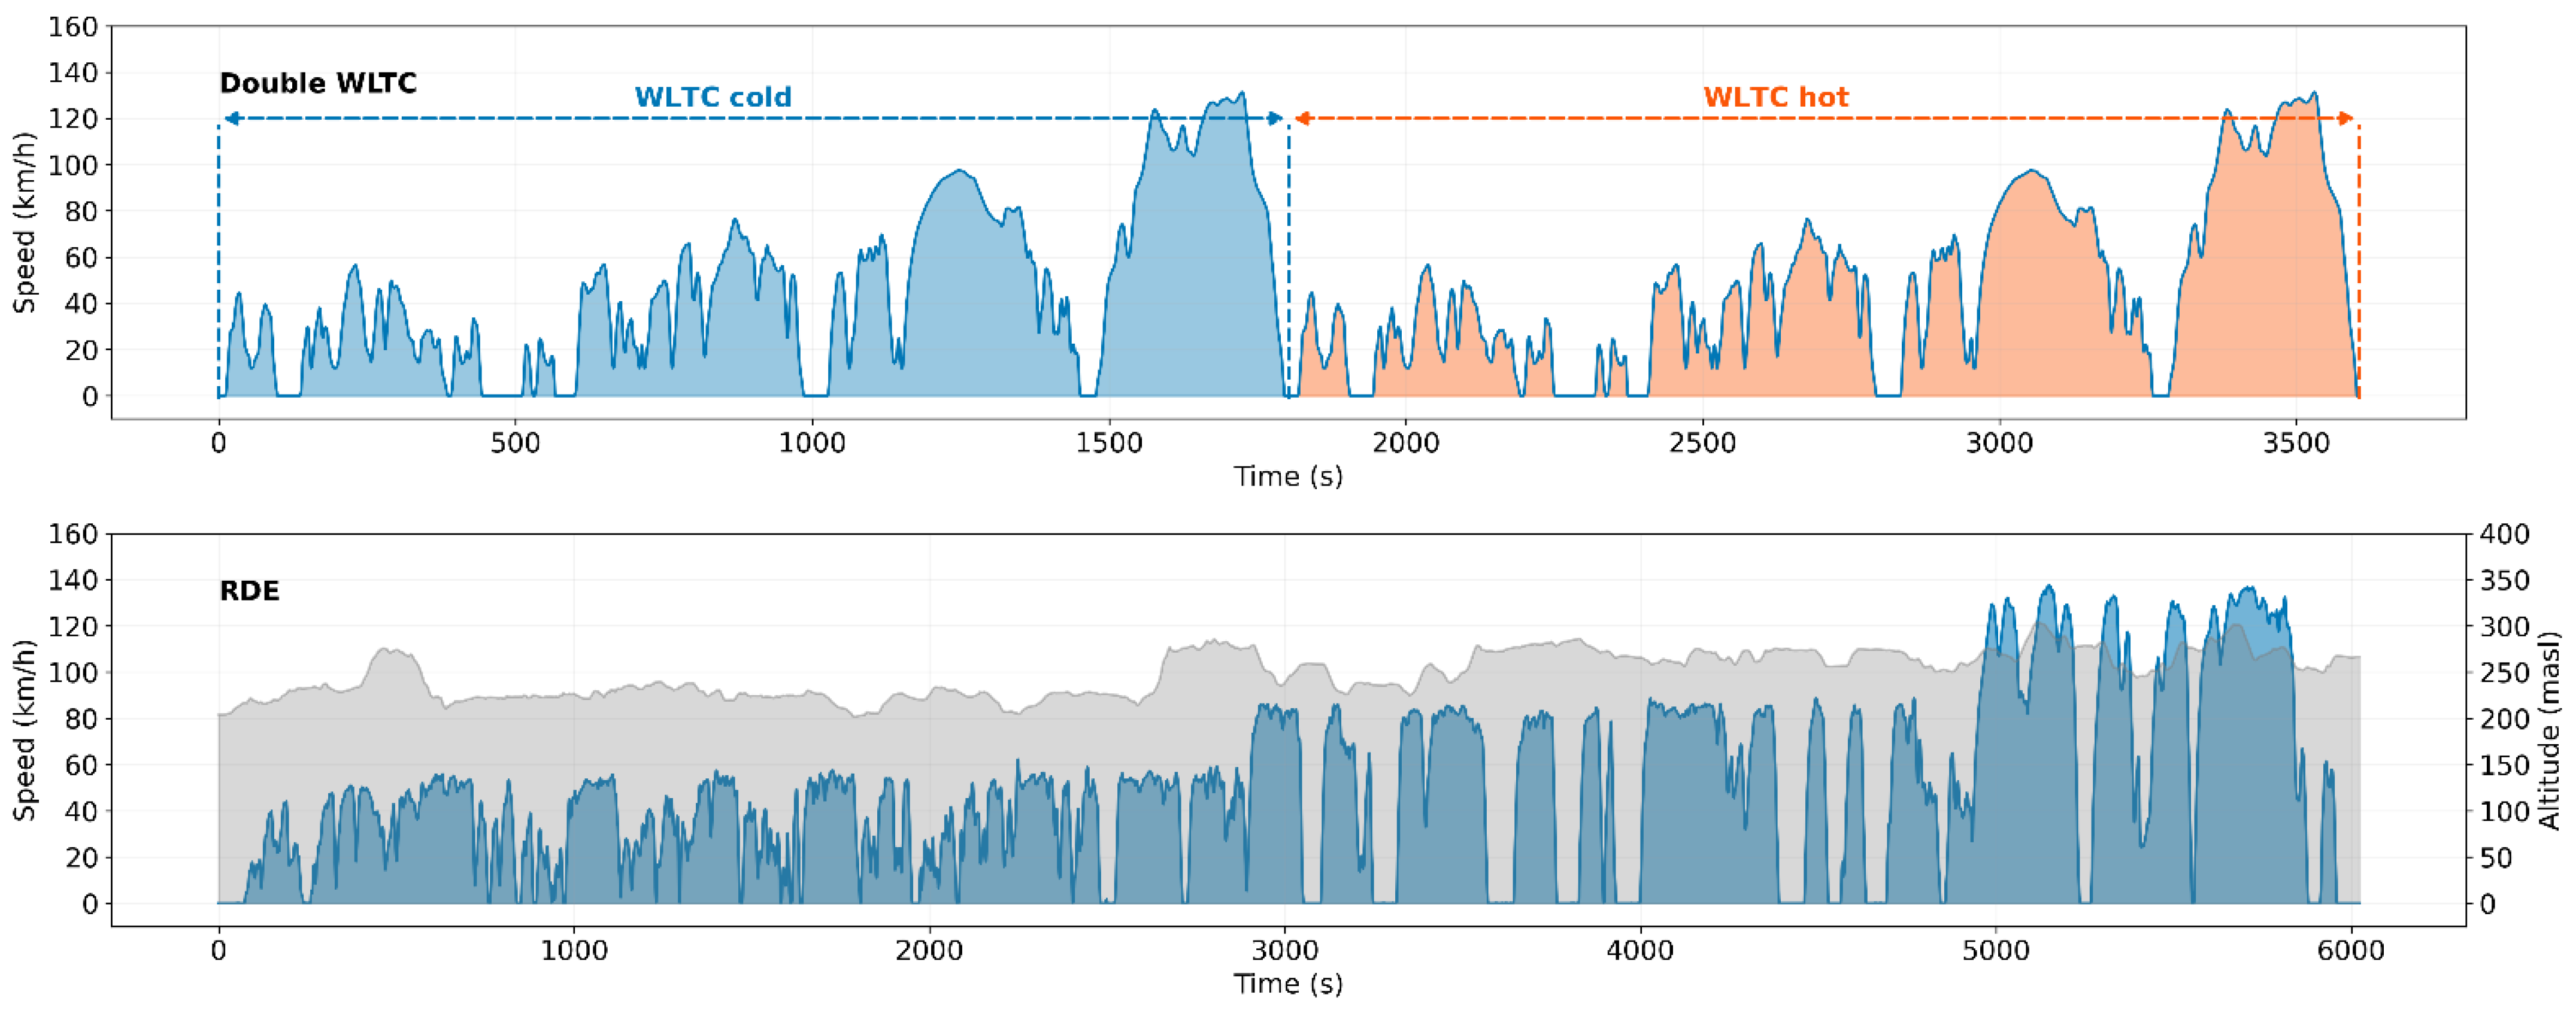
Figure 1. Speed profile of the double WLTC tests (top panel) and the on-road tests (bottom panel). The bottom panel’s shaded grey area indicates the altitude profile during the RDE test.
Energies 15 08766 g001
Figure 2. (Left panel) Correlation between MAF signal from OBD and flow rate measured in the laboratory (difference between CVS and dilution flow rate) from all the WLTC tests performed. (Right panel) Correlation between MAF and PEMS flow rate from all the on-road tests performed.
Energies 15 08766 g002
Figure 3. Top panels: engine-out NOx concentration signals from the OBD port and as measured in the laboratory (LAB) at 23 °C and 0 °C. Bottom panels: tailpipe-out NOx concentration signals from the OBD port and as measured in the laboratory (LAB) at 23 °C and 0 °C.
Energies 15 08766 g003
Figure 4. Plots showing the correlation between OBD signals and 1 Hz laboratory measurements at the engine-out (top graphs) and tailpipe-out (bottom graphs) of Vehicle 1. Different correlation methods are compared: 1 Hz data in the left-hand-side panels and a 10 s moving average window (MAW) in the right-hand-side panels.
Energies 15 08766 g004
Figure 5. Vehicle 1 average of the cumulative NOx emissions measured at tailpipe with different methods over two different hot WLTC cycles. LAB, FTIR and OBD indicate that the NOx concentration used was measured with standard laboratory equipment, a lab-grade FTIR spectrometer or the on-board NOx sensor, respectively. The two different pattern fills indicate which exhaust flow measurement was used, as indicated in the legend.
Energies 15 08766 g005
Figure 6. Vehicle 2 average of the cumulative NOx emissions measured at tailpipe with a portable emission measurement system (PEMS) and with the on-board NOx sensor (OBD) in 2 RDE-compliant tests.
Energies 15 08766 g006
Figure 7. The cumulative NOx emissions measured in the laboratory and by OBM in WLTC cycles performed under normal SCR functioning conditions and under DPF regeneration conditions.
Energies 15 08766 g007
Table 1. Summary of vehicles tested.
Vehicle IDVehicle 1Vehicle 2
FuelDieselDiesel
InjectionDIDI
ICE displacement (cm3)19681995
Emission control systemEGR, DOC, DPF, SCR, ASCEGR, DOC, DPF, SCR *
Registration20192021
Mileage (km)~52,000~22,000
Vehicle categoryN1 Class IIIN1 Class III
Euro standardEuro 6d-TEMP-EVAP-ISCEuro 6d-ISC-FCM
ICE: internal combustion engine, DI: direct injection, EGR: exhaust gas recirculation, DOC: diesel oxidation catalyst, DPF: diesel particulate filter, SCR: selective catalytic reduction, ASC: ammonia slip catalyst. * Given the low NH3 emissions (not shown in this study) over all the tests performed with this vehicle, we assumed that both vehicles were also equipped with an ASC.
Publisher’s Note: MDPI stays neutral with regard to jurisdictional claims in published maps and institutional affiliations.