1. Introduction
Induction motors are commonly used as the main driving power machines in industrial and household appliances owing to their low cost and high reliability [
1]. With a simple grid connection, they can operate at constant speed without requiring a drive system. Grid-connected induction motors are used in pumps, fans, compressors, etc., in many industrial fields. Hence, any trivial faults in the induction motors result in a significant downtime of the entire system. The most frequent faults in induction motors are winding insulation faults, bearing faults, and broken rotor bars. Among these faults, rotor faults account for a large percentage of the total induction motor failures [
2]. Die-cast and fabricated rotors are used for this purpose. Fabricated rotors are generally used in large or special induction motors. Die-cast rotors are more widely adopted because these exhibit rugged characteristics at a low cost; however, they are difficult to repair in the case of a cracked or broken rotor bar (BRB) fault. Because the induction motor rotor has undergone minimal change in shape and manufacturing technology, experiencing induction motor faults is highly likely.
The BRB fault induces a concentrated rotor bar current distribution to the neighboring bars of the broken bar; consequently, it invokes a severe local temperature increase and torque ripple. However, the diagnosis of the BRB fault is challenging because there are very slight fault signals at the current, voltage, rotor speed, and vibration. To overcome this problem, several studies have investigated BRB fault diagnosis methods for induction motors [
2,
3,
4,
5,
6,
7,
8,
9,
10,
11,
12,
13,
14,
15,
16,
17]. The studied BRB fault diagnosis methods can be categorized into digital signal analysis, other information from special sensors, fault start cases, and neural networks or machine-learning-based algorithms [
3].
First, digital signal analysis uses the phase current with improved frequency-based signal analysis methods. It exhibits good performance in steady-state operations [
4,
5]. The BRB fault affects the rotor current and speed ripple. Consequently, the fluctuating speed results in current phase displacement. Using the sum of the squared current, the fundamental current is transformed into a DC component, and the target fault signal can be separated and detected [
4]. It was considered that the fault signal originated from the speed fluctuation. Hence, its amplitude is easily affected by the mechanical dynamics. Furthermore, it should be reconsidered that the separated fault signal could also originate from the electrical rotor resistance imbalance. In [
5], Park transform in a synchronous reference frame was used to convert the fundamental AC component to DC. Otherwise, under time-varying conditions, short-period data-based methods, such as multiple signal classification (MUSIC) [
6], discrete wavelet transform (DWT) [
7,
9], minimum description length (MDL) [
8], and the Prony method [
10] can be used. However, with a low slip frequency, they also require steady-state data with a long period to separate the specific fault signal components from the large fundamentals. The vast motor current signal analysis (MCSA) diagnosis methods are summarized in [
11].
Second, other information from the vibration and zero-sequence current sensors is also commonly used [
12,
13]. Although the use of additional components increases the cost, it facilitates support for more obvious fault signals. Using the vibration sensor, the DC torque is removed, and the torque ripple caused by the BRB fault is easily identified using frequency analysis [
12]. In addition, the zero-sequence current generated by the BRB fault can also be used to diagnose faults [
13].
Third, starting with the induction motor, the BRB fault signal increases from a very low frequency owing to its large slip frequency. The low-frequency fault signal, apart from its fundamental frequency, is more convenient for separating than the typical operating condition with a frequency that is very close to the fundamental frequency. Even in a noisy inverter-driven system, the fault signal can be separated and used for fault diagnosis [
14]. Further, successive variable-mode decompositions have been used for a better diagnosis [
15]. In contrast, using the induced voltage after removing the input grid power supply, Milimonfared et al. presented a BRB fault diagnosis method with an induction motor model [
2]. However, the induced voltage is easily affected by mechanical dynamics and removal points.
Fourth, machine learning or neural network-based diagnosis methods have been widely studied with advances in powerful computation technology. Machine learning with a vibration sensor was used to identify the torque ripple caused by a BRB fault [
16]. A deep convolutional neural network (CNN) was used in [
17].
This study proposes a BRB fault diagnosis method for an induction motor using the sum of the squares of weighted Fourier series coefficients of a complex current as a fault diagnosis signal. The grid-connected induction motor with a BRB fault has a fault signal at a frequency, which is the subtraction of twice the slip frequency from the fundamental frequency. The sum of the squares of the Fourier series coefficients indicates that it has very narrow band-pass filter characteristics, useful for deriving a specific frequency component. Hence, it is used to obtain the BRB fault signal in the possible fault signal frequency range. Further, the magnitude of the sum of squares of the Fourier series coefficients of the phase currents in the complex domain by the BRB fault is dependent on the slip frequency and load. Thereafter, a weighting factor is proposed to render the BRB fault signal irrelevant to the slip frequency and load condition. Thus, the proposed fault diagnosis can be conducted without the slip frequency information. Finally, the proposed method is validated through experiments using a 55 kW induction motor with and without a BRB fault. The proposed diagnosis method is implemented with a DSP embedded system at time intervals of 20, 10, 5, and 4 s for the Fourier series.
2. Phase Fault Current of Induction Motor Model with BRB Fault
Figure 1a shows the single-phase equivalent circuit of the three-phase induction motor, where
,
,
,
, and
are the stator and rotor resistances and mutual, stator leakage, and rotor leakage reactance, respectively. Further,
,
, and
are the applied stator voltage, stator current, and rotor current, respectively, in the complex domain. In addition,
is the slip, and
and
are the applied voltage and slip frequencies, respectively.
Figure 1b shows the equivalent circuit simplified by Thevenin’s theorem, where
,
,
, and
satisfy
Without the BRB fault, the rotor resistance in (3) is constant, and a uniform rotating magnetic field with slip frequency exists on the rotor bar. With the occurrence of a BRB fault, the local rotor bar resistance,
, increases, and its nonpolarity characteristics generate an even harmonic resistance in the rotor-side impedance. This even harmonic resistance invokes the rotor current
at
, which is modulated by the rotating magnetic frequency
, where
is a positive integer. Hence, the fault current frequency of the BRB fault is as follows:
The stator current, , is the sum of the rotor and magnetizing currents through the mutual reactance, and it also comprises the same fault current components. The most conventional BRB fault diagnosis method of the induction motor is based on the comparison of the stator fault current component at of the target and the pre-obtained data of the healthy one. Hence, the main topic is the manner in which the diagnosis method separates the fault current at using the BRB fault from the large fundamental component at and the other components.
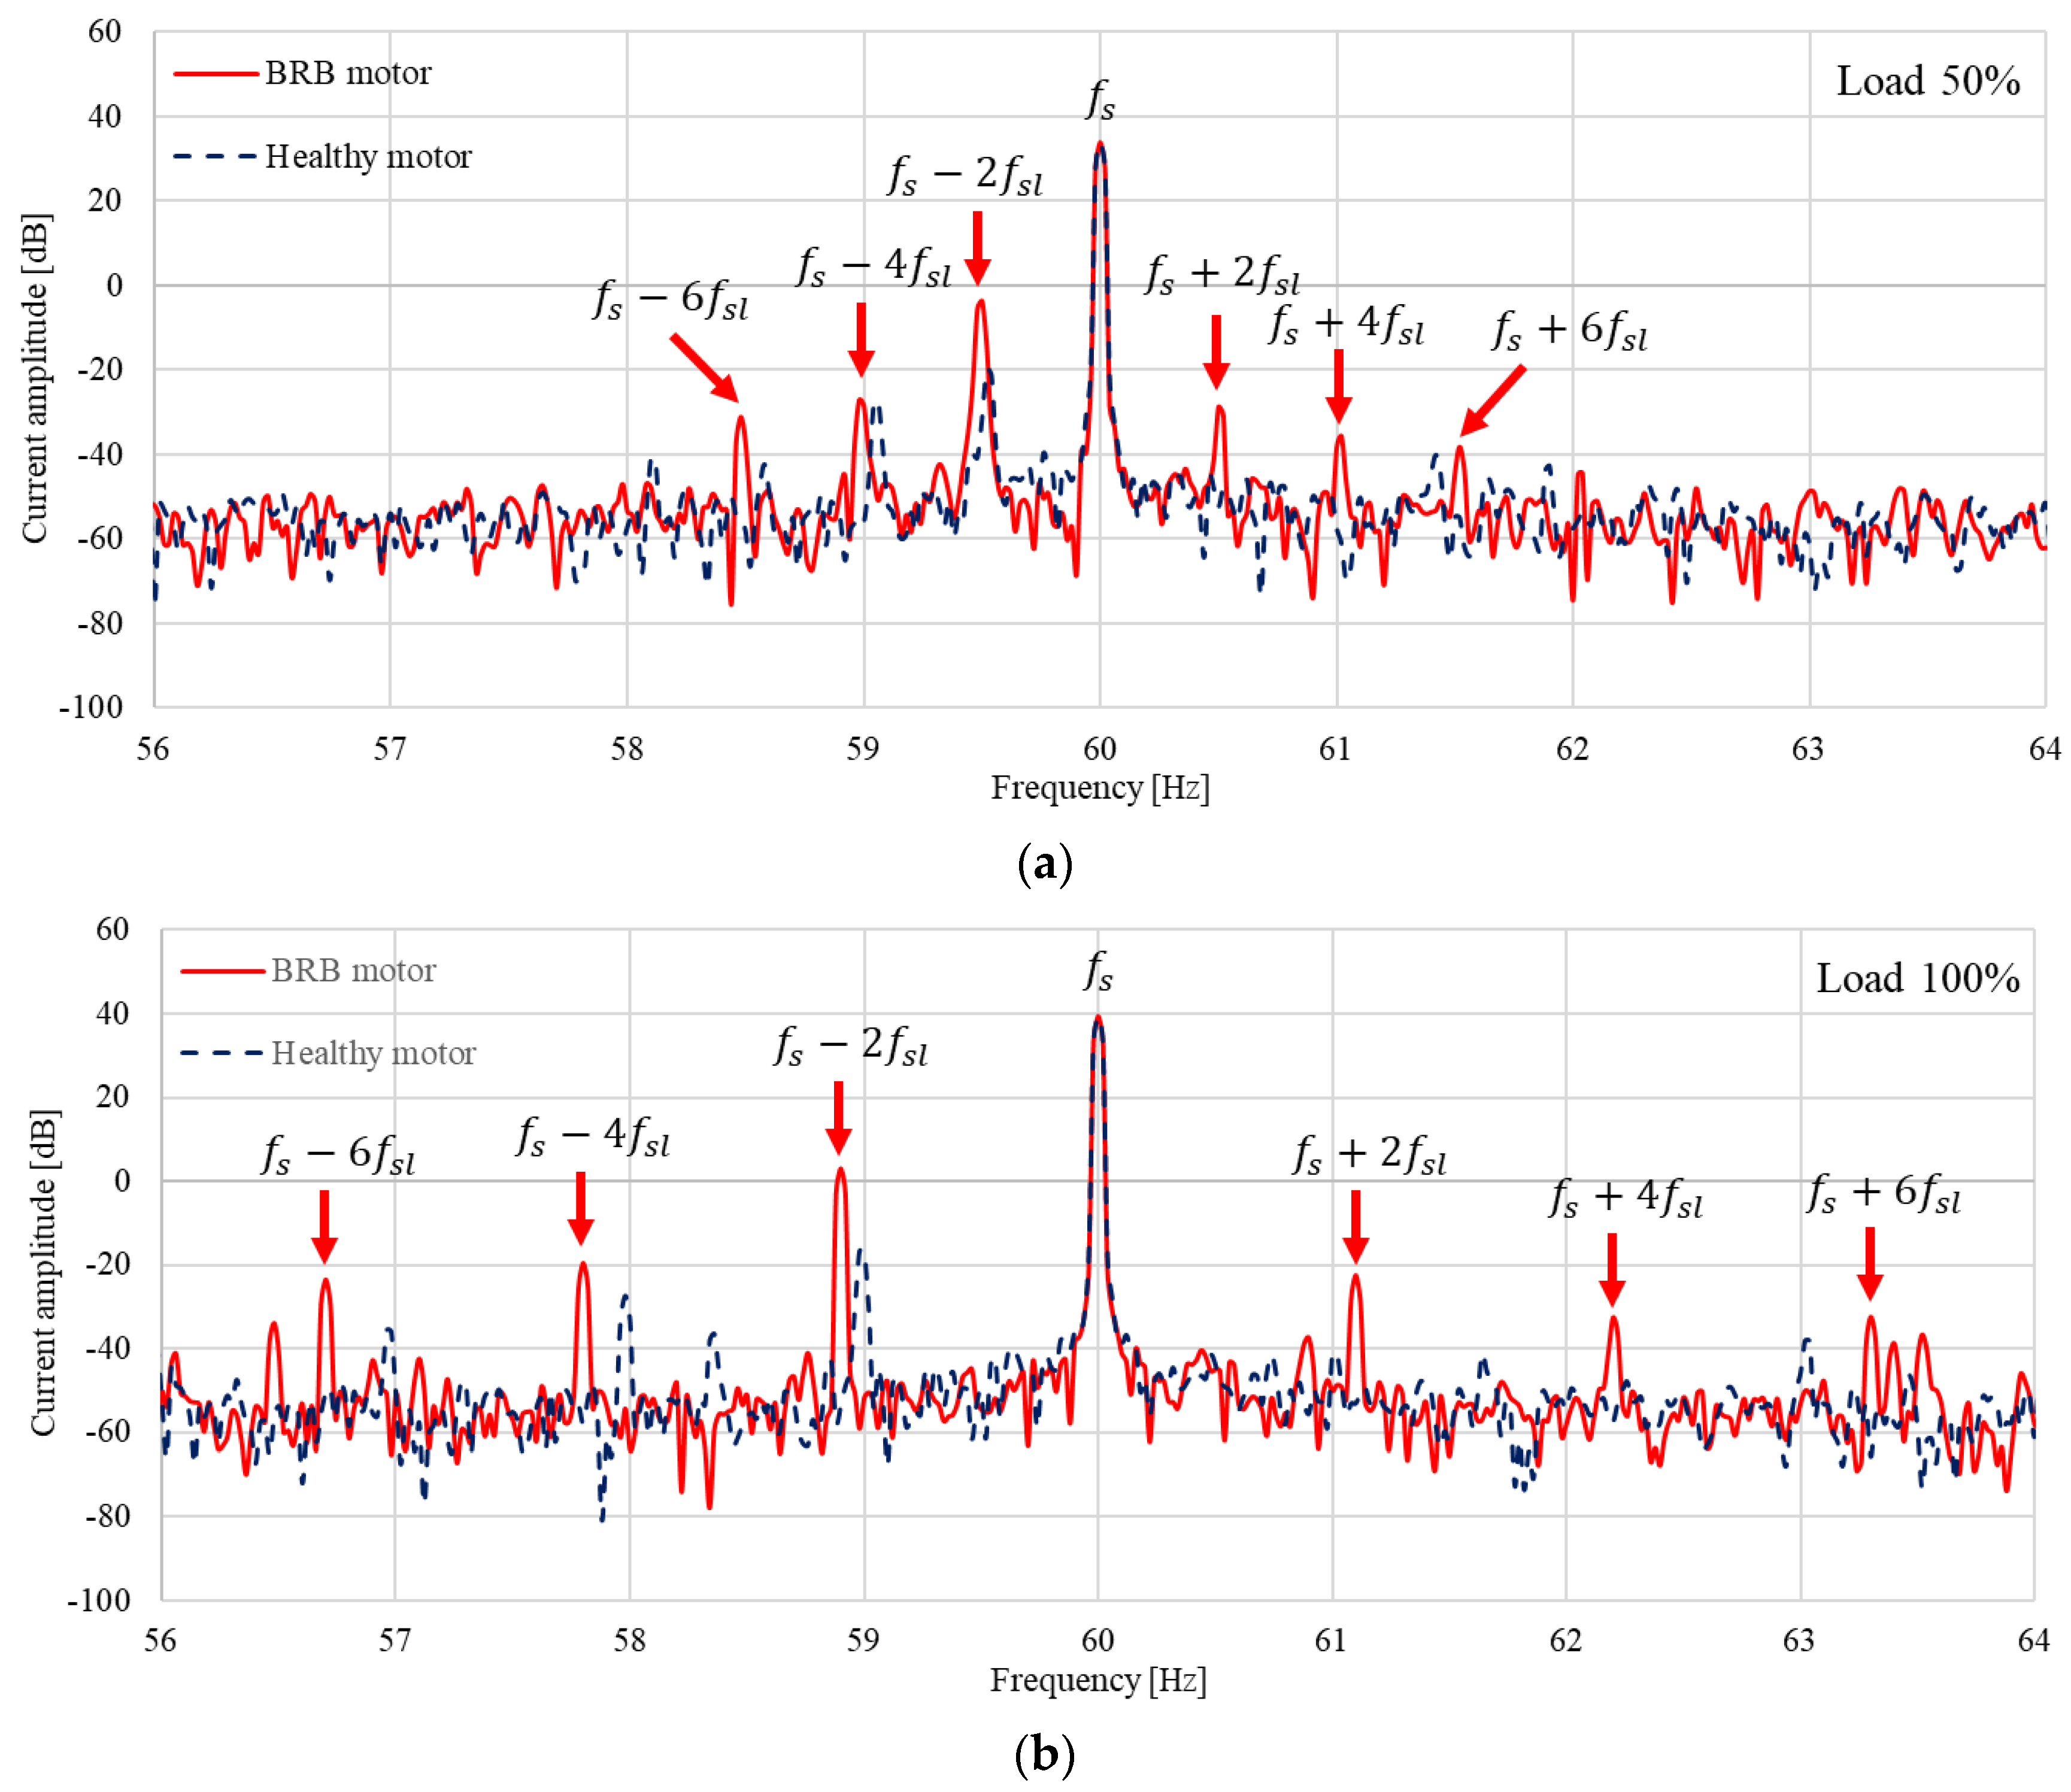
Figure 2 shows the frequency spectra of the phase current with the BRB fault and the healthy induction motor at 50% and 100% of the rated load. The blue dotted and red solid lines represent the healthy and BRB fault-induction motors, respectively. The healthy motor frequency,
, values are 0.250 and 0.53 Hz at 50% and 100% load and those of BRB fault motor are 0.26 and 0.55 Hz, respectively. Owing to the slightly larger rotor average resistance by the BRB, the slip frequency increased to 0.01 and 0.02 Hz. As the even rotor resistance exhibits maximum resistance harmonics at
, the most dominant fault current component exists at
, which yields 59.48 Hz (50%) and 58.90 Hz (100%). The simple BRB fault diagnosis method observes the fault current amplitude at
because the healthy and fault motors have obviously large amplitudes and differences between them compared to any other fault current frequency. The induction motor phase current data can be easily collected and analyzed over a wide frequency range with dedicated instruments, such as a power spectra density analyzer or personal computer with an adequate frequency analyzer program. However, in an embedded system with a small computing-powered microprocessor, specific diagnostic rules should be defined. Furthermore, identifying the exact slip frequency, which is affected by the rotor resistance variation by the bar temperature, BRB fault, etc. is challenging. Hence, without the slip frequency information, the sum of squares of weighted Fourier series coefficients of the complex current as a diagnosis signal is proposed for a simple diagnosis, even if it can be adopted with the embedded controller. The complex current was obtained using the Park transform.
3. Band Pass Filter with Fourier Series
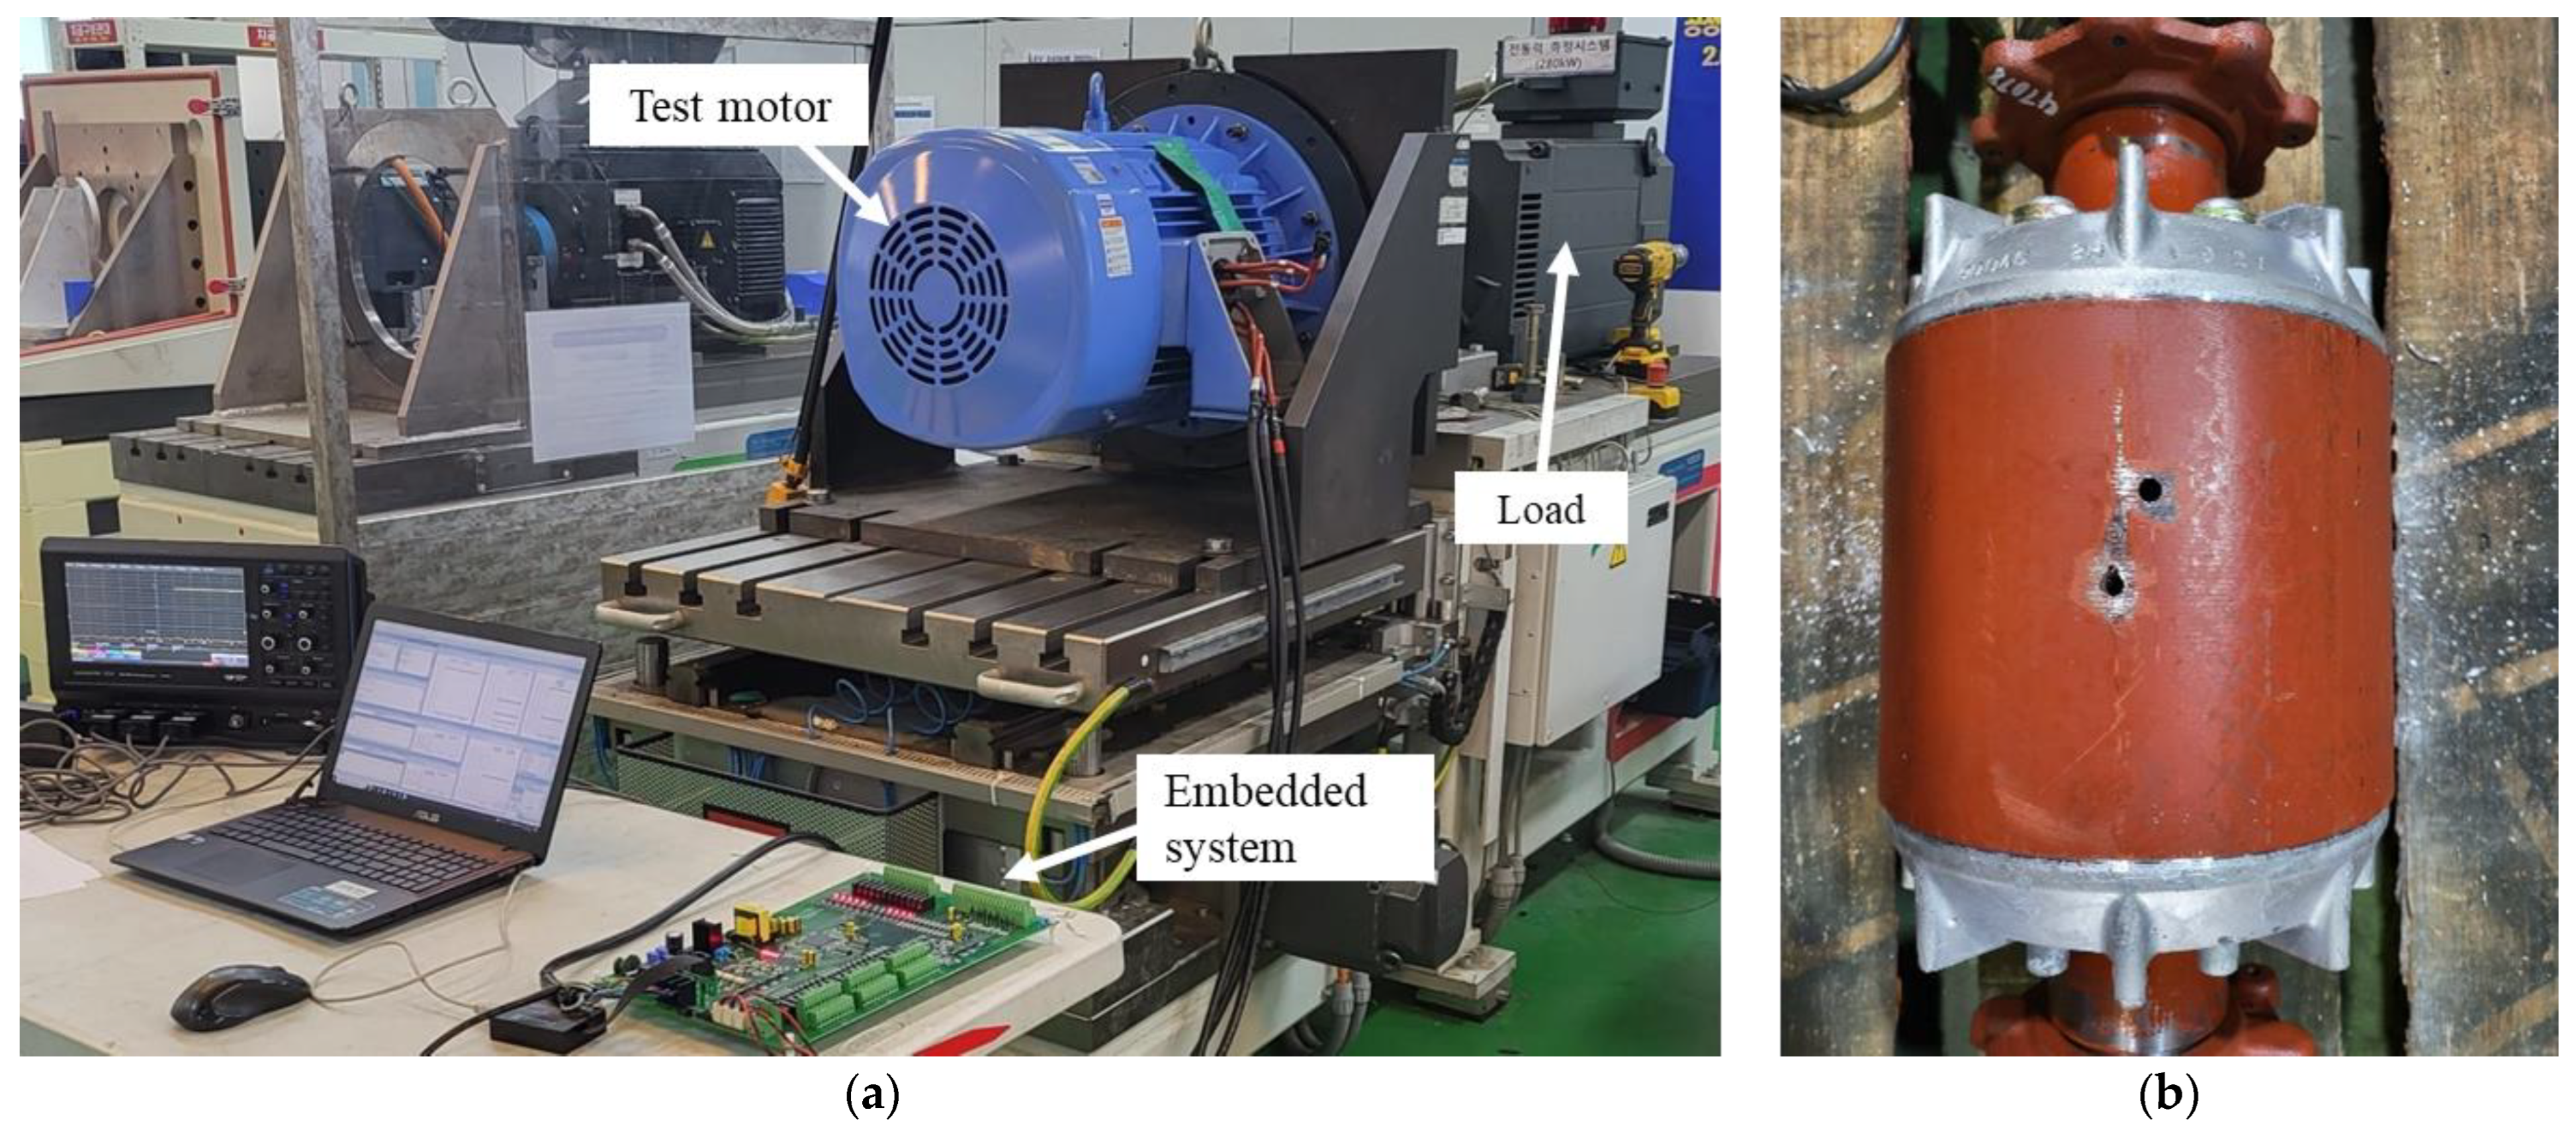
Figure 3a,b shows the experimental environment and rotor with the BRB fault. Two identical 55 kW induction motors with 2-pole and 380 V
rms line-to-line voltage with a delta connection were used. One was healthy and the other was damaged to induce the BRB fault, as shown in
Figure 3b. The number of rotor bars was 52, two of which were intentionally damaged. In
Figure 3a, the embedded system is used for fault diagnosis. A DSP TMS320F28377 (Texas Instruments) was used as the main microprocessor, and it could measure the current information with 5 kHz sampling frequency.
If a signal function is zero outside the time interval
, the Fourier series can be calculated. The
n-th coefficient of the Fourier series is
where
denotes the measured motor phase current in the
d-
q complex plane with Park’s transformation, which can be obtained from the motor phase currents
,
, and
, as
and
.
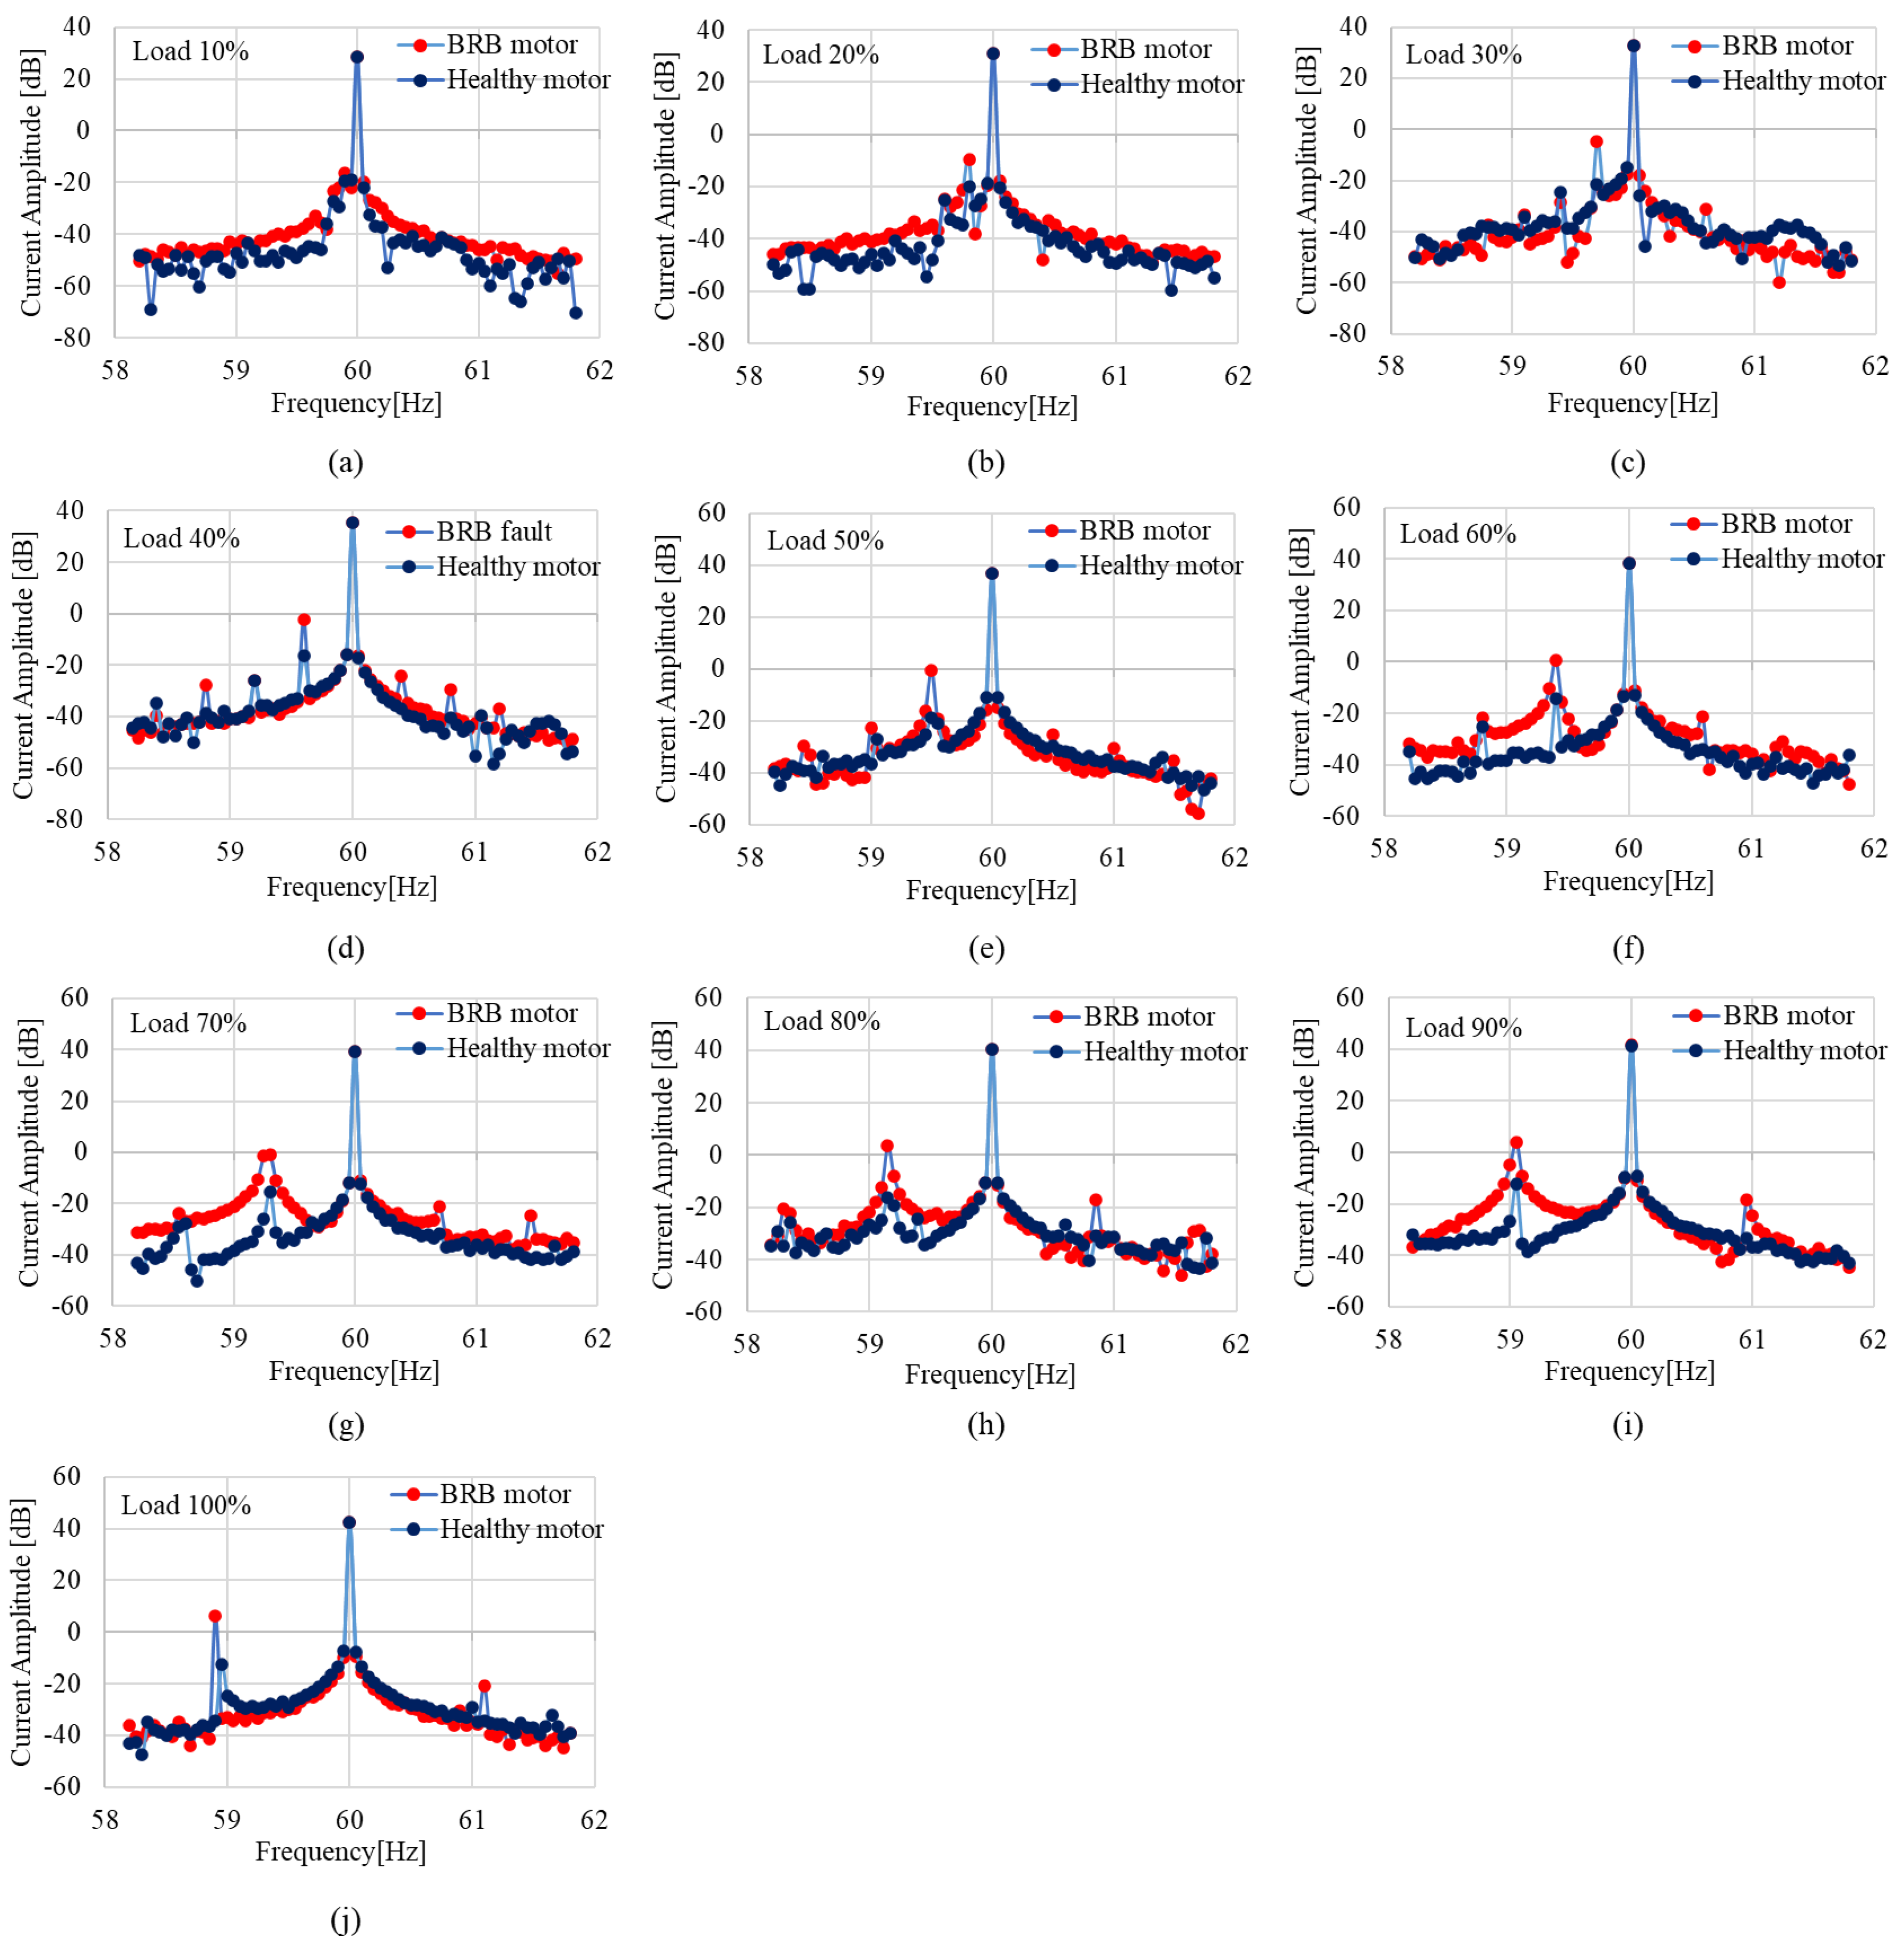
Figure 4 shows the Fourier series results of the BRB fault and a healthy motor with (a) 10% to (j) 100% of the rated load. To obtain Fourier series coefficients in
Figure 4, Equation (5) was used with a motor phase current in the d-q complex plane and implemented in the embedded system. The time interval,
, was 20 s; thus, the frequency difference between the neighboring coefficient was 1/20 s = 0.05 Hz. From 58.2 to 61.8 Hz, 73 coefficients were calculated and are plotted in
Figure 4. The DSP has two cores, with only one core used for the Fourier series analysis. Eight harmonic frequency components, calculated every 20 s and 200 s, were required to calculate the 73 coefficients. In
Figure 4a, the fault current frequency,
, by the BRB fault with 10% of the rated load was 59.9 Hz, which is very close to the main input fundamental frequency of 60 Hz. It is difficult to identify a large fundamental component, although in
Figure 4b–j, the fault currents from 20% to 100% of the rated load condition were clearly different from the healthy currents at the BRB fault frequency,
. However, a more specific method should be established with an embedded system.
The d-q current of the induction motor with a BRB fault can be represented by the sum of the fundamental and fault currents, as follows:
where
and
are the amplitude of the fundamental component and BRB fault signal, respectively, and
is the phase displacement of the BRB fault signal. Here, the phase displacement of the fundamental component was assumed to be zero for a simple derivation. The time interval
was chosen to be a positive integer multiple of the fundamental interval
. By substituting Equation (6) with Equation (5),
can be obtained as follows:
Using the results of the Fourier series with the BRB fault and healthy motor, a fault diagnosis can be implemented by focusing on the . When the n-th Fourier series coefficient frequency is equal to the BRB fault signal frequency in Equation (7), i.e., , the magnitude of the coefficient is equal to the fault signal amplitude, . The BRB fault signal can be extracted perfectly. Thus, this method can be used for fault diagnosis. However, when the BRB fault signal frequency is between two neighboring coefficients , the BRB fault signal is reduced. Consequently, the minimum values are , when is in the middle of the nth and (n + 1)th frequency and . Hence, to use the Fourier series results for the diagnosis, only the maximum of any one coefficient can be incomplete. In addition, the slip frequency can be increased by the rotor resistance caused by the BRB fault. Hence, when using the healthy motor model, the estimated slip frequency is incorrect, thereby rendering it difficult to determine the BRB fault frequency, .
To overcome this problem, a band-pass filter with the sum of squares of the Fourier series coefficients was studied. Its bandpass frequency should cover the possible
. If
, the square of the determinant of the nth coefficient
is as follows:
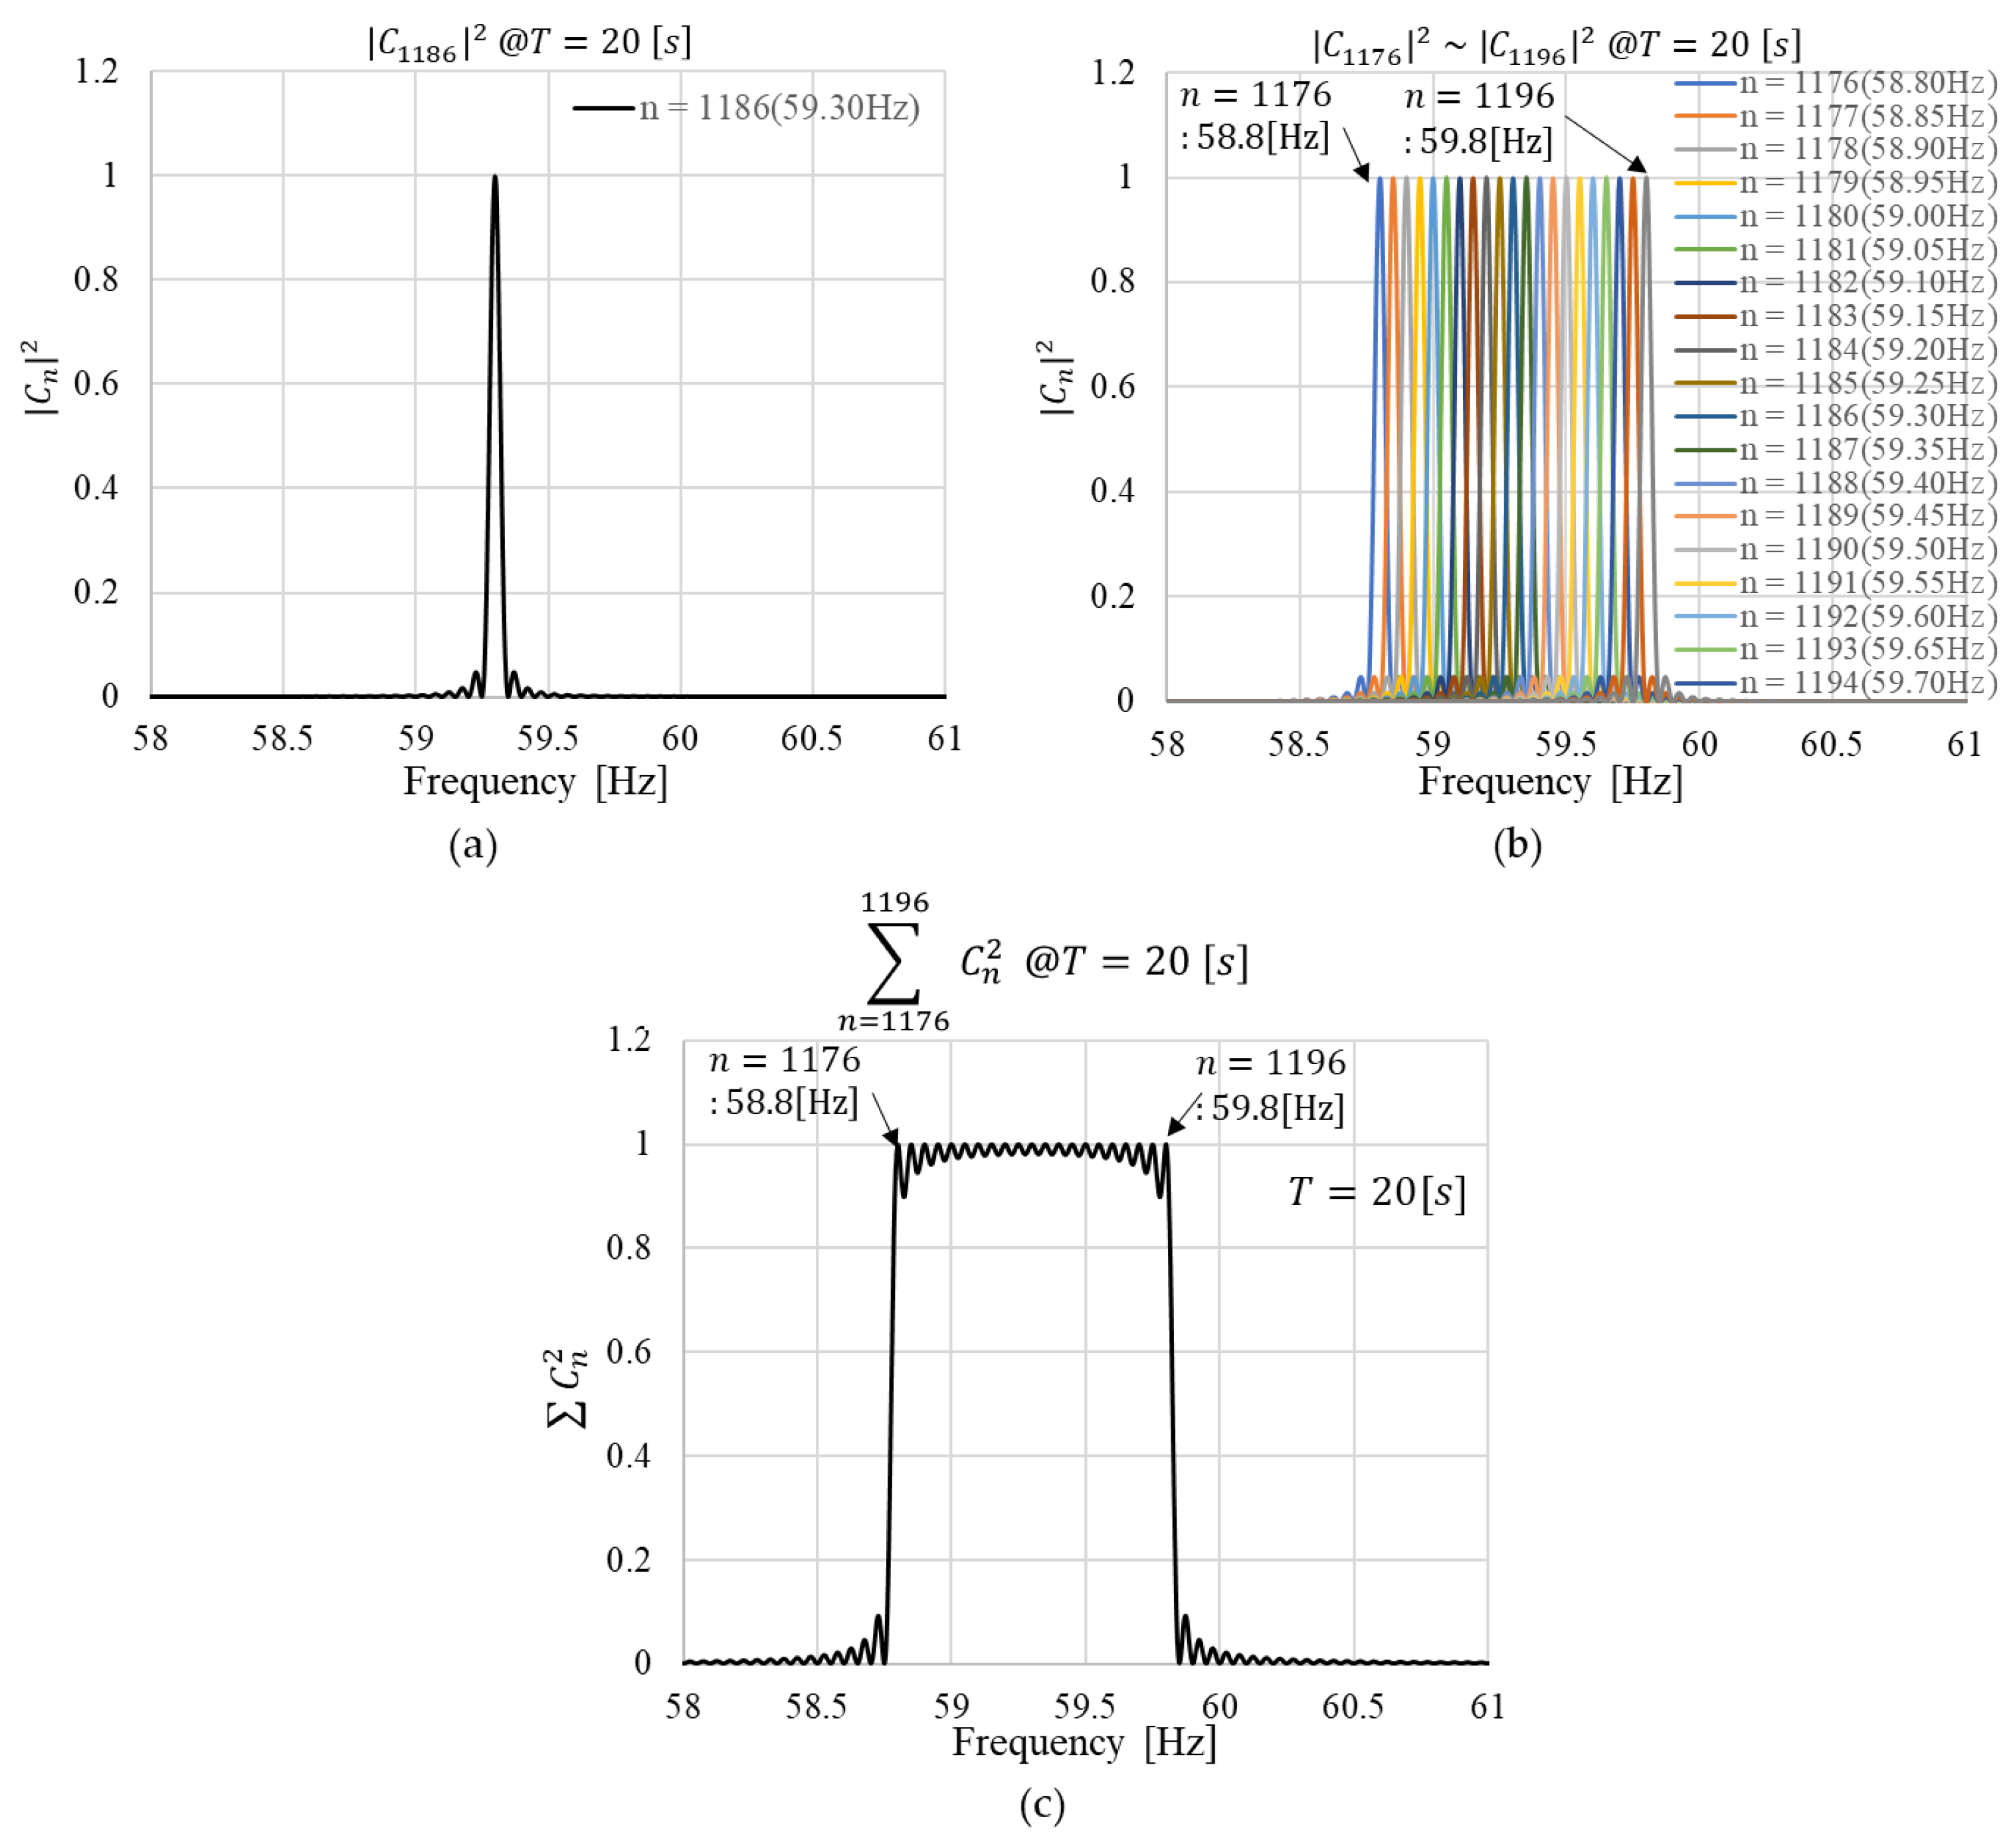
Figure 5a shows
versus the BRB fault frequency,
, with the unity amplitude (
,
, and 5 kHz sampling frequency.
represents a coefficient at a frequency of
Hz. If the BRB fault frequency is
Hz,
presents the exact amplitude of the BRB fault signal. However, it is difficult to determine the fault frequency because the slip frequency is easily affected by the rotor resistance variation with the BRB and temperature.
Figure 5b,c shows
and
versus
. Using (7), the Fourier series can be obtained with a
frequency gap, that is, 0.05 Hz with
. When summing up
from the 1176th to the 1195th terms,
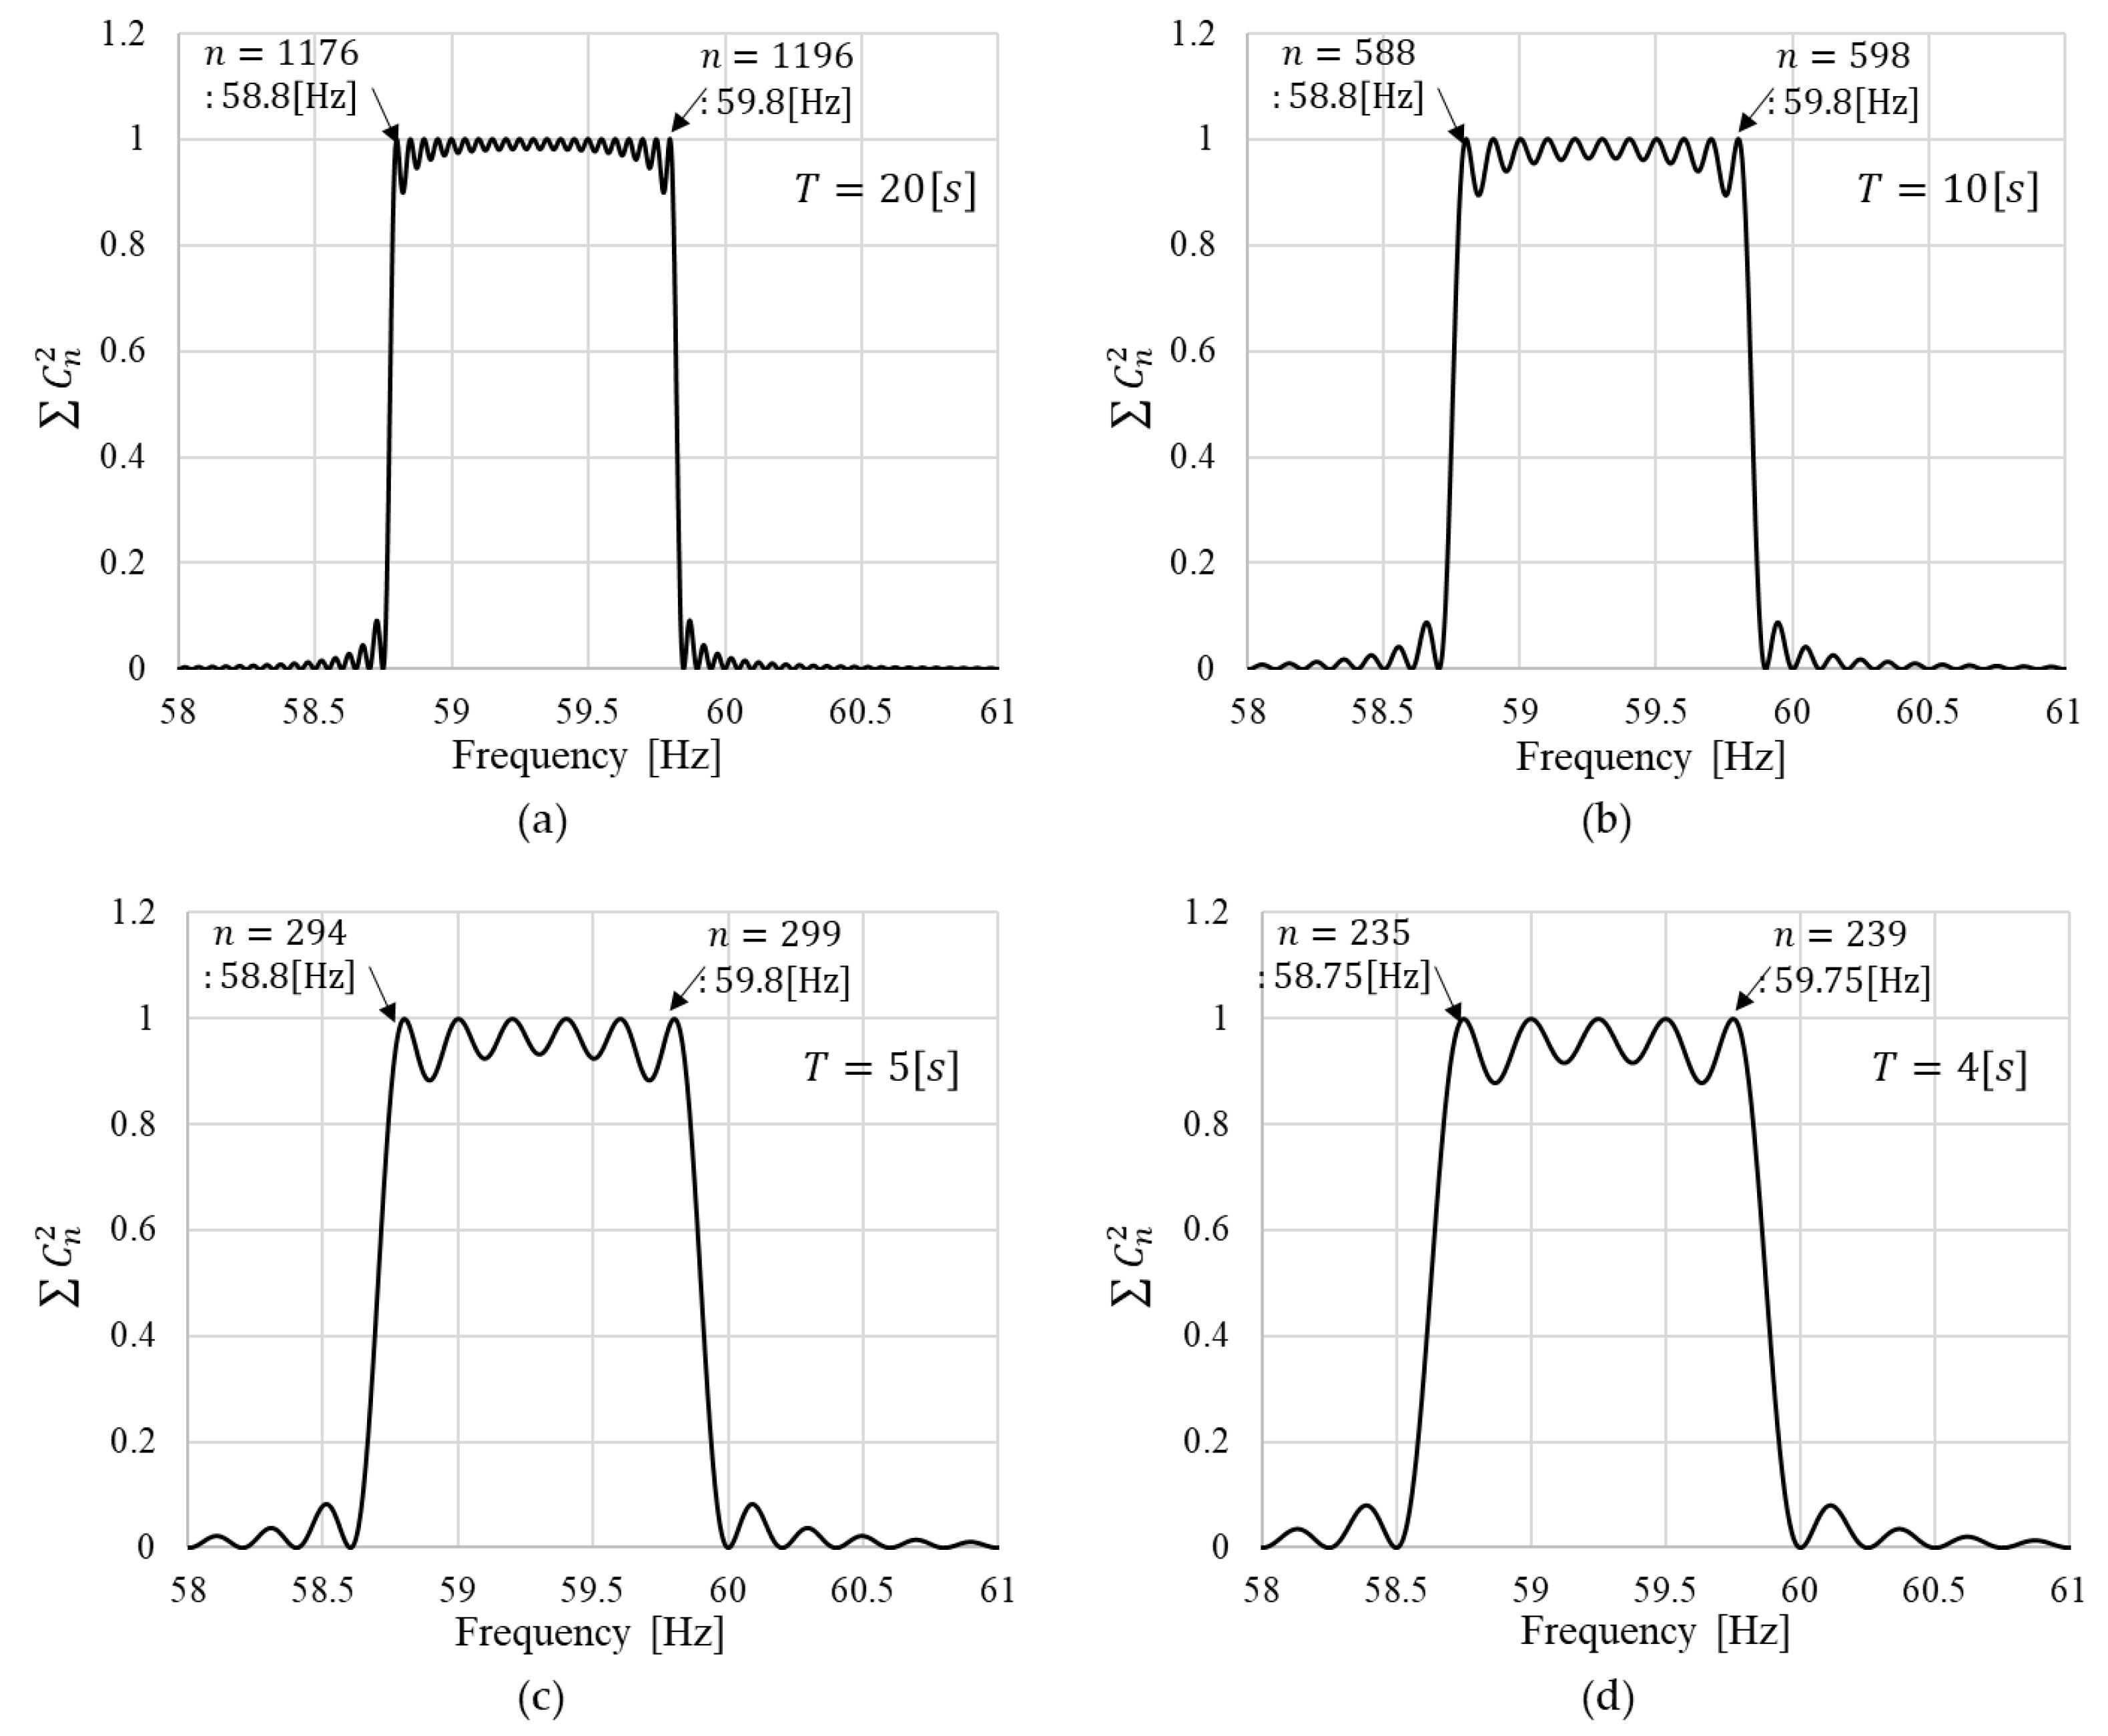
exhibits narrow band-pass filter characteristics (only calculating the square of the amplitude of the fault current between 58.8 and 59.8 Hz). Further, the maximum fault current frequency (
58.8 Hz,
Hz) has a slip frequency 11.3% greater than the rated load condition of the healthy induction motor (
). This is a sufficient margin even with the increased rotor resistance by the BRB fault. The minimum fault current frequency (
59.8 Hz,
Hz) was chosen such that the minimum possible BRB fault diagnosis was 20% of the rated load. This is because separating the fault current from the fundamental current with the test induction motor at the 10% load condition is challenging, as shown in
Figure 4a. With the implemented BRB fault and 100% of the rated load, the slip frequency,
, and fault signal frequency,
, were 0.55 and 58.9 Hz, respectively. Hence, with
, BRB fault signals with a frequency of
under load conditions can be extracted without slip information.
Figure 6 shows plots of
versus frequency when the time interval
is (a) 20, (b) 10, (c) 5, and (d) 4 s. For the 4 s case, the minimum frequency gap was 0.25 Hz; thus, the band frequency was chosen between 58.75 Hz and 59.75 Hz. As the time interval becomes shorter, the plot exhibits more ripples on the top. Further, a higher interval period results in a more ideal band pass filter.
Figure 7 shows the experimental results of
versus the slip frequency at 10% to 100% of the rated load with a healthy and a BRB fault motor. The measured and calculated values with the embedded system are shown. Owing to the increased average rotor resistance by the BRB fault, the slip frequency also increased by approximately 3% of the nominal value. With an increasing load value, the sum of the square of the current coefficients increased. A simple diagnosis rule can be implemented by comparing
with a constant threshold value. If the obtained diagnosis signal
is bigger than the threshold value, the induction motor is determined to have a BRB fault. However, the threshold value should be modified according to the target load conditions. For a light load, it should be low-value, whereas in the case of a heavy load, it should be high. Moreover, this fault diagnosis method is very sensitive to the load condition. Therefore, for a better sensitivity to all load conditions, the threshold value can be adjusted depending on the slip frequency. The green solid line in
Figure 7 is an example of the threshold function of the slip frequency. This secures a better margin than the constant threshold against the various load condition. However, under a low load, the estimated slip frequency should be accurate owing to the lower margin between the healthy and faulty ranges.
With the studied motor, the maximum slip
was found to be 0.03 (0.5 Hz/60 Hz); then,
is much larger than
It can be assumed as
The rotor current,
is proportional to the slip frequency and inversely proportional to the rotor resistance. The even-order resistance harmonics affect the rotor current and amplitude of the generated harmonics to the slip frequency. Because the stator current is the sum of the magnetizing current conducting through the mutual reactance and rotor current, the second harmonics of the rotor current were observed in the stator current. Hence, the BRB fault current amplitude is proportional to the slip frequency from Equation (9). Therefore, the sum of the squares of the fault current Fourier series coefficients,
has a quadratic function form. The induction motor with the BRB fault yields
, which is the dotted line in
Figure 7.
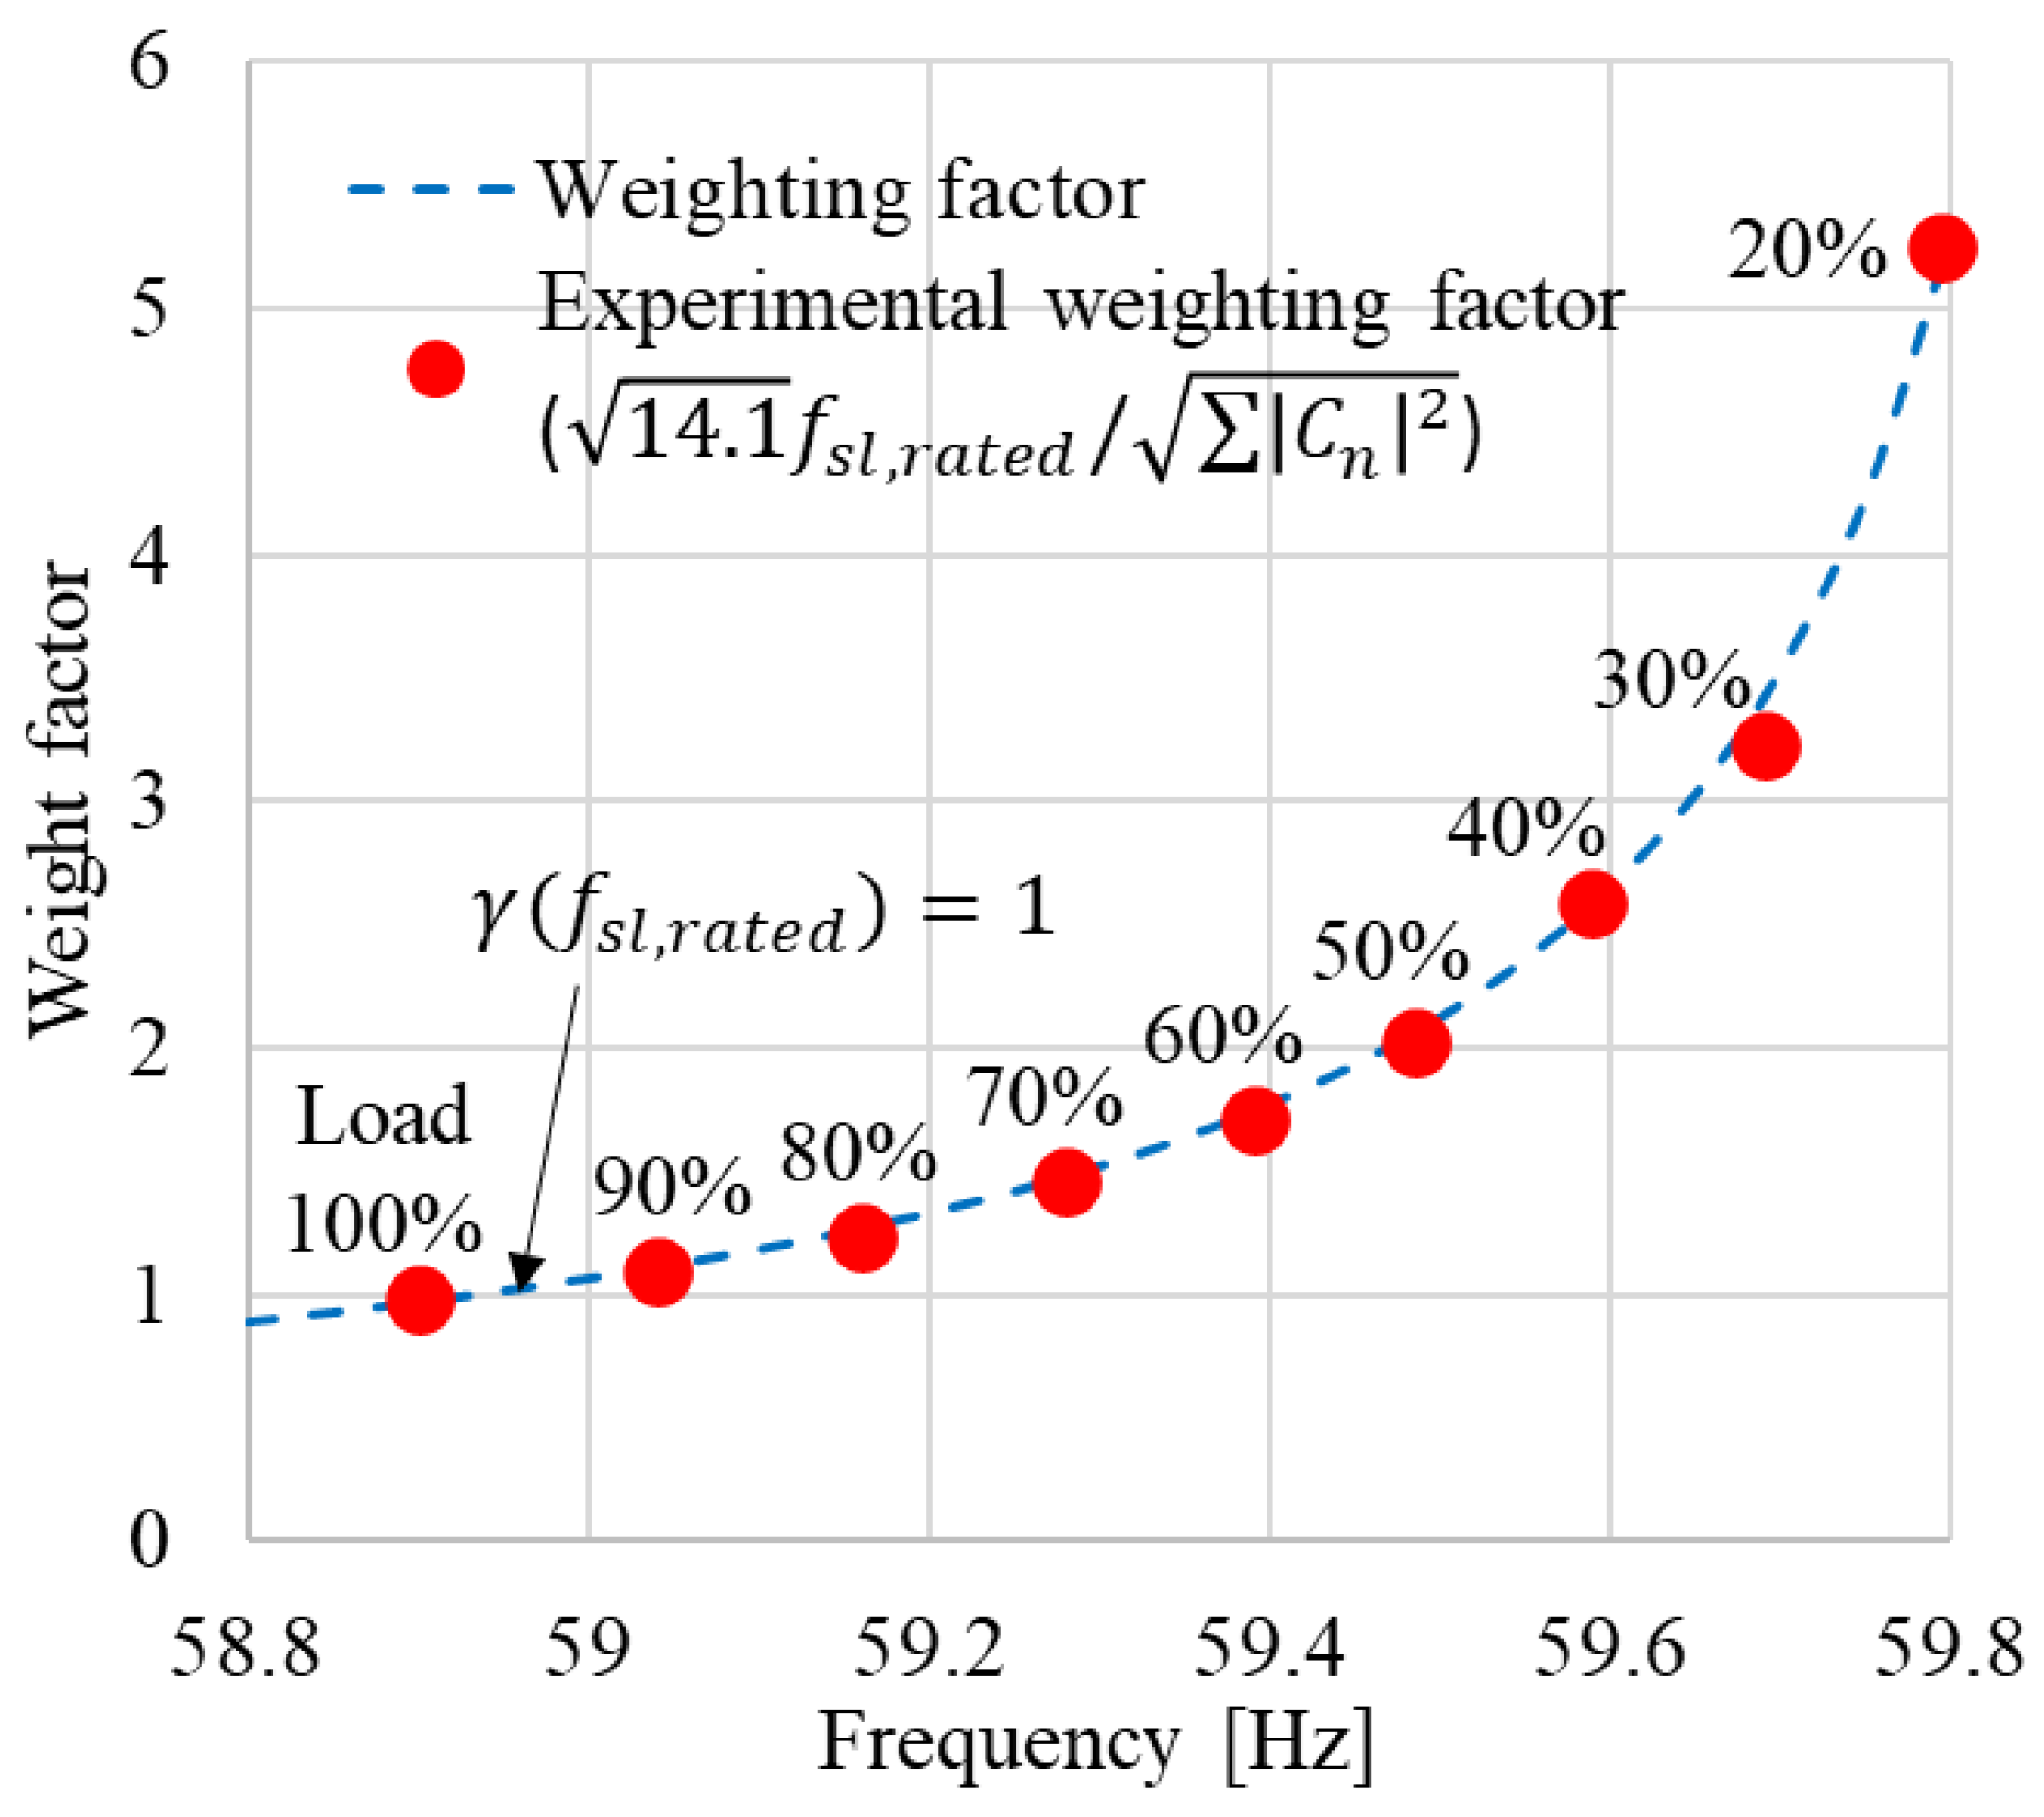
To render the diagnosis method insensitive to the slip frequency, a fault signal with a weighting factor of
was proposed. Based on the
Figure 7 results, the weighting factor
was chosen to ensure that the fault signals exhibited the same magnitude, as shown in
Figure 8. The blue dotted line is the weighting factor function
, which has 1 at the rated slip frequency
and
.
where
is the Fourier series coefficient frequency and
. The red dot is the
, which has the numerator of the expected BRB fault current at the rated load and denominator of the experimental result shown in
Figure 7.
Based on the weighting factor in
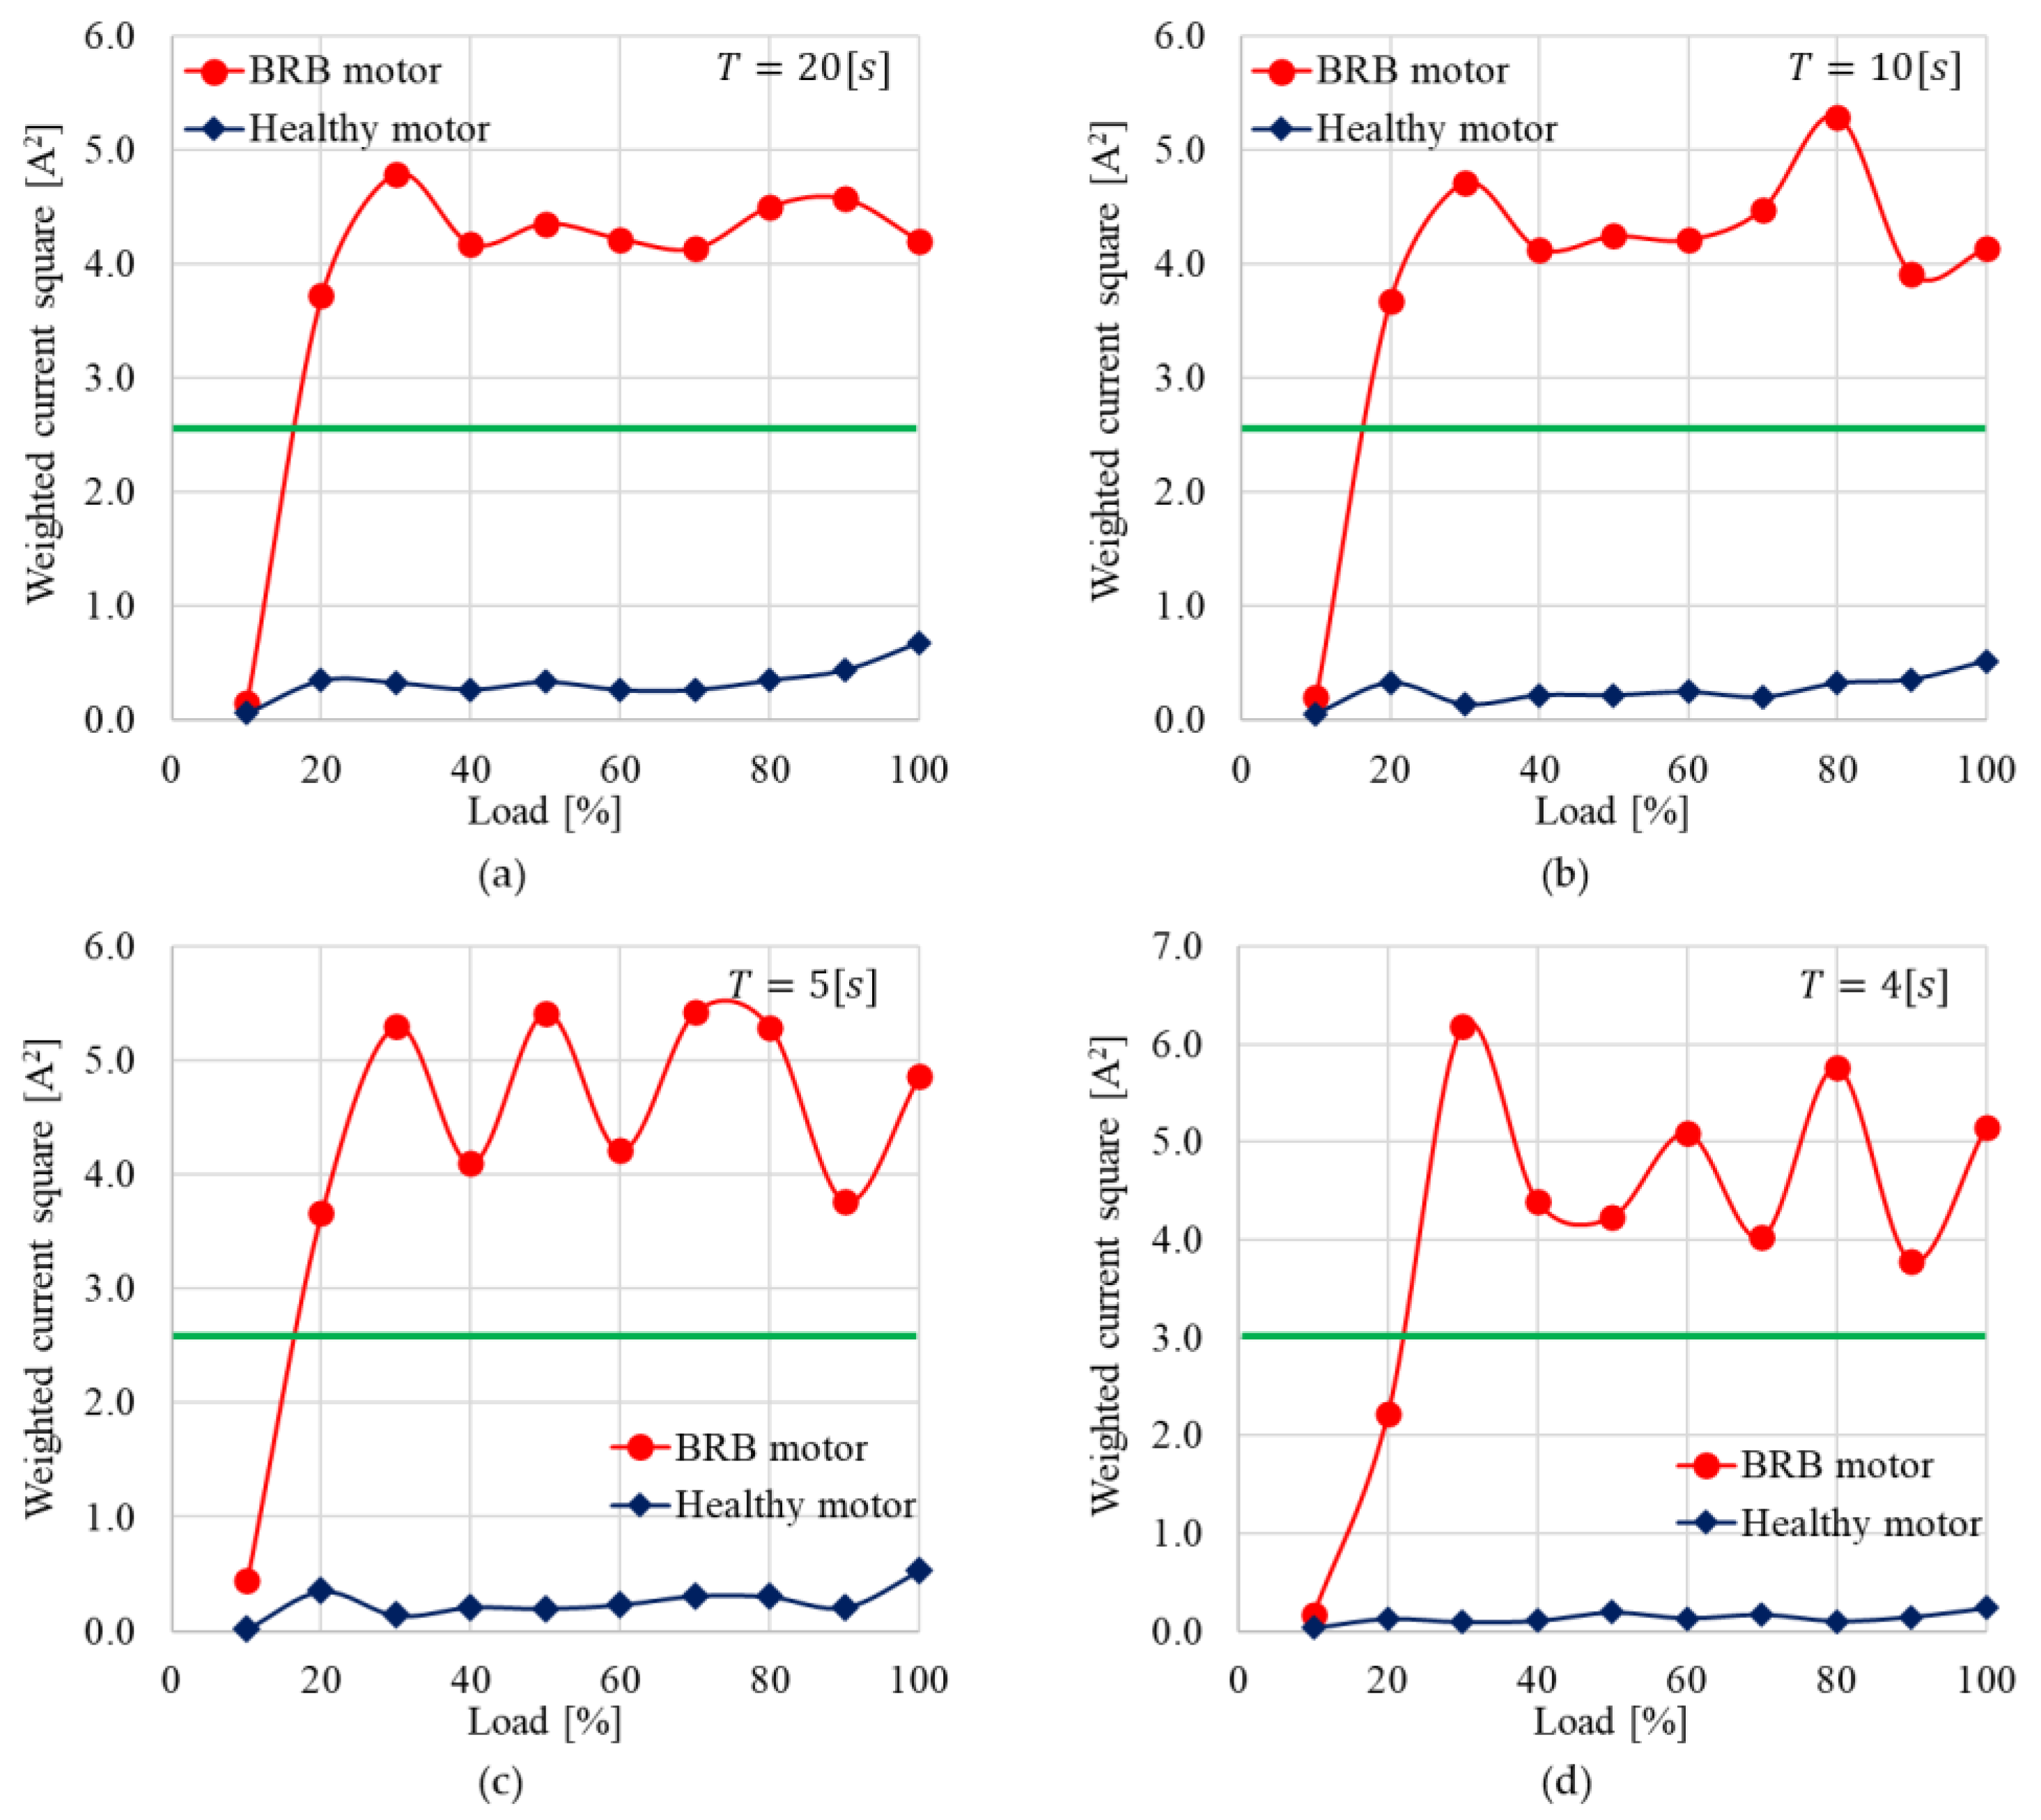
Figure 8, the experimental results of the sum of the weighted current coefficient
are shown in
Figure 9 for the time interval
of (a) 20, (b) 10, (c) 5, and (d) 4 s, where
from (10). The green line is the threshold level for diagnosing BRB faults. It is a constant value that is unaffected by the slip frequency. Hence, the proposed BRB fault diagnosis method was executed without slip-frequency information and functioned well over a 20% load in the experiment tests.
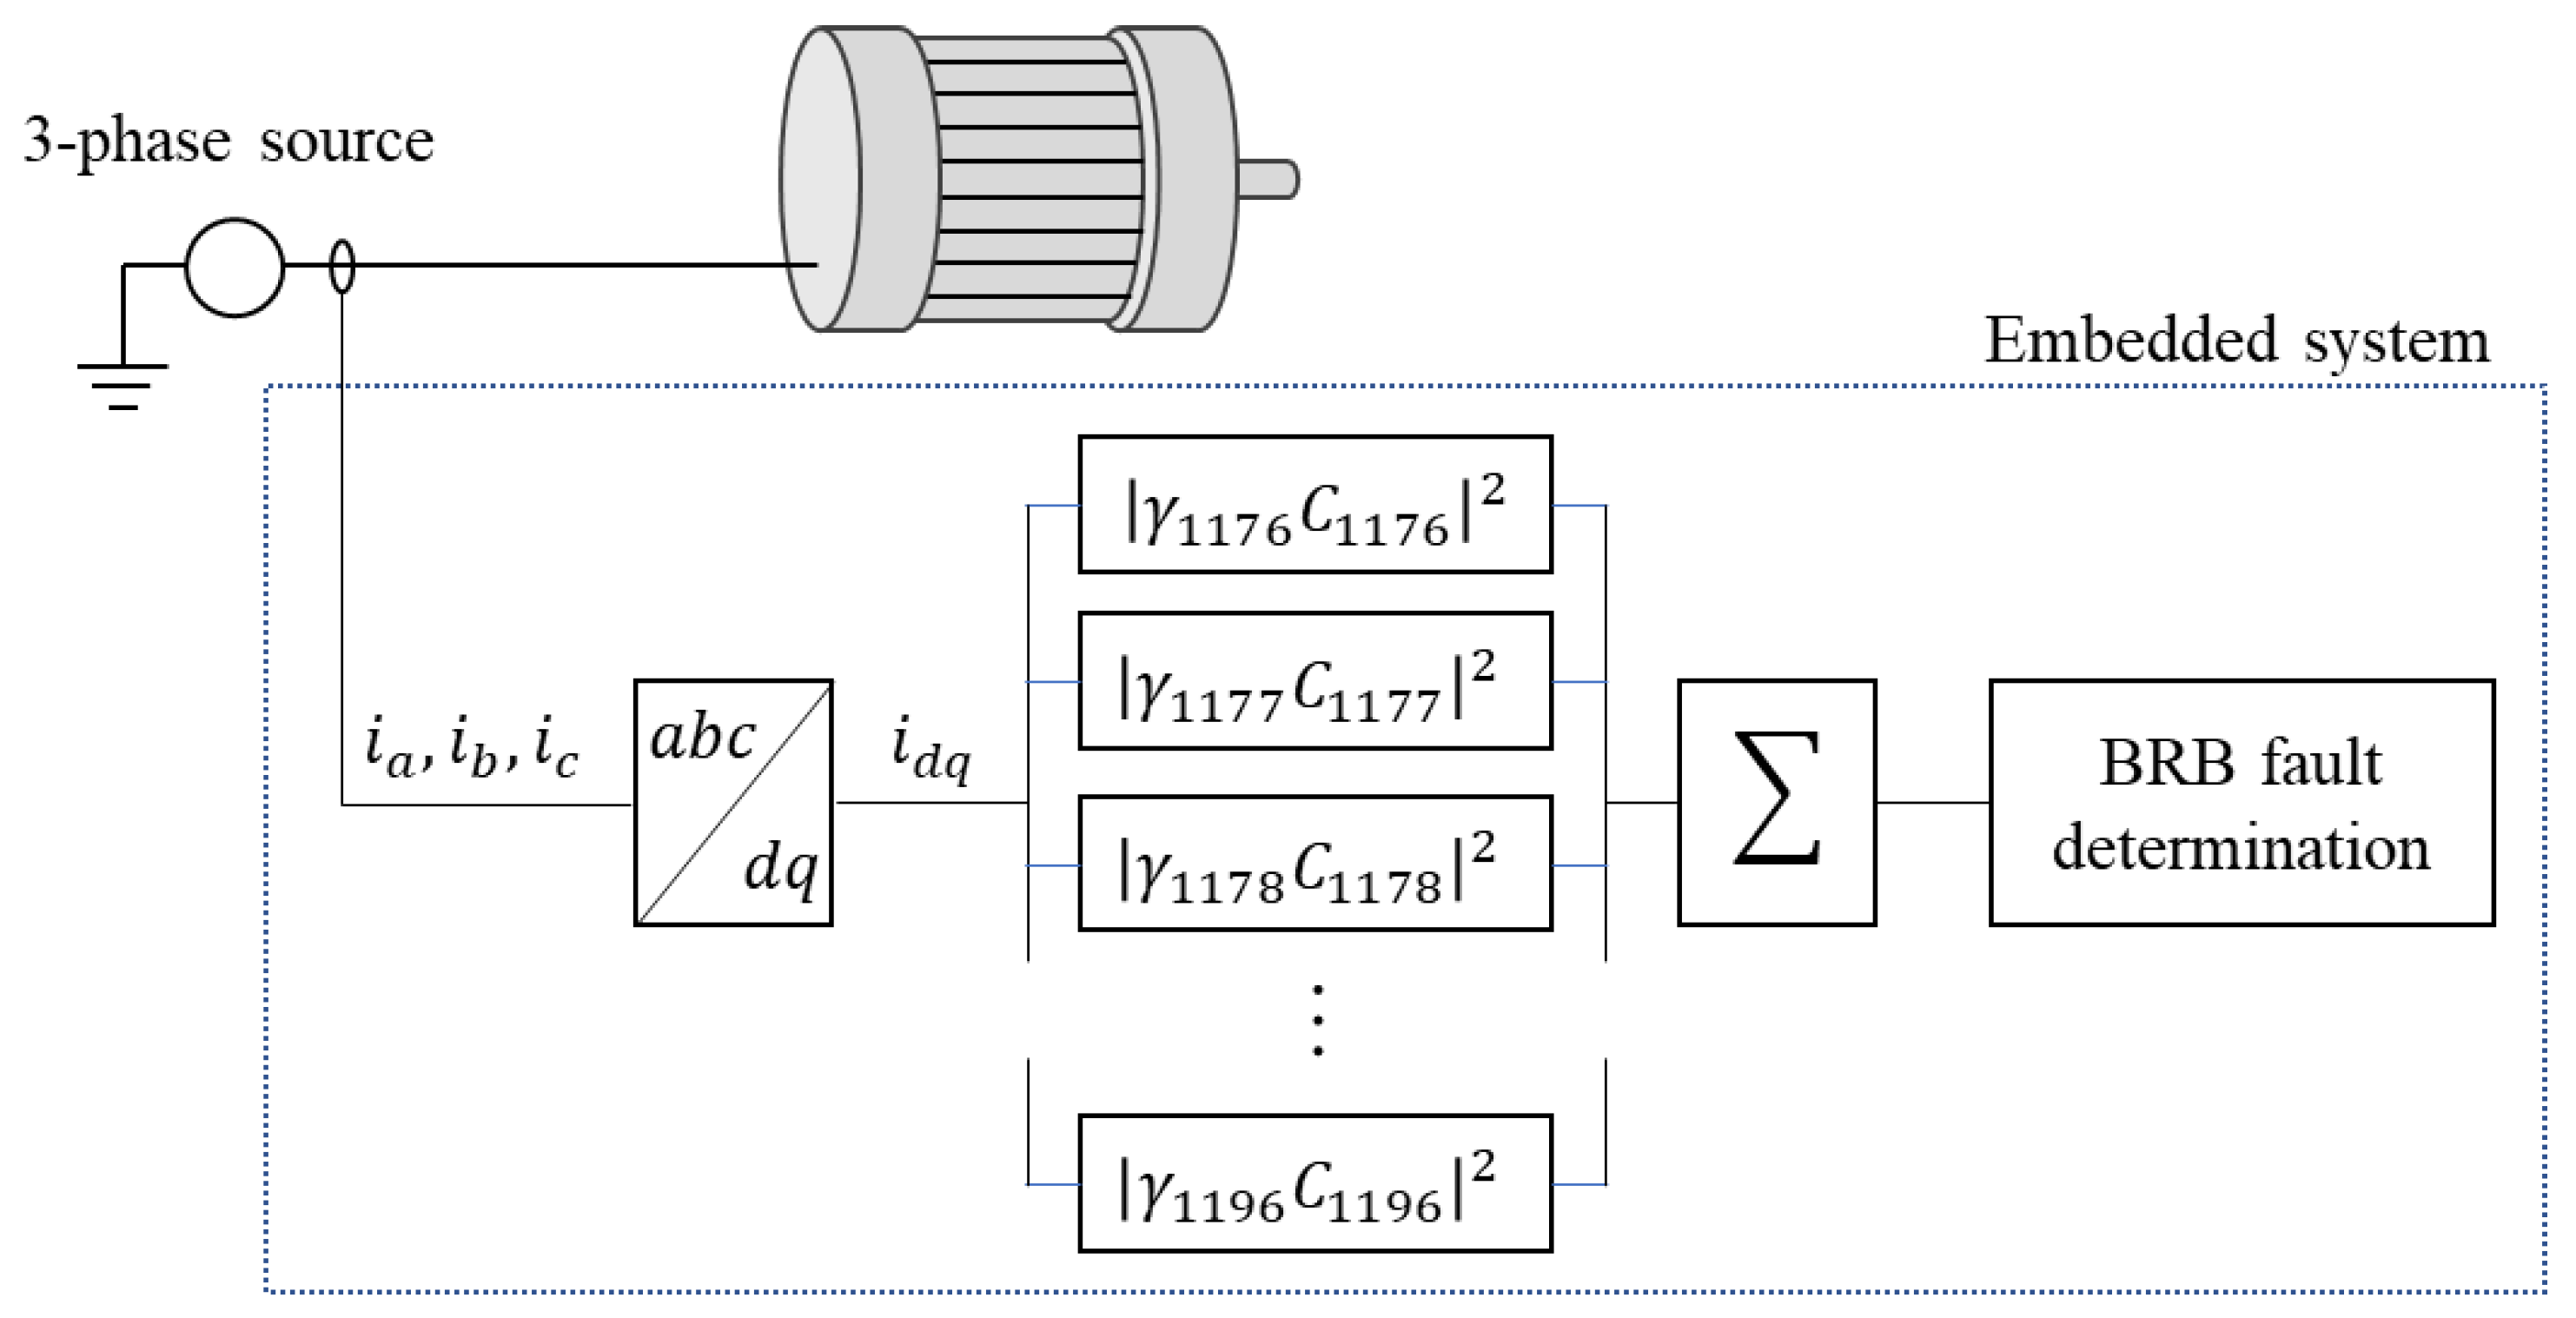
Figure 10 shows a block diagram of the proposed BRB fault diagnosis method. After measuring the three-phase current and d-q current in the complex plane, the Fourier coefficients were calculated. The fault signal
was obtained by multiplying it by the weighting factors. This was then used as the main BRB fault-determination method. In the proposed method, a simple comparison with a constant threshold value was used. However, many other decision rules can be implemented.

