Article

Dynamic Response Characteristics of Roadway Surrounding Rock and the Support System and Rock Burst Prevention Technology for Coal Mines

1
School of Mines, Key Laboratory of Deep Coal Resource Mining, China University of Mining and Technology, Xuzhou 221116, China
2
The State Key Laboratory of Coal Resources and Safe Mining, China University of Mining and Technology, Xuzhou 221116, China
*
Author to whom correspondence should be addressed.
Energies 2022, 15(22), 8662; https://doi.org/10.3390/en15228662
Submission received: 25 October 2022 / Revised: 16 November 2022 / Accepted: 16 November 2022 / Published: 18 November 2022
(This article belongs to the Special Issue Fracture Mechanics and Energy Geo-Structures)

Abstract

:
Anchor cables (bolts) act as the main support system and play an important role in improving the rock burst resistance and stability of the roadway surrounding the rock. In this study, the dynamic response characteristics of the roadway surrounding the rock and the support system under different shock intensities were investigated. The following findings were obtained. The stress wave propagation process under dynamic shock was divided into a stress vibration initiation stage, a stress fluctuation stage, and a stress adjustment stage. In the stress vibration initiation stage, the surface mass of the roadway surrounding the rock started to vibrate, and the pretension of the anchor cables (bolts) was reduced; in the stress fluctuation stage, the failure of the roadway surrounding the rock intensified, and the anchor cables (bolts) were damaged to some extent; and in the stress adjustment stage, the roadway deformation of the surrounding rock and the axial forces of the anchor cables (bolts) tended to stabilize. As the dynamic shock intensity increased, the vibration velocity, displacement increment, and acceleration amplitude of the mass of the roadway surrounding the rock increased exponentially. The critical shock energy of the roadway surrounding the rock was 105 J, above which the damage to the rock was aggravated. The larger the pretension of the anchor cables (bolts) was and the higher the dynamic shock intensity was, the more severe the damage to the anchor cables (bolts) was. Given the dynamic response characteristics of the roadway surrounding the rock and support elements under shock, a full anchor cable yielding support technology is proposed to effectively control the stability of the roadway surrounding the rock under dynamic shock, providing a reference for the construction of the support systems for preventing rock bursts in similar roadways.

1. Introduction

Rock bursts have become an increasingly serious disaster as mining depths have increased. According to statistics, there are currently 220 rock burst mines in China, of which 121 are in production, and 91% of rock burst accidents occur in roadways, posing a grave threat to efficient and safe mine production [1,2,3]. Therefore, to prevent the occurrence of dynamic shock disasters in mines, researchers have extensively studied the occurrence mechanisms and prevention and control technologies of roadway rock bursts. Currently, the occurrence mechanisms of roadway rock bursts include strength theory [4], dynamic and static load superposition theory [5,6], three-factor theory [7,8], and rock burst start-up theory [9]. Liu [10] studied the rock burst failure characteristics of the roadway surrounding the rock induced by the fracture of overlying key strata and determined the critical energy value for the fracture-induced burst of the overlying rock. Xiao [11] investigated the characteristics of floor rock bursts in an anticlinal structure and revealed that high tectonic and crustal stresses were the main causes of the rock bursts. Yang [12] established the energy gradient criterion for the rock burst tendency and quantified the rock burst tendency index. He [13] studied the dynamic evolution of roadway rock bursts induced by a thick-hard roof and proposed that controlling the horizontal stress and vibration strength can effectively prevent rock bursts. Zhang [14] established an energy integral model for the rock burst-inducing zone and a friction work calculation model for the plastic zone to analyze the mechanism of the rock bursts in soft coal roadways. The prevention and control of the rock bursts in roadways are mainly achieved by measures such as hydraulic fracturing [15,16,17], blasting [18,19,20], and drilling yielding [21,22]. Cai [23] established a mechanical model for the weakening of the rock mass by a water injection to clarify that a water injection can reduce the energy storage capacity of a rock mass and the stress value near the working face. Song [24] used water jet cut slots to block the stress and energy transfer in a coal mass and reduce the risk of rock bursts in roadways. Guo [25] cut off the stress transfer path by weakening the hard floor to reduce the energy accumulation and hence lower the risk of floor rock bursts in high-stress roadways. Zhang [26] released the shock source energy through drilling and blasting yielding and transferred the high static stress to the deep surrounding rock. Guo [27] used strong and weak disturbance destress techniques to prevent rock bursts in roadways with a high in situ stress. Sun [28] employed blasting to change the mechanical properties of the surrounding rock and thereby reduce its energy storage capacity. As the main support method for coal mine roadways, anchor cables (bolts) play an important role in controlling the deformation of roadways and improving the rock burst resistance of roadways [29,30,31]. However, few studies have been conducted on the dynamic response characteristics of underground coal mine support systems. To fill this research gap, this study took a mine in Shaanxi Province, China as the background to investigate the dynamic response characteristics of the roadway surrounding the rock and support elements under different shock intensities and to analyze the deformation and failure patterns of the roadway surrounding the rock. On this basis, we propose a full anchor cable yielding support technology for preventing rock bursts in the roadway surrounding the rock, which effectively improves the burst resistance of the roadway surrounding the rock and ensures the safe production of the working face, providing a reference for the construction of support systems for preventing rock bursts in similar roadways.

2. Engineering Background

2.1. Project Profile

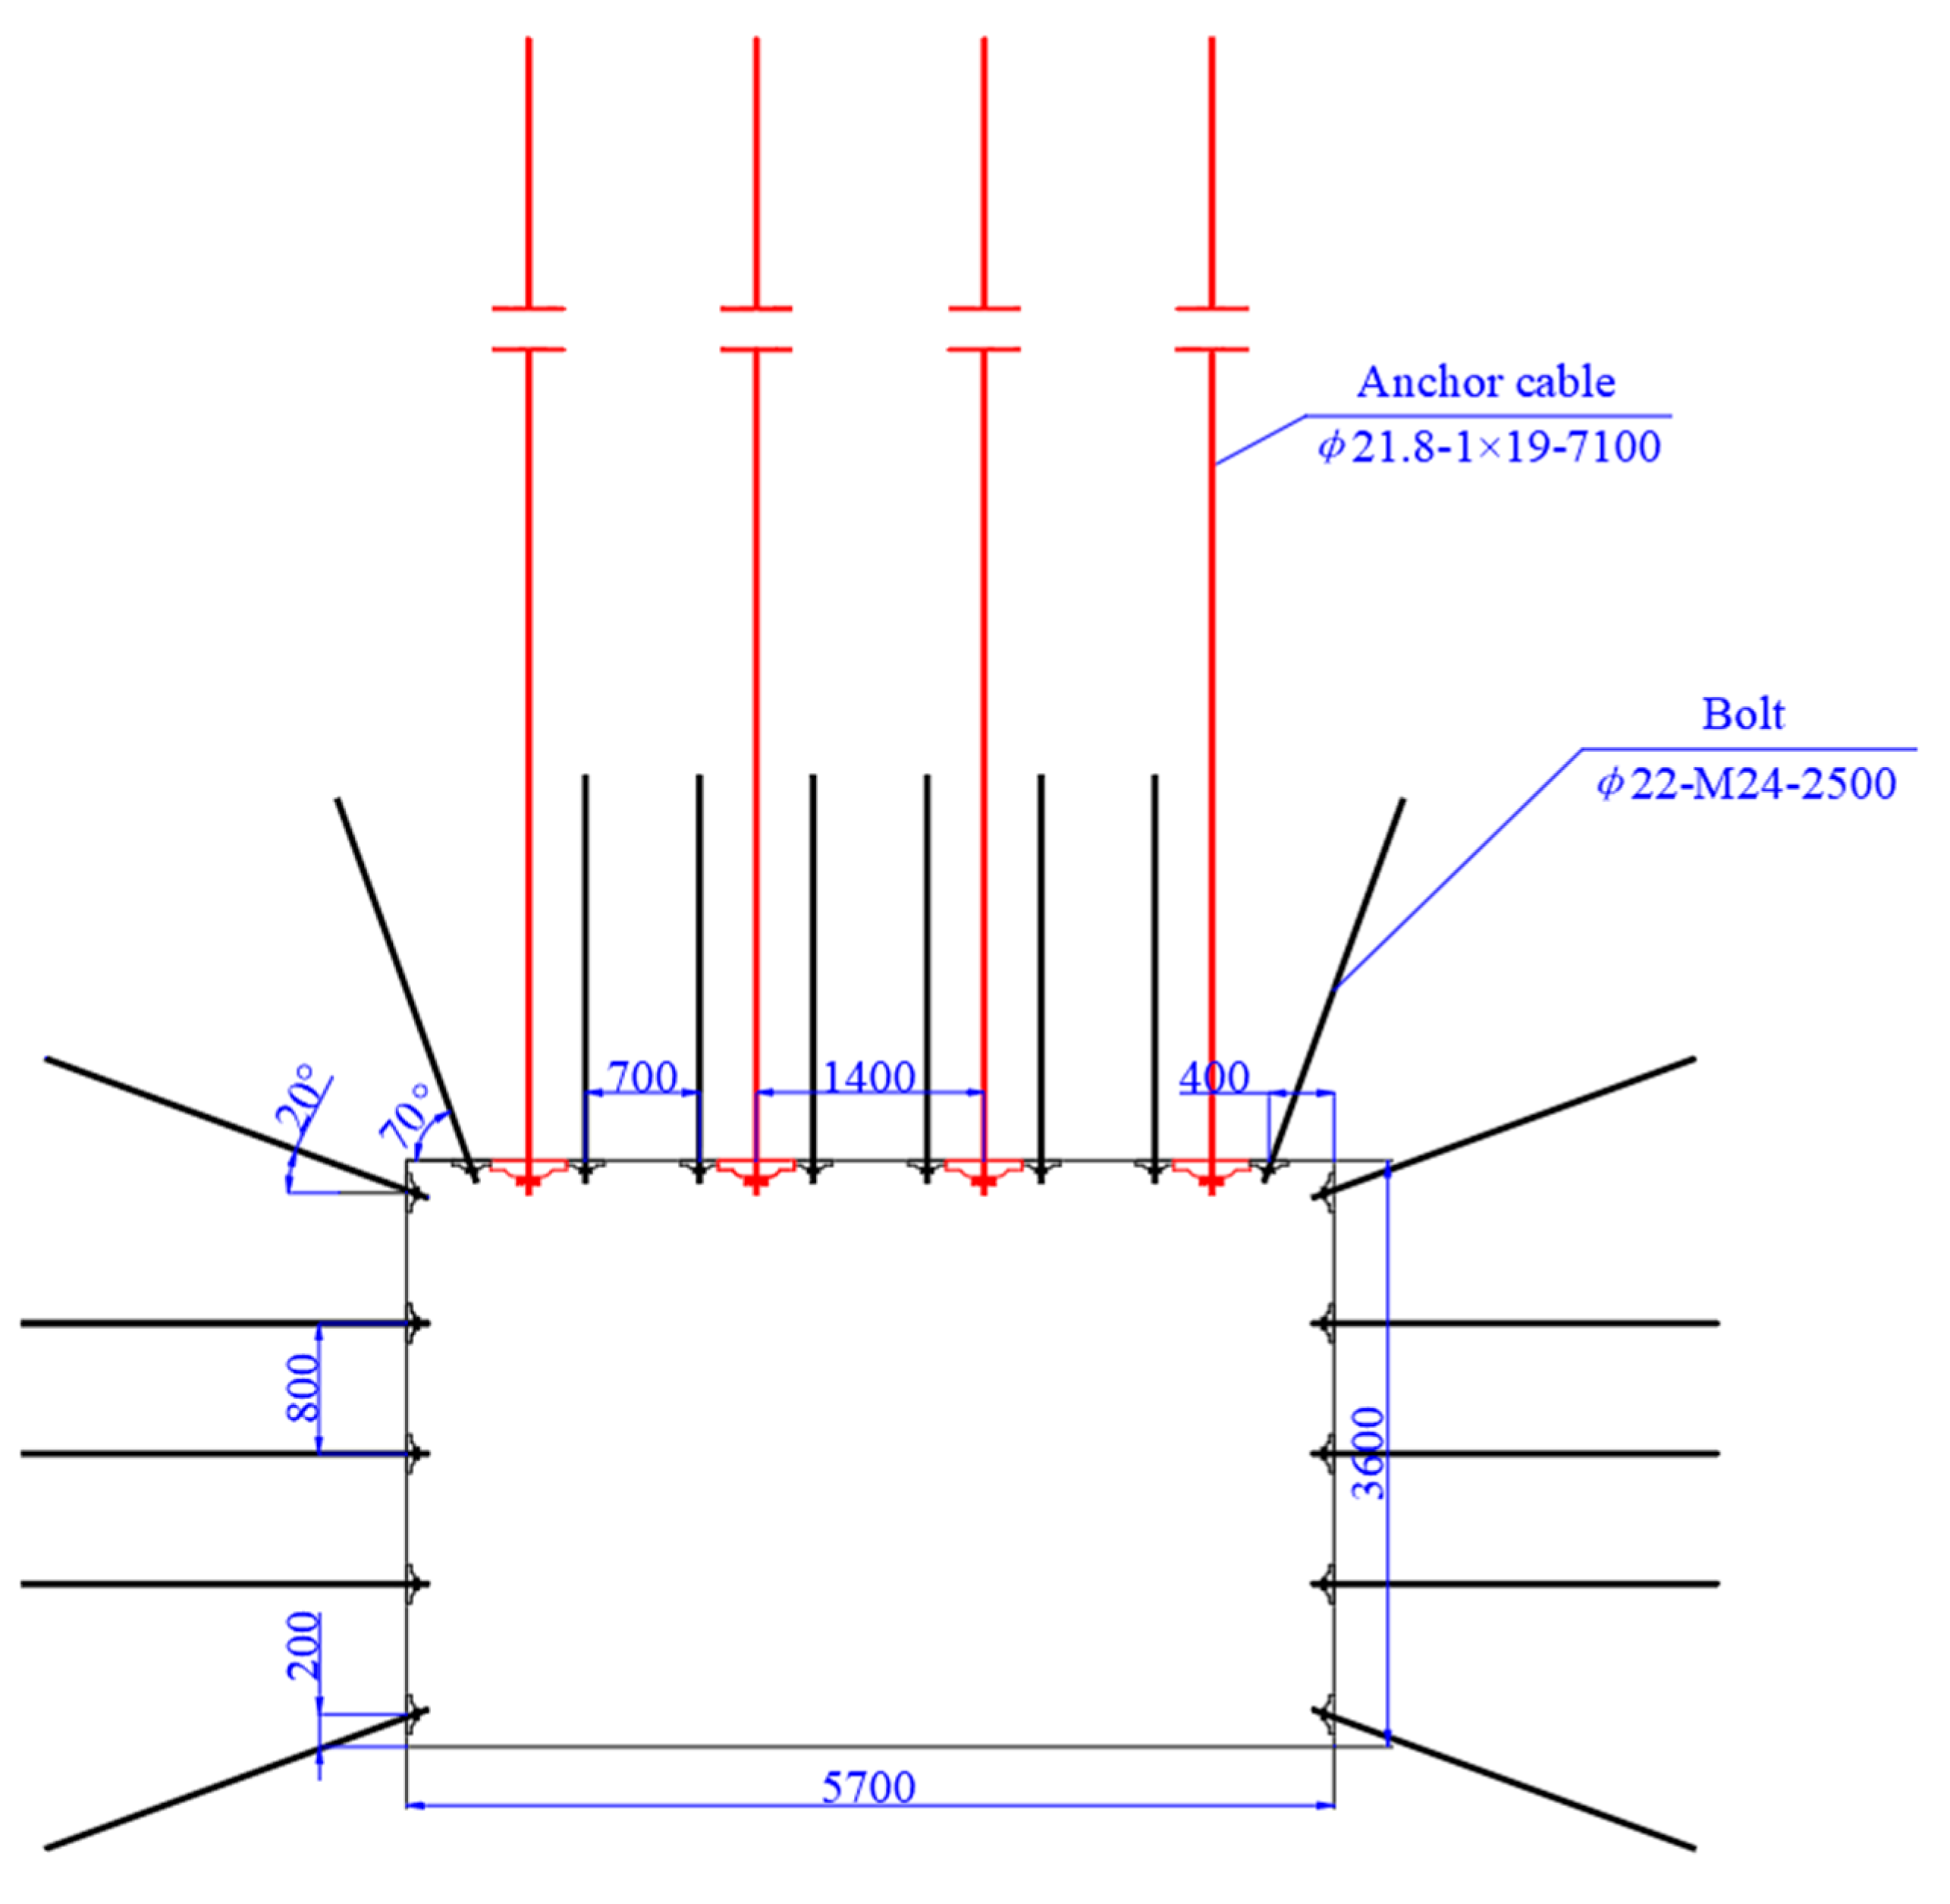
The 40307-belt transport roadway has a maximum burial depth of 752 m. The roadway is located in the middle of the #4 coal seam. The #4 coal seam, along with its roof and floor, has a weak rock burst tendency. The roadway surrounding the rock has a maximum principal stress of 21.23–30.17 MPa, which is in the direction approximately perpendicular to the roadway axis. Multiple layers of hard sandstone roofs have a thickness of more than 10 m in the overlying strata above the working face, with a strong dynamic load disturbance of the roofs. The histogram of coal and rock strata is shown in Figure 1. The roadway has a cross section of 5.7 × 3.6 m and is supported by an anchor mesh. The roof anchor bolts are Φ22 × 2500 mm left-handed threaded steel anchor bolts without a longitudinal reinforcement, arranged at spacings of 700 × 800 mm, each with a pretension of 120 kN. The roof anchor cables are Φ21.8 × 7100 mm high-strength prestressing steel strand cables, arranged at spacings of 1400 × 1600 mm, each with a pretension of 200 kN. The side anchor bolts are Φ22 × 2500 mm left-handed threaded steel anchor bolts without a longitudinal reinforcement, arranged at spacings of 800 × 800 mm, each with a pretension of 120 kN. The support parameters of the surrounding rock of the roadway are shown in Figure 2.

2.2. Roadway Failure Characteristics

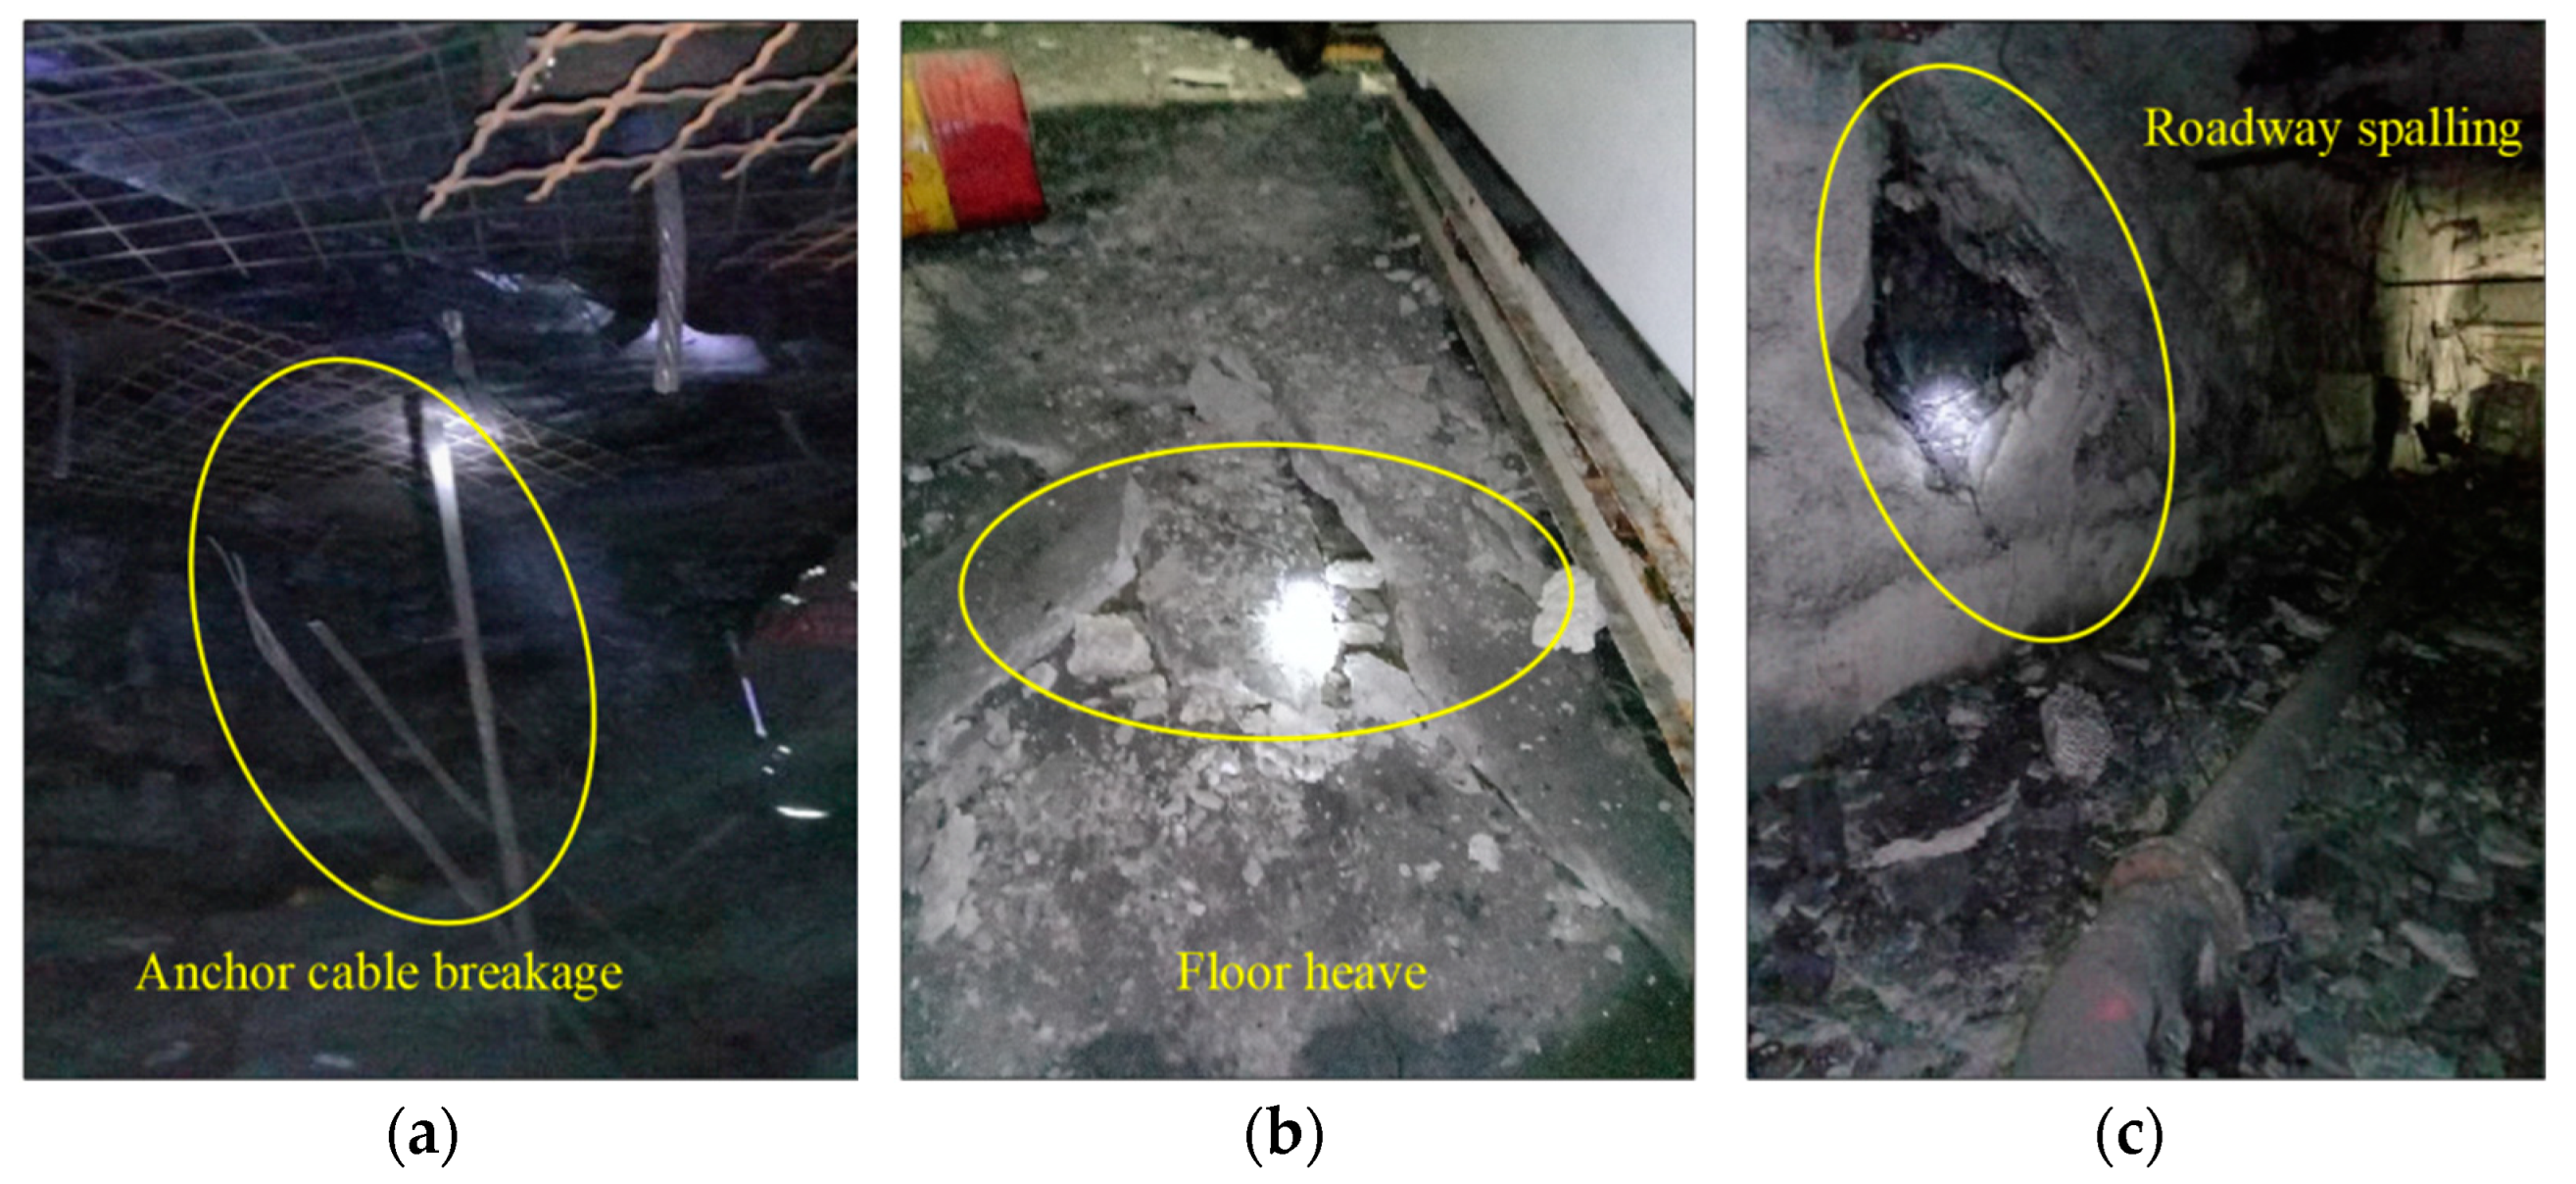
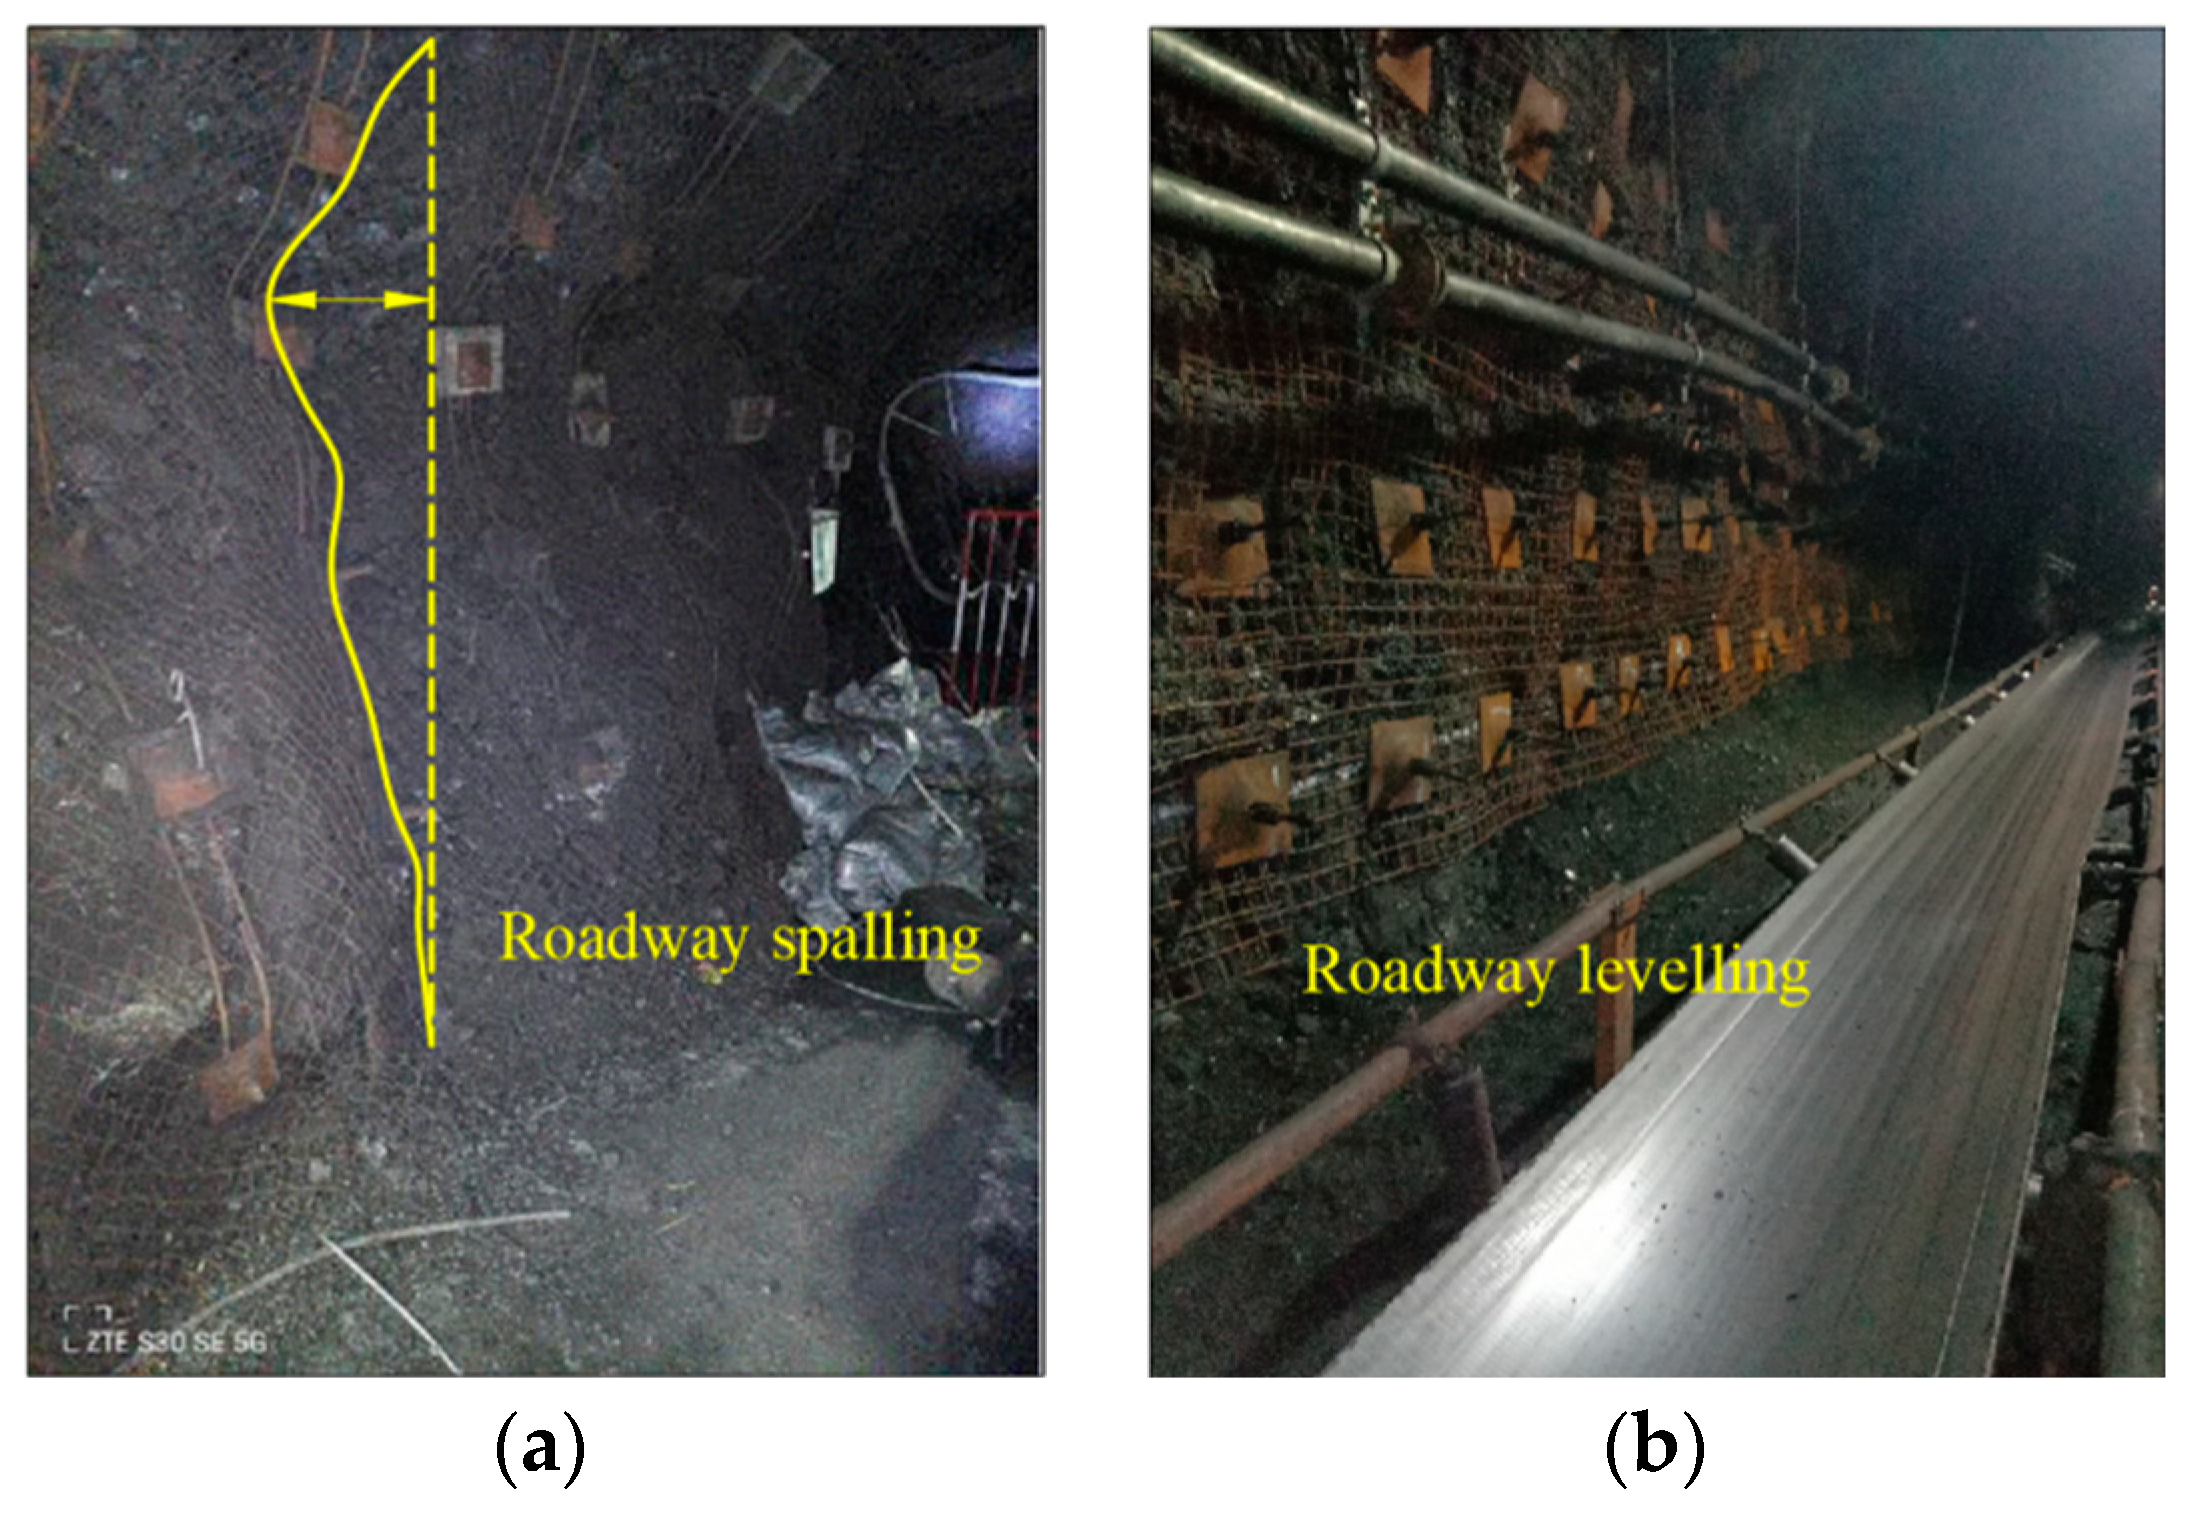
Due to the large burial depth of the working face, high in situ stress, and the strong dynamic load disturbance in the overlying strata, the surrounding rock of the 40307-belt transport roadway often exhibits a rib spalling, floor heave, and anchor cable breakage during excavation and mining, which seriously affects the safe and efficient production of the mine. The deformation and failure of the roadway are shown in Figure 3.

3. Dynamic Response Characteristics of Roadway Surrounding Rock and the Support System

3.1. Numerical Model

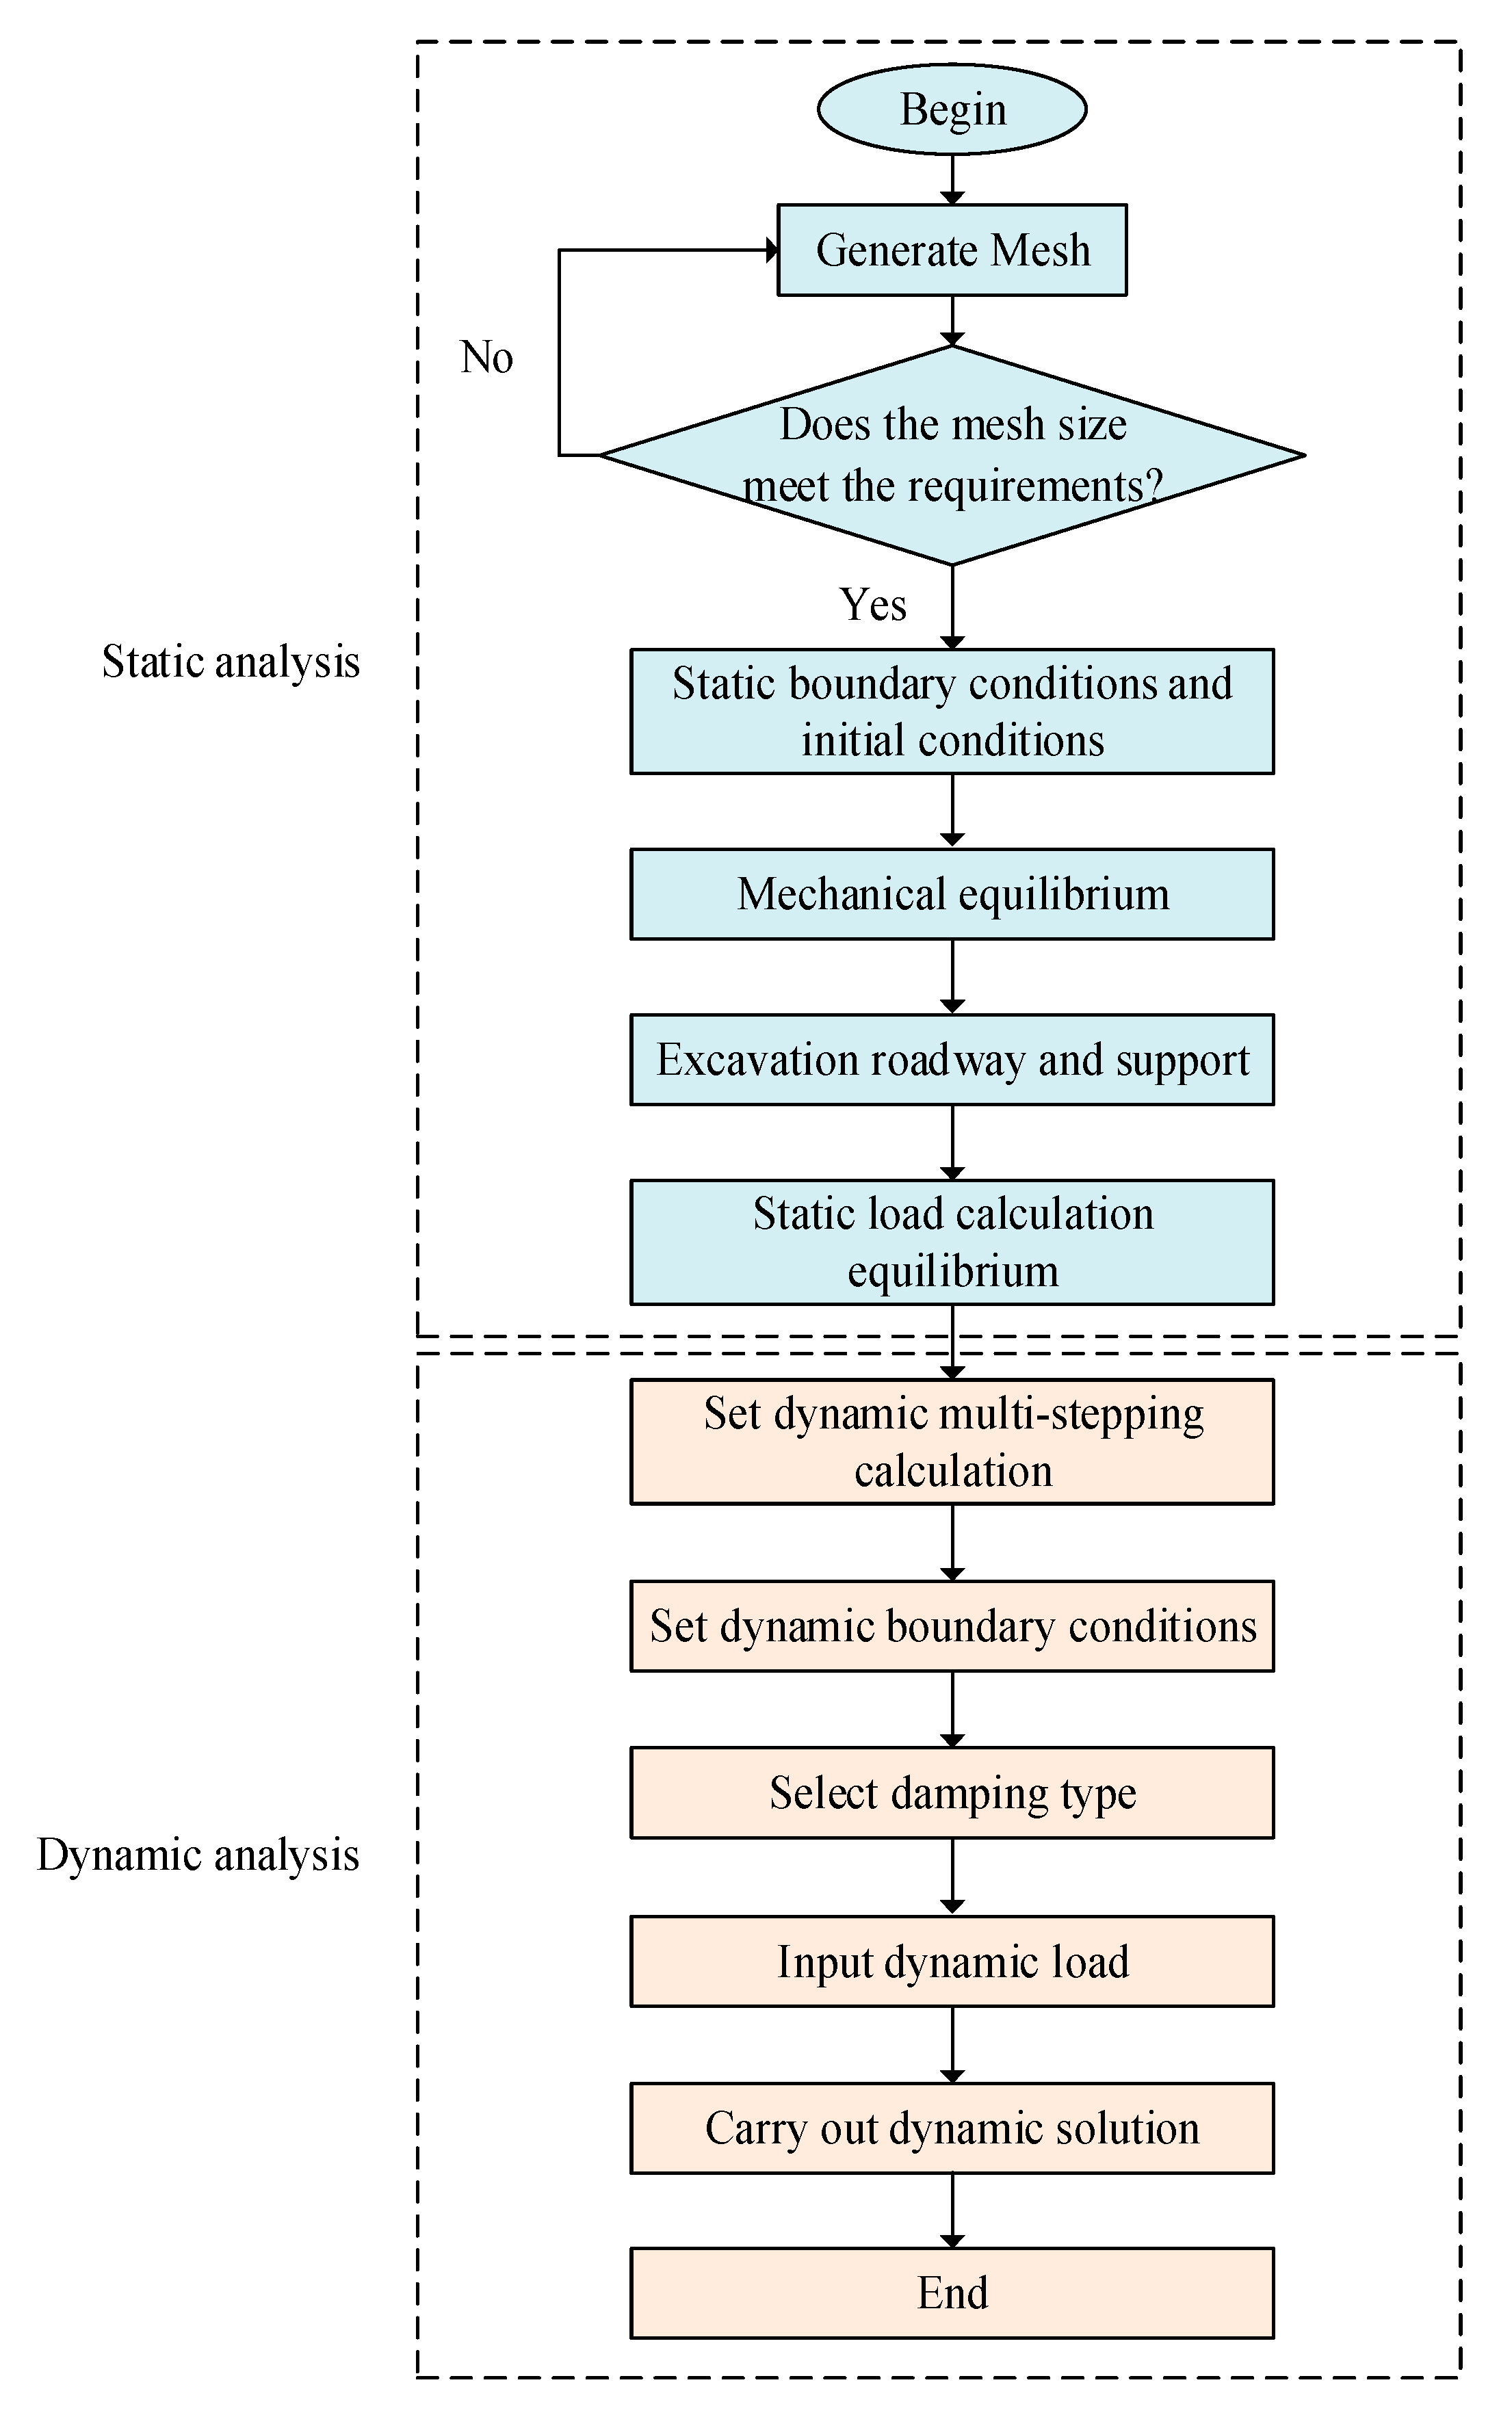
A 106 × 10 × 100 m three-dimensional model was built using FLAC3D according to the geological conditions of the working face and the mechanical parameters of the coal rock. The mesh size of the model elements was 1 × 1 × 1 m. The numerical model is shown in Figure 4, and the mechanical parameters of the coal and rock are shown in Table 1. Adopting the Mohr–Coulomb criterion, the model was subjected to loads of 23.25 MPa and 17.4 MPa in the horizontal and vertical directions, respectively, and had fixed boundaries all around. A free-field boundary condition on the dynamic load was adopted for the model. The model was loaded using static and dynamic modules in sequence, as shown in Figure 5. The static load convergence rate of the numerical model was 10−5. The dynamic shock was applied in the form of a cosine wave with a frequency of 50 Hz over three vibration cycles, using a local damping coefficient of 0.2. The dynamic shock was applied at 20 m above the roadway roof with shock intensities of 10 MPa (104 J), 30 MPa (105 J), 60 MPa (106 J), and 100 MPa (107 J). The dynamic calculation time was 0.3 s. The dynamic response characteristics of the surrounding rock and support elements of the roadway under different shock intensities were simulated.

3.2. Dynamic Response Characteristics of the Surrounding Rock

Measurement points were arranged on the surface of the roadway surrounding rock to monitor the vibration velocity, acceleration, and displacement characteristics of the surrounding rock mass of the roadway under different shock energies, which allowed an analysis of the dynamic response characteristics of the roadway surrounding rock under dynamic shock.
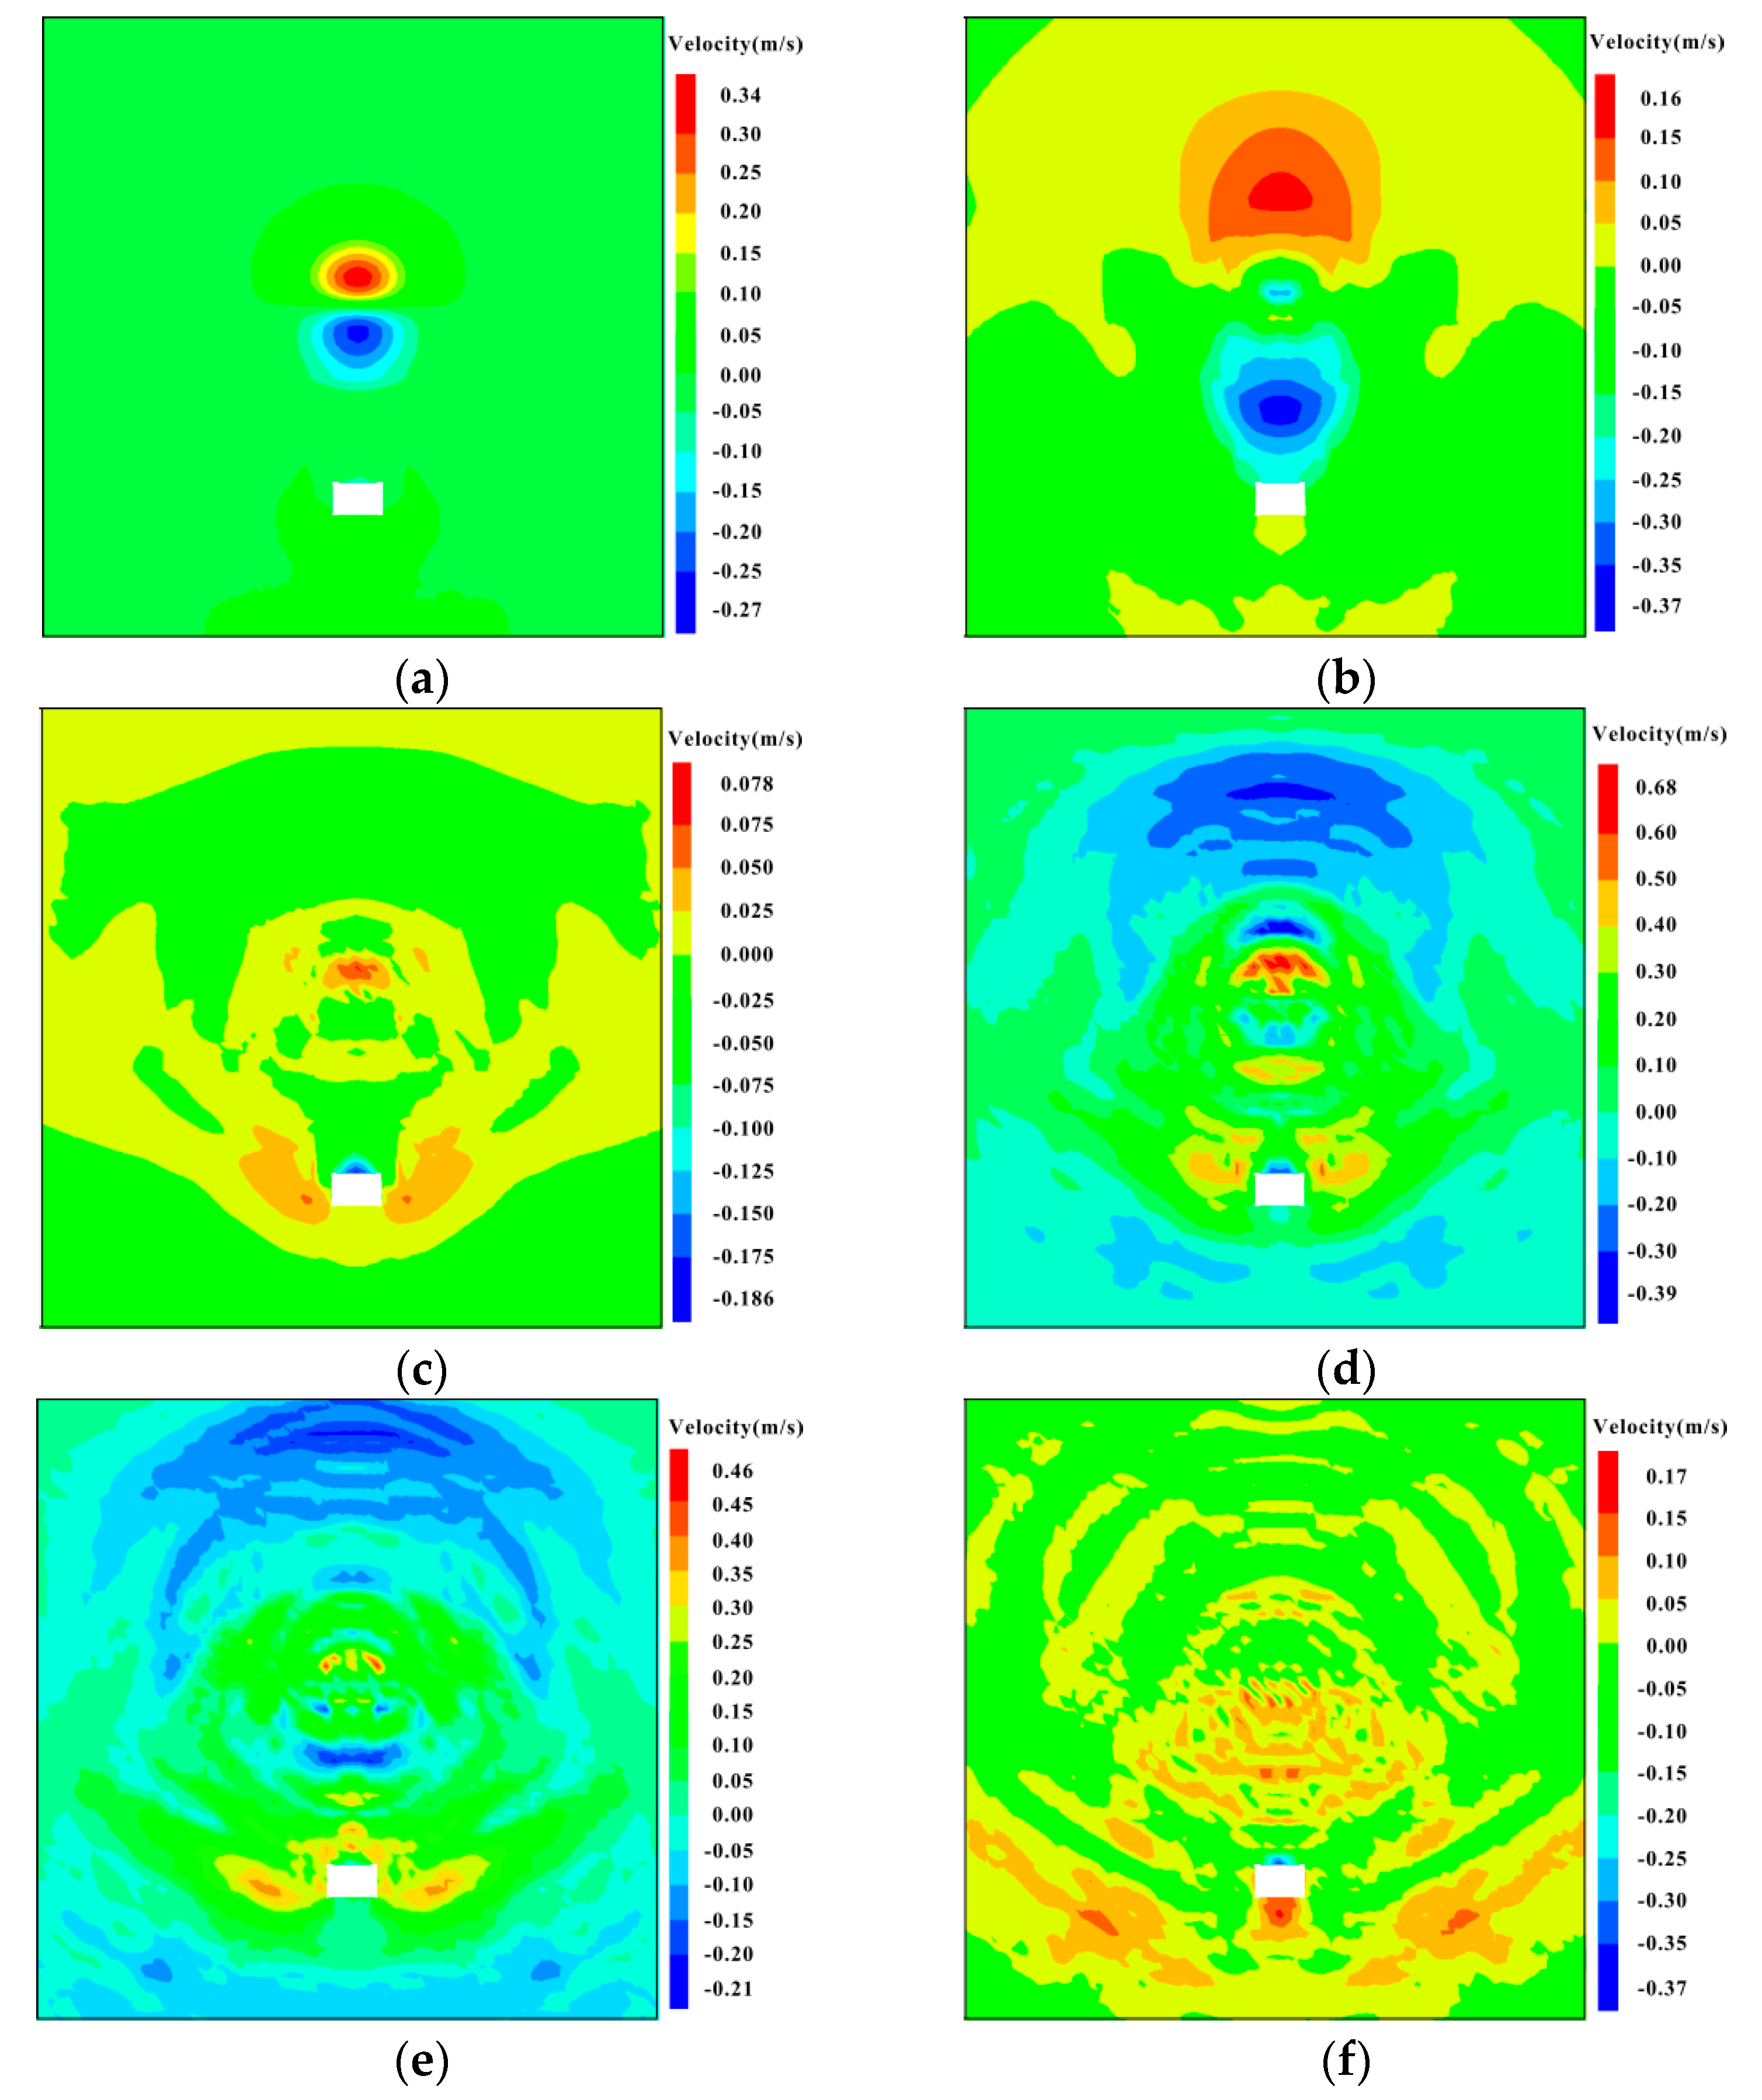
As shown in Figure 6, the shock source released energy, and the dynamic shock stress wave was centered at the source and transmitted outwards as a spherical shape in the coal rock mass. The dynamic stress wave energy caused the surrounding rock mass to vibrate, and the rapid vibration of the mass dissipated the dynamic stress wave energy. In the early stage of vibration (0 s), the shock source caused high-velocity vibrations of the surrounding rock mass near the source, with the vibrations reaching a velocity of 0.35 m/s. At 0.01 s, the dynamic stress wave was transmitted to the roof of the roadway, and the roof mass vibrated at a velocity as high as 0.31 m/s. At 0.02 s, the dynamic stress wave was transmitted to the two sides and floor of the roadway, where the surrounding rock mass vibrated at velocities of 0.078 m/s and 0.024 m/s, respectively, and the energy of the dynamic shock stress wave decayed as it propagated from near to far. Then, the roadway surrounding rock was subjected to a periodic cyclic dynamic load, and the disturbance range of the dynamic stress wave was further expanded. When the shock time was greater than 0.06 s, the release of energy by the shock source ended, and the residual stress wave inside the roadway surrounding the rock relied on the low-velocity vibration of the surrounding rock mass to dissipate the dynamic load energy.
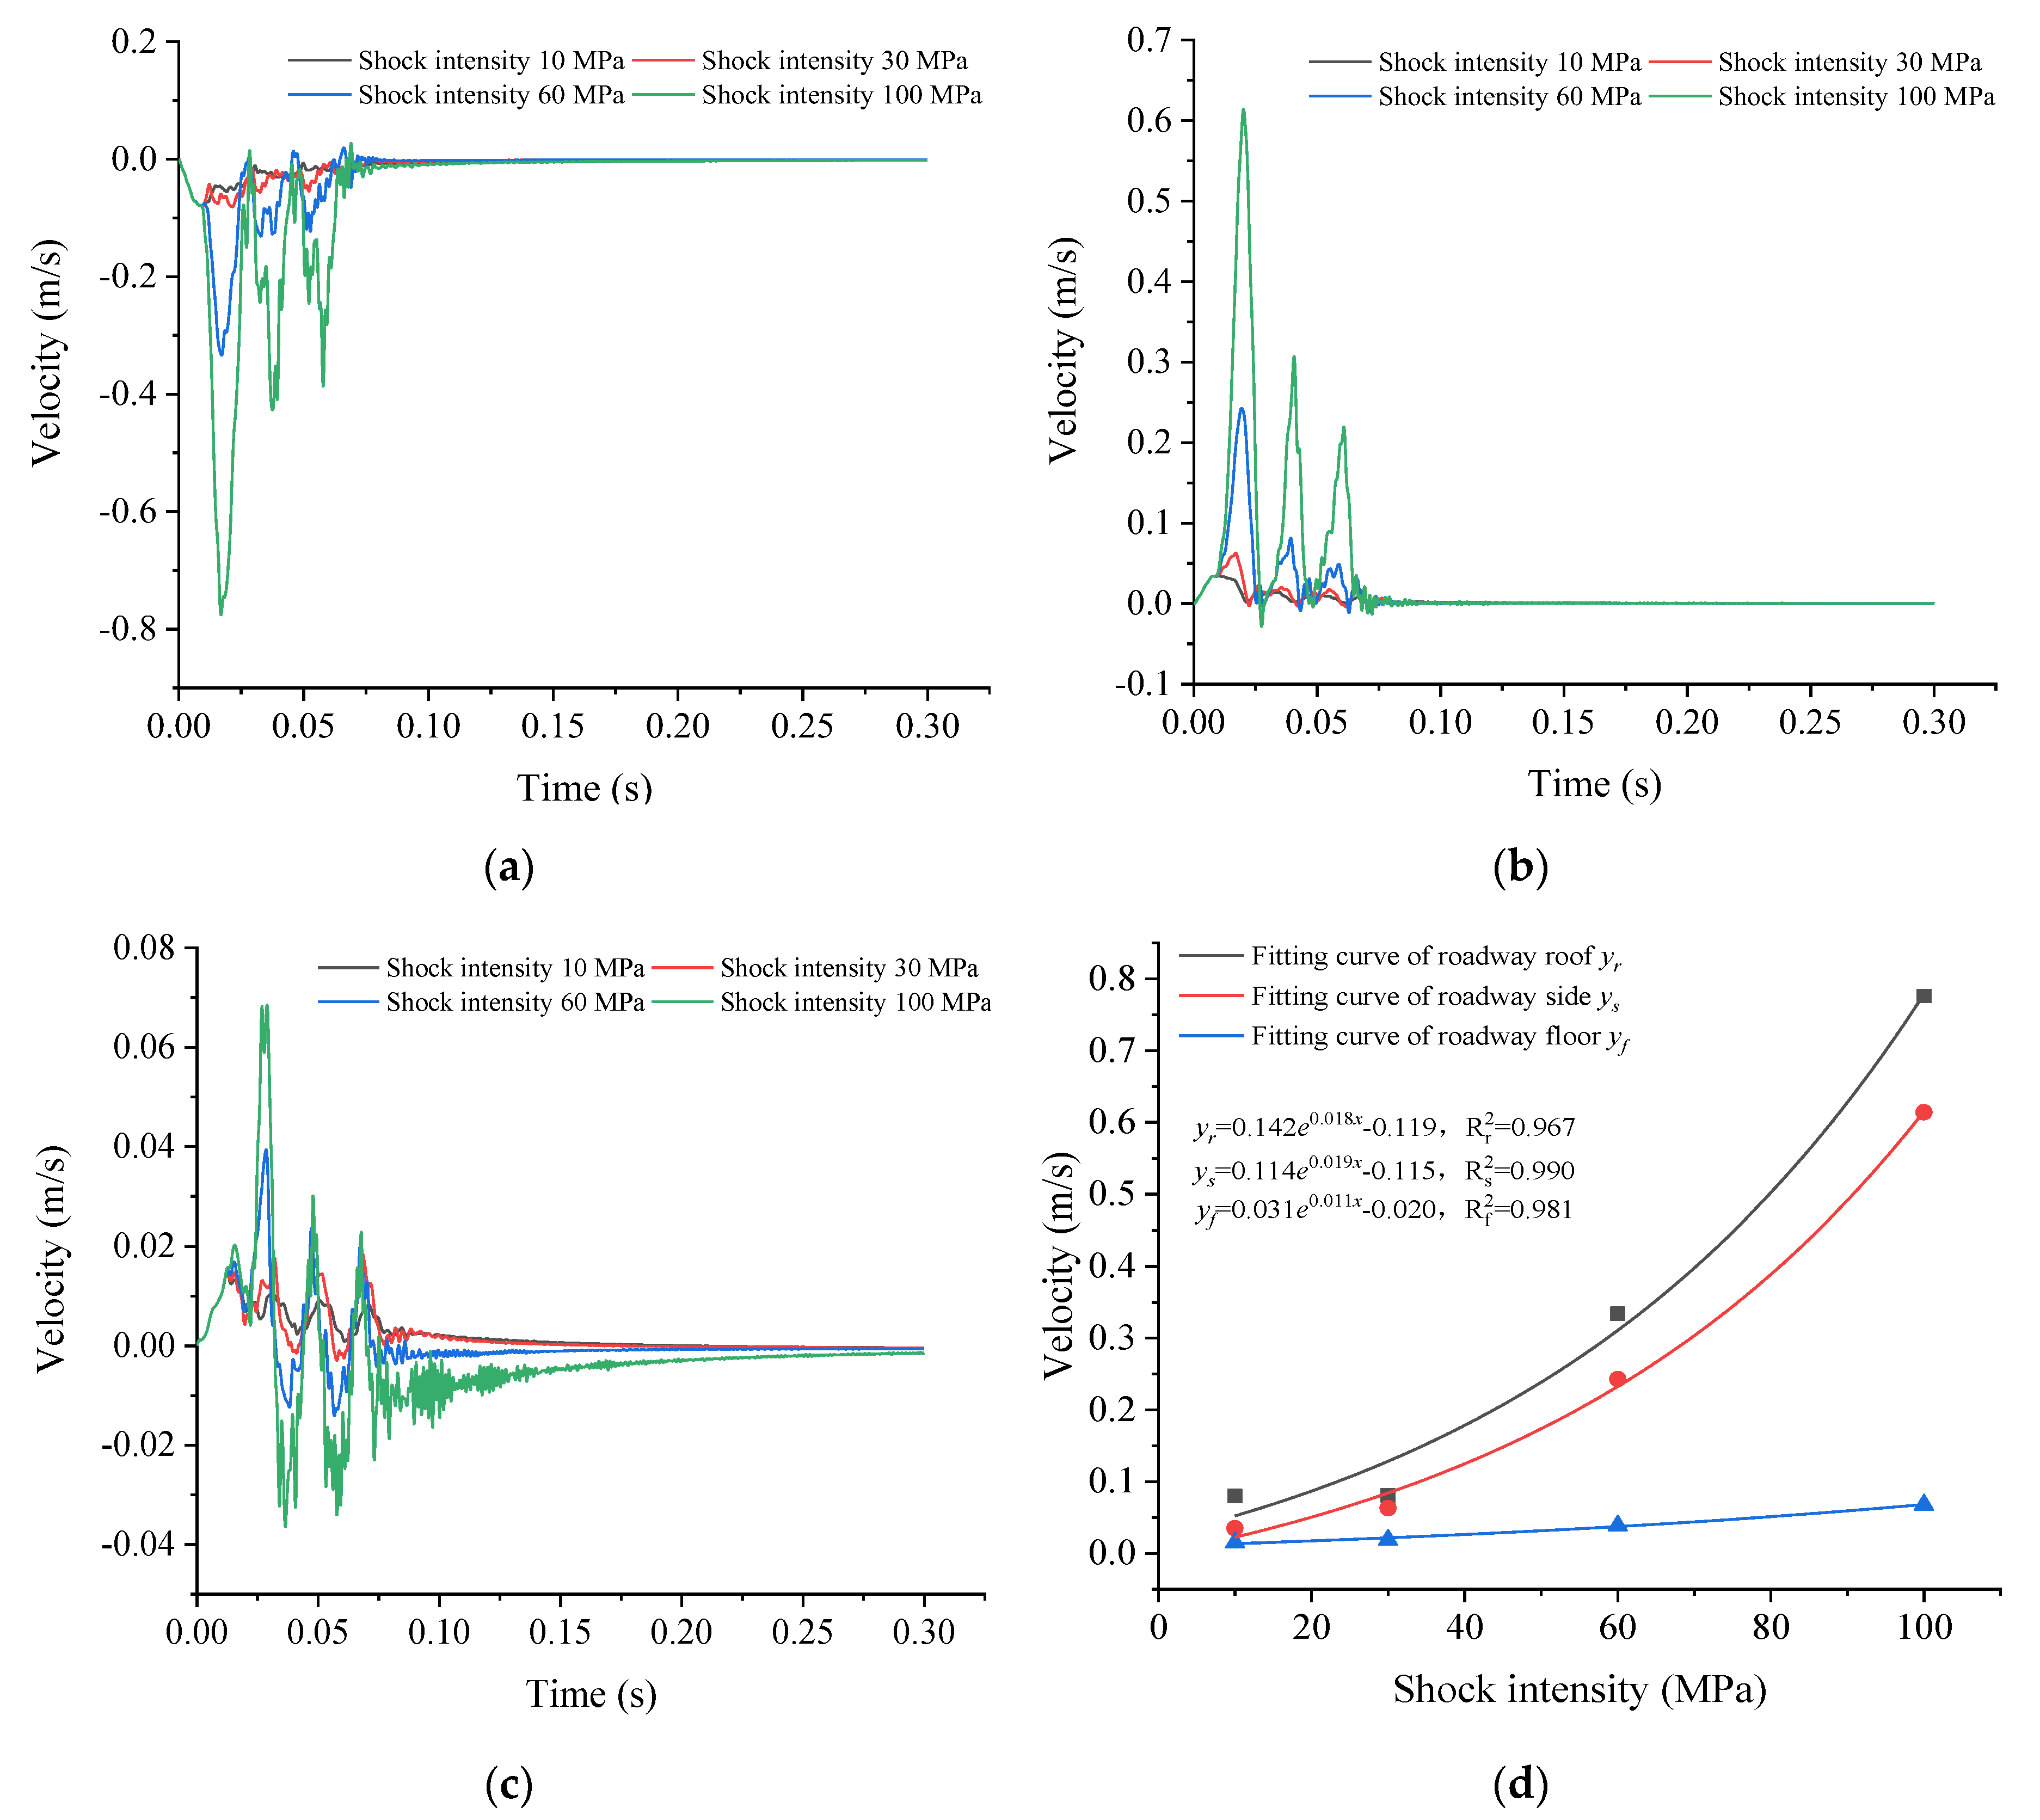
As shown in Figure 7, as the shock intensity increased, the vibration velocity of the roadway surrounding the rock mass increased, with the vibration velocities of the rock masses ranked in descending order as roof > sides > floor, and the roof was disturbed the most by the dynamic shock. Under dynamic shock, the surrounding rock masses at the roof and sides of the roadway mainly vibrated towards the interior of the roadway space, and a tensile failure occurred on the surface of the roadway surrounding the rock; the rock mass at the floor of the roadway vibrated in a reciprocating manner; and a tensile and compressive failure occurred on the floor. In the process of shock stress wave propagation, 0–0.01 s was the stage of the stress vibration’s initiation, during which the stress wave passed through each rock layer inside the surrounding rock and was transmitted to the surface of the roadway, causing the mass on the surface of the roadway to start vibrating; 0.01–0.07 s was the stress fluctuation stage, during which the dynamic stress wave acted on the surface of the roadway, the surrounding rock on the surface of the roadway generated periodic rapid vibrations, and tensile and compressive stresses were generated on the surface of the surrounding rock, leading to the severe failure of the surrounding rock; and 0.07–0.3 s was the stress adjustment stage, during which the release of the dynamic load energy by the shock source ended, and the residual dynamic stress wave gradually attenuated inside the surrounding rock, which tended to stabilize. When the dynamic shock intensity was 10 MPa (104 J), 30 MPa (105 J), 60 MPa (106 J), and 100 MPa (107 J), the maximum vibration velocity of the roof mass of the roadway surrounding the rock was 0.080, 0.081, 0.334, and 0.776 m/s, respectively, the maximum vibration velocity of the side mass was 0.035, 0.063, 0.243, and 0.614 m/s, respectively, and the maximum vibration velocity of the floor mass was 0.015, 0.019, 0.039, and 0.068 m/s, respectively. The maximum vibration velocity of the roadway surrounding the rock mass increased exponentially as the dynamic shock intensity increased. When the dynamic shock energy was greater than 105 J, the vibration velocities of the roof and side masses increased significantly, and the dynamic shock responses of the roadway surrounding the rock became pronounced. Therefore, 105 J was the critical energy value for the dynamic shock disaster of the roadway surrounding the rock.
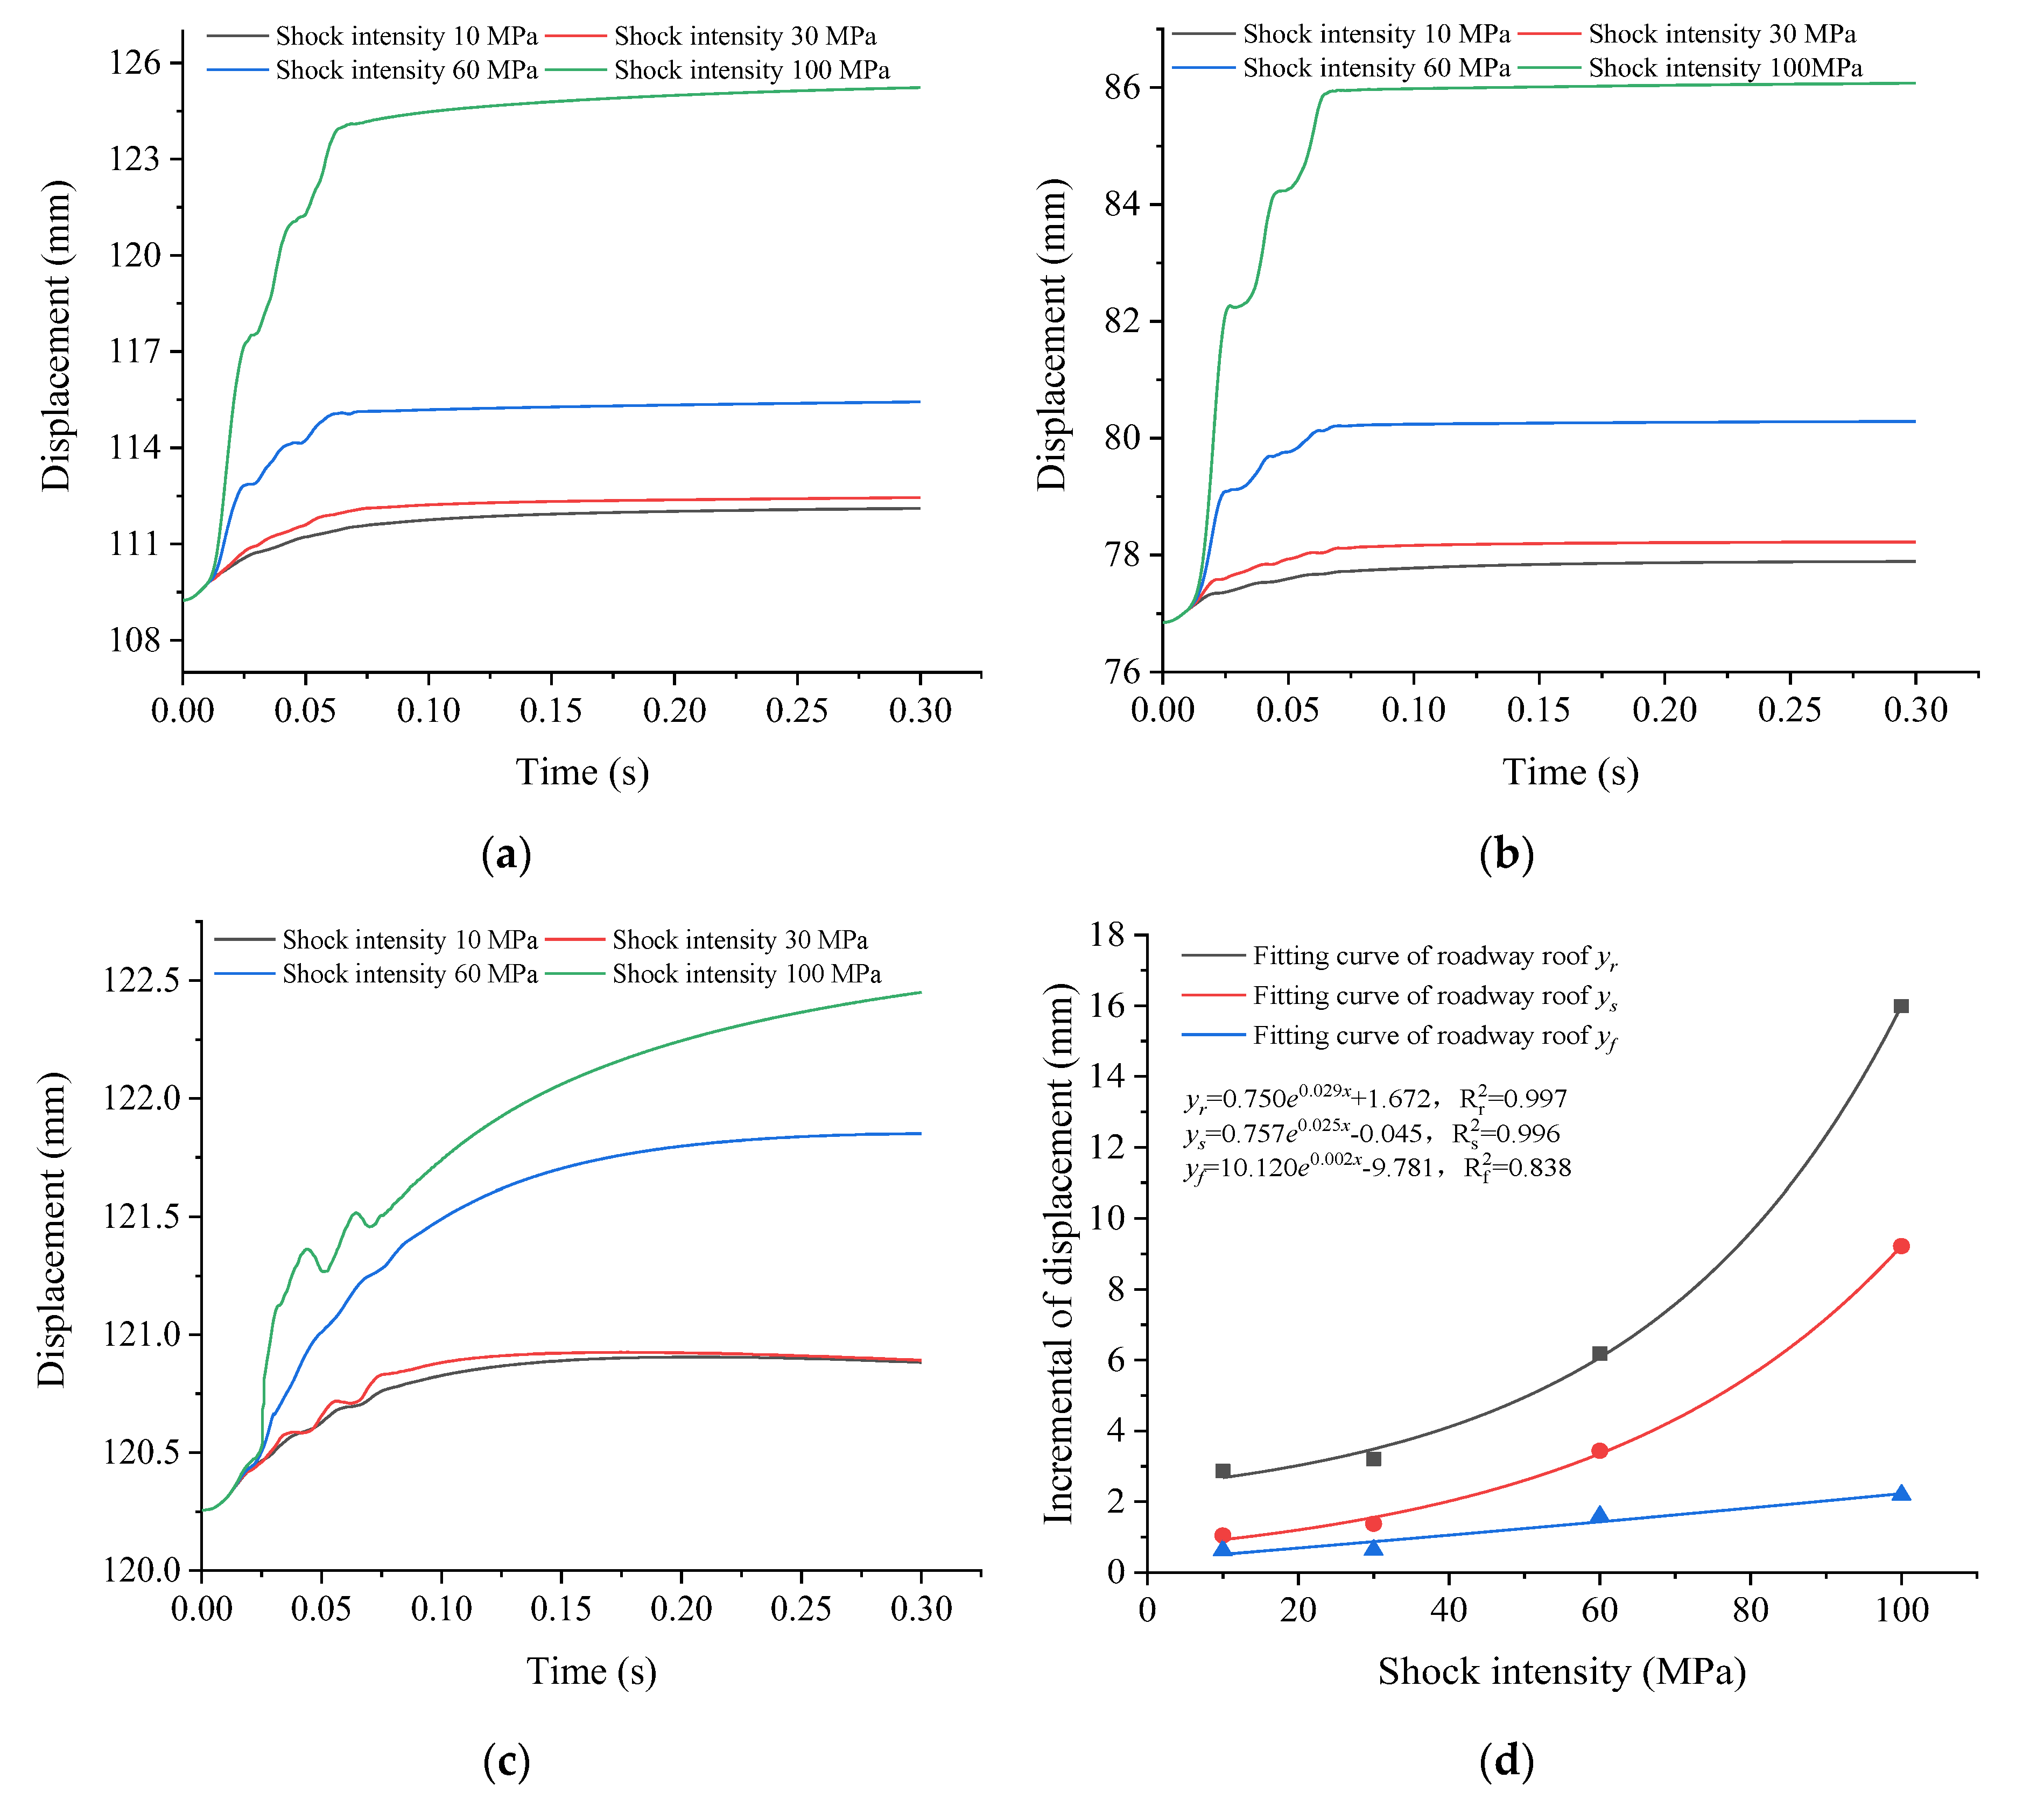
Figure 8 shows that the displacement of the roadway surrounding the rock increased with the dynamic shock intensity. The growth rate of the roof displacement was considerably greater than that of the side and floor displacements, indicating that the shock source was located on the roof and that the failure of the roadway surrounding rock was mainly caused by the dynamic deformation of the roof. In the stress vibration initiation stage (0–0.01 s), the stress wave did not reach the roadway surface; hence, the displacement of the roadway surface was not significantly affected by the shock stress wave and grew slowly. In the stress fluctuation stage (0.01–0.07 s), the dynamic stress wave reached the roadway surface, so the roadway was significantly affected by the dynamic shock stress and the displacement rapidly increased; in particular, the greater the shock intensity was, the faster the displacement growth rate was. In the stress adjustment period (0.07–0.3 s), the release of energy by the shock source ended, and the roadway surrounding the rock surface displacement stabilized. When the dynamic shock intensity was 10 MPa (104 J), 30 MPa (105 J), 60 MPa (106 J), and 100 MPa (107 J), the displacement increment of the roof of the roadway surrounding the rock was 2.867, 3.203, 6.187, and 15.987 mm, respectively, the displacement increment of the sides was 1.042, 1.376, 3.437, and 9.222 mm, respectively, and the displacement increment of the floor was 0.627, 0.636, 1.595, and 2.194 mm, respectively. Therefore, the displacement increment of the roadway surrounding the rock increased exponentially as the dynamic shock intensity increased; when the dynamic shock energy was greater than 105 J, the displacement increments of the roof and sides increased significantly, and the roadway surrounding the rock experienced a severe deformation and failure.
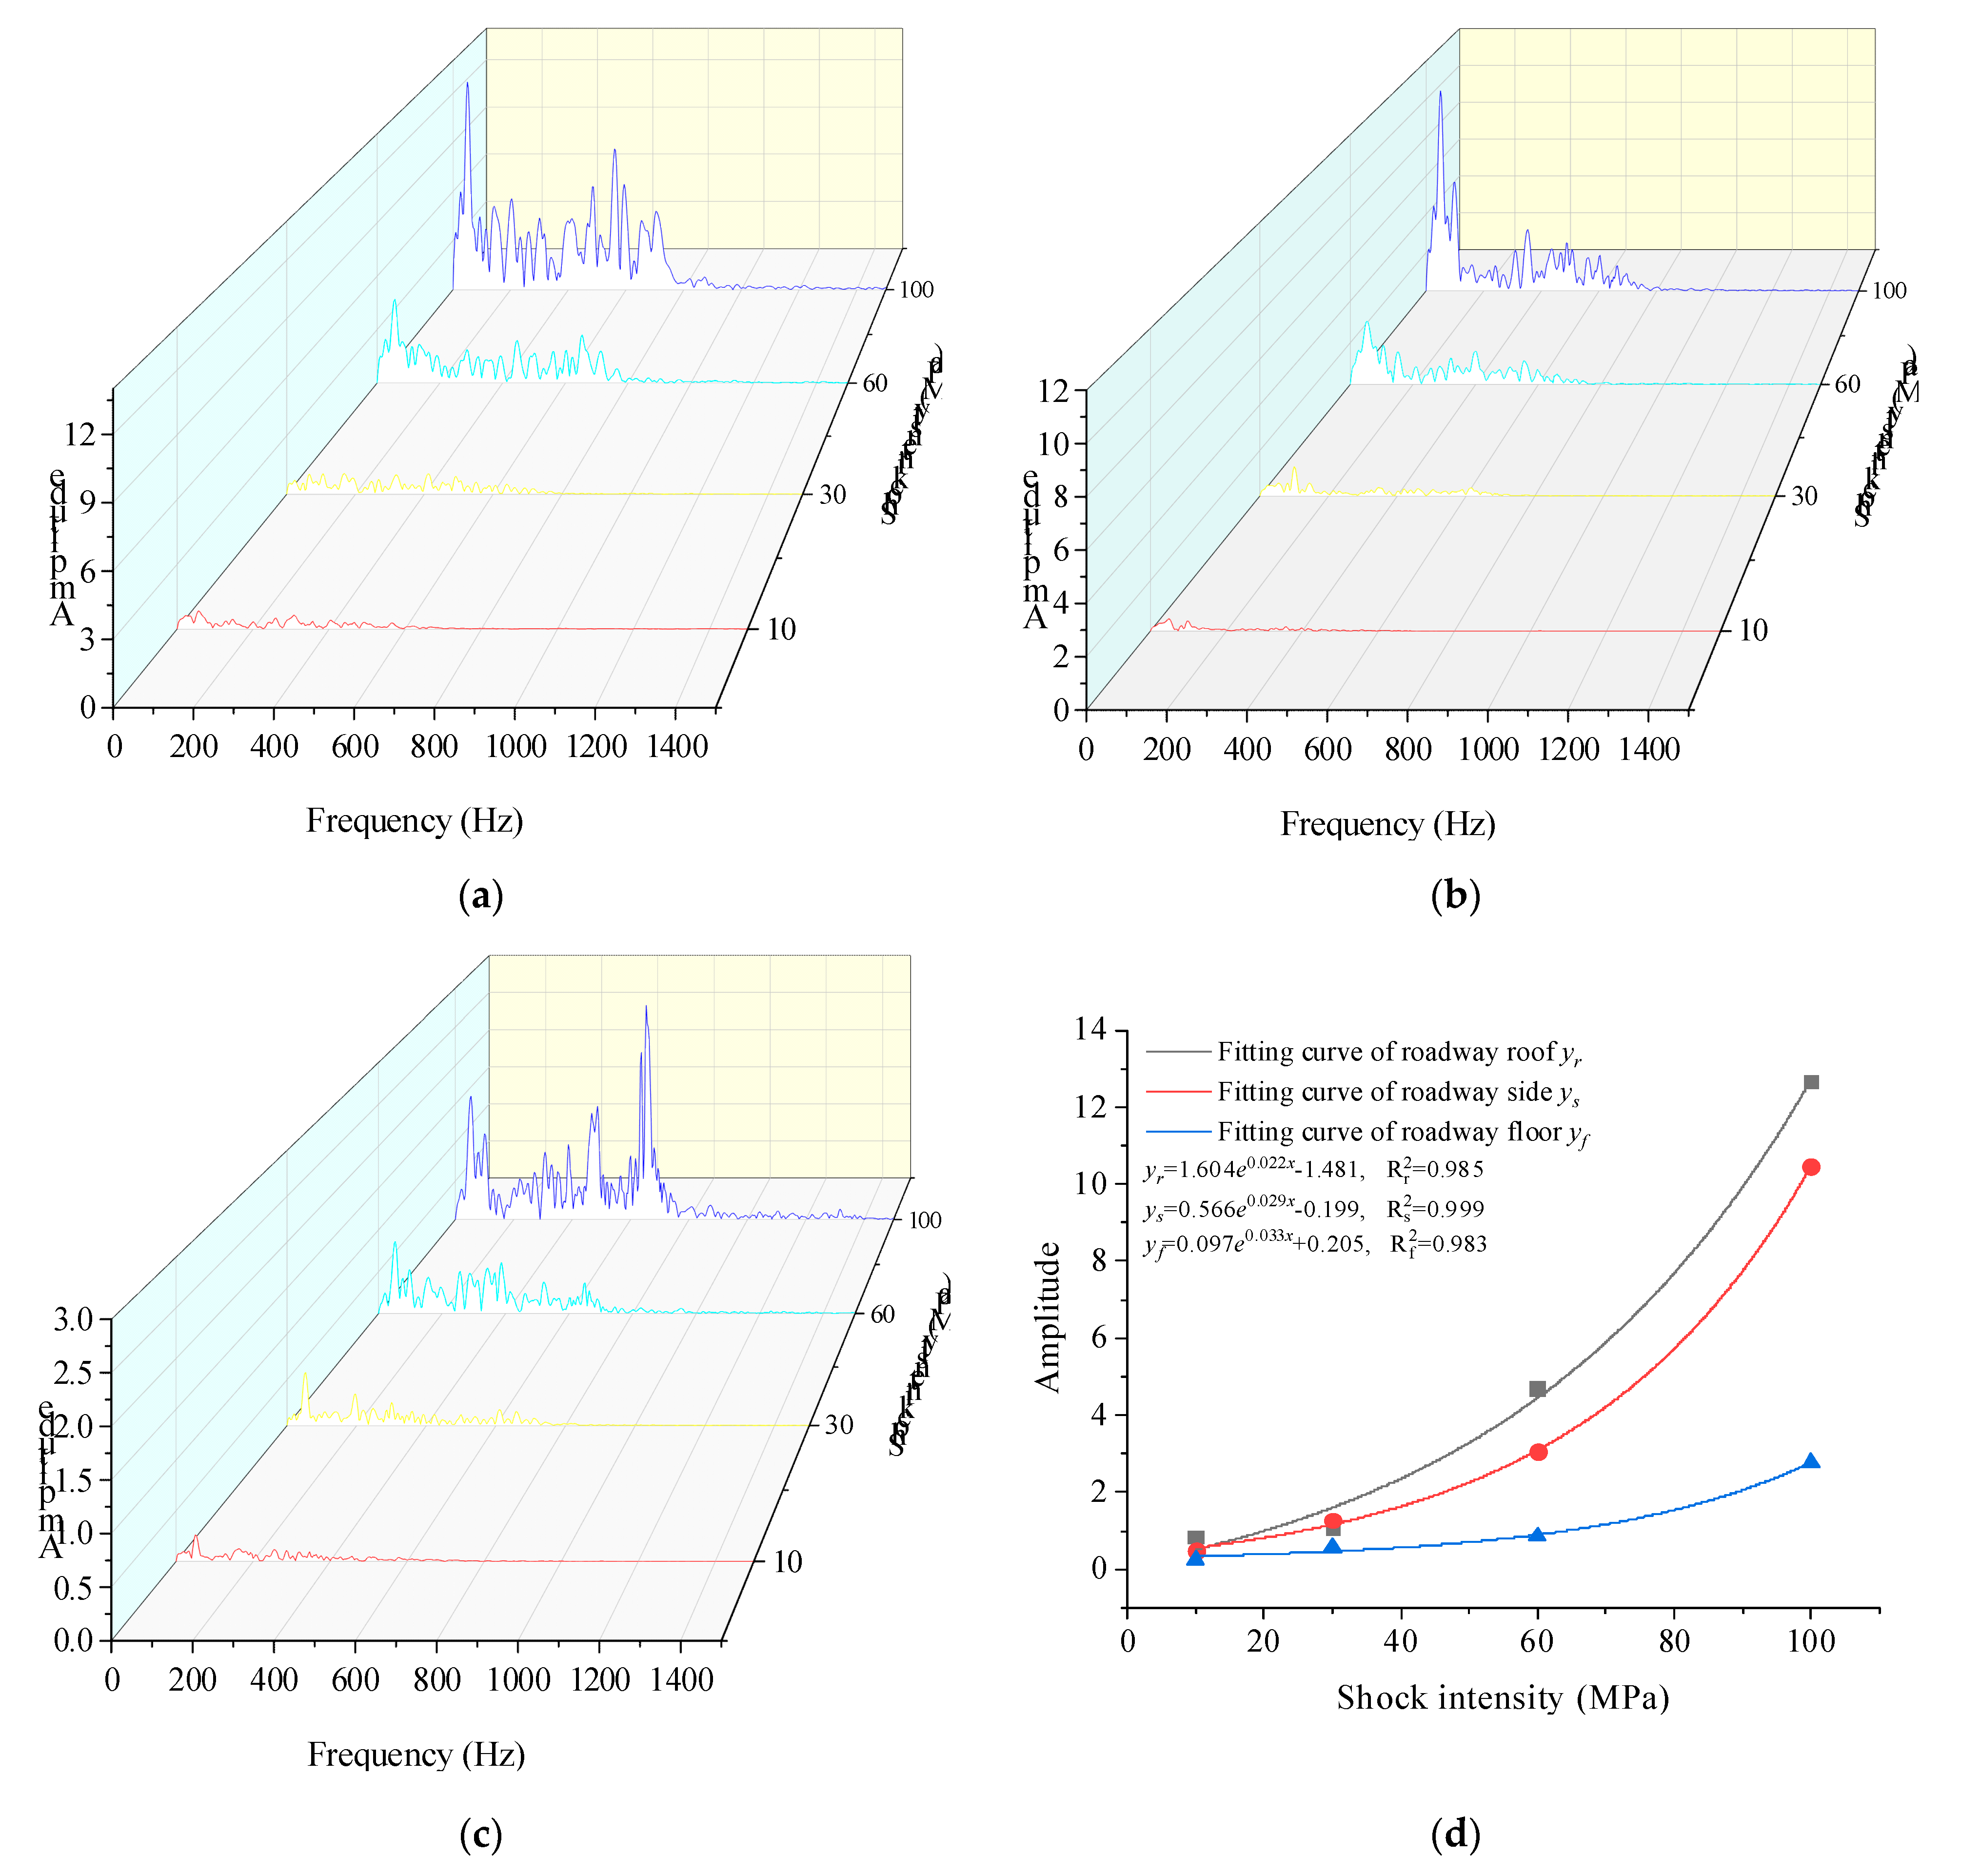
As shown in Figure 9, under different dynamic shock intensities, the frequencies of a vibration acceleration of the masses at different parts of the roadway surrounding the rock were distributed in the range of 0–1000 Hz, and the main vibration frequencies were distributed in the range of 0–845 Hz. The higher the dynamic shock intensity was, the larger the vibration acceleration amplitude of the mass of the roadway surrounding the rock was. When the dynamic shock intensity was 10 MPa (104 J), 30 MPa (105 J), 60 MPa (106 J), and 100 MPa (107 J), the maximum amplitude of the roof acceleration of the roadway surrounding rock was 0.839, 1.063, 4.694, and 12.670, respectively, the maximum amplitude of the side acceleration was 0.485, 1.280, 3.049, and 10.459, respectively, and the maximum amplitude of the floor acceleration was 0.262, 0.580, 0.856, and 2.777, respectively. Therefore, the vibration acceleration amplitude of the mass of the roadway surrounding the rock increased exponentially as the dynamic shock intensity increased; when the dynamic shock energy was greater than 105 J, the acceleration amplitudes of the roof, floor, and sides increased substantially, and the dynamic failure of the surrounding rock was aggravated.
In summary, the shock stress wave propagation process was divided into a stress vibration initiation stage, a stress fluctuation stage, and a stress adjustment stage. As the dynamic shock intensity increased, the vibration velocity, displacement increment, and acceleration amplitude of the mass of the roadway surrounding the rock increased exponentially. When the shock energy was greater than 105 J, the dynamic responses of the roadway surrounding the rock were significant; thus, 105 J was determined to be the critical energy value for the shock disaster of the roadway surrounding the rock.

3.3. Dynamic Response Characteristics of the Support System

The measurement points were arranged on the anchor cables (bolts) of the roof and sides of the roadway at 1.5 m from the roadway surface to monitor the response characteristics of the axial forces of the anchor cables (bolts) under dynamic shock, so as to analyze the shock resistance of the anchor cables (bolts) under different shock intensities.
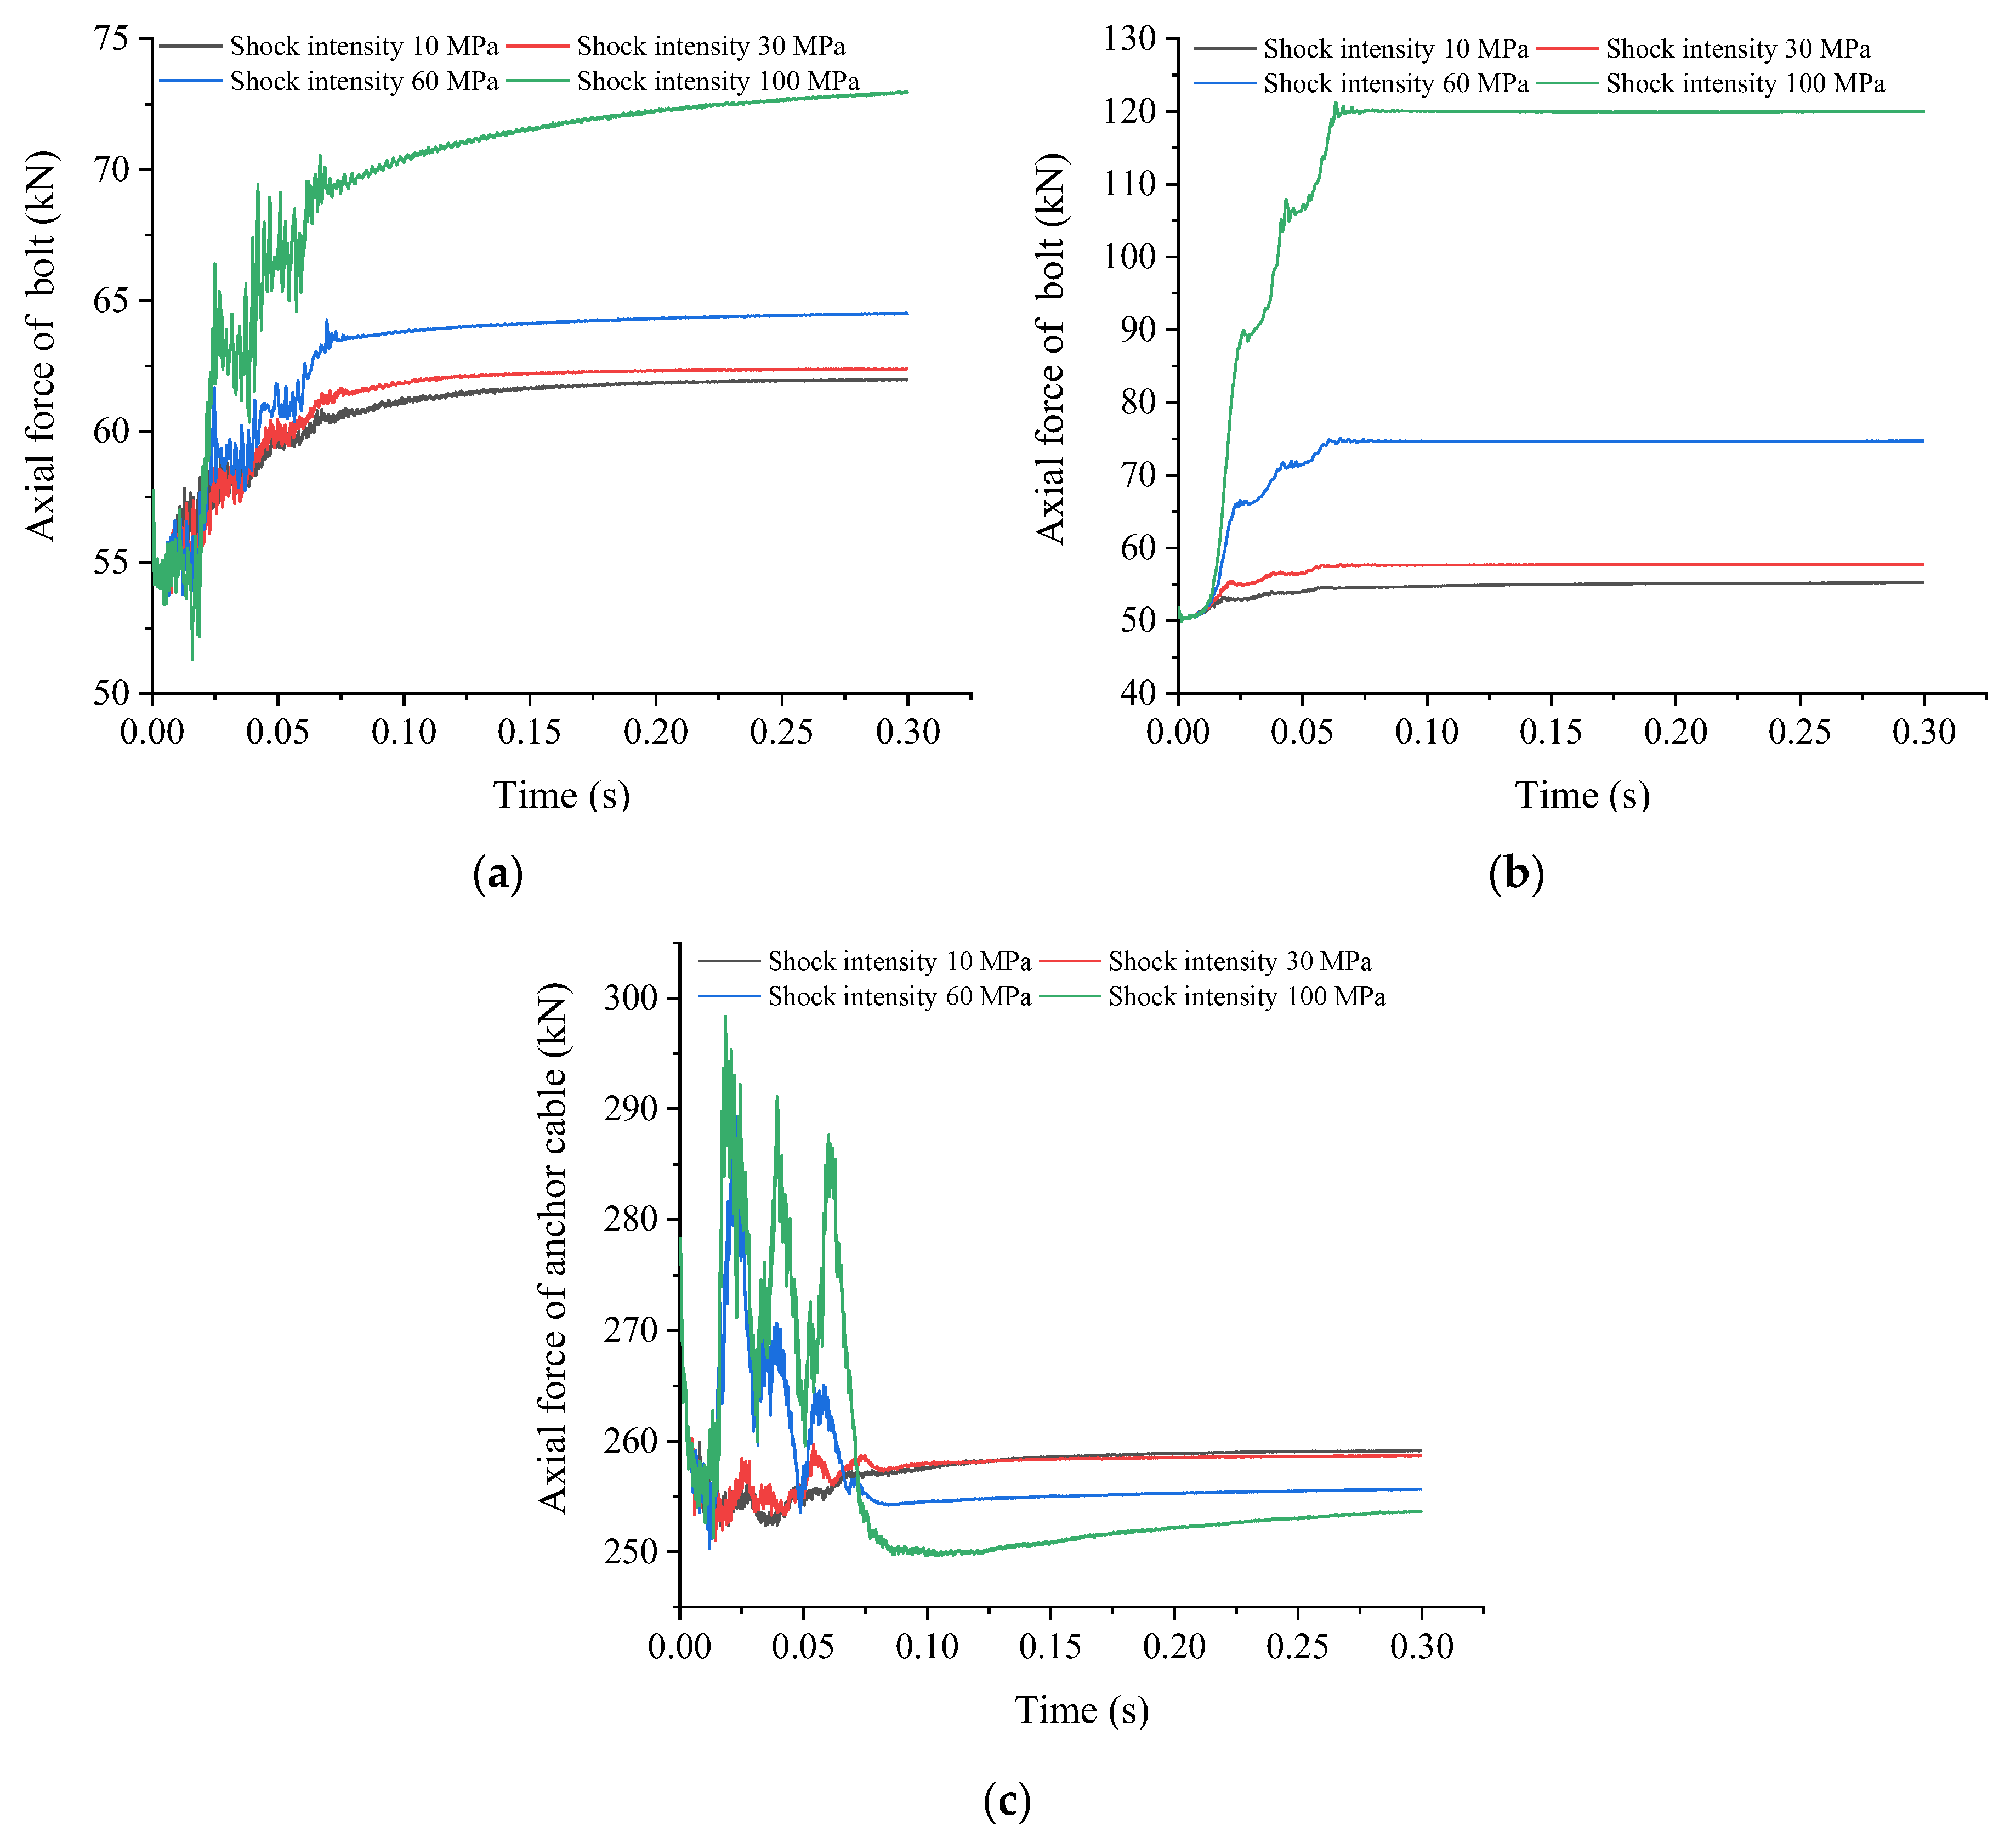
As shown in Figure 10, in the stress vibration initiation stage (0–0.01 s), the axial forces of the anchor cables (bolts) at each part of the roadway first decreased instantaneously, indicating that the pretension of the anchor cables (bolts) at each part of the roadway was reduced at the moment of the action of the dynamic stress wave. In the stress fluctuation stage (0.01–0.07 s), tensile and compressive stresses occurred inside the roadway surrounding the rock, the axial forces of the anchor cables (bolts) also fluctuated periodically, and the anchor cables (bolts) were damaged to some extent under the cyclic dynamic load. In the stress adjustment stage (0.07–0.3 s), the release of the dynamic shock energy ended, the surrounding rock tended to stabilize, and the axial forces of the anchor cables (bolts) also became stable. Before the action of the dynamic shock, the axial forces of the 2.5 m anchor bolts in the roof and sides of the roadway surrounding the rock were 55.732 and 51.838 kN, respectively, which reached only 43.198–46.443% of the set value of the initial pretension, and the axial forces of the 7.1 m anchor cables in the roof were 278.392 kN, which exceeded the set value of the pretension by 39.196%, indicating that before the action of the dynamic shock, the deformation of the roadway surrounding the rock was dominated by that of the deep part of the roof, and the roof anchor cables played a major role in controlling the deformation of the roadway surrounding the rock. In the stress vibration initiation stage, the axial forces of the 2.5 m anchor bolts in the roof and sides decreased by 2.316 kN and 1.179 kN, respectively, and the axial forces of the 7.1 m anchor cable in the roof decreased by 26.652 kN. The decrease in the axial force of the anchor cables was significantly larger than that of the anchor bolts, mainly because the anchor cables had a high initial pretension, which led to a large decrease in their axial forces during the initial action of the stress wave. In the stress fluctuation stage, as the dynamic shock intensity increased, the axial forces of the anchor cables (bolts) fluctuated with an increasingly large amplitude, and the fluctuation amplitude of the axial forces of the anchor cables (bolts) in the roof was significantly larger than those in the sides, indicating that the anchor cables (bolts) were significantly disturbed by the dynamic load when the direction of the shock source was parallel to the axial direction of the anchor cables (bolts). When the shock intensity was greater than 60 MPa (106 J), the axial forces of the 2.5 m anchor bolts in the roof fluctuated significantly with an amplitude reaching approximately 7 kN. When the shock intensity was greater than 30 MPa (105 J), the axial forces of the 7.1 m anchor cables in the roof fluctuated with an amplitude as high as approximately 47 kN. The fluctuation of the axial forces of the anchor cables was significantly greater than that of the anchor bolts because the anchor cables had a high pretension, and hence, even a low shock intensity could lead to a large fluctuation in their axial forces. Due to their high axial forces, the anchor cables in the roof were damaged during the stress fluctuation stage, and the higher the shock energy and pretension were, the more severe the damage to the anchor cables. Therefore, the axial forces of the 7.1 m anchor cables in the roof decreased overall in the stress fluctuation stage. In contrast, due to their low pretension, the 2.5 m anchor bolts in the roof and the sides experienced only a low damage under the dynamic shock, and hence, their axial forces increased overall in the stress fluctuation stage. Furthermore, the increase in the axial forces of the anchor bolts was larger in the sides than in the roof, and therefore the damage to the anchor bolts was lower in the sides than in the roof. In addition, the deformation of the surrounding rock in the sides was severe under a high-energy shock, and the axial forces of the anchor bolts therefore increased rapidly. In the stress adjustment stage, the dynamic stress wave ended, and the axial forces of the anchor cables (bolts) stabilized. The 7.1 m anchor cables in the roof were damaged to some extent under the action of the shock stress wave, and hence, their axial forces after the stabilization decreased as the dynamic shock intensity increased. In contrast, the 2.5 m anchor bolts in the roof and sides had little damage, and hence, their axial forces after the stabilization increased as the shock intensity increased.
The overall comparative analysis revealed that due to a low initial pretension, the 2.5 m anchor bolts in the roof and sides only sustained weak damage under the cyclic dynamic shock and therefore retained a high strength after the action of the dynamic shock. However, because of the shallow anchoring depth of the 2.5 m anchor bolts in the sides, the deformation and failure of the surrounding rock were aggravated under the high-energy shock. Due to a high pretension, the 7.1 m anchor cables in the roof were severely damaged under the cyclic shock; as a result, their effect of controlling the deformation of the surrounding rock was reduced, and they were sensitive to the dynamic shock intensity. The axial forces of the anchor cables were influenced the most when the dynamic shock intensity was greater than 30 MPa (105 J). Therefore, to effectively reduce the fluctuation of the axial forces of the anchor cables and to mitigate the extent of the damage to the anchor cables, a yielding buffer could be added to the anchor cables with high pretension in the roof to increase their shock resistance.

4. Roadway Rock Burst Prevention and Support Technology

4.1. Proposed Support System for Rock Burst Prevention

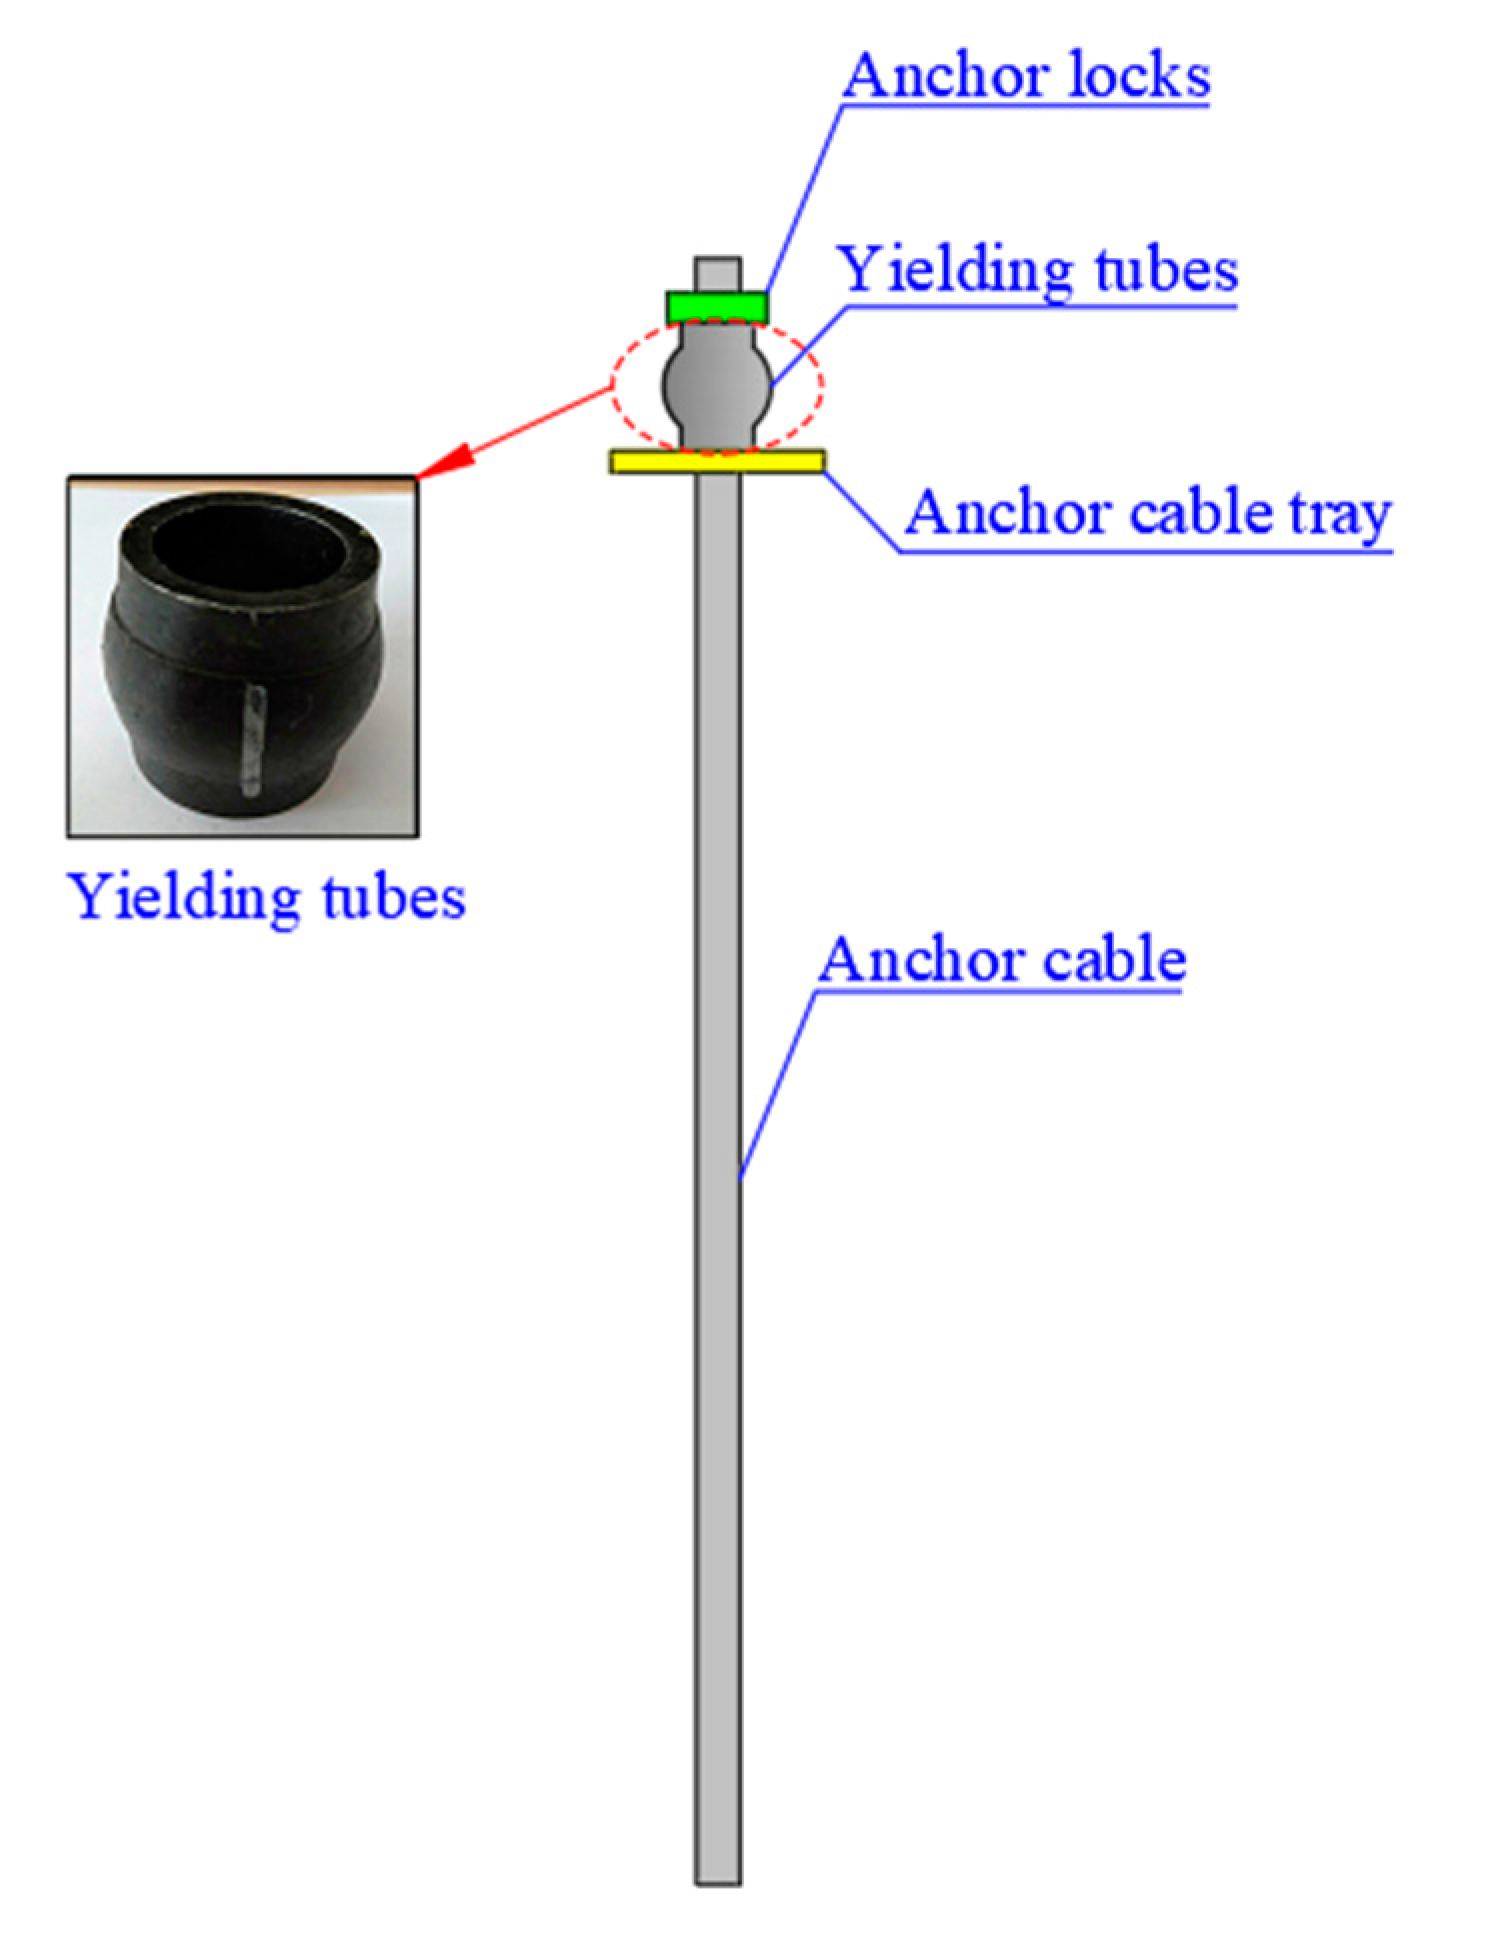
The existing roadway support systems are characterized by anchor bolts with a short length, a low pretension, and a corresponding weak side-control effect in the sides and anchor cables, with a high pretension and a low shock resistance in the roof. To address this problem, a “full anchor cable yielding” support technology is proposed for the roadway, i.e., the roof is supported by long anchor cables, yielding tubes, and anchor bolts, and the sides are supported by short anchor cables. The support system is specifically designed as follows: the roof support adopts Φ22 × 2500 mm left-handed threaded steel anchor bolts without a longitudinal reinforcement, arranged at spacings of 850 × 1000 mm and with a torque of 400 N·m, and Φ21.8 × 7300 mm high-strength prestressing steel strand anchor cables with yielding tubes, arranged at spacings of 2000 × 1700 mm and with a pretension of 300 kN. The side support adopts Φ21.8 × 3500 mm high-strength prestressing steel strand anchor cables, arranged at spacings of 1000 × 1000 mm and with a pretension of 200 kN. The support parameters of the surrounding rock of the roadway are shown in Figure 11, and the yielding anchor cable is shown in Figure 12.

4.2. Performance of the Support System

The ability of the support system to prevent the roadway surrounding the rock from rock bursts was analyzed by monitoring the internal fracture characteristics and deformation of the roadway surrounding the rock before and after the optimization of the support parameters.
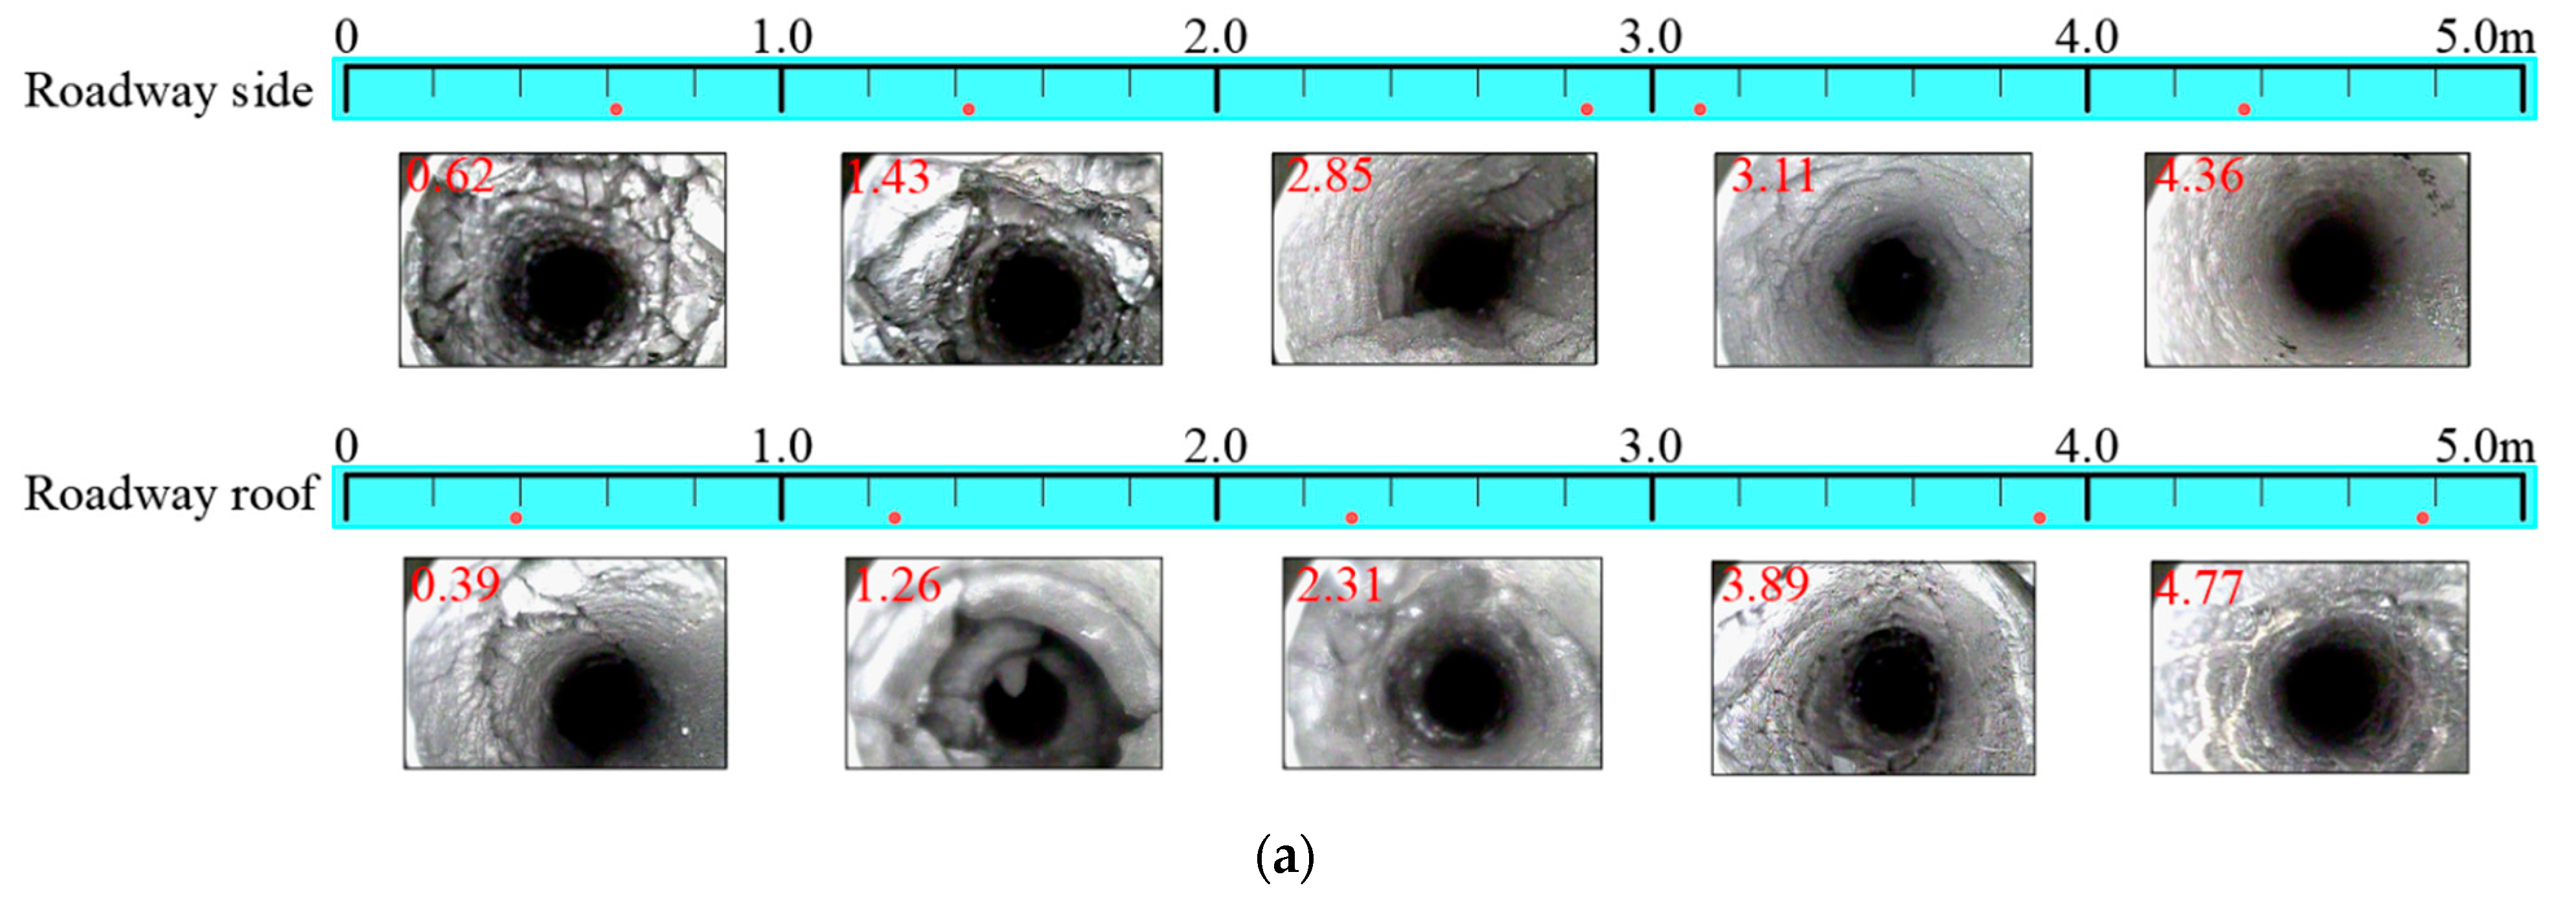
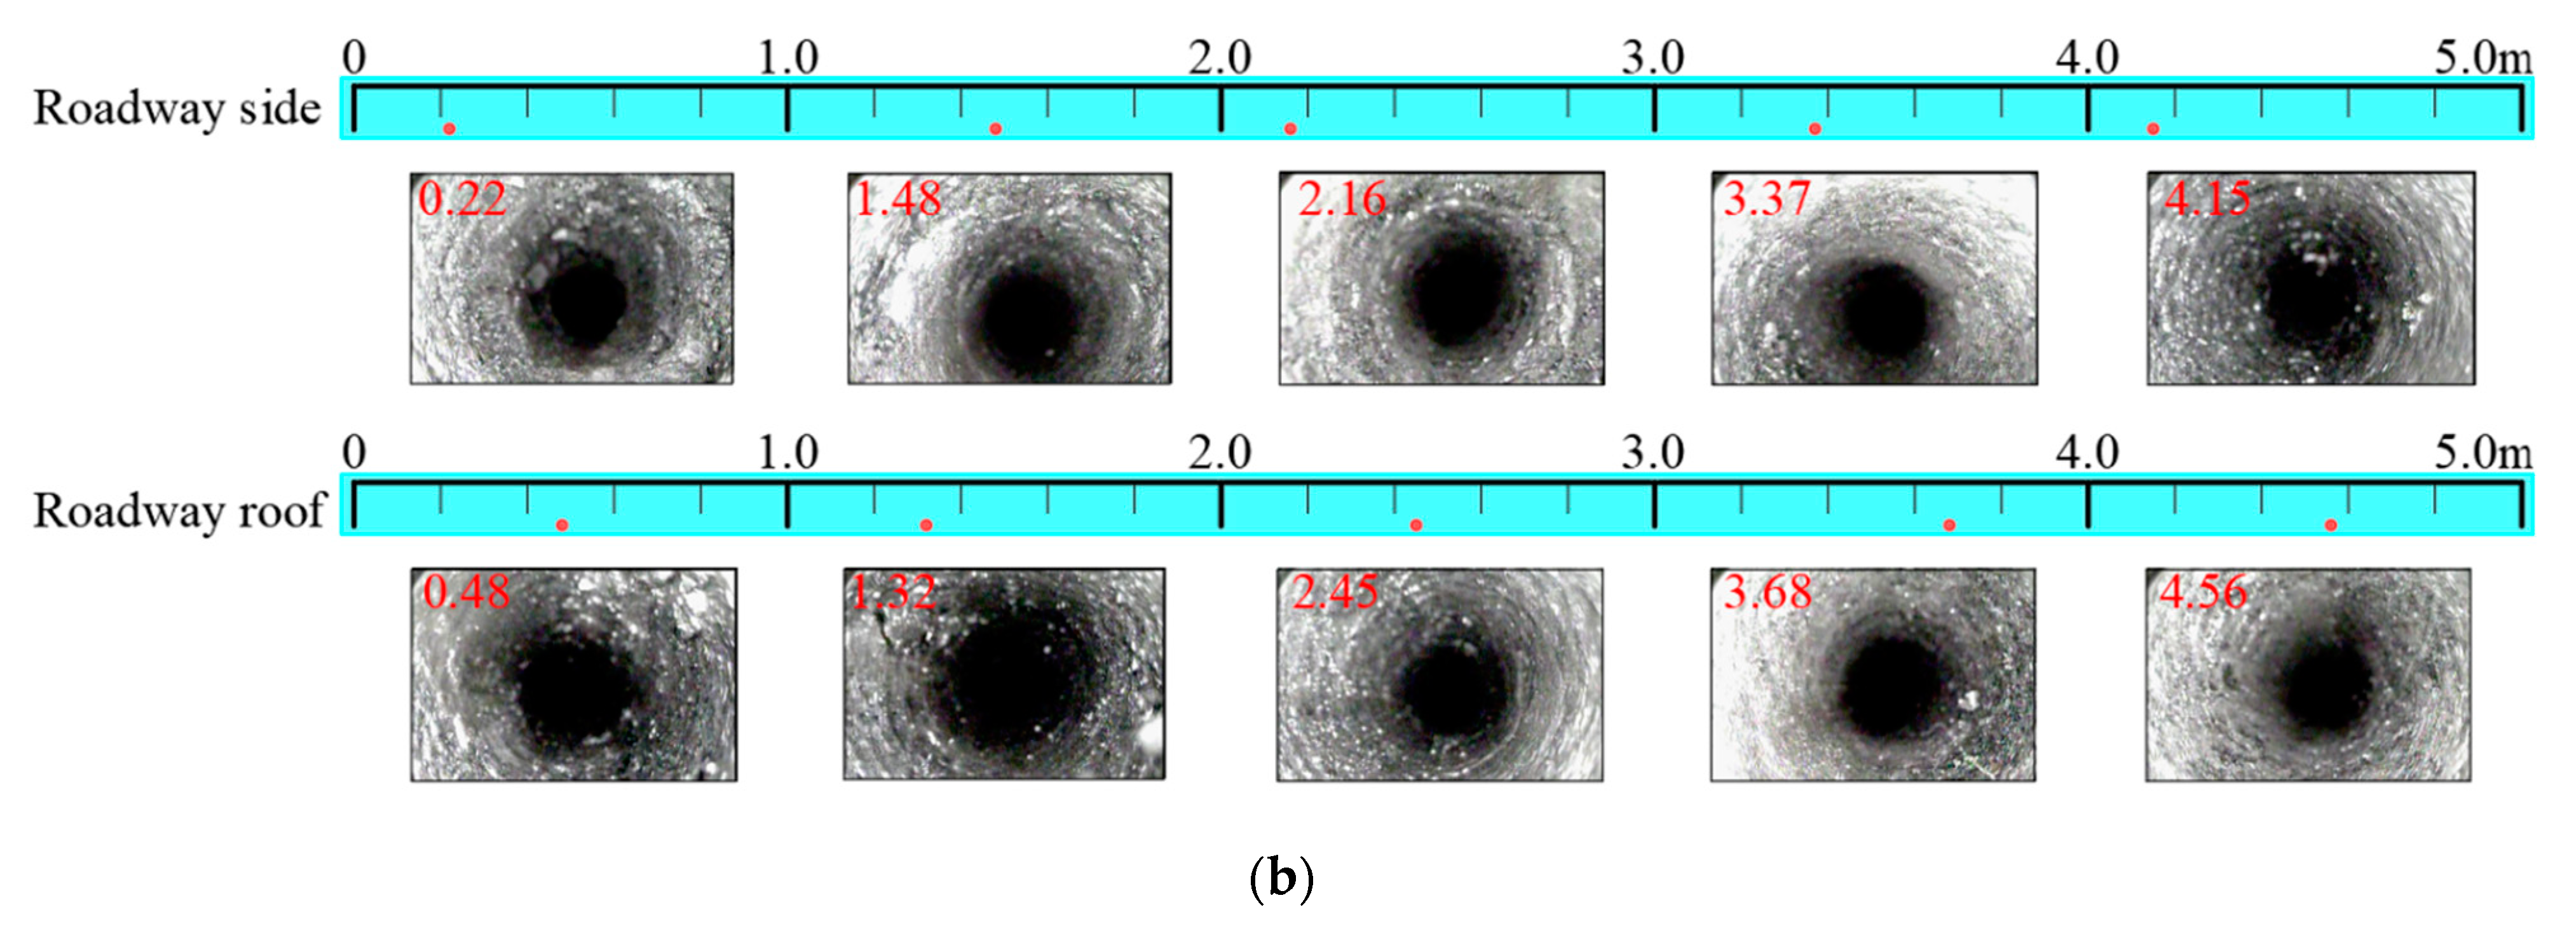
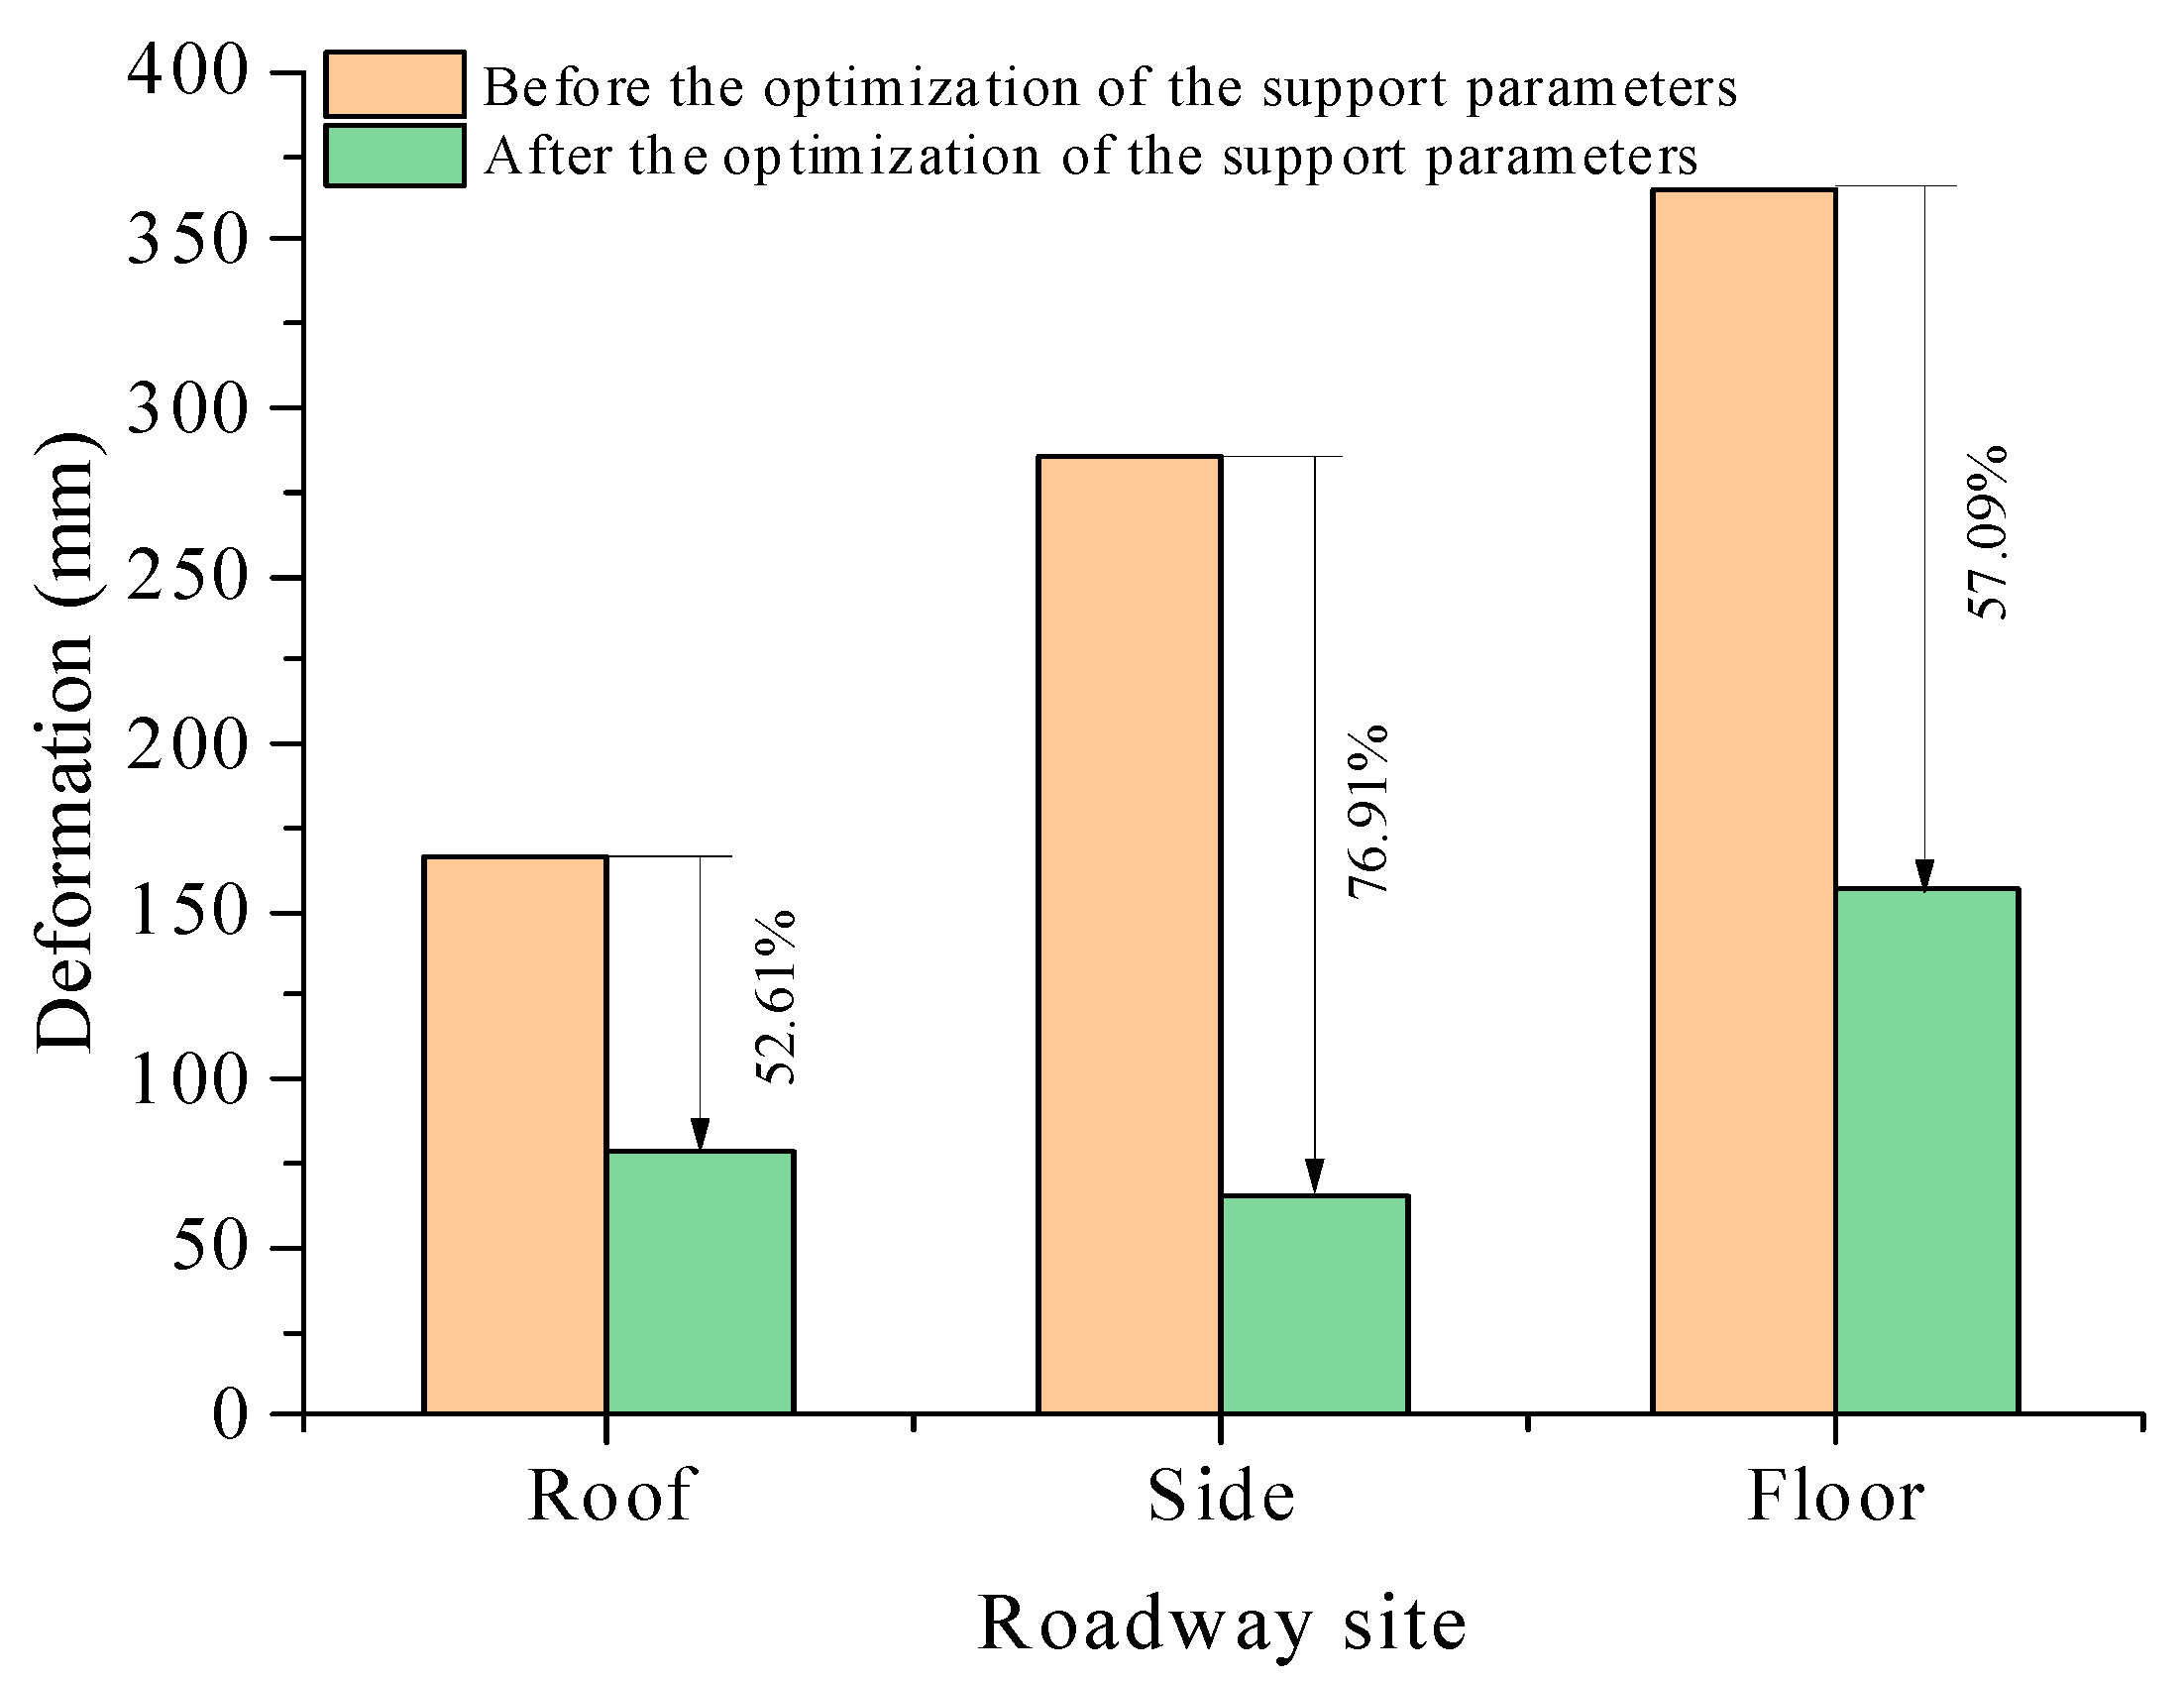
As shown in Figure 13, before the optimization of the support parameters, the depth of the fractures developed in the roof and sides was 4.86 m and 3.15 m, respectively, indicating a severe fracturing of the surrounding rock, and that the surrounding rock in the 0.62–1.43 m section of the roof and the 0.39–1.26 m section of the side exhibited fragmentation spalling. After the optimization of the support parameters, the depth of the fractures developed in the roof and sides was 1.88 m and 1.52 m, respectively, which were 61.32% and 51.75% lower than that before the optimization, respectively. In addition, short and small fractures were mainly observed in the surrounding rock, indicating that the fracturing of the surrounding rock was significantly mitigated. As shown in Figure 14, after the optimization of the support parameters, the deformation of the roof, sides, and floor of the roadway decreased by 52.61, 76.91, and 57.09%, respectively, indicating that the stability of the roadway surrounding the rock was significantly improved and the control effect on the surrounding rock was effectively enhanced. The control effect of the surrounding rock of the roadway is shown in Figure 15.

5. Conclusions

The conclusions drawn from the research are as follows:
(1)
The propagation of the dynamic shock stress wave was divided into a stress vibration initiation stage, a stress fluctuation stage, and a stress adjustment stage. In the stress vibration initiation stage, the stress wave was transmitted to the surface of the roadway, causing the surface mass of the surrounding rock to start to vibrate; in the stress fluctuation stage, the dynamic stress wave acted on the roadway surface to produce tensile and compressive stresses, and the surrounding rock failed severely; and in the stress adjustment stage, the residual dynamic stress wave attenuated inside the surrounding rock, which tended to stabilize.
(2)
As the dynamic shock intensity increased, the vibration velocity, displacement increment, and acceleration amplitude of the roadway surrounding the rock mass increased exponentially. The critical shock energy was 105 J, above which the dynamic responses of the roadway surrounding the rock became significant.
(3)
In the stress vibration initiation stage, the pretension of the anchor cables (bolts) was reduced, and their axial forces decreased; in the stress fluctuation stage, the axial forces of the anchor cables (bolts) fluctuated periodically, resulting in damage being made to them; and in the stress adjustment stage, the axial forces of the anchor cables (bolts) tended to be stable. The damage to the anchor cables (bolts) increased when the direction of the shock source was parallel to the axial direction of the anchor cables (bolts); the higher the shock intensity and pretension were, the more severe the damage to the anchor cables (bolts) was.
(4)
Based on the dynamic response characteristics of the roadway surrounding the rock and the support system under the dynamic shock, a full anchor cable yielding support technology was used to reduce the depth of the fractures developed in the roadway surrounding rock by 51.75–61.32% and the deformation of the surrounding rock by 52.61–76.91%, thereby significantly enhancing the stability of the roadway surrounding the rock.

Author Contributions

D.X. conceived the research and wrote the original draft. M.G. revised and reviewed the manuscript. X.Y. was responsible for data curation. All authors have read and agreed to the published version of the manuscript.

Funding

This research was funded by the National Natural Science Foundation of China (51564044), China Scholarship Council (CSC No. 202106420060), and Ordinary University Graduate Student Scientific Research Innovation Projects of Jiangsu Province (KYCX21_2365).

Data Availability Statement

Not applicable.

Conflicts of Interest

The authors declare that they have no known competing financial interests or personal relationships that could have appeared to influence the work reported in this paper.

References

  1. Xu, L.M.; Lu, K.X.; Pan, Y.S.; Qin, Z.J. Study on rock burst characteristics of coal mine roadway in China. Energ. Source. Part A Recover. Util. Environ. Eff. 2022, 44, 3016–3035. [Google Scholar] [CrossRef]
  2. Zhang, M.; Jiang, F.X. Rock burst criteria and control based on an abutment-stress-transfer model in deep coal roadways. Energy Sci. Eng. 2020, 8, 2966–2975. [Google Scholar] [CrossRef]
  3. Qi, Q.X.; Li, Y.Z.; Zhao, S.K.; Zhang, B.Z.; Zheng, W.C.; Li, H.T.; Li, H.Y. Seventy years development of coal mine rockburst in China:establishment and consideration of theory and technology system. Coal Sci. Technol. 2019, 47, 1–40. [Google Scholar]
  4. Cook, N.G.W.; Hoek, E.; Pretorius, J.P.G. Rock mechanics applied to the study of rockbursts. J. S. Afr. I. Min. Metall. 1965, 66, 436–528. [Google Scholar]
  5. Cai, W.; Dou, L.M.; Zhang, M.; Cao, W.Z.; Shi, J.Q.; Feng, L.F. A fuzzy comprehensive evaluation methodology for rock burst forecasting using microseismic monitoring. Tunn. Undergr. Space Technol. 2018, 80, 232–245. [Google Scholar] [CrossRef]
  6. Dou, L.M.; He, J.; Cao, A.Y.; Gong, S.Y.; Cai, W. Rock burst prevention methods based on theory of dynamic and static combined load induced in coal mine. J. China Coal Soc. 2015, 40, 1469–1476. [Google Scholar]
  7. Li, H.T.; Qi, Q.X.; Du, W.S.; Li, X.P. A criterion of rockburst in coal mines considering the influence of working face mining velocity. Geomech. Geophys. Geo. 2022, 8, 37. [Google Scholar] [CrossRef]
  8. Li, H.T.; Qi, Q.X.; Zhao, S.K.; Li, H.Y.; Shu, L.Y.; Chen, L.Q. Three Factors mechanism of coal mine dynamic disaster. Coal Sci. Technol. 2021, 49, 42–52. [Google Scholar]
  9. Pan, J.F.; Ning, Y.; Qin, Z.H.; Wang, S.W.; Xia, Y.X. Dredging technology of pressure with deep hole interval blasting based on theory of rock burst start-up. Chin. J. Rock Mech. Eng. 2012, 31, 1414–1421. [Google Scholar]
  10. Liu, H.; Yu, B.; Liu, J.R.; Wang, T.X. Investigation of impact rock burst induced by energy released from hard rock fractures. Arab. J. Geosci. 2019, 12, 381. [Google Scholar] [CrossRef]
  11. Xiao, Z.M.; Liu, J.; Gu, S.T.; Liu, M.Q.; Zhao, F.T.; Wang, Y.; Ou, C.; Zhen, M.Y. A Control Method of Rock Burst for Dynamic Roadway Floor in Deep Mining Mine. Shock Vib. 2019, 2019, 7938491. [Google Scholar] [CrossRef] [Green Version]
  12. Yang, Y.S.; Wei, S.J.; Li, K. Inverse analysis of dynamic failure characteristics of roadway surrounding rock under rock burst. Energy Sci. Eng. 2021, 9, 2298–2310. [Google Scholar] [CrossRef]
  13. He, J.; Dou, L.M.; Mu, Z.L.; Cao, A.Y.; Gong, S.Y. Numerical simulation study on hard-thick roof inducing rock burst in coal mine. J. Central South Univ. 2016, 23, 2314–2320. [Google Scholar] [CrossRef]
  14. Zhang, J.F.; Jiang, F.X.; Yang, J.B.; Bai, W.S.; Zhang, L. Rockburst mechanism in soft coal seam within deep coal mines. Int. J. Min. Sci. Technol. 2017, 27, 551–556. [Google Scholar] [CrossRef]
  15. Gao, H.; Zhao, W.S.; Chen, W.Z.; Xie, P.Y.; Zhong, K.; Qin, C.K. Continuous three-dimensional stress monitoring in roof of coal mines for investigating the rockburst control effect with hydraulic fracturing. Environ. Earth Sci. 2022, 81, 433. [Google Scholar] [CrossRef]
  16. Gu, S.T.; Chen, C.P.; Jiang, B.Y.; Ding, K.; Xiao, H.J. Study on the Pressure Relief Mechanism and Engineering Application of Segmented Enlarged-Diameter Boreholes. Sustainability 2021, 14, 5234. [Google Scholar] [CrossRef]
  17. Xu, D.; Gao, M.S.; Zhao, Y.C.; He, Y.L.; Yu, X. Study on the Mechanical Properties of Coal Weakened by Acidic and Alkaline Solutions. Adv. Civ. Eng. 2020, 2020, 8886380. [Google Scholar]
  18. Lan, T.W.; Fan, C.J.; Han, J.; Zhang, H.W.; Sun, J.W. Controlling Mechanism of Rock Burst by CO2 Fracturing Blasting Based on Rock Burst System. Shock Vib. 2020, 2020, 8876905. [Google Scholar] [CrossRef]
  19. Yan, P.; Zhao, Z.G.; Lu, W.B.; Fan, Y.; Chen, X.R.; Shan, Z.G. Mitigation of rock burst events by blasting techniques during deep-tunnel excavation. Eng. Geol. 2015, 188, 126–136. [Google Scholar] [CrossRef]
  20. Zhou, X.X.; Ouyang, Z.H.; Zhou, R.R.; Ji, Z.X.; Yi, H.Y.; Tang, Z.Y.; Chang, B.; Yang, C.C.; Sun, B.C. An Approach to Dynamic Disaster Prevention in Strong Rock Burst Coal Seam under Multi-Aquifers: A Case Study of Tingnan Coal Mine. Energies 2021, 14, 7287. [Google Scholar] [CrossRef]
  21. Zhao, T.B.; Guo, W.Y.; Yu, F.H.; Tan, Y.L.; Huang, B.; Hu, S.C. Numerical Investigation of Influences of Drilling Arrangements on the Mechanical Behavior and Energy Evolution of Coal Models. Adv. Civ. Eng. 2018, 2018, 3817397. [Google Scholar] [CrossRef] [Green Version]
  22. Gong, F.Q.; He, Z.C.; Jiang, Q. Internal Mechanism of Reducing Rockburst Proneness of Rock Under High Stress by Real-Time Drilling Pressure Relief. Rock Mech. Rock Eng. 2022, 55, 5063–5081. [Google Scholar] [CrossRef]
  23. Cai, X.; Cheng, C.Q.; Zhou, Z.L.; Konietzky, H.; Song, Z.Y.; Wang, S.F. Rock mass watering for rock-burst prevention: Some thoughts on the mechanisms deduced from laboratory results. Bull. Eng. Geol. Environ. 2021, 80, 8725–8743. [Google Scholar] [CrossRef]
  24. Song, D.Z.; Wang, E.Y.; Liu, Z.T.; Liu, X.F.; Shen, R.X. Numerical simulation of rock-burst relief and prevention by water-jet cutting. Int. J. Rock Mech. Min. Sci. 2014, 70, 318–331. [Google Scholar] [CrossRef]
  25. Guo, D.M.; Kang, X.C.; Lu, Z.Y.; Chen, Q.Y. Mechanism and Control of Roadway Floor Rock Burst Induced by High Horizontal Stress. Shock Vib. 2021, 2021, 6745930. [Google Scholar] [CrossRef]
  26. Zhang, H.; Zhu, Y.M.; Chen, L.; Hu, W.D.; Chen, S.G. The Prevention and Control Mechanism of Rockburst Hazards and Its Application in the Construction of a Deeply Buried Tunnel. Appl. Sci. 2019, 9, 3629. [Google Scholar] [CrossRef]
  27. Guo, W.Y.; Zhao, T.B.; Tan, Y.L.; Yu, F.H.; Hu, S.C.; Yang, F.Q. Progressive mitigation method of rock bursts under complicated geological conditions. Int. J. Rock Mech. Min. Sci. 2017, 96, 11–22. [Google Scholar] [CrossRef]
  28. Sun, Y.H.; Zhang, X.H.; Xu, H.H. Research on Rock Burst Control Mechanism of Deep Buried Tunnel Using Surrounding Rock Modification Theory. Shock Vib. 2022, 2022, 5057665. [Google Scholar] [CrossRef]
  29. Yan, H.; He, F.L.; Li, L.Y.; Feng, R.M.; Xing, P.F. Control mechanism of a cable truss system for stability of roadways within thick coal seams. J. Central South. Univ. 2017, 24, 1098–1110. [Google Scholar] [CrossRef]
  30. Gao, M.S.; He, Y.L.; Xu, D.; Yu, X. A New Theoretical Model of Rock Burst-Prone Roadway Support and Its Application. Geofluids 2021, 2021, 5549875. [Google Scholar] [CrossRef]
  31. Jiang, B.; Wang, Q.; Li, S.C.; Ren, Y.X.; Zhang, R.X.; Wang, H.T.; Zhang, B.; Pan, R.; Shao, X. The research of design method for anchor cables applied to cavern roof in water-rich strata based on upper-bound theory. Tunn. Undergr. Space Technol. 2016, 53, 120–127. [Google Scholar] [CrossRef]
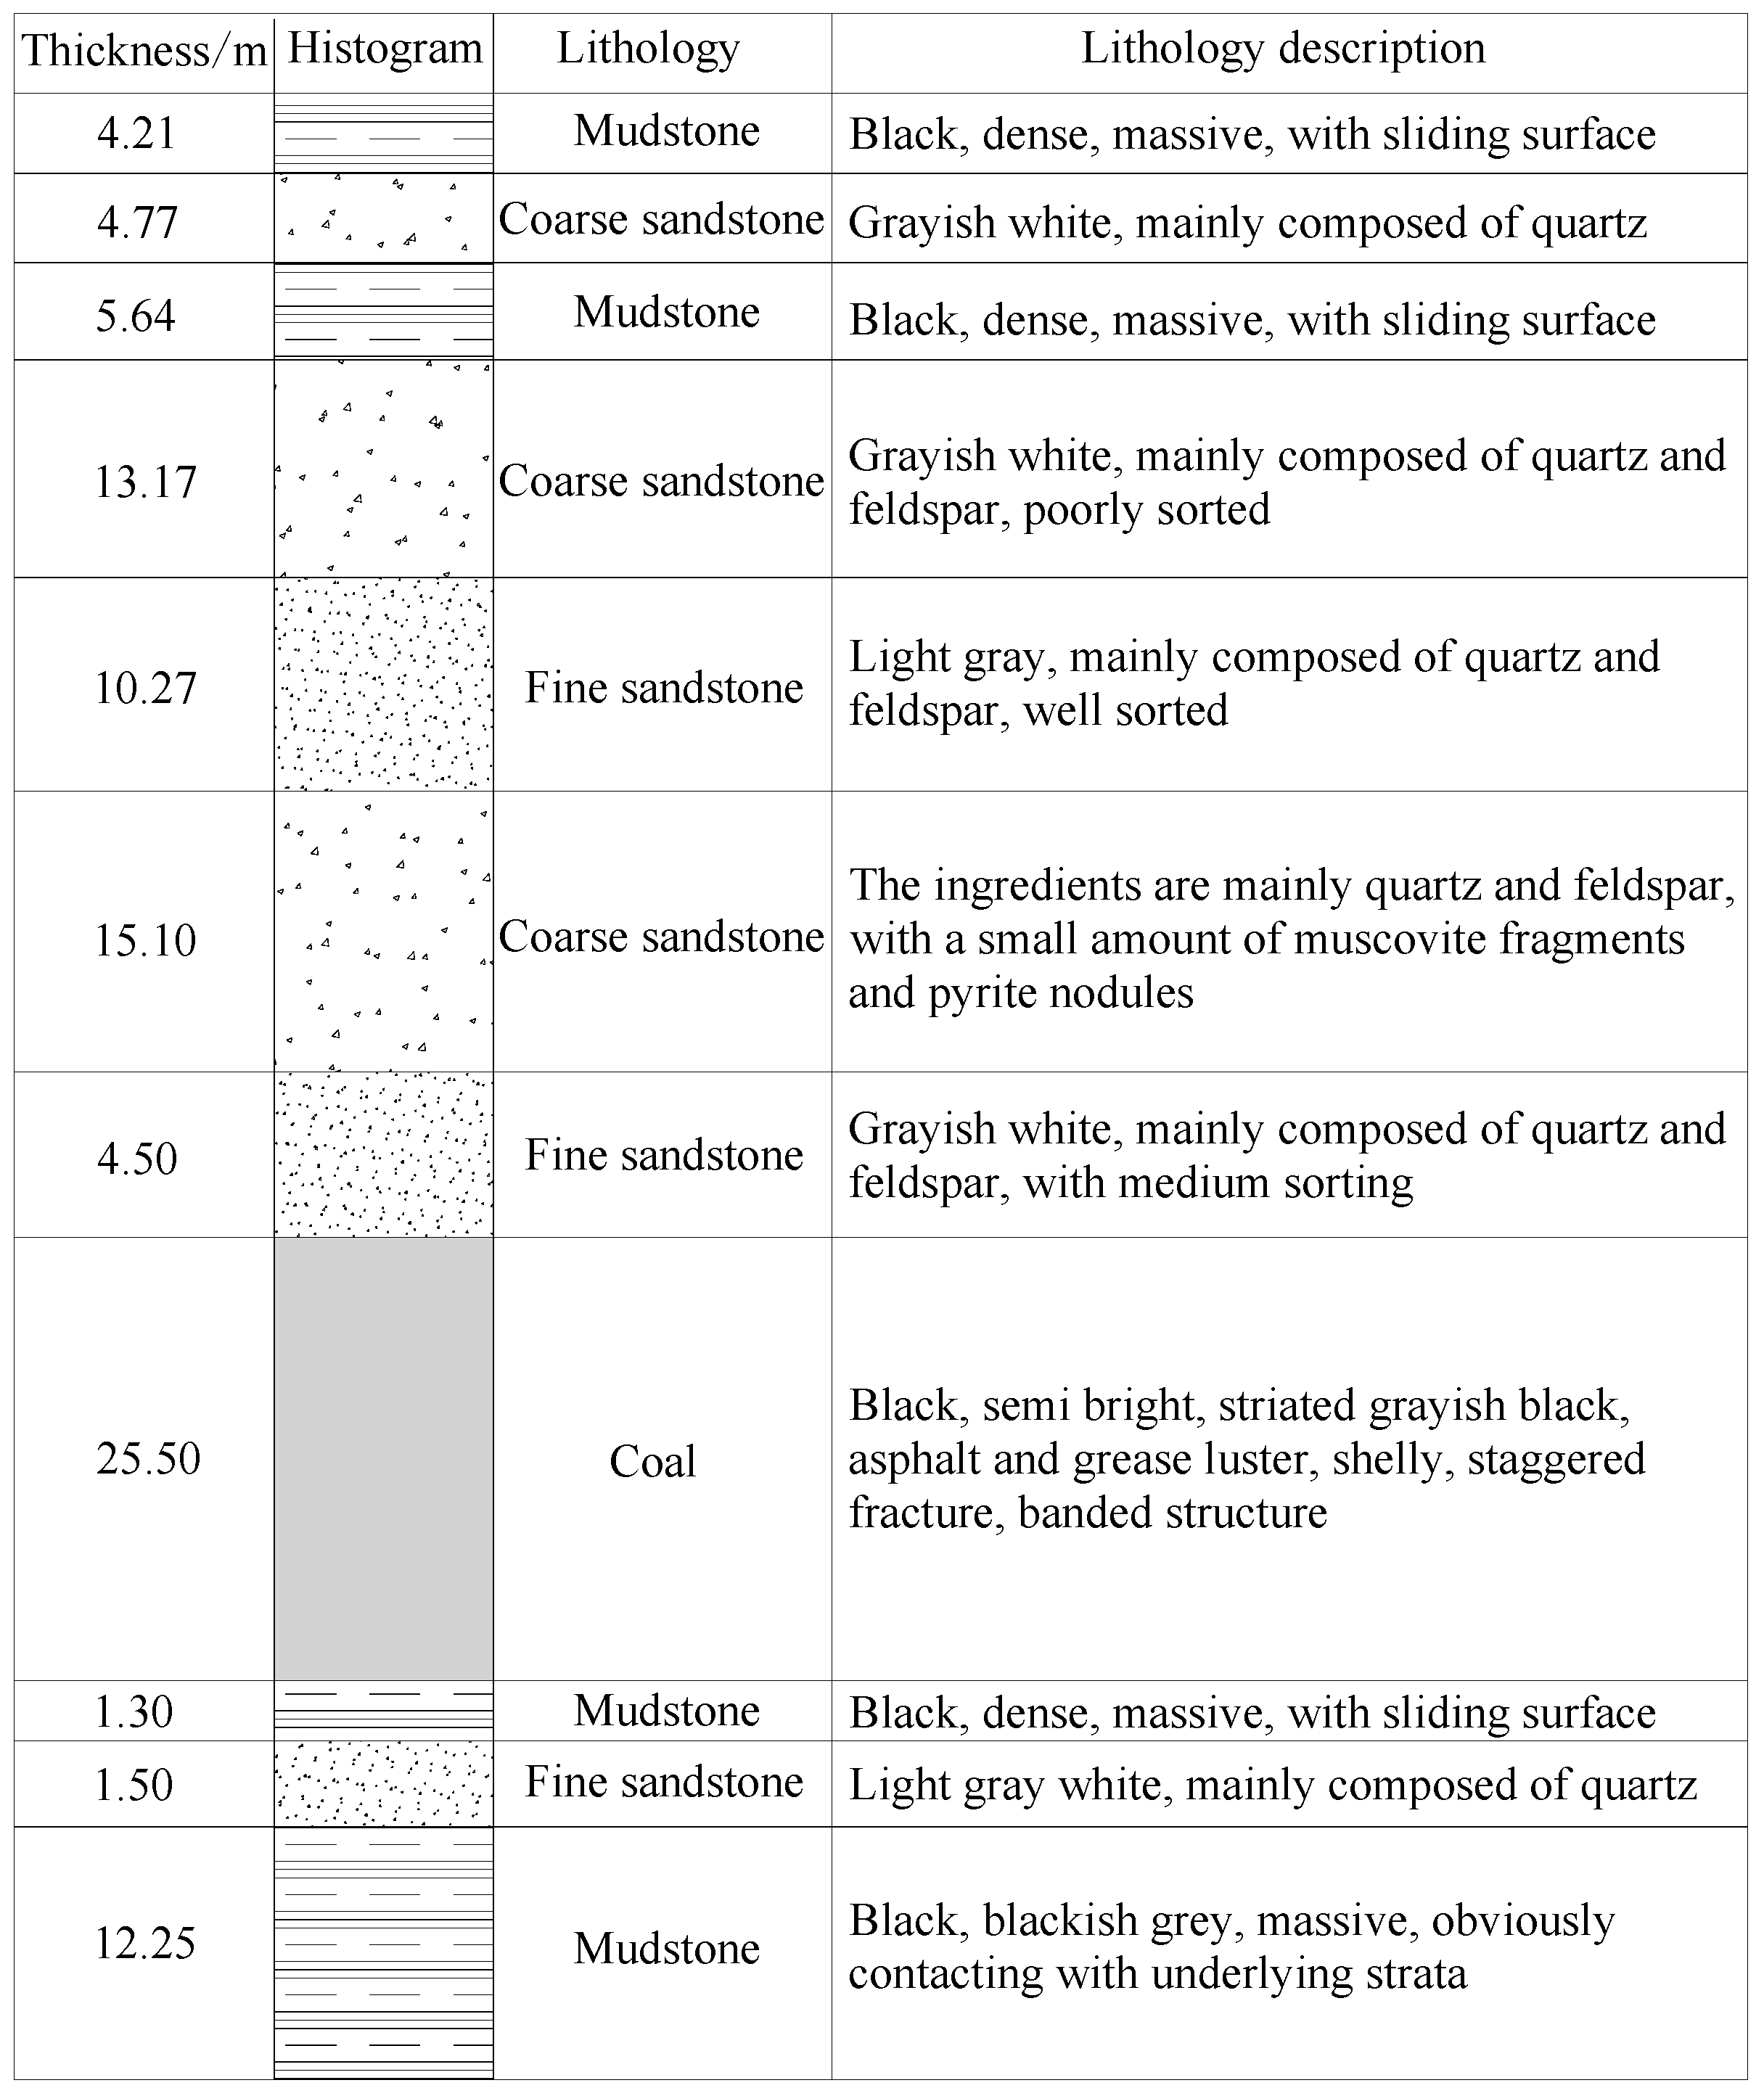
Figure 1. Coal and rock strata histogram.
Energies 15 08662 g001
Figure 2. Roadway support parameters.
Energies 15 08662 g002
Figure 3. Roadway deformation and failure diagram. (a) Anchor cable breakage; (b) floor heave; (c) roadway spalling.
Energies 15 08662 g003
Figure 4. Numerical model.
Energies 15 08662 g004
Figure 5. Calculation sequence used for the numerical model.
Energies 15 08662 g005
Figure 6. Propagation process of the stress wave in the surrounding rock of the roadway (60 MPa). (a) 0 s; (b) 0.01 s; (c) 0.02 s; (d) 0.04 s; (e) 0.06 s; (f) 0.07 s.
Energies 15 08662 g006
Figure 7. Velocity–time curve of the surrounding rock of the roadway for different shock intensities. (a) Roadway roof; (b) roadway side; (c) roadway floor; (d) maximum velocity fitting curve.
Energies 15 08662 g007
Figure 8. Displacement–time curve of the surrounding rock of the roadway for different shock intensities. (a) Roadway roof; (b) roadway side; (c) roadway floor; (d) displacement increment fitting curve.
Energies 15 08662 g008
Figure 9. Acceleration frequency−amplitude curve of the surrounding rock of the roadway for different shock intensities. (a) Roadway roof; (b) roadway side; (c) roadway floor; (d) maximum amplitude fitting curve.
Energies 15 08662 g009
Figure 10. Axial force–time curve of anchor cables (bolts) for different shock intensities. (a) 2.5 m bolt of the roadway roof; (b) 2.5 m bolt of the roadway side; (c) 7.1 m anchor cable of the roadway roof.
Energies 15 08662 g010
Figure 11. Section support scheme.
Energies 15 08662 g011
Figure 12. Yielding anchor cable.
Energies 15 08662 g012
Figure 13. Fracture characteristics of the surrounding rock before and after optimization of support parameters. (a) Before the optimization of the support parameters; (b) after the optimization of the support parameters.
Energies 15 08662 g013aEnergies 15 08662 g013b
Figure 14. Deformation of the surrounding rock of the roadway before and after the optimization of the support parameters.
Energies 15 08662 g014
Figure 15. Control effect of the surrounding rock of the roadway before and after the optimization of the support parameters. (a) Before the optimization of the support parameters; (b) after the optimization of the support parameters.
Energies 15 08662 g015
Table 1. Mechanical parameters of coal and rock.
Lithologyρ (kg/m3)E (GPa)c (MPa)θ (°)σt (MPa)
Mudstone24618.751.2030.150.61
Fine sandstone287333.413.2042.121.29
Coarse sandstone246019.533.7538.041.84
Coal13805.311.0526.080.15
Publisher’s Note: MDPI stays neutral with regard to jurisdictional claims in published maps and institutional affiliations.