Article

Optimizing PV-Hosting Capacity with the Integrated Employment of Dynamic Line Rating and Voltage Regulation

by
Ramitha Dissanayake
1,
Akila Wijethunge
2,
Janaka Wijayakulasooriya
1 and
Janaka Ekanayake
1,3,*
1
Department of Electrical and Electronic Engineering, University of Peradeniya, Peradeniya 20400, Sri Lanka
2
Department of Materials and Mechanical Technology, Faculty of Technology, University of Sri Jayewardenepura, Homagama 10200, Sri Lanka
3
Institute of Energy, Cardiff School of Engineering, Cardiff University, Cardiff CF24 3AA, UK
*
Author to whom correspondence should be addressed.
Energies 2022, 15(22), 8537; https://doi.org/10.3390/en15228537
Submission received: 17 October 2022 / Revised: 7 November 2022 / Accepted: 11 November 2022 / Published: 15 November 2022

Abstract

:
A record amount of renewable energy has been added to global electricity generation in recent years. Among the renewable energy sources, solar photovoltaic (PV) is the most popular energy source integrated into low voltage distribution networks. However, the voltage limits and current-carrying capacity of the conductors become a barrier to maximizing the PV-hosting capacity in low voltage distribution networks. This paper presents an optimization approach to maximize the PV-hosting capacity in order to fully utilize the existing low voltage distribution network assets. To achieve the maximum PV-hosting capacity of the network, a novel method based on the dynamic line rating of the low voltage distribution network, the coordinated operation of voltage control methods and the PV re-phasing technique was introduced and validated using a case study. The results show that the proposed methodology can enhance the PV-hosting capacity by 53.5% when compared to existing practices.

1. Introduction

With the growing concerns about global warming and climate change due to fossil-fuel-based energy sources, many countries have initiated discussions on the de-carbonation agenda [1]. International agreements such as the Paris agreement [2] were initiated in order to reduce greenhouse gas emissions in upcoming years. This has resulted in a steep integration of renewable energy sources (RES) [3]. According to reference [4], the newly installed RES capacity was 314 GW in 2021 which was recorded as a 17% increment compared to 2020.
Solar photovoltaic (PV) and wind power are the major RESs contributing to renewable energy growth. Among them, PV energy is more popular among the public as a consequence of relaxed policies and financial benefits [5]. A record 175 GW of solar PV was added in 2021 which is well over the half of total RES addition in 2021 [4]. There are three types of solar PV installations: ground-mounted PV [6], floating PV [7], and rooftop PV [8]. In recent years, electrical networks have opened access to the public, and that resulted in the rapid development of rooftop PV system installations. For instance, in the USA, over 500,000 rooftop PV installation projects were completed in 2021 to add a recorded amount of 4.2 GW of PV power to the system [9].
The connection of a large number of roof-top PV plants to the low-voltage (LV) network resulted in the violation of voltage limits of certain parts of the network and the violation of thermal limits of some conductors. In addition, reverse power flow was seen in some parts of the networks [10,11]. These violations resulted in limiting the PV-hosting capacity (PVHC) of the distribution networks [12,13,14,15].
To overcome the voltage rising issue, voltage regulators, such as on-load tap changer (OLTC) and reactive power control through capacitor banks, are used. In [16], the optimal operation of OLTC and static var compensators to increase the PVHC was considered, and the effectiveness of the proposed method was validated in the IEEE 33-bus system. A mixed-integer second-order cone programming model to increase the PVHC using voltage and reactive power control through the optimal operation of capacitor banks and OLTC was proposed in [17]. Reference [18] suggested a coordinated control method to mitigate voltage violations by utilizing energy storage systems and OLTC. The effectiveness of the voltage control method was demonstrated for IEEE 13 and 33 bus systems. Nonetheless, traditional voltage control techniques cannot mitigate voltage violations quickly due to mechanical switching. Power electronic converter-based solar inverters can be used to obtain a smoother reactive power assistant and a faster response [19,20].
In some countries, PV inverters are engaged in voltage regulation at the point of common coupling (PCC) by utilizing the reactive power compensation (RPC) based on the IEEE 1547.2018 standard [21] and the Electric Power Research Institute protocols [22]. The frequently used RPC methods are fixed power factor control, scheduled power factor control, power factor control as a function of injected active power and voltage-dependent reactive power control (Volt/Var control) [23]. Reference [23] comparatively analyzed the four RPC methods and validated the effectiveness of each method using a typical Malaysian network. Based on the results, authors stated that the volt/var control method outperformed the rest of the aforementioned methods. In [24], a two-level Volt/Var control method was proposed by considering the minimization of network loss and reducing PV fluctuations to maintain the voltage within the constraints. The combined use of RPC and OLTC to regulate voltage in order to enhance PVHC was investigated in [25]. Simulation results considering a network in Thailand revealed that 50–90% of additional PV penetration is possible with the RPC and OLTC combined voltage regulation method. Simulation results considering a network in Thailand reveal the effectiveness of the RPC and OLTC combined voltage regulation method. In [26], the use of RPC, OLTC and network reinforcement methods to mitigate the over-voltage issue was addressed. With the voltage regulation, the capability of doubling the PVHC in LVDN was validated using a Finnish distribution network.
Although the voltage is kept within limits, the thermal limit of the conductors (ampacity) is another major contributing factor to limit the PVHC [27,28]. Improvement of conductor size is the primary method to increase the ampacity and thereby increase the PVHC. In [29], conductor size improvement along with reactive power control was investigated, and the improvement of PVHC was validated using a distribution network in Japan. Reference [30] investigated the maximum PVHC considering the voltage limits and current limits defined by the over-current protection devices. It states that the maximum PV penetration is 30% of the peak load in 86% of the considered cases.
Theoretically, line rating is calculated considering the maximum allowable temperature of the cable and pre-determined environmental conditions such as ambient temperature and wind speed. That is called the static line rating (SLR) of the conductor. Since the environmental conditions are continuously changing, there is a gap between the static rating and the actual current-carrying capacity, and the use of static rating resulted in a substantial under-utilization of the actual current-carrying capacity of the cable. This under-utilization causes a PV power curtailment during the peak irradiance hours. To fully utilize the cable capacity, a dynamic line rating (DLR) was proposed which calculates the line rating dynamically based on real-time meteorological conditions [31,32]. In [33], the DLR was used to enhance the transformer capacity to facilitate more PV integration into the network. Reference [34] investigates the possibility of improving PVHC using DLR. From their case studies in Texas, Switzerland and China, it is shown that PVHC can be increased by 15–27% when utilizing the DLR.
Further, as a consequence of unplanned PV connections in low voltage distribution networks (LVDN), phase unbalances can occur. The unbalances in phase voltages can create large neutral currents which result in distribution line and transformer losses due to overheating [35]. Therefore, utility providers limit the PV penetration to the low-voltage (LV) network. To mitigate phase unbalancing, various methods are proposed in the literature. Distribution feeder reconfiguration [36,37,38] and phase balancing (load re-sequencing and load re-phasing) [39,40] are common phase-balancing methods. The initial cost required to deploy load switches and the cost of customer interruptions are the main drawbacks of the aforementioned methods. Furthermore, there is a possibility of damaging the customer’s equipment. Considering these factors, a PV re-phasing technique was proposed in [41] which requires re-phasing switches installed only at the connection point of each rooftop solar system. The authors verify the unbalance mitigation in peak irradiance hours using an LVDN in Sri Lanka. In [42], the voltage regulating methods of OLTC, RPC, and active power curtailment combined with re-phasing and the ampacity enhancement using the DLR were utilized heuristically to demonstrate the increment of PVHC. The results revealed a 60% increment in PVHC with the proposed approach.
Currently, the PVHC of an LVDN is determined by the network operators considering pre-determined voltage limits and SLR values [43]. However, to fully utilize the network, the maximum possible PVHC estimation is paramount. PVHC can be evaluated in different methods considering several constraints such as voltage limits, ampacity, and voltage unbalance limits [44]. Reference [45] proposes a two-stage optimization-based framework that uses a heuristic optimization method to assess the maximum PVHC. OLTC operation, and RPC is used to regulate the voltage in order to obtain up to a 26.4% increment in PVHC. In [46], particle swarm optimization was utilized to evaluate the maximum PVHC taking into account the voltage limits, SLR and the total harmonic distortion as the constraints. According to the results, a 166% increment in PVHC is possible with the suggested configuration. An optimization-based framework was suggested in [47] to estimate the PVHC using OLTC control and RPC. Here, the mixed integer linear programming optimization method was used to solve the optimization problem. The results convinced up to a 100% PV increment with the optimization and control strategies.
As discussed in the literature, to optimize the PVHC, SLR is used as the ampacity constraint along with voltage constraints. Furthermore, voltage regulation techniques such as RPC and OLTC are utilized in several studies to enhance PVHC combined with SLR. However, when considering the extra margin offered by DLR limits, PVHC constrained by the SLR limit leads to under-utilization of the real network capacity. The case studies in the literature show that the PVHC can be substantially increased with the use of DLR instead of SLR. Therefore, to fully utilize the network assets, it is important to optimize the PVHC considering both concepts of DLR and voltage regulation as an integrated approach.
In this paper, the aforementioned gap is filled by optimizing the PVHC of LVDN with an integrated approach of voltage regulation methods, PV re-phasing combined with the DLR of the LVDN. The novel approach introduced in this paper is such that to control the voltage within the permissible limit, the coordinated operation of OLTC and inverter RPC was used, to enhance current-carrying capacity of the existing overhead lines DLR was introduced, and to minimize phase unbalances, the PV re-phasing technique was used. The optimum combination of the integrated approach of DLR, voltage regulation techniques and re-phasing has not been used in previous studies related to the optimization of PVHC.
The main contributions of this paper are listed below.
  • Instead of using SLR to optimize the PVHC, an integrated approach of DLR with voltage regulation is introduced to enhance PVHC. The DLR is calculated considering the real meteorological data, and a simulation model to optimize the PVHC is developed. A real LVDN in Sri Lanka is considered to evaluate the effectiveness of the proposed method.
  • The simulation model is integrated with a PV re-phasing approach to further stretch the PVHC as the PV re-phasing has not been used before when optimizing PVHC.
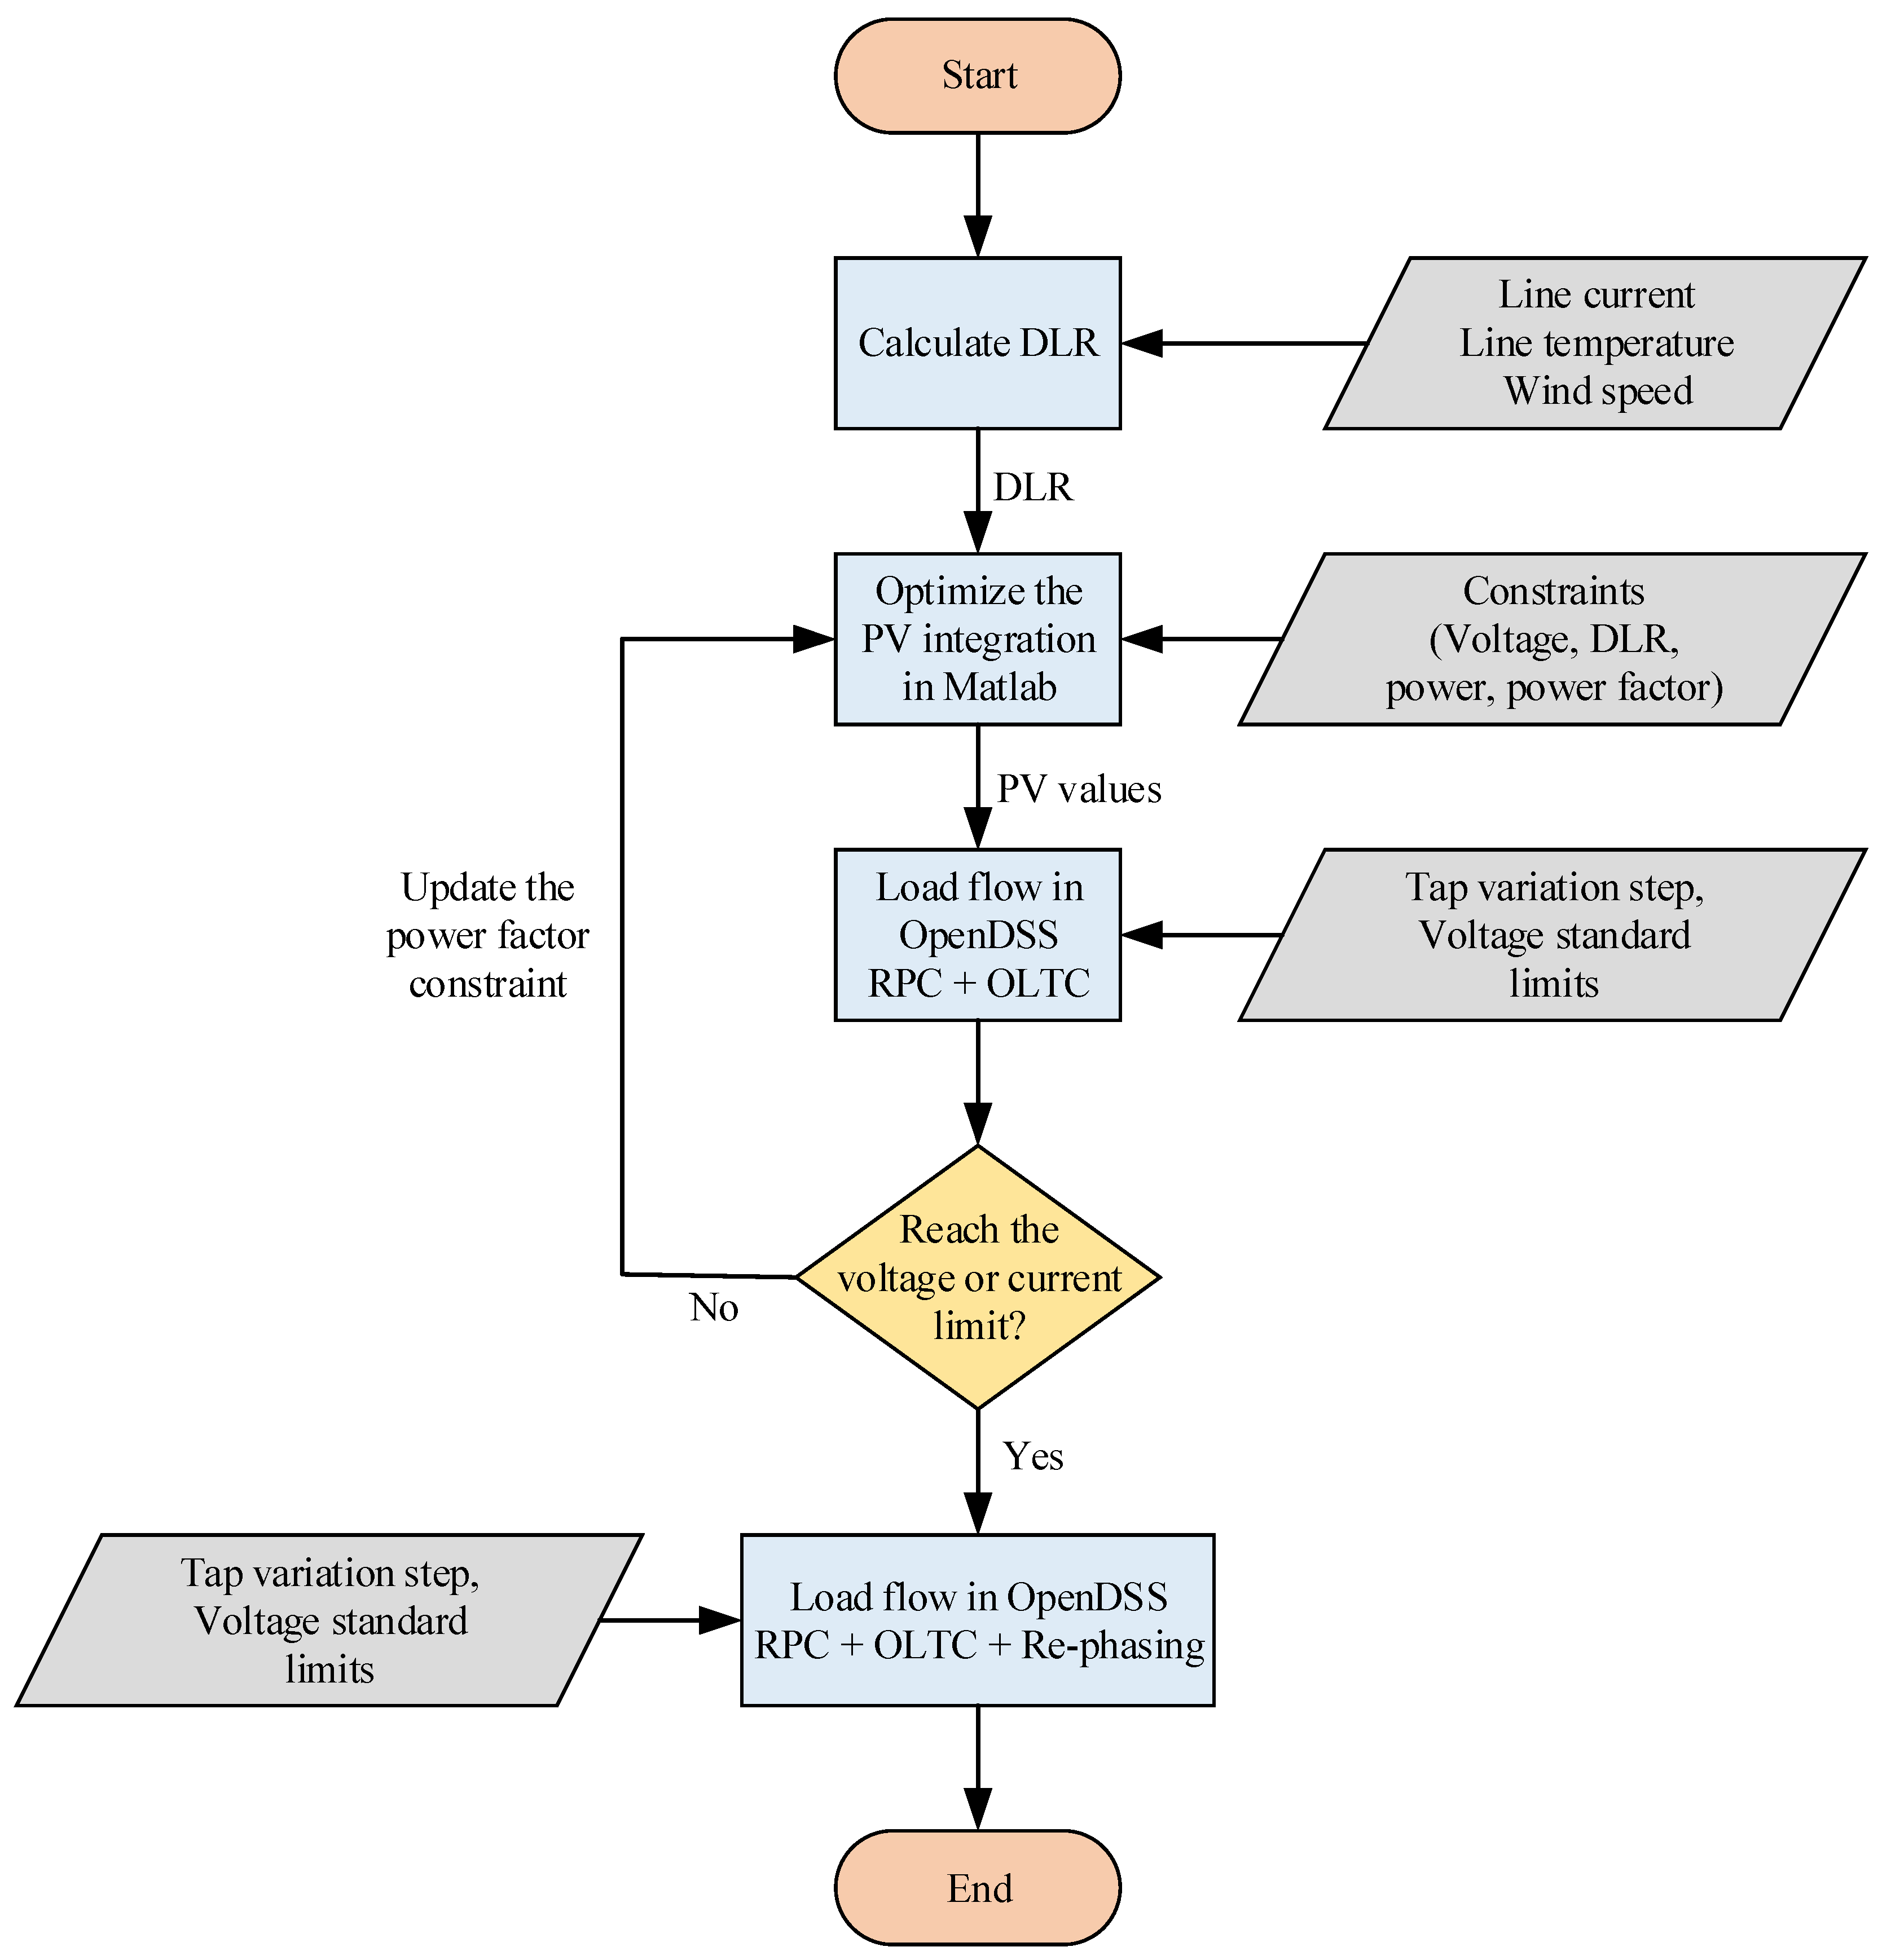
The rest of the paper is organized as follows. Section 2 describes the optimization problem formulation and voltage regulation methods. The test cases and scenarios are discussed in Section 3. Section 4 includes the results and discussion. Finally, the paper is concluded in Section 5.

2. Methodology

2.1. Evaluation of DLR

Conductor temperature is an important parameter that constitutes the line rating of the LVDN. The current flowing through the conductor causes the temperature rise in the conductor which results in elongation. Subjecting a cable to high temperatures for a longer period causes mechanical failure. The wind speed, ambient temperature, wind direction, solar radiation, emissivity factor and solar absorption factor have paramount importance on conductor temperature which directly affects the line rating. In this study, the IEEE 738 [48] standard is followed to calculate the line ratings which considers 80 °C as the maximum allowable conductor temperature, 0.6 ms 1 as the wind speed and 30 °C as the ambient temperature.
For an overhead conductor, its thermal state is calculated by balancing the heat gain and the heat loss of the conductor. Depending on the weather conditions, conductor heat balance is determined by several heating and cooling effects of the conductor as shown in Figure 1.
The steady-state heat balance equation is given by,
q r + q c = q s + q l
where q r and q c denote the radiative and convective heat losses, while q s and q l denote the solar heat gain and joule heating, respectively [49]. The heat balance equation can be reformulated as,
q r + q c = q s + I 2 R a c T c
where, I , R a c and T c represent the current flowing through the conductor, a function of conductor temperature and conductor temperature, respectively. R a c was calculated as,
R a c = R d c K a c [ 1 + α 0 ( T c T 0 ) ]
where R d c , K a c , α 0 and T 0 denote the resistance at the reference temperature, the ratio between the ac and dc resistance, temperature coefficient of the resistance and initial conductor temperature, respectively.
Solar heat gain and convective heat loss were calculated using (4) and (5).
q s = α s D ( S b + S d )
q c = h π D ( T c T a )
where
h = λ 0.64 R e 0.2 + 0.2 R e 0.61 D K w d
and
R e = D w V f
where, α s , D, S b and S d are the solar absorption, conductor diameter, beamed and diffused solar radiations, respectively, and λ , T a , K w d , w and V f represent the thermal conductivity of air, ambient temperature, wind direction, wind speed and kinematic viscosity of air.
Radiative heat loss can be calculated from (8).
q r = σ ϵ π D [ ( T c + 273 ) 4 ( T a + 273 ) 4 ]
where σ is the Stephan–Boltzmann constant, and ϵ is the emissivity.
By substituting terms to the heat balance Equation in (1), the DLR of the overhead line was expressed as in (9).
I r a t i n g ( D L R ) = 1 R a c T m a x q r + q c q s
where T m a x is the maximum conductor temperature. Based on the standards, T m a x was selected as 75–80 °C.

2.2. Optimizing the PV Generation

The objective of using DLR is to maximize the PV integration to the LVDN to the greatest extent possible by using the current capacity increment. Therefore, maximizing the sum of PV integration to the LVDN was considered the objective of this study. The objective function was defined as in (10).
Maximize S = H k h S h G
where h  H denotes a particular household, and S h G presents the generated apparent power by a household with PV installation. The weighting factor k h is required to formulate the objective function which ensures the fair distribution of PV generation among all the PV units. The objective function given in Equation (10) was evaluated subject to the following constraints.

2.2.1. Voltage Constraint

The voltage magnitudes at each node were maintained within their acceptable ranges to maintain the stability of the network. Equation (11) defines the voltage constraints.
V ̲ V n , ϕ V ¯
where V n , ϕ is the voltage of nth node ( n 1 , 2 , , N ) of phase ϕ ( A , B , C ), while V ̲ and V ¯ are the lower voltage limit and the upper voltage limit respectively.

2.2.2. Thermal Constraint

All the branch currents must be maintained within the thermal capacity of the conductor. In this study, DLR was considered as thermal constraint as shown in Equation (12).
I m , ϕ I r a t i n g ( D L R )
where I m , ϕ is the m t h branch current of phase ϕ ( A , B , C ) and I r a t i n g ( D L R ) is the maximum allowable branch current.

2.2.3. Power Factor Constraint

The power factor of each PV generation unit must be maintained above the acceptable limit and below its maximum value as shown in Equation (13).
0.9 P F h 1.0
where P F h is the power factor of the hth household with PV installation.

2.2.4. Active Power Generation Constraint

The total active power integration capacity of the LVDN has to be divided among all the PV generation units fairly while not exceeding the PV unit rating as shown in Equation (14).
P h G ̲ P h G P h G ¯
where, P h G is the generated active power by the hth household, P h G ̲ is the minimum power assigned to a PV unit to ensure fairness, and P h G ¯ is the maximum power of the PV unit.
The optimization problem was developed in Matlab® (version 2020a) simulation environment and executed on a processor with Intel Core i7-8550U with 8 GB RAM running at 3.4 GHz. Matlab “fmincon” nonlinear solver toolbox was used to solve the optimization problem utilizing the trust region optimization method [50].

2.3. Rpc of PV Inverters

Mitigating voltage violations at PCC is important to increase the PVHC of the LVDN. Therefore, the PV inverters’ voltage control method plays a major role in increasing PVHC. Active and reactive power in the PV inverter were varied based on the local voltage measurements to alleviate the voltage violations. In RPC mode, the PV inverter injects or absorbs reactive power if the PCC voltage is below or above the voltage limits. For the hth PV system, active power and reactive power relation are expressed as in Equation (15).
( P h , t G ) 2 + ( Q h , t G ) 2 = S h 2
where P h , t G and Q h , t G represent the generated active power and reactive power of the PV unit at the hth household at tth time, respectively. S h is the inverter capacity of the PV installation at the hth household.
Reactive power relates to the PV capacity as given in Equation (16).
Q h , t G = P h , t G × t a n ( cos 1 ( P F h ) )
where P F h is the pre-defined power factor of the PV system of the hth household.
Absorption or injection of reactive power in RPC mode is illustrated in Figure 2, while Equation (17) presents the RPC mathematically as a piecewise linear function.
Q h , t G = + Q h , m a x G ; V n , t ϕ < V 0 V 1 V n , t ϕ V 1 V 0 Q h , m a x G ; V 0 < V n , t ϕ < V 1 0 ; V 1 < V n , t ϕ < V 2 V 3 V n , t ϕ V 3 V 2 Q h , m a x G ; V 2 < V n , t ϕ < V 3 Q h , m a x G ; V 3 < V n , t ϕ < V 4

2.4. Parallel Operation of PV Inverters and OLTC

If the RPC mode fails to maintain nodal voltages within the voltage limits, then the OLTC operates to regulate the voltage. This sequence of operation can minimize the wear and tear of the OLTC.

2.5. Re-Phasing Approach

If the nodal voltages are closer to the upper voltage limit ( V ¯ ) or the branch currents are closer to DLR, then the connected phase of the PV units was changed to eliminate voltage and current violations which results in more PV integration to the network. If the nodal voltages are greater than a pre-defined voltage unbalance factor (VUF V ¯ ), or the branch currents are closer to the I r a t i n g (DLR), the connected phase of the PV unit in the particular node was changed to another phase that has its voltage below a pre-defined safe voltage limit (SVL) which ensures no further voltage violations after the re-phasing. This is given in Equations (18)–(20).
If
V n , ϕ V U F or I m , ϕ I r a t i n g ( D L R )
then
S h , ϕ S h , ϕ 1
where
V h , ϕ 1 S V L
where ϕ , ϕ 1 A , B , C , and ϕ ϕ 1 .
The RPC mode and OLTC sequence mentioned in Section 2.4 were performed followed by re-phasing.
The network was constructed and load flow was formulated with RPC and OLTC using OpenDSS® (version 9.4.0.3) simulation environment and executed on a processor with Intel Core i7-8550U with 8 GB RAM running at 3.4 GHz. The standard Sri Lankan LVDN voltage limits that are 0.94 p.u. and 1.06 p.u. were used to design the RPC scheme in OpenDSS for 100% injection and absorption of reactive power. The OLTC operation was formed in OpenDSS considering the operation of a transformer with 5 tap positions of 2.5% voltage change per step. After the initial optimization and the load flow with RPC and OLTC coordinated voltage regulation method, the optimization was re-formulated with the updated power factor constraints such that the voltage and current capacity of the LVDN are fully utilized.
The complete structure of the methodology is summarized as a flowchart in Figure 3.

3. Case Studies

3.1. Test Cases and Scenarios

In this study, an optimization problem was formulated considering a network with fixed PV locations. The optimized PV values were used to evaluate the voltage and current variation of the network by executing the load flow. The load flow was simulated for four scenarios.
  • Optimized PV values with SLR and voltage regulation with the OLTC (Base case);
  • Optimized PV values with DLR and voltage regulation with the OLTC;
  • Optimized PV values with DLR and coordinated voltage regulation using OLTC and RPC;
  • Optimized PV values with DLR with voltage regulation using OLTC and RPC and re-phasing.

3.2. Test Network

The simulation network was developed considering a part of an urban LVDN in Sri Lanka (Lotus Grove- Sri Lanka). Although Sri Lanka is a tropical country with a uniform irradiance level throughout the year, new PV connections are restricted in some areas as the cable limitations have already been met. Therefore, this study demonstrates the effectiveness of using DLR to maximize PVHC. In Sri Lanka, the peak irradiance hours are 11.30 a.m. to 1.30 p.m. During these hours, peak irradiance in a sunny day can go up to 1000 W/m 2 , while in a rainy day, that value can go below 500 W/m 2 . As the DLR is inversely proportional to the temperature, DLR is lower in a sunny warm day. Therefore, in a sunny day, although the PV generation is high, the amount of PV power integration to the low voltage distribution network will be capped by the lower DLR value.Although it was simulated in a Sri Lankan LVDN, the concept can be applied to any network without loss of generality.
The developed LVDN is comprised of 25 nodes as shown in Figure 4. The secondary side of the MV-LV transformer is connected to the root node denoted as node 1 in Figure 4. The rated capacity of the transformer is 400 kVA, and the input/output voltage rating is 11/0.415 kV. The 70 mm 2 Ariel Bundle Conductor (ABC) represented in the pink-colored thick line is divided into two laterals of 35 mm 2 ABC denoted in black thick lines which deliver power to 40 households (H), and the connected phase of the household is denoted by either a red (phase A), yellow (phase B) or a blue (phase C) thick line as shown in Figure 4.
Households with PV connections are denoted by a colored circle, and the red (phase A), yellow (phase B) or blue (phase C) colored circles represent the connected phase of the PV unit. Houses without PV systems are denoted by white-colored circles. It was assumed that the maximum possible capacity of a PV plant connected to each house ( P h G ¯ ) is 15 kW. This value was chosen based on the typical connection provided to the domestic premises in Sri Lanka. The PV inverter reactive power control has been achieved by controlling the power factor between 0.9 and 1.0. The branch lengths, number of households and PV units connected to particular nodes are summarized in Table 1.

4. Simulation Results and Discussion

This section presents the optimized PV values and the current and voltage variations of the load flow simulations. The simulation time period was 6 h to 18 h, while the simulation time step was set to 15 min, and the load demand variation of a workday illustrated in Figure 5 was considered. It was assumed that each household has the same active and reactive power variation during the simulation period as shown in Figure 5. According to the optimization problem formulated in Section 2.2, DLR calculation is essential to determine the thermal limit constraint. The irradiance, wind speed and ambient temperature variation during the simulation time period which are required to calculate the thermal limit are shown in Figure 6. Utilizing them, the DLR variation shown in Figure 7 was calculated from Equation (9) for a 35 mm 2 Areal Bundle Cable (ABC).

4.1. Optimized PV Values with SLR and Voltage Regulation with the OLTC (Base Case)

For the base case, the optimization problem was formulated by using the SLR shown in Figure 7 as the thermal limit of the conductors. Only the OLTC operation was used as the voltage regulation method for the load flow. The formulated optimization problem was solved to determine the possible PVHC with SLR. The obtained PV sizes are shown in Figure 8, and the active power variation during the assessment period is shown in Figure 9 for each PV system. According to Figure 8, the optimized value of the total PV integration to the LVDN when using SLR is 204.4 kW. In Figure 8, the PV unit numbers and the connected nodes are denoted at the bottom of the figure. The connected phase of the PV unit is depicted by a red (phase A), yellow (phase B) and blue (phase C) circles on the top of Figure 8.
For the PV variation in Figure 9, the load flow was simulated in OpenDSS software. Figure 10a shows the variation of nodal voltages, and Figure 10b depicts the branch current variation. In Figure 10a, dashed red lines show the upper and lower voltage limits (i.e., 0.94 p.u. and 1.06 p.u.). The SLR and DLR limits are shown in red and orange-colored dashed lines, respectively, in Figure 10b. According to Figure 10b, branch currents have reached the SLR limit in all three phases which results in capping the PVHC of the LVDN.

4.2. Optimized PV Values with DLR and Voltage Regulation with the OLTC

In this scenario, the possible enhancement of PVHC when using the DLR and only the OLTC voltage regulation is assessed. The optimization problem was formulated considering 75% of the calculated DLR shown in Figure 7 as the thermal limit of the conductors in LVDN. This is to ensure that any high-frequency variation in weather parameters will not create a violation of the heat balance in the conductor. The problem was solved to determine the maximum PVHC. The optimized PV values are shown in Figure 11, and the optimized active power variation during the assessment period is shown in Figure 12. The total optimized PV integration with DLR and OLTC voltage regulation is 288.0 kW. Using the PV variation in Figure 12, the load flow was executed to obtain the nodal voltage and branch current variation of the LVDN which are shown in Figure 13a and Figure 13b respectively. As shown in Figure 13b, PVHC is limited by the DLR of the conductors. The PVHC is proportional to the load demand. In this particular case, the optimized PVHC at 11.45 a.m. was obtained as 288 kW which was corresponding to a moment where the aggregated load demand was as low as 52 kW. The PVHC value obtained is the maximum allowable PV power integration to the low voltage distribution network without violating network current and voltage constraints. If the load demand increases, more PV power can be integrated to the network.

4.3. Optimized PV Values with DLR and Coordinated Voltage Regulation Using OLTC & RPC

The PV integration to the LVDN was optimized in this scenario with the coordinated operation of RPC and OLTC voltage regulation and the DLR as the thermal limit. The optimized total PV integration is 313.8 kW, and the PV sizes of each PV unit are shown in Figure 14. Figure 15a,b depict the nodal voltage and branch current variations during the assessment period, respectively. The branch currents have reached the DLR limit in all three phases as shown in Figure 15b. In Figure 15a, the upper voltage limit has reached phase B. Therefore, the PV integration is maximized with the DLR and OLTC, RPC coordinated voltage regulation method.

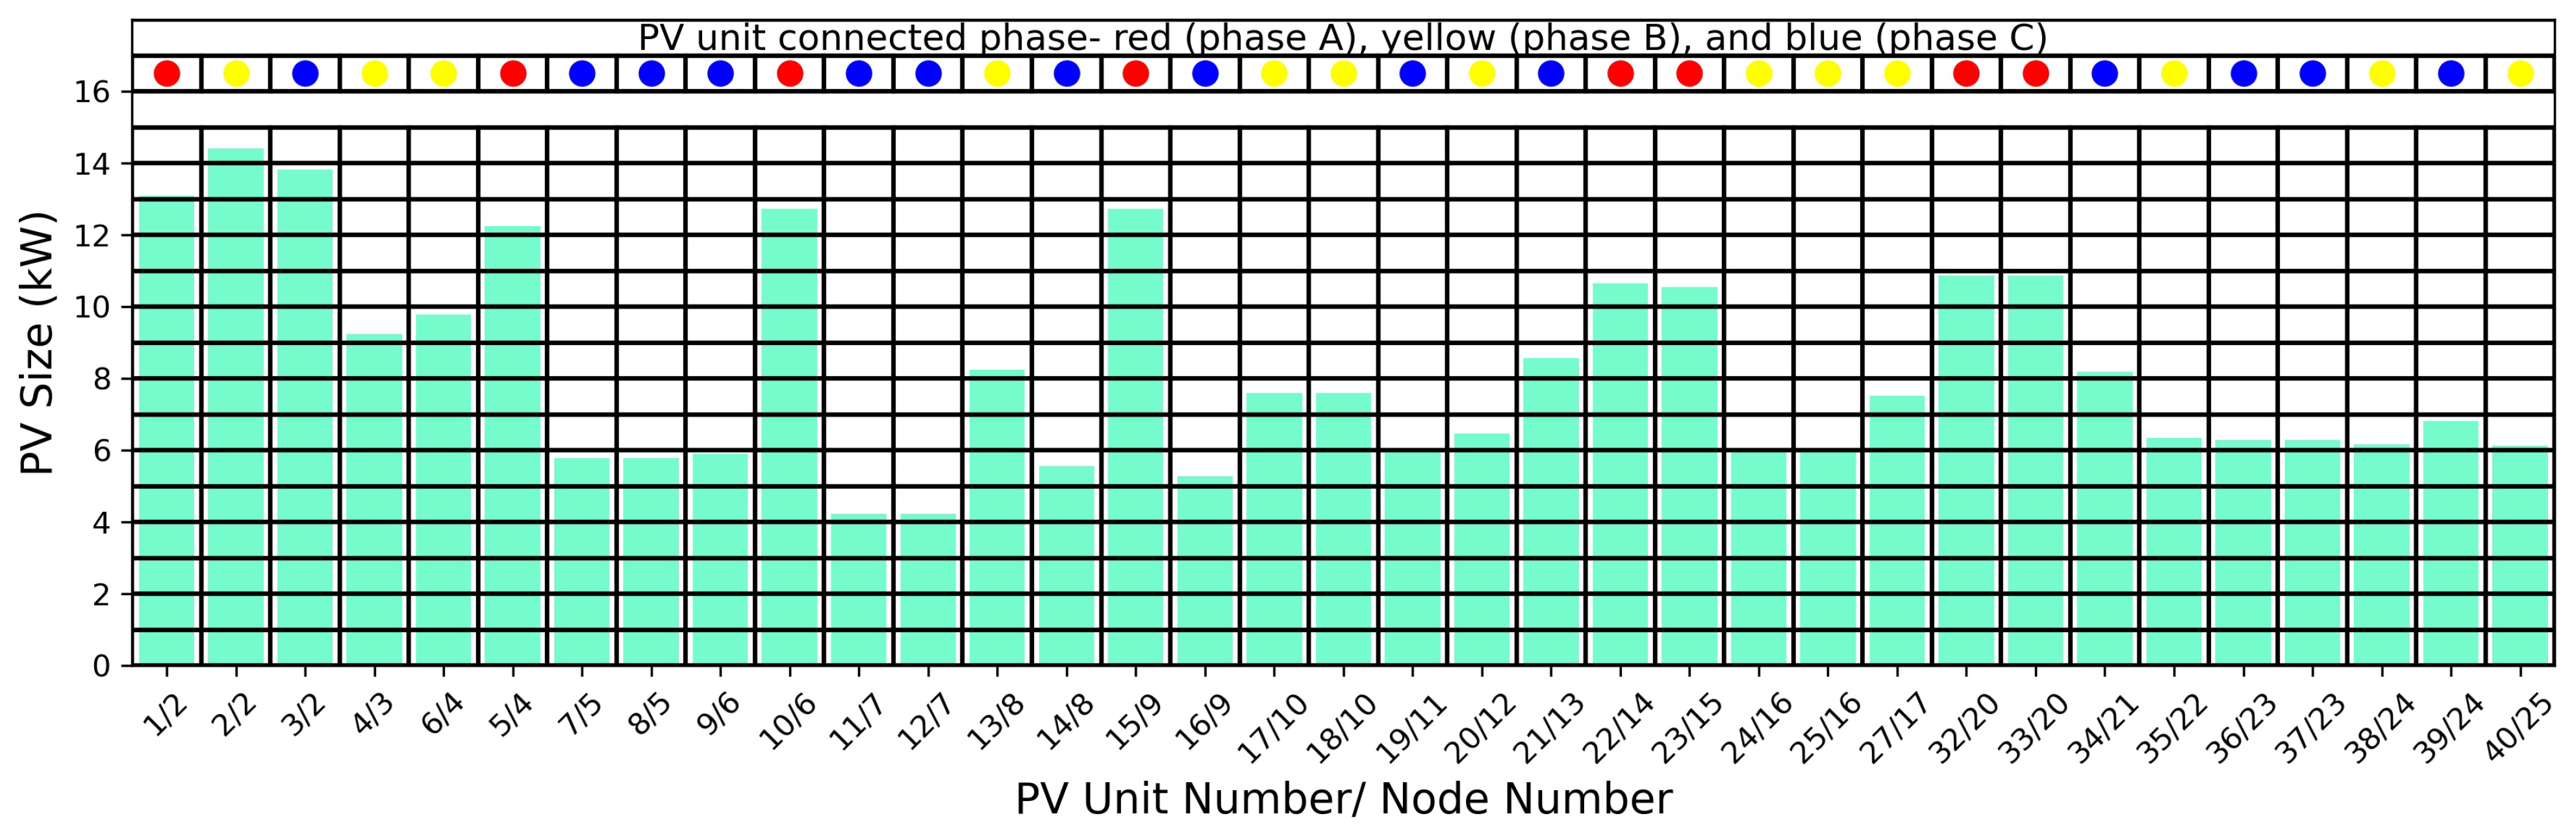
4.4. Optimized PV Values with DLR with Voltage Regulation Using OLTC and RPC and Re-Phasing

To examine the possibility to enhance PVHC by balancing phases, a PV re-phasing concept was applied. The phase re-configuration was performed as described in Section 2.5. In this particular case, the voltage unbalance factor was obtained as 1.058 p.u., and the safe voltage limit was taken as 1.04 p.u. In nodes 20, 22 and 24, the initial connected phases of PV units were phases A, B and B, respectively. The maximum allowable voltage of 1.06 reached in these nodes with the aforementioned phase configuration as shown in Figure 15a. However, in node 20, the node voltage in phase B was 1.038 which is below the safe voltage limit. This allows the change of the phase configuration from phase A to phase B in node 20 to ensure more PV addition. In both nodes 22 and 24, nodal voltages in phase A were 1.04 which are below the safe voltage limit. Therefore, phase configuration in both nodes 20 and 24 were changed to phase A from phase B. The re-phased configuration is shown in Figure 16. The changed PV unit phases are denoted by a shaded circle on the top of Figure 16. Then, the load flow is executed in OpenDSS while applying RPC and OLTC voltage regulation. The nodal voltage and branch current variations are presented in Figure 17a and Figure 17b, respectively. The re-phasing balanced the three-phase voltages as shown in Figure 17a. The rigidly met voltage constraint in phase B in Figure 15a reduced after re-phasing as shown in Figure 17a.
The optimized PV integration results are summarized in Table 2. Based on the results, it can be observed that the SLR limits the PVHC of the LVDN which in turn is an under-utilization of the network. The use of DLR with only the OLTC voltage regulation can increase the PVHC by 40.9% compared to the use of the SLR thermal limit of the LVDN. Furthermore, RPC can be used to increase the PVHC as a coordinated operation with OLTC and with the DLR thermal limit. A 53.5% increment in PVHC can be obtained in the particular network with this approach compared to the base case of SLR with the OLTC voltage regulation method.

5. Conclusions

With the increasing of PV penetration in LVDN, it is important to investigate avenues to utilize existing networks in an optimum manner to enhance PVHC. One of the initial constraints for PVHC is the upper voltage limit violations, and voltage regulating methods of OLTC operation and inverter RPC are widely investigated in the literature. The next constraint is the violation of the thermal limit, and there are some studies that utilize the DLR to enhance the PVHC. The novelty of this paper is to utilize coordinated control of OLTC and RPC for voltage control, to utilize DLR to enhance the current carrying capacity of the conductor and voltage re-phasing to minimize the unbalances, thus stretching the PVHC of existing networks.
A novel methodology was developed to investigate the aforementioned control techniques by utilizing an optimization approach. This methodology was adopted in a real LVDN and demonstrated that by using the DLR as a constraint of the optimization problem instead of SLR, PVHC can be enhanced by 40.9% compared to the case of SLR with the OLTC voltage regulation (the base case). The utilization of the coordinated operation of RPC and OLTC voltage regulation method, the DLR thermal limit enhancement, and PV re-phasing resulted in a PVHC increase of 53.5% compared to the base case.
One limitation of the study is the case study is based on an LVDN in an equatorial country. In a country having distinct seasonal patterns, simulations should be carried out under worst-case scenarios. For example, during the winter, although the DLR can be enhanced due to the low ambient temperature, the amount of available PV power is less. On the contrary, in summer, the DLR cannot be enhanced extensively as the ambient temperature is high although there is maximum PV power available. As the impact of PVHC is higher during the summer, simulation has to be carried out using summer data in a non-equatorial country to reflect the extreme conditions.

Author Contributions

Conceptualization, R.D., A.W., J.W. and J.E.; methodology, R.D., A.W. and J.E.; software, validation, formal analysis, R.D. and A.W.; writing—original draft preparation, R.D. and A.W.; writing—review and editing, R.D., A.W., J.W. and J.E.; supervision, J.E.; project administration, J.E. All authors have read and agreed to the published version of the manuscript.

Funding

This research was funded by the National Science Foundation (NSF) of Sri Lanka (research grant no: RG/GAPF/2021/EA&ICT/01).

Institutional Review Board Statement

Not applicable.

Informed Consent Statement

Not applicable.

Data Availability Statement

This study did not report any data.

Acknowledgments

The authors would like to acknowledge the financial support provided by the National Science Foundation (NSF) of Sri Lanka (research grant no: RG/GAPF/2021/EA&ICT/01).

Conflicts of Interest

The authors declare that they have no known competing financial interest or personal relationships that could have appeared to influence the work reported in this article.

Abbreviations

DLRDynamic Line Rating
LVLow Voltage
LVDNLow Voltage Distribution Network
MVMedium Voltage
OLTCOn-load Tap Changer
PCCPoint of Common Coupling
PVPhotovoltaic
PVHCPhotovoltaic Hosting Capacity
RPCReactive Power Compensation
SLRStatic Line Rating

References

  1. Dovi, V.; Battaglini, A. Energy Policy and Climate Change: A Multidisciplinary Approach to a Global Problem. Energies 2015, 8, 13473–13480. [Google Scholar] [CrossRef] [Green Version]
  2. The Paris Agreement. Available online: https://unfccc.int/ndc-information/the-paris-agreement (accessed on 18 September 2022).
  3. Erdiwansyah; Mahidin; Husin, H.; Nasaruddin; Zaki, M.; Muhibbuddin. A critical review of the integration of renewable energy sources with various technologies. Prot. Control Mod. Power Syst. 2021, 6, 3. [Google Scholar] [CrossRef]
  4. REN21. RENEWABLES 2022: GLOBAL STATUS REPORT; REN21 Secretariat: Paris, France, 2022. [Google Scholar]
  5. Shaikh, M.R.S.; Shaikh, S.; Waghmare, S.B.; Labade, S.; Tekale, A. A Review Paper on Electricity Generation from Solar Energy. Int. J. Res. Appl. Sci. Eng. Technol. 2017, 5, 1884–1889. [Google Scholar] [CrossRef]
  6. Peters, L.; Madlener, R. Economic evaluation of maintenance strategies for ground-mounted solar photovoltaic plants. Appl. Energy 2017, 199, 264–280. [Google Scholar] [CrossRef] [Green Version]
  7. Wang, Q.; Zhu, Z.; Wu, G.; Zhang, X.; Zheng, H. Energy analysis and experimental verification of a solar freshwater self-produced ecological film floating on the sea. Appl. Energy 2018, 224, 510–526. [Google Scholar] [CrossRef]
  8. Cole, W.; Lewis, H.; Sigrin, B.; Margolis, R. Interactions of rooftop PV deployment with thecapacity expansion of the bulk power system. Appl. Energy 2016, 168, 473–481. [Google Scholar] [CrossRef] [Green Version]
  9. U.S. Solar Market Insight. Available online: https://www.seia.org/research-resources/solar-market-insight-report-2021-year-review (accessed on 19 September 2022).
  10. Tonkoski, R.; Turcotte, D.; EL-Fouly, T.H.M. Impact of High PV Penetration on Voltage Profiles in Residential Neighborhoods. IEEE Trans. Sustain. Energy 2012, 3, 518–527. [Google Scholar] [CrossRef]
  11. Almeida, D.; Pasupuleti, J.; Ekanayake, J. Performance evaluation of PV penetration at different locations in a LV distribution network connected with an off-load tap changing transformer. Indones. J. Electr. Eng. Comput. Sci. 2021, 21, 987–993. [Google Scholar] [CrossRef]
  12. Alyami, S.; Wang, Y.; Wang, C.; Zhao, J.; Zhao, B. Adaptive Real Power Capping Method for Fair Overvoltage Regulation of Distribution Networks With High Penetration of PV Systems. IEEE Trans. Smart Grid. 2014, 5, 2729–2738. [Google Scholar] [CrossRef]
  13. Aziz, T.; Ketjoy, N. PV Penetration Limits in Low Voltage Networks and Voltage Variations. IEEE Access 2017, 3, 16784–16792. [Google Scholar] [CrossRef]
  14. Torquato, R.; Salles, D.; Pereira, C.O.; Meira, P.C.M.; Freitas, W. A Comprehensive Assessment of PV Hosting Capacity on Low-Voltage Distribution Systems. IEEE Trans. Power Deliv. 2018, 3, 1002–1012. [Google Scholar] [CrossRef]
  15. Alanzi, S.S.; Kamel, R.M. Photovoltaic Maximum Penetration Limits on Medium Voltage Overhead and Underground Cable Distribution Feeders: A Comparative Study. Energies 2021, 14, 3843. [Google Scholar] [CrossRef]
  16. Wang, S.; Chen, S.; Ge, L.; Wu, L. Distributed Generation Hosting Capacity Evaluation for Distribution Systems Considering the Robust Optimal Operation of OLTC and SVC. IEEE Trans. Sustain. Energy 2016, 7, 1111–1123. [Google Scholar] [CrossRef]
  17. Home-Ortiz, J.M.; Macedo, L.H.; Vargas, R.; Romero, R.; Mantovai, J.R.S.; Catalao, J.P.S. Increasing RES Hosting Capacity in Distribution Networks Through Closed-Loop Reconfiguration and Volt/VAr Control. IEEE Trans. Ind. Appl. 2022, 58, 4424–4435. [Google Scholar] [CrossRef]
  18. Tewari, T.; Mohapatra, A.; Anand, S. Coordinated Control of OLTC and Energy Storage for Voltage Regulation in Distribution Network With High PV Penetration. IEEE Trans. Sustain. Energy 2020, 12, 262–272. [Google Scholar] [CrossRef]
  19. Almeida, D.; Pasupuleti, J.; Ekanayake, J.; Karunarathne, E. Mitigation of overvoltage due to high penetration of solar photovoltaics using smart inverters volt/var control. Indones. J. Electr. Eng. Comput. Sci. 2020, 19, 1259–1266. [Google Scholar] [CrossRef]
  20. Zhang, C.; Xu, Y. Hierarchically-Coordinated Voltage/VAR Control of Distribution Networks Using PV Inverters. IEEE Trans. Smart Grid. 2020, 12, 2942–2953. [Google Scholar] [CrossRef]
  21. 1547-2018; IEEE Standard for Interconnection and Interoperability of Distributed Energy Resources with Associated Electric Power Systems Interfaces. IEEE Power and Energy Society: Piscataway, NJ, USA, 2018. Available online: https://ieeexplore.ieee.org/document/8332112 (accessed on 20 September 2022).
  22. Common Functions for Smart Inverters, Version 2. Available online: https://www.epri.com/research/products/1023059 (accessed on 20 September 2022).
  23. Almeida, D.; Pasupuleti, J.; Ekanayake, J. Comparison of Reactive Power Control Techniques for Solar PV Inverters to Mitigate Voltage Rise in Low-Voltage Grids. Electronics 2021, 10, 1569. [Google Scholar] [CrossRef]
  24. Wang, Y.; Zhao, T.; Ju, C.; Xu, Y.; Wang, P. Two-Level Distributed Volt/Var Control Using Aggregated PV Inverters in Distribution Networks. IEEE Trans. Power Deliv. 2019, 35, 1844–1855. [Google Scholar] [CrossRef]
  25. Aziz, T.; Ketjoy, N. Enhancing PV Penetration in LV Networks Using Reactive Power Control and On Load Tap Changer With Existing Transformers. IEEE Access 2017, 6, 2683–2691. [Google Scholar] [CrossRef]
  26. Arshad, A.; Lehtonen, M. A Stochastic Assessment of PV Hosting Capacity Enhancement in Distribution Network Utilizing Voltage Support Techniques. IEEE Access 2019, 7, 46461–46471. [Google Scholar] [CrossRef]
  27. Fatima, S.; Puvi, V.; Lehtonen, M. Review on the PV Hosting Capacity in Distribution Networks. Energies 2020, 7, 4576. [Google Scholar] [CrossRef]
  28. Arshad, A.; Linder, M.; Lehtonen, M. An Analysis of Photo-Voltaic Hosting Capacity in Finnish Low Voltage Distribution Networks. Energies 2017, 10, 1702. [Google Scholar]
  29. Kikuchi, S.; Machida, M.; Tamura, J.; Imanka, M.; Baba, J.; Iioka, D.; Miura, K.; Takagi, M.; Asano, H. Hosting capacity analysis of many distributed photovoltaic systems in future distribution networks. In Proceedings of the IEEE Innovative Smart Grid Technologies-Asia (ISGT-Asia) 2017, Auckland, New Zealand, 4–7 December 2017; pp. 2378–8542. [Google Scholar]
  30. Hoke, A.; Butler, R.; Hambrick, J.; Kroposki, B. Steady-State Analysis of Maximum Photovoltaic Penetration Levels on Typical Distribution Feeders. IEEE Trans. Sustain. Energy 2012, 4, 350–357. [Google Scholar] [CrossRef]
  31. Erdinç, F.G.; Erdinç, O.; Yumurtacı, R.; Catalão, J.P.S. A Comprehensive Overview of Dynamic Line Rating Combined with Other Flexibility Options from an Operational Point of View. Energies 2020, 13, 6563. [Google Scholar] [CrossRef]
  32. Bhattarai, B.P.; Gentle, J.P.; McJunkin, T.; Hill, P.J.; Myers, K.S.; Abboud, A.W.; Renwick, R.; Hengst, D. Improvement of Transmission Line Ampacity Utilization by Weather-Based Dynamic Line Rating. IEEE Trans. Power Deliv. 2018, 33, 1853–1863. [Google Scholar] [CrossRef]
  33. Hajeforosh, S.; Khatun, A.; Bollen, M. Enhancing the hosting capacity of distribution transformers for using dynamic component rating. Int. J. Electr. Power Energy Syst. 2022, 142, 142–615. [Google Scholar] [CrossRef]
  34. Li, Y.; Wang, Y.; Kang, C.; Song, J.; He, G.; Chen, Q. Improving distributed PV integration with dynamic thermal rating of power distribution equipment. iScience 2022, 25, 104808. [Google Scholar] [CrossRef]
  35. Carpinelli, G.; Mottola, F.; Proto, D.; Varilone, P. Minimizing unbalances in low-voltage microgrids: Optimal scheduling of distributed resources. Appl. Energy 2017, 191, 170–182. [Google Scholar]
  36. Taher, S.A.; Karimi, M.H. Optimal reconfiguration and DG allocation in balanced and unbalanced distribution systems. Ain Shams Eng. J. 2014, 5, 735–749. [Google Scholar] [CrossRef] [Green Version]
  37. Ji, H.; Wang, C.; Li, P.; Zhao, J.; Song, G.; Ding, F.; Wu, J. An enhanced SOCP-based method for feeder load balancing using the multi-terminal soft open point in active distribution networks. Appl. Energy 2017, 208, 986–995. [Google Scholar] [CrossRef]
  38. Kaveh, M.R.; Hooshmand, R.A.; Madni, S.M. Simultaneous optimization of re-phasing, reconfiguration and DG placement in distribution networks using BF-SD algorithm. Appl. Soft Comput. 2018, 62, 1044–1055. [Google Scholar] [CrossRef]
  39. Zhu, J.; Chow, M.; Zhang, F. Phase balancing using mixed-integer programming [distribution feeders]. IEEE Trans. Power Syst. 1998, 13, 1487–1492. [Google Scholar]
  40. Hooshmand, R.A.; Soltani, S. Fuzzy Optimal Phase Balancing of Radial and Meshed Distribution Networks Using BF-PSO Algorithm. IEEE Trans. Power Syst. 2011, 27, 47–57. [Google Scholar] [CrossRef]
  41. Bandara, W.G.C.; Godaliyadda, G.M.R.I.; Ekanayake, M.P.B.; Ekanayake, J.B. Coordinated photovoltaic re-phasing: A novel method to maximize renewable energy integration in low voltage networks by mitigating network unbalances. Appl. Energy 2020, 280, 116022. [Google Scholar] [CrossRef]
  42. Karunarathne, E.; Wijethunge, A.; Ekanayake, J. Enhancing PV Hosting Capacity Using Voltage Control and Employing Dynamic Line Rating. Energies 2022, 15, 134. [Google Scholar] [CrossRef]
  43. Ismael, S.M.; Aleem, S.H.E.A.; Abdelaziz, A.Y.; Zobaa, A.F. State-of-the-art of hosting capacity in modern power systems with distributed generation. Renew. Energy 2019, 130, 1002–1020. [Google Scholar] [CrossRef]
  44. Mulenga, E.; Bollen, M.H.J.; Etherden, N. A review of hosting capacity quantification methods for photovoltaics in low voltage distribution grids. Int. J. Electr. Power Energy Syst. 2020, 115, 105445. [Google Scholar] [CrossRef]
  45. Han, C.; Lee, D.; Song, S.; Jang, G. Probabilistic Assessment of PV Hosting Capacity Under Coordinated Voltage Regulation in Unbalanced Active Distribution Networks. IEEE Access 2022, 10, 35578–35588. [Google Scholar] [CrossRef]
  46. Sahu, S.K.; Ghosh, D. Hosting Capacity Enhancement in Distribution System in Highly Trenchant Photo-Voltaic Environment: A Hardware in Loop Approach. IEEE Access 2019, 8, 14440–14451. [Google Scholar] [CrossRef]
  47. Abad, M.S.S.; Ma, J. Photovoltaic Hosting Capacity Sensitivity to Active Distribution Network Management. IEEE Trans. Power Syst. 2020, 36, 107–117. [Google Scholar] [CrossRef]
  48. 738-2012; Calculating the Current-Temperature Relationship of Bare Overhead Conductors. IEEE Power and Energy Society: Piscataway, NJ, USA, 2012.
  49. Wijethunga, A.; Ekanayake, J.B.; Wijayakulasooriya, J.V. Collector cable design based on dynamic line rating for wind energy applications. J. Natl. Sci. Found. 2018, 46, 31–40. [Google Scholar] [CrossRef] [Green Version]
  50. Hameed, M.F.O.; Hassan, A.K.S.O.; Elqenawy, A.E.; Obayya, S.S.A. Trust Region Algorithm for Dispersion Optimization of Photonic Crystal Fibers. J. Light. Technol. 2017, 35, 3810–3818. [Google Scholar] [CrossRef]
Figure 1. Heat balance of an overhead conductor.
Energies 15 08537 g001
Figure 2. Reactive power compensation scheme.
Energies 15 08537 g002
Figure 3. The complete structure of the methodology.
Energies 15 08537 g003
Figure 4. Single line diagram of the test network used for the simulations.
Energies 15 08537 g004
Figure 5. Variation of the load demand during the simulation period.
Energies 15 08537 g005
Figure 6. Variation of irradiance, temperature and wind speed during the simulation period.
Energies 15 08537 g006
Figure 7. Line rating variation for 35 mm2 ABC during the simulation period.
Energies 15 08537 g007
Figure 8. Optimized PV values with the SLR as the thermal limit of the conductors.
Energies 15 08537 g008
Figure 9. Active power variation of all the PV units during the assessment period.
Energies 15 08537 g009
Figure 10. (a) Nodal voltage variation; and (b) branch current variation during the simulation period with SLR and OLTC voltage regulation.
Energies 15 08537 g010
Figure 11. Optimized PV values with the DLR as the thermal limit of the conductors and OLTC voltage regulation.
Energies 15 08537 g011
Figure 12. Active power variation of all the PV units during the assessment period.
Energies 15 08537 g012
Figure 13. (a) Nodal voltage variation; and (b) branch current variation during the simulation period with DLR and OLTC voltage regulation.
Energies 15 08537 g013
Figure 14. Optimized PV values with the DLR as the thermal limit and OLTC, RPC coordinated voltage regulation method.
Energies 15 08537 g014
Figure 15. (a) Nodal voltage variatio;n and (b) branch current variation during the simulation period with DLR and OLTC, RPC coordinated voltage regulation method.
Energies 15 08537 g015
Figure 16. Phase changing of optimized PV sizes.
Energies 15 08537 g016
Figure 17. (a) Nodal voltage variation; and (b) branch current variation during the simulation period with RPC and OLTC voltage regulation after re-phasing.
Energies 15 08537 g017
Table 1. The branch lengths, number of households and PV units connected to the nodes.
Line
From NodeTo NodeLength (m)Number of Houses at “To Node”Number of PV Units at “To Node”
1236.033
2320.011
3420.022
4525.022
5625.022
6726.022
7828.022
8923.022
91022.522
101122.511
21220.011
121320.011
131420.011
141532.011
151625.522
161725.521
171825.520
181925.520
192026.022
202110.211
212210.211
222310.222
232410.222
242510.211
Table 2. Summary of the results.
CaseOptimized PV
Integration (kW)
PVHC Increment (%)
SLR with OLTC204.4Base case
DLR with OLTC288.040.9
DLR with OLTC, RPC and re-phasing313.853.5
Publisher’s Note: MDPI stays neutral with regard to jurisdictional claims in published maps and institutional affiliations.

