Abstract
The energy industry has a major impact on the sustainability level of global economies, from job creation to resource efficiency and environmental impact. The aim of our study was to examine the phenomenon of energy production and its main determinants in 37 European economies during the period of 2011–2021. The methodological approach entailed the use of the panel first-difference generalized method of moments (GMM). The empirical results show that the relationship between energy production and predictors such as imports, energy prices, energy productivity, and energy efficiency was monotonic. At the same time, our results indicate a relationship between energy supply and energy production, imports, productivity, and prices. Moreover, energy production depends significantly on the energy productivity, primary energy consumption, and energy imports.
1. Introduction
Aristotle, the Greek philosopher, stated that the “energy of the mind is the essence of life”. Paraphrasing the philosopher’s words while regarding the energy industry, one could state that energy production and consumption is a sine qua non ingredient for business life and daily activities. For this reason, changes in the energy market are of utmost importance for businesspeople, national and regional authorities, and regular household consumers. Every so often, the energy market undergoes considerable disruptions because of various factors (e.g., armed conflicts; economic slowdowns; natural calamities; poor infrastructure and distribution; localized shortages of fossil fuels; energy waste). As a sensible response, businesses and households need to promptly react and adapt to the new realities of the market. In this context, substantial energy price fluctuations can heavily affect everyday business activities, wind down daily production, hinder distribution, and generally impact consumers’ purchasing power.
Taking into account the current situation of the energy market triggered by the upsurge in energy prices, the topic of this research study is both timely and important. The novelty of the endeavor is that it investigates relevant factors that drove energy production across 37 economies in Europe during the period of 2011–2021. The choice of the sample was motivated by the fact that European economies rank third (after China and the USA) in energy consumption at a global level [1]. For this reason, the current sample of economies is broad enough to include both the largest consumers of primary energy on the continent (Germany, France, and the United Kingdom) and more economical players (Albania, Luxembourg, and Slovakia). Empirical analyses were conducted with the state-of-the-art approach of the panel first-difference generalized method of moments due to its multiple benefits in controlling for endogeneity and heteroscedasticity, among others.
The study aimed to investigate the degree to which energy production was shaped by different factors, such as imports of electricity and derived heat, electricity prices, energy productivity, and energy efficiency across European economies. The phenomenon of energy production is proxied by the following regressands: gross domestic product, gross electricity production, total energy supply, and electricity production capacities.
In this context, the first goal of the study was to determine the extent to which energy supply evolved under the impact of electricity imports, energy productivity, and energy efficiency. The second goal consisted of examining how physical output (i.e., GDP) was mainly driven by imports, energy productivity, efficiency, and prices. Moreover, the study captured the influences exerted on gross energy production and electricity production capacities, presenting valuable lessons and insights that one can draw from the dynamic energy sector.
Overall, the present research article aims to provide certain lessons that national and regional authorities would benefit from in their quest to support economic growth (on the one hand) and keep a close eye on the energy market (on the other hand) [2,3,4,5]. Bearing the constant pressure of monitoring the evolution of energy prices on behalf of businesses and private households (at least in recent years), authorities have been called to identify factors that play an important role in the energy sector and to efficiently use their own energy resources (fossil fuels and alternative sources) [6,7,8].
The article is structured as follows. Section 2 dives into the extant literature on energy production and the related factors of influence, with insights from countries around the world. Section 3 provides details on the methodological approach and research hypotheses. Section 4 reports on the empirical results estimated via the panel first-difference generalized method of moments. Section 4 entails a discussion based on the estimated results and comparisons with the extant literature, along with concluding remarks, study limitations, and avenues for future research.
2. Literature Review
The following paragraphs synthesize a number of important lessons regarding the energy industry and energy production provided by studies conducted on data from various countries around the world [9,10,11,12]. Since the energy market has become more volatile than before, such lessons serve as a reference point for energy suppliers, public authorities, industrial and household consumers, international bodies, and NGOs that support alternative energy sources.
Based on aggregated data from 64 economies, Liao et al. [13] examined the impact of the investment–GDP ratio on energy use growth during the period of 1972–2019. The empirical results showed a positive influence of the ratio on the phenomenon.
Abbasi, Abbas, and Tufail [14] focused on the connections among electricity consumption, electricity price, and GDP using data from various economic sectors in Pakistan (i.e., agricultural, commercial, industrial, and residential). The timeframe spanned from 1970 to 2018. Econometric analyses, which included the Johansen co-integration test and the vector error correction model (VECM), revealed the existence of a short-run Granger causality among different sectors. In a similar line of thought, Elder [15] investigated the extent to which energy prices influenced the productivity of different industries in Canada. The results showed that price volatility substantially shaped production for companies operating in mining and extraction, manufacturing, or transportation.
Using data from the Qatari economy, Charfeddine and Barkat [16] analyzed how oil price shocks and changes in oil and gas revenues impacted the overall real GDP and economic diversification in the short and long runs. According to the results, the national economy reported a short-term asymmetric impact of price shocks. Moreover, long-term macroeconomic results seemed to be undisrupted by price shocks and revenue shifts.
Raggad [17] focused on US data from 1986 to 2020 in order to investigate potential causal links among economic activity, energy consumption, and energy prices. The empirical results found no stable causal relationships among the aforementioned variables over time. Nevertheless, the relationship between economic activity and renewable energy consumption proved to be significant.
Vural [18] examined the influence of economic growth, pollution (via the proxy carbon dioxide emissions), trade, and technological innovation on renewable energy production from six Latin American countries for the period of 1991–2014. The results indicated that, with the exception of pollution, all the other variables triggered a positive impact on energy production.
Using data from 32 OECD countries for the timeframe of 2000–2015, Barerra-Santana, Marrero, and Ramos-Real [19] advanced an energy efficiency governance index in order to analyze the two-way relationship between energy consumption and national income proxied via GDP. In the same vein, Mahalingam and Orman [20] carried out a panel data analysis on US data to capture the connection between energy consumption and GDP. Borozan [21] also followed the same research path and found evidence for the link with the Croatian market during the period of 1992–2010.
Xin-gang and Shu-ran [22] analyzed the impact of electricity prices on energy efficiency for the Chinese market while controlling for various factors, including the economy, policy, and other price-related variables. The empirical results showed that there was a strong positive relationship between price and energy efficiency.
The relationship between energy use and GDP has also raised the interest of scholars. In this sense, Coers and Sanders [23] employed data from 30 OECD countries across 40 years and showed that there was a bi-directional connection between per capita energy use and gross domestic product. Mishra, Smyth, and Sharma [24] examined a panel of Pacific Island countries and also found a bi-directional connection between energy consumption and GDP.
Using data from the BRICS countries for the period of 1996–2015, Ndlovu and Inglesi-Lotz [25] reported on the dynamics of the relationships among GDP, renewable and non-renewable energy, and R&D expenses. Regarding the same region, Cowan et al. [26] provided evidence for the links among electricity consumption, economic growth, and CO2 emissions for the period of 1990–2010. The authors concluded that no standard policies could be enacted for BRICS countries because of different economic contexts.
Abas and Choudhury [27] analyzed the causality between electricity consumption and economic growth based on data from India and Pakistan. The authors reported that, in the case of India, enacting strategies that promoted energy conservation would not mitigate the country’s ongoing economic growth. Unlike the case of India, Pakistani authorities were called to consider such conservation strategies because it would benefit the national income.
Wada [28] investigated the link between energy production and economic growth from the causality direction standpoint using data from Saudi Arabia. The author concluded that economic growth impacted energy production. In this context, the Saudi economy would benefit a great deal from raising the national income.
Based on data from 22 European economies, Szustak et al. [29] tested the connection between energy production and GDP growth. The authors reported that the causality relationship varied across countries. As stated above, because of national circumstances, the energy policies of European economies are diversified. Nevertheless, these public authorities should aim for increasing the use of renewable energy sources, especially considering the potential disruptions of standard energy supply.
Radulescu and Sulger [30] used data from 17 European economies during the period of 1978–2017 to investigate the relationship between domestic fossil energy production and imports. The empirical results revealed an indirect relationship between the variables across the sample. In addition, the authors noticed that investments in domestic energy capacities were declining since European economies relied on imports to a greater extent.
Amid considerable surges in energy prices, Shepard and Pratson [31] proposed different solutions to mitigate the impact of wavering global supply chains on US energy production. In this context, the authors favored solutions such as supporting locally produced goods and services as opposed to imported ones; producing key commodities domestically by using innovative technologies developed within the country, investing in energy infrastructure locally, and promoting a similar approach internationally.
In the same line of thought, Jaeger et al. [32] made the case for investing in renewable energy production facilities to prevent future spikes in energy prices.
Based on a sample of 28 EU member states analyzed during the period of 2004–2018, Rokicki and Perkowska [33] focused on the energy balance within the EU. The empirical results showed that energy imports were less volatile than energy exports, as expected.
Azam et al. [34] conducted a Granger causality analysis on the link between electricity supply and economic growth with data from Pakistan for the timeframe of 1990–2015. According to their results, the indicators of economic growth, electricity supply, investment, and exports were co-integrated. Moreover, the direction of the Granger causality ran from economic growth to the other variables.
With data from 26 members of the European Union and three benchmark years (2010, 2015, and 2020), Bąk et al. [35] examined the pattern of energy use across the union. The authors reported that Western and Northern European economies displayed a pattern of rational use compared to other EU members.
Last but not least, Daroń and Wilk [36] focused on 28 EU economies and two benchmark years (2017 and 2019) to compare the use of energy sources and their impact on national energy production. The empirical results suggested that diversifying energy sources boosted energy production across the union.
3. Materials and Methods
The study was based on a panel data analysis using observations from 37 European economies over a period of 11 years (2011–2021), namely: Albania, Austria, Belgium, Bosnia and Herzegovina, Bulgaria, Croatia, Cyprus, Czechia, Denmark, Estonia, Finland, France, Germany, Greece, Hungary, Ireland, Italy, Kosovo, Latvia, Lithuania, Luxembourg, Malta, Montenegro, the Netherlands, North Macedonia, Norway, Portugal, Romania, Serbia, Slovenia, Slovakia, Spain, Sweden, and the United Kingdom. The sample comprises some of the most important economies on the continent, from the largest consumers of primary energy (e.g., Germany, France, United Kingdom, and Italy) to the lowest consumers of primary energy (e.g., Greece, Albania, Luxembourg, and Slovakia) [37].
The choice of the timeframe was motivated by the fact that this period registered a constant level of overall energy consumption across Europe, in spite of the prior world financial crisis, as indicated by the World Energy and Climate Statistics Yearbook [38].
Starting from the existing literature, the analyzed phenomenon was energy production proxied by the following indicators: gross domestic product (GDP); gross electricity production (GEP); supply, transformation, and consumption of energy (SE); electricity production capacities by main fuel groups and operators (CAP). All variables and corresponding definitions were retrieved from the Eurostat database [39].
Table 1 synthesizes the dependent and independent variables used in the study, with corresponding symbols and definitions.

Table 1.
Description of variables with symbols and definitions.
The workhorse for conducting econometric analyses was EViews version 10.
The methodological approach favored the use of panel first-difference generalized method of moments (GMM) with cross-section effects due to the benefits regarding the control of the endogeneity bias, which can emerge from various sources, including the following: omitted variables, unobserved country heterogeneity, and measurement errors [41,42]. Namely, this approach checks whether explanatory variables are correlated with error terms, which could ultimately trigger wrong inferences in empirical research [43]. Overall, GMM models are regarded as more efficient than other types of models, including ordinary least squares (OLS) or weighted least squares (WLS) because they entail a proper control for heteroskedasticity [44,45].
Regarding the cross-section effects, based on the recommendations in the literature [46,47], the Hausman test was used to disentangle between the fixed and random effects. In this case, since the corresponding p-values were significant, the estimated econometric models included fixed effects.
Multicollinearity was investigated with correlation analysis and the computation of variance inflation factors (VIFs). Moreover, the Jarque-Bera test was used to examine the distribution of independent variables. If the test is significant, the independent variables will be non-normally distributed. Conversely, predictors will be normally distributed.
The study investigated the following research hypotheses, derived from the relevant literature presented in Section 2:
Hypothesis 1 (H1):
There is a significant linear dependence between total energy supply and the variables gross electricity production, imports of electricity and derived heat, energy productivity, and electricity price components for household consumers.
Hypothesis 2 (H2):
There is a significant non-linear dependence between gross domestic product and the variables gross electricity production, imports of electricity and derived heat, energy productivity, electricity price components for household consumers, and energy efficiency.
Hypothesis 3 (H3):
There is a significant linear dependence between gross electricity production and the variables energy productivity, energy efficiency, imports of electricity and derived heat, and electricity price components for household consumers.
Hypothesis 4 (H4):
There is a non-linear significant dependence between electricity production capacities and the variables gross electricity production, energy productivity, and energy efficiency.
The general form of the linear econometric model is the following:
where
- a0 indicates the intercept;
- ai indicates the coefficient of independent variables;
- X indicates the independent variables;
- i indicates the economy, taking values from 1 to 37;
- t indicates the period of analysis (2011–2021);
- indicates the fixed effects controlling for economy-specific factors;
- indicates the fixed effects that control for common shocks;
- indicates the error term.
Moreover, the general form of the non-linear econometric model is the following:
where
- a0 indicates the intercept;
- ai indicates the coefficient of independent variables;
- X indicates the independent variables;
- i indicates the economy, taking values from 1 to 37;
- t indicates the period of analysis (2011–2021);
- indicates the fixed effects controlling for economy-specific factors;
- indicates the fixed effects that control for common shocks;
- indicates the error term.
4. Empirical Results
The following section reports on the various analyses conducted for the purpose of the study: descriptive statistics; correlation analysis; panel first-difference generalized method of moments.
4.1. Descriptive Statistics
Table 2 displays the values corresponding to the descriptive statistics: mean, median, standard deviation, minimum and maximum values, skewness, kurtosis, the Jarque-Bera test, and corresponding probability.
Table 2.
Descriptive statistics.
As a general rule, descriptive statistics convey an idea about the distributions of the variables. As indicated by the standard deviation values, the variables energy efficiency, gross domestic product, and gross electricity production reported the highest volatility, while electricity price components and energy productivity reported the lowest volatility. At the same time, by comparing the skewness levels, it is clear enough that five variables were right-skewed, while the other three were left-skewed. In terms of kurtosis, most variables had platykurtic distributions (a metric below 3). The Jarque-Bera calculations suggest that all variables had non-normal distributions.
4.2. Correlation Analysis
Correlation analysis was conducted to detect potential biases stemming from the links between the predictors within each econometric model.
As indicated by Table 3, the highest significant correlation between two independent variables in a model was established between energy efficiency and gross electricity production (0.77), while the lowest significant correlation was set between energy efficiency and energy productivity (0.36). Since none of the correlations were above the standard cutoff value of 0.9, the conclusion was that multicollinearity would not bias the estimated results. To support this conclusion, the variance inflation factors were computed for each model (see Table 4).
Table 3.
Correlation analysis.
Table 4.
Econometric models.
4.3. Econometric Analysis
This subsection reports on the estimated results via the panel first-difference generalized method of moments (GMM).
In terms of the first econometric model investigating total energy supply (SE), the panel first-difference generalized method of moments (GMM) indicates that two of the independent variables had a significant impact on SE (99.95%): imports of electricity and derived heat, and energy productivity. Namely, if IMP decreased by one GWh, total energy supply increased by 0.08 GWh. At the same time, in the event that energy productivity was lowered by one unit, total energy supply increased by 0.46 GWh.
When using generalized method of moments estimators, which entail instrumental variables, the Hansen J-test is a tool that investigates the validity of instruments. It is also labeled as the test of “overidentifying restrictions” or the “Sargan-Hansen test”. In addition, in a panel data analysis, the Arellano–Bond metric aims at investigating whether residuals in an econometric model are serially correlated. Based on the Hansen J-statistic () and the results of the Arellano–Bond metric for AR (1) and AR (2) (see Table 4), it could be stated that the combined effect of the independent variables was statistically significant. In other words, the estimated econometric model is valid and the first research hypothesis (H1) is supported.
The second econometric model, which investigated gross domestic product, indicated that GDP was significantly influenced by independent variables (74.47%). In this sense, energy productivity and energy efficiency played the most important part, along with GEP2. Hence, when EP and EFF registered a positive trend, GDP followed the same path with increases of 5.23 units and 1.03 units, respectively. The Hansen J-statistic value () and the results of the Arellano–Bond tests for AR (1) and AR (2) support the idea that the advanced econometric model is valid from a statistical perspective.
The study also investigated the dynamic of the relationship between GDP and GEP across economies and for each economy in particular (see Figure 1 and Figure 2). The square of GEP captures the non-monotonic (non-linear) relationship between GDP and GEP. That is, a possible improvement in the conventional energy models would be to incorporate trend variations in GEP into the econometric model using a quadratic function.
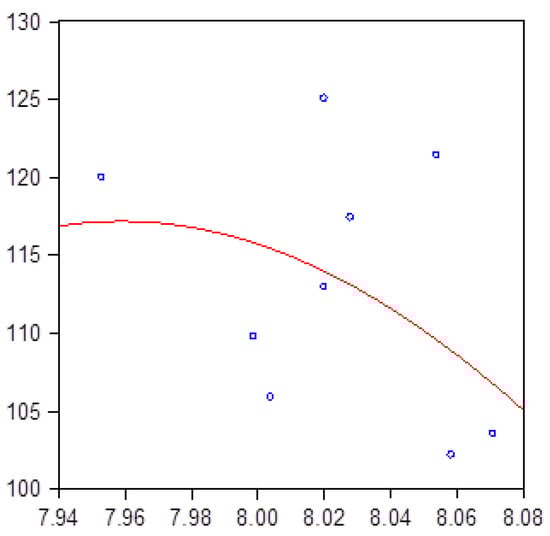
Figure 1.
The relationship between GDP and GEP across the 37 European economies.
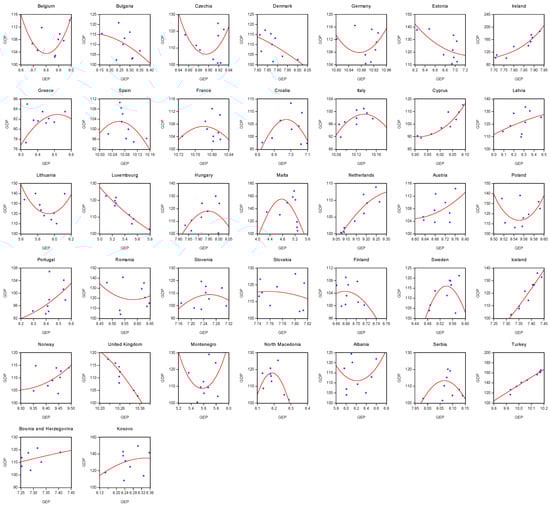
Figure 2.
The relationship between GDP and GEP at the national economy level.
Since the coefficient of GEP2 was below 0, it can be stated that the econometric estimation revealed a maximum point in the relationship between GDP and GEP. Starting from this level of gross electricity production, GDP tended to decrease until its minimum threshold of production. Hence, the second research hypothesis (H2) is supported, as displayed in the following two figures.
By analyzing Figure 2, which illustrates the connection between GEP and GDP for each economy, the following observations can be drawn:
- There is a U-shaped relationship with maximum points for the following economies: Croatia, Finland, France, Greece, Hungary, Italy, Malta, North Macedonia, Serbia, Slovenia, Spain, and Sweden;
- There is a U-shaped relationship with minimum points for the following economies: Albania, Belgium, Czechia, Germany, Lithuania, Poland, Montenegro, and Romania;
- There is a direct linear connection for the following economies: Austria, Bosnia and Herzegovina, Cyprus, Iceland, Ireland, Kosovo, Latvia, the Netherlands, Norway, Portugal, and Turkey;
- There is an indirect linear connection for the following economies: Bulgaria, Denmark, Estonia, Luxembourg, Slovakia, and the United Kingdom.
As can be noticed, the majority of countries registered a non-linear connection between gross domestic product and gross electricity production.
The third econometric model investigating gross electricity production (GEP) showed that the phenomenon was considerably influenced by the chosen predictors (99.96%). Hence, imports of electricity and derived heat, energy productivity, energy efficiency, and electricity price were relevant variables. Only IMP had a negative influence on GEP: when IMP decreased by one GWh, GEP improved by one ton of crude oil. At the same time, the impact of EP, EFF, and P was positive. Namely, if all variables improved by one unit, the overall level of GEP would follow the same trend with 148.79 units, 102.99 units, and 2512.07 units. The values of the J-statistic and Arellano–Bond tests for AR (1) and AR (2) support the idea that the econometric model is valid from a statistical standpoint. Therefore, the third research hypothesis (H3) is supported.
Last but not least, the fourth model, which focused on the electricity production capacities (CAP), indicated that, as expected, CAP was shaped by energy productivity and energy efficiency in the same fashion (99.34%). In this sense, if EP was augmented by one unit, CAP was also improved by 0.33 units. In the event that EFF increased by one unit, CAP slightly increased by 0.0005 units. Similarly to the other models, the J-statistic and tests for AR (1) and AR (2) support the validity of the econometric model.
Again, the dynamic of the relationship between CAP and GEP across economies and for each national economy was examined (see Figure 3 and Figure 4). The square of GEP captures the non-monotonic relationship between CAP and GEP. That is, a possible improvement in conventional energy models would be to incorporate trend variations in GEP into the econometric model using a quadratic function.
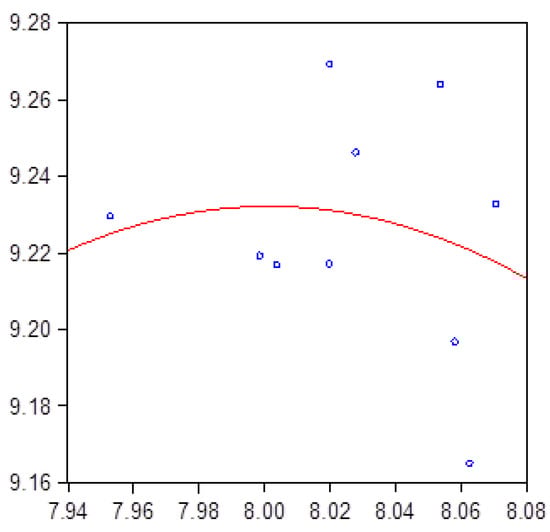
Figure 3.
The relationship between CAP and GEP across 37 European economies.
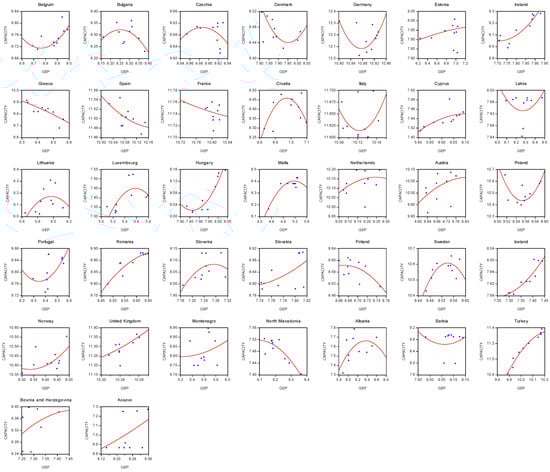
Figure 4.
The relationship between CAP and GEP at the national economy level.
Since the coefficient of GEP2 was below the 0 threshold, it can be stated that the econometric estimation revealed a maximum point in the relationship between CAP and GEP. Starting from this level of gross electricity production, CAP tended to decrease until its minimum level. The fourth research hypothesis (H4) is supported, as illustrated by the following two figures.
By analyzing Figure 4, which illustrates the connection between GEP and CAP for each national economy, the following observations can be drawn:
- There is a U-shaped relationship with maximum points for the following economies: Albania, Bulgaria, Croatia, Czechia, Lithuania, Luxembourg, Malta, Slovenia, and Sweden;
- There is a U-shaped relationship with minimum points for the following economies: Belgium, Denmark, Germany, Italy, Hungary, Latvia, Poland, Portugal, and Serbia;
- There is a direct linear connection for the following economies: Austria, Bosnia and Herzegovina, Cyprus, Estonia, Kosovo, Iceland, Ireland, Montenegro, the Netherlands, Norway, Romania, Slovakia, Turkey, and the United Kingdom;
- There is an indirect linear connection for the following economies: Finland, France, Greece, North Macedonia, and Spain.
According to Figure 4, half of the countries in the sample reported a non-linear relationship between electricity production capacities and gross electricity production.
5. Discussion and Conclusions
The energy market plays a crucial role in today’s economies because it impacts all economic and household activities [48]. For instance, when energy prices register soaring levels, the first sectors to be affected are aviation, shipping, and the chemical industry. At the same time, they also trigger second-round effects on industries such as food and hospitality [49]. Last but not least, constant changes in the energy market are reflected in the final prices of all goods and services traded at the global level.
This empirical study investigated the determinants of energy production across 37 European countries for the period of 2011–2021. The methodological approach was grounded on panel first-difference generalized method of moments (GMM), which is recommended in the literature due to the multiple benefits it entails with respect to the estimated results. Namely, GMM estimations control for endogeneity, unobserved country heterogeneity, measurement error, and omitted variable bias.
Energy production was proxied by the following variables: gross domestic product; gross electricity production; total energy supply; electricity production capacities. The set of determinants included the following variables: imports of electricity and derived heat; electricity price components for household consumers; energy productivity; energy efficiency.
EViews version 10 provided the statistical framework to test the four research hypotheses, while Eurostat provided the economic indicators for the analyzed timeframe.
The novelty of the research stems from the fact that it offers insight into energy production in a wide sample of European countries for more than a decade. The econometric estimations support the four research hypotheses and show that the chosen predictors had a significant impact on energy production. In a nutshell, the study elicited a relationship between energy supply and energy production, imports, productivity, and prices. In addition, energy production was significantly shaped by energy productivity, primary energy consumption, and energy imports.
As with any research study, the present investigation has certain limitations that need to be addressed. In the first place, the sample numbered 37 countries from Europe yet it did not include some major consumers on the continent. Future studies could enlarge the sample and also test the hypotheses in countries from different continents. Second, the timeframe spanned 11 years, starting with 2011. Upcoming research might consider expanding the period of analysis by adding at least one decade or even by including periods of energy crises. Third, the set of independent variables was focused on energy-related indicators. Other studies might broaden predictors by considering other factors that impact energy production.
The study entails a number of important lessons for policymakers. First, European public authorities should consider energy production when designing energy demand-related policies on the account that energy production can limit energy consumption while helping to conserve resources and reduce environmental degradation. Second, in order to boost GDP in the long run, governments should considerably enhance energy productivity and efficiency through innovation and technological advancement. In this sense, it is presumed that renewable energy sources will play an important part. Third, electricity production capabilities would register an ascending trend should efficiency and productivity improve.
Overall, this research study tackled a fundamental and timely topic for all business and household activities, especially within the current context of the European energy crisis. The thriving or survival of national economies across Europe will heavily depend on how decision-makers design policies by leveraging energy imports, energy prices, and energy efficiency within the sector. At the end of the day, energy can be regarded as the “fuel” that spins the wheels of national economies, and any disruptions in the energy market reverberate at all levels of an economy.
Author Contributions
Conceptualization, L.M.B.; methodology, L.M.B.; validation, H.T.; formal analysis, L.M.B.; resources, H.T.; data curation, L.M.B. and H.T.; writing—original draft preparation, L.M.B. and H.T.; writing—review and editing, L.M.B. and H.T.; visualization, L.M.B. and H.T.; project supervision, L.M.B. All authors have read and agreed to the published version of the manuscript.
Funding
This research was funded by Babeş-Bolyai University, grant number GS-UBB-FSEGA-Tulai Horia.
Data Availability Statement
Not applicable.
Conflicts of Interest
The authors declare no conflict of interest.
References
- Planete Energies. Energy Consumption and CO2 Emissions in Europe and Worldwide. Available online: https://www.planete-energies.com/en/medias/close/energy-consumption-and-co2-emissions-europe-and-worldwide (accessed on 12 September 2022).
- Sgavaratti, G.; Tagliapietra, S.; Zachmann, G. National Policies to Shield Consumers from Rising Energy Prices. Available online: https://www.bruegel.org/dataset/national-policies-shield-consumers-rising-energy-prices (accessed on 1 October 2022).
- Frodyma, K.; Papież, M.; Śmiech, S. Decoupling economic growth from fossil fuel use—Evidence from 141 countries in the 25-year perspective. Energies 2020, 13, 6671. [Google Scholar] [CrossRef]
- Majewski, S.; Mentel, U.; Salahodjaev, R.; Cierpiaɬ-Wolan, M. Electricity consumption and economic growth: Evidence from South Asian Countries. Energies 2022, 15, 1327. [Google Scholar] [CrossRef]
- Oyeleke, O.J.; Akinlo, T. Energy generation and economic growth: Empirical evidence from Nigeria. Environ. Dev. Sustain. 2020, 22, 7177–7191. [Google Scholar] [CrossRef]
- Bhuiyan, M.A.; Zhang, Q.; Khare, V.; Mikhaylov, A.; Pinter, G.; Huang, X. Renewable energy consumption and economic growth nexus—A systematic literature review. Front. Environ. Sci. 2022, 10, 878394. [Google Scholar] [CrossRef]
- Dai, L.; Jia, R.; Wang, X. Relationship between economic growth and energy consumption from the perspective of sustainable development. J. Environ. Public Health 2022, 6884273. [Google Scholar] [CrossRef] [PubMed]
- Li, R.; Leung, G.C.K. The relationship between energy prices, economic growth and renewable energy consumption: Evidence from Europe. Energy Rep. 2021, 7, 1712–1719. [Google Scholar] [CrossRef]
- Dokas, I.; Panagiotidis, M.; Papadamou, S.; Spyromitros, E. The determinants of energy and electricity consumption in developed and developing countries: International evidence. Energies 2022, 15, 2558. [Google Scholar] [CrossRef]
- Sharma, N.; Smeets, B.; Tryggestad, C. The Decoupling of GDP and Energy Growth: A CEO Guide. Available online: https://www.mckinsey.com/industries/electric-power-and-natural-gas/our-insights/the-decoupling-of-gdp-and-energy-growth-a-ceo-guide (accessed on 12 July 2022).
- Topoleswki, Ł. Relationship between energy consumption and economic growth in European countries: Evidence from dynamic panel data analysis. Energies 2021, 14, 3565. [Google Scholar] [CrossRef]
- Vasylieva, T.; Lyulyov, O.; Bilan, Y.; Streimikiene, D. Sustainable economic development and greenhouse gas emissions: The dynamic impact of renewable energy consumption, GDP, and corruption. Energies 2019, 12, 3289. [Google Scholar] [CrossRef]
- Liao, H.; Peng, Y.; Wang, F.-Z.; Zhang, T. Understanding energy use growth: The role of investment-GDP ratio. Struct. Chang. Econ. Dyn. 2022, 63, 15–24. [Google Scholar] [CrossRef]
- Abbasi, K.R.; Abbas, J.; Tufail, M. Revisiting electricity consumption, price, and real GDP: A modified sectoral level analysis from Pakistan. Energy Policy 2021, 149, 112087. [Google Scholar] [CrossRef]
- Elder, J. Canadian industry level production and energy prices. Energy Econ. 2021, 99, 105280. [Google Scholar] [CrossRef]
- Charfeddine, L.; Barkat, K. Short- and long-run asymmetric effect of oil prices and oil and gas revenues on the real GDP and economic diversification in oil-dependent economy. Energy Econ. 2020, 86, 104680. [Google Scholar] [CrossRef]
- Raggad, B. Time varying causal relationship between renewable energy consumption, oil prices and economic activity: New evidence from the United States. Resour. Policy 2021, 74, 102422. [Google Scholar] [CrossRef]
- Vural, G. Analyzing the impacts of economic growth, pollution, technological innovation and trade on renewable energy production in selected Latin American countries. Renew. Energy 2021, 171, 210–216. [Google Scholar] [CrossRef]
- Barrera-Santana, J.; Marrero, G.A.; Ramos-Real, F.J. Income, energy and the role of energy efficiency governance. Energy Econ. 2022, 108, 105882. [Google Scholar] [CrossRef]
- Mahalingam, B.; Orman, W.H. GDP and energy consumption: A panel analysis of the US. Appl. Energy 2018, 213, 208–218. [Google Scholar] [CrossRef]
- Borozan, D. Exploring the relationship between energy consumption and GDP: Evidence from Croatia. Energy Policy 2013, 59, 373–381. [Google Scholar] [CrossRef]
- Xin-gang, Z.; Shu-ran, H. Does market-based electricity price affect China’s energy efficiency? Energy Econ. 2020, 91, 104909. [Google Scholar] [CrossRef]
- Coers, R.; Sanders, M. The energy–GDP nexus; addressing an old question with new methods. Energy Econ. 2013, 36, 708–715. [Google Scholar] [CrossRef]
- Mishra, V.; Smyth, R.; Sharma, S. The energy–GDP nexus: Evidence from a panel of Pacific Island countries. Resour. Energy Econ. 2009, 31, 210–220. [Google Scholar] [CrossRef]
- Vdlovu, V.; Inglesi-Lotz, R. The causal relationship between energy and economic growth through research and development (R&D): The case of BRICS and lessons for South Africa. Energy 2020, 199, 117428. [Google Scholar]
- Cowan, W.N.; Chang, T.; Inglesi-Lotz, R.; Gupta, R. The nexus of electricity consumption, economic growth and CO2 emissions in the BRICS countries. Energy Policy 2014, 66, 359–368. [Google Scholar] [CrossRef]
- Abbas, F.; Choudhury, N. Electricity consumption–economic growth nexus: An aggregated and disaggregated causality analysis in India and Pakistan. J. Policy Model. 2013, 35, 538–553. [Google Scholar] [CrossRef]
- Wada, I. Energy production and economic growth in Saudi Arabia: Dynamic causality. Energy Sources B Econ. Plan. Policy 2017, 12, 584–590. [Google Scholar] [CrossRef]
- Szustak, G.; Dąbrowski, P.; Gradoń, W.; Szewczyk, Ł. The relationship between energy production and GDP: Evidence from selected European economies. Energies 2022, 15, 50. [Google Scholar] [CrossRef]
- Radulescu, D.; Sulger, P. Interdependencies between countries in the provision of energy. Energy Econ. 2022, 107, 105799. [Google Scholar] [CrossRef]
- Shepard, J.U.; Pratson, L.F. The myth of US energy independence. Nat. Energy 2022, 7, 462–464. [Google Scholar] [CrossRef]
- Jaeger, J.; Gonçalves, T.; Harsono, A.; Bird, L. Renewable Energy Shouldn’t Be Blamed for Spiking Energy Prices—It’s the Solution. World Resources Institute. 2022. Available online: https://www.wri.org/insights/why-renewable-energy-solution-high-prices (accessed on 1 November 2022).
- Rokicki, T.; Perkowska, A. Diversity and changes in the energy balance in EU countries. Energies 2021, 14, 1098. [Google Scholar] [CrossRef]
- Azam, A.; Rafiq, M.; Shafique, M.; Ateeq, M.; Yuan, J. Causality relationship between electricity supply and economic growth: Evidence from Pakistan. Energies 2020, 13, 837. [Google Scholar] [CrossRef]
- Bąk, I.; Tarczyńska-Łuniewska, M.; Barwińska-Małajowicz, A.; Hydzik, P.; Kusz, D. Is energy use in the EU countries moving toward sustainable development? Energies 2022, 15, 6009. [Google Scholar] [CrossRef]
- Daroń, M.; Wilk, M. Management of energy sources and the development potential in the energy production sector—A comparison of EU countries. Energies 2021, 14, 685. [Google Scholar] [CrossRef]
- Statista Database. Available online: https://www.statista.com/ (accessed on 5 September 2022).
- Enerdata. Total Energy Consumption. Available online: https://yearbook.enerdata.net/total-energy/world-consumption-statistics.html (accessed on 12 September 2022).
- European Commission. Available online: https://ec.europa.eu/eurostat (accessed on 5 September 2022).
- Limb, L. Is “Pump Tourism” A New Travel Trend? More Swiss Cars Spotted Filling up in France. Available online: https://www.euronews.com/travel/2022/08/24/is-pump-tourism-a-new-travel-trend-more-swiss-cars-spotted-filling-up-in-france (accessed on 12 September 2022).
- Batrancea, L.M.; Balcı, M.A.; Akgüller, Ö.; Gaban, L. What drives economic growth across European countries? A multimodal approach. Mathematics 2022, 10, 3660. [Google Scholar] [CrossRef]
- Stone, S.I.; Rose, R.A. Social work research and endogeneity bias. J. Soc. Soc. Work Res. 2011, 2, 54–75. [Google Scholar] [CrossRef]
- Abdallah, W.; Goergen, M.; O’Sullivan, N. Endogeneity: How failure to correct for it can cause wrong inferences and some remedies. Br. J. Manag. 2015, 26, 791–804. [Google Scholar] [CrossRef]
- Baum, C.F.; Schaffer, M.E.; Stillman, S. Instrumental variables and GMM: Estimation and testing. Stata J. 2003, 3, 1–31. [Google Scholar] [CrossRef]
- Cuicui, L.; Wooldridge, J.M. A GMM estimator asymptotically more efficient than OLS and WLS in the presence of heteroskedasticity of unknown form. Appl. Econ. Lett. 2020, 27, 997–1001. [Google Scholar]
- Baltagi, B.H. Econometrics, 4th ed.; Springer: New York, NY, USA, 2008. [Google Scholar]
- Lee, L.-F.; Yu, J. Spatial panels: Random components versus fixed effects. Int. Econ. Rev. 2012, 53, 1369–1412. [Google Scholar] [CrossRef]
- Batrancea, L.; Rus, M.-I.; Masca, E.S.; Morar, I.D. Fiscal pressure as a trigger of financial performance for the energy industry: An empirical investigation across a 16-year period. Energies 2021, 14, 3769. [Google Scholar] [CrossRef]
- van Sante, M.; Hieminga, G. The Ripple Effects of Soaring Energy Prices. Available online: https://think.ing.com/articles/the-ripple-effects-of-soaring-energy-prices (accessed on 14 September 2022).
Publisher’s Note: MDPI stays neutral with regard to jurisdictional claims in published maps and institutional affiliations. |
© 2022 by the authors. Licensee MDPI, Basel, Switzerland. This article is an open access article distributed under the terms and conditions of the Creative Commons Attribution (CC BY) license (https://creativecommons.org/licenses/by/4.0/).