Article

Financial Sector Analysis of Companies in the Energy Industry Listed on the Warsaw Stock Exchange

by
Katarzyna Goldmann
1,* and
Aleksander Zawadzki
2
1
Department of Management Accounting, Nicolaus Copernicus University in Torun, ul. Gagarina 13a, 87-100 Toruń, Poland
2
Department of Financial Accounting, Nicolaus Copernicus University in Torun, ul. Gagarina 13a, 87-100 Toruń, Poland
*
Author to whom correspondence should be addressed.
Energies 2022, 15(22), 8770; https://doi.org/10.3390/en15228770
Submission received: 29 September 2022 / Revised: 20 October 2022 / Accepted: 31 October 2022 / Published: 21 November 2022
(This article belongs to the Special Issue Energy Consumption in EU Countries)

Abstract

:
In times of the pandemic and the beginning of the energy crisis, the financial situation of enterprises operating in the energy generation sector may be a problem. This sector includes companies that generate energy in different ways and from different sources. The aim of this study is to determine the general financial situation of enterprises in the energy sector listed on the Warsaw Stock Exchange. The subject of the paper are the annual financial reports of these entities for the years 2015–2021. Tree hypotheses were formulated regarding various aspects of the financial situation of the entities under study. The following research methods were used in this paper: analysis of the literature on the subject and financial statements, and methods of descriptive statistics. The indicators of liquidity, profitability, debt and activity were calculated. The values of the maximum, minimum, median, upper and lower quartiles, the arithmetic mean, kurtosis and skewness were then calculated for each indicator. The increase in energy prices was influenced by the high rate of economic growth and the so-called post-epidemic inflation. This, in turn, was reflected in the performance of companies in the energy sector, resulting in increased profitability. The research carried out by the authors confirmed that the sector financial indicators of energy enterprises with a dominant share of private capital are concentrated closer to the average value than enterprises with a dominant share of the State Treasury. The financial situation of coal power engineering companies is more stable than that of renewable energy companies.

1. Introduction

Energy generation and transmission is one of the strategic industries, along with transportation. The development of technologies in the field of alternative energy sources allowed smaller economic entities to enter the market, along with the most often state-owned giants that produce and distribute energy. Being a member of the EU, Poland must comply with the long-term climate policy. It assumes that the following assumptions will be met by 2030 [1]:
  • Greenhouse gas emissions will be reduced by 40% compared to 1990;
  • Renewable energy will account for a minimum of 27%;
  • Energy efficiency will increase to 27%.
Energy in Poland has its main source in fossil fuels, which eliminates the possibility of access to this market for newly established enterprises, in particular from the SME sector. Table 1 shows the sources of electricity in Poland. As shown in Table 1, currently, about 88% of electricity produced in Poland comes from conventional sources based mainly on coal. Noteworthy is the almost 100% increase in energy production in the form of other renewable sources (e.g., photovoltaics) and a 54% increase in wind energy production. This is confirmed by the growing share of these sources in total production. This is due to seizing the opportunity by small businesses, mainly in the small and medium-sized enterprise sector (SME). This is evidenced by the annual growth of 1.3 percentage points in wind energy production and 1.5 percentage points from other renewable energy sources. An example is the increase in the number and total capacity of photovoltaic installations. According to data from the Energy Market Agency, at the end of January 2021, the installed photovoltaic capacity in Poland amounted to over 4.12 GW, with 1.64 GW at the end of January 2020 [2]. This means an increase in power from this energy source presented as a dynamics index of 250% year on year.
Analyzing the data on all renewable energy sources installations, this indicator was 131%, with the dynamics of installed capacity from conventional sources at the level of 104.1% [3]. According to E. Bernaciak [4], the reasons for such an increase, and at the same time the factors influencing the predictions for the renewable energy market, especially photovoltaics, are as follows:
  • Further increase in electricity prices—higher energy costs have been announced for years, which are generated, among other reasons, by the rising costs of coal-based energy;
  • Higher electricity consumption—the pandemic has caused many Poles to spend a lot of time at home, which affects their electricity bills. Energy consumption in the country is systematically growing, and regardless of the pandemic, is due to the development of the economy and technology;
  • Declines in the prices of photovoltaic components—according to the studies of the International Renewable Energy Agency, the total cost of the photovoltaic installation is decreasing year by year—from 2010 to 2019 it decreased by approx. 80%;
  • Favorable legal environment—in 2021, work is underway to reduce the licensing requirement for photovoltaic installations or expand state aid.
In 2019, coal’s share of electricity generation in Poland accounted for 74%, compared to last year’s 76%. In relative terms, the 4% decrease in coal electricity production is the smallest decline in a country with coal-fired power plants. Gas-fired electricity production grew rapidly in 2019 by as much as 12% in the EU. Last year, this fuel in Poland provided approximately 9% of energy [5]. In 2019, Poland was the fourth largest EU country in terms of energy production volume and the largest coal-based producer (74.7% against an EU average of 32.8%) [6]. In 2020, 37% of energy consumed in the EU came from renewable sources. It was an increase of 3 percentage points. The highest share of this indicator was recorded in Austria, which covered 78.2% of domestic electricity demand with renewable energy, followed by Sweden with approx. 75%. Denmark comes third with around 65% and Portugal fourth with 58%. In Croatia and Lithuania, more than half of the energy consumed in 2020 also came from renewable energy, 53% in each country. Poland, despite its 22nd ranking, met the EU regulation’s target of a 15% share of energy from renewable sources, exceeding 16% in 2020 [7]. 
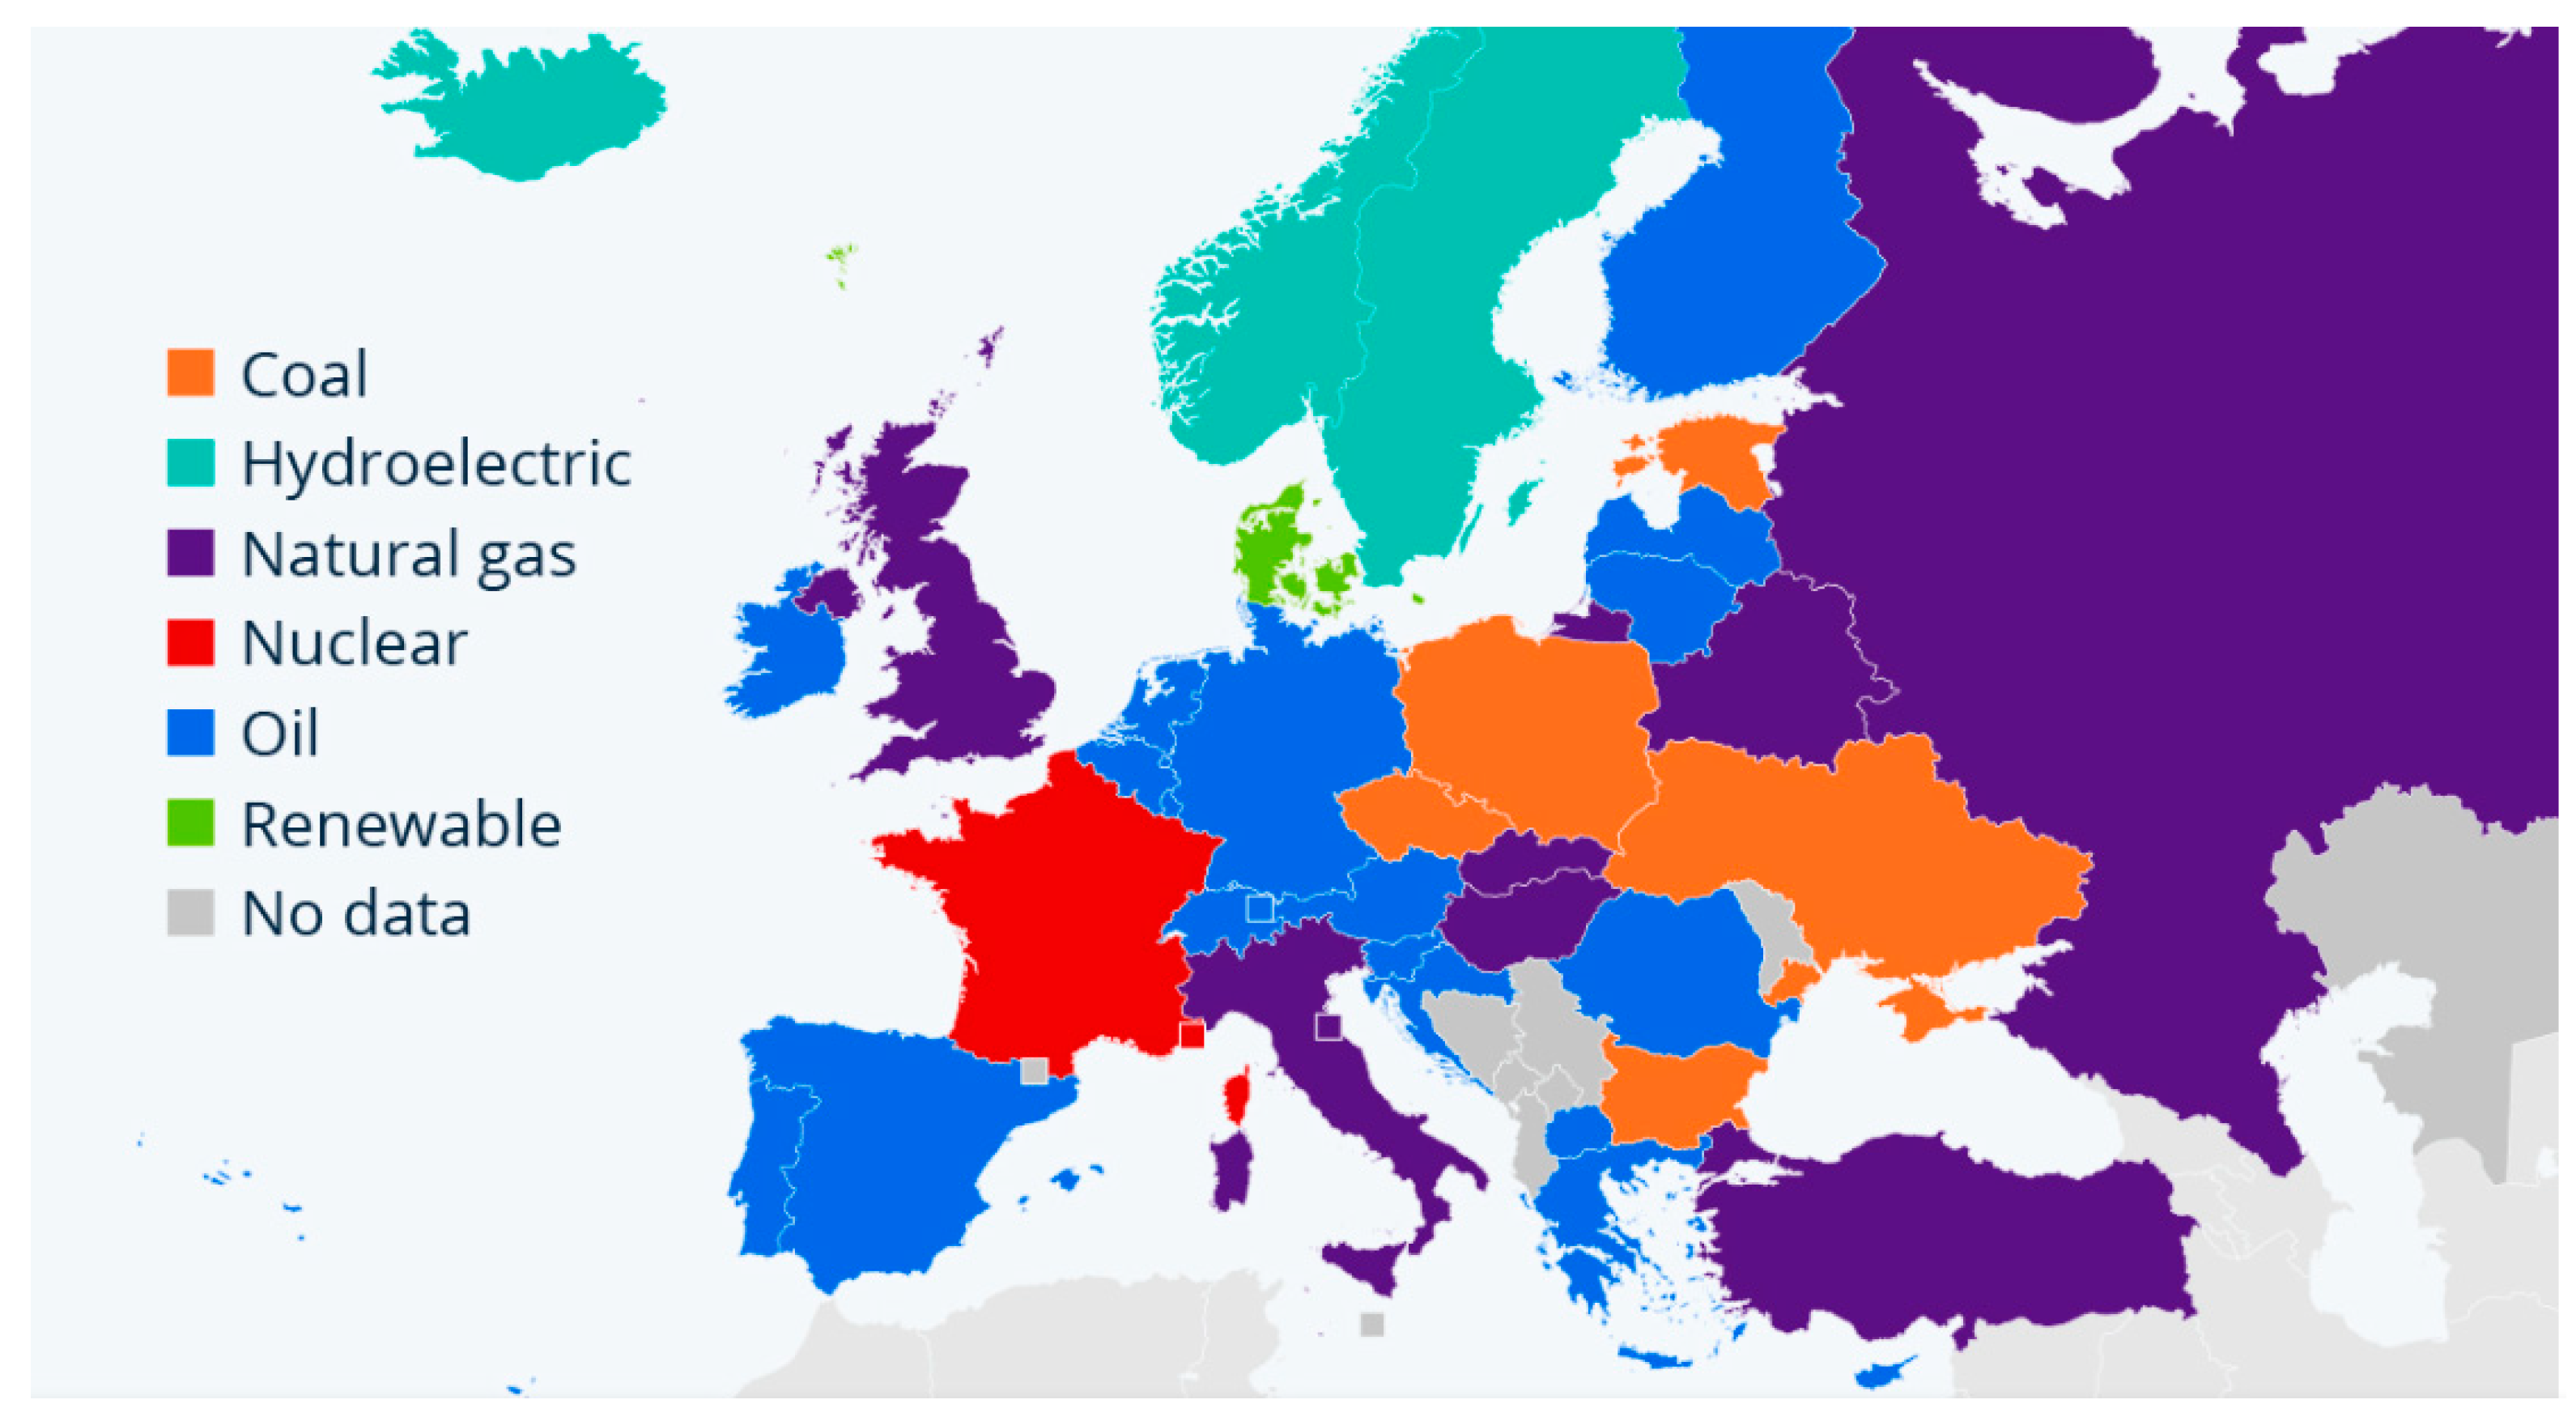
Figure 1 shows the most commonly used energy sources in Europe.
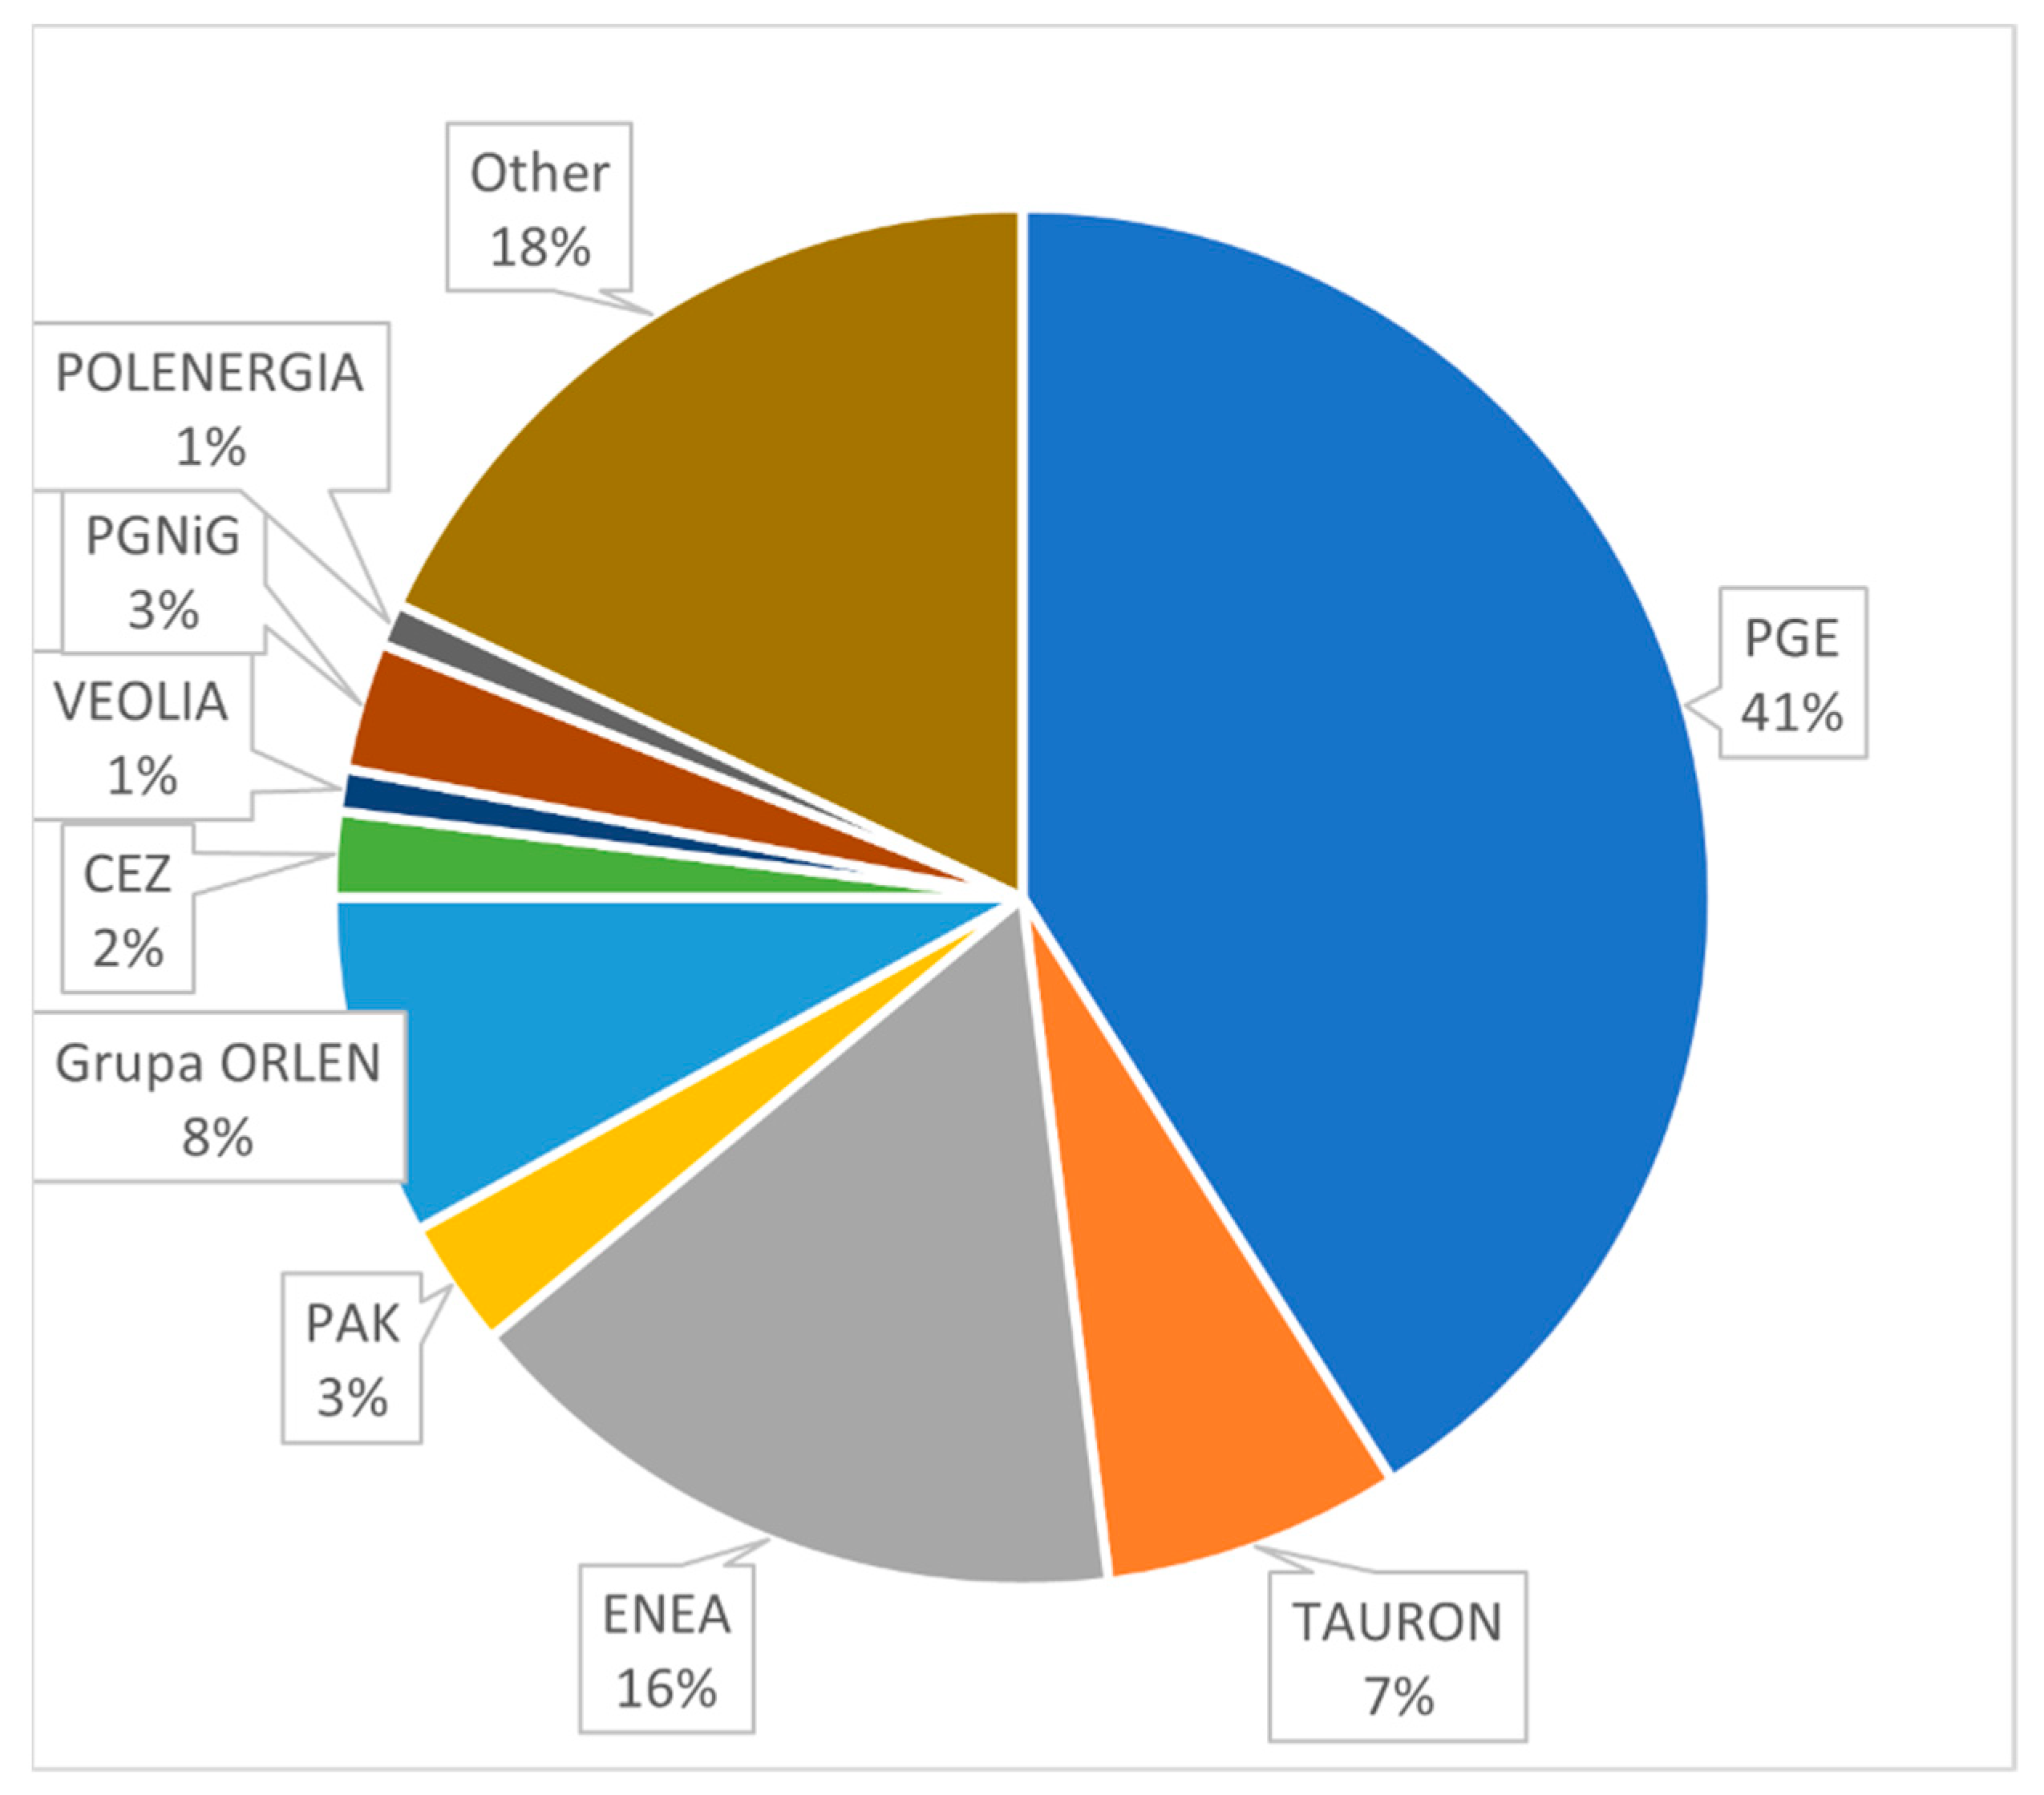
For several years, PGE Polska Grupa Energetyczna S.A. has had the largest share in the generation of electricity, with a share of about 41%. The second major player is ENEA with a 16 percent share. TAURON is in third place with 7%. Detailed data on the energy producers is presented in Figure 2.
At the end of 2020, producers in the other group accounted for about 18% of entities in the sector. Importantly, there is a downward trend in concentration in the electricity market over several years. The share of the three largest entities in the energy introduced into the grid decreased from 66.4% in 2019 to 63.8% in 2020. This is mainly due to the increase in electricity production from renewable energy sources (small, dispersed) in the national production balance of this energy [
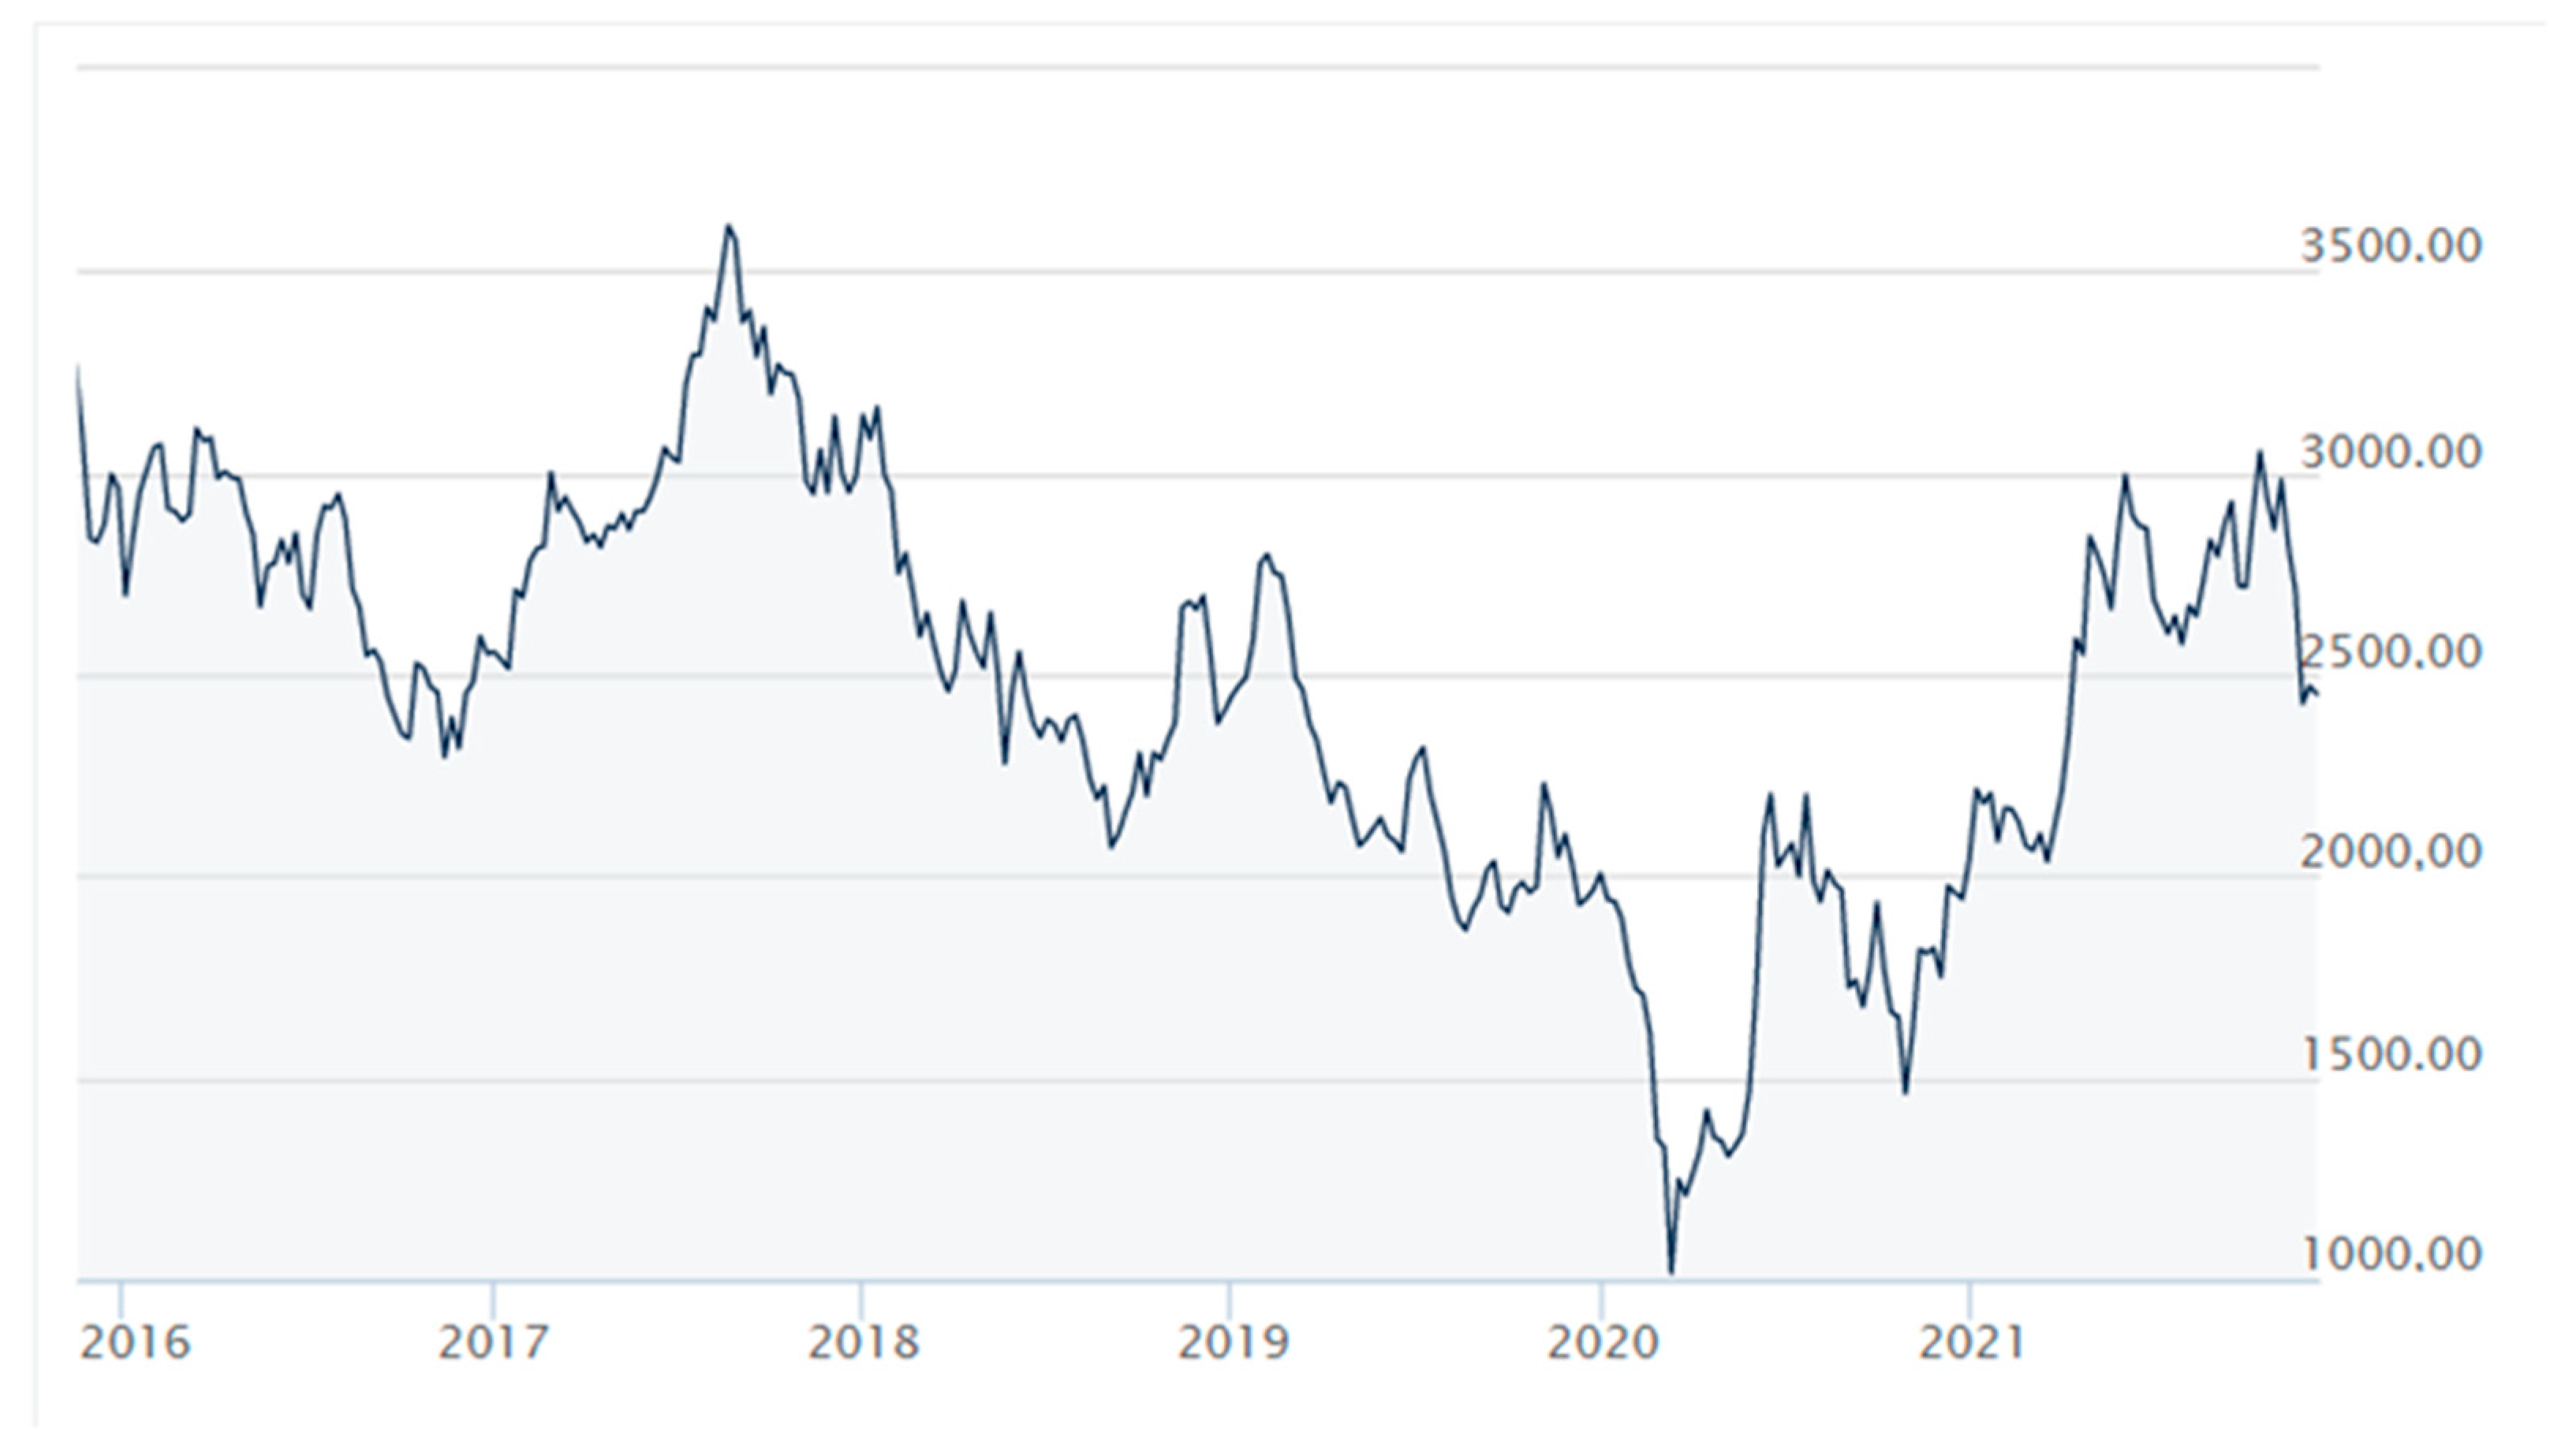
2]. This raises the question of the financial health of participants in this growing market. Does the development of the market mean that, in addition to the benefits for electricity prosumers, companies from the energy sector also benefit? A sectoral financial analysis of companies operating in the sector may provide an answer to this question. The subject of this study are enterprises listed on the Warsaw Stock Exchange S.A. (WSE) on the main and alternative market NewConnect (NC). Stock prices of companies listed on stock exchanges are some indication of their position in the market. When analyzing the prices of the WIG-Energy index included in Figure 3, it can be noticed the overall situation of the companies included in this index has improved over the past year, or rather their quotations and the turnover of their shares has improved.
The drop in the index level recorded since the second half of 2017 along with the collapse in January–June 2020, caused by the COVID-19 pandemic, is gradually being recovered from the beginning of 2021. It should be noted that the presented index includes only companies listed on the main market (without an alternative NC). It is also important that the WIG-ENERGIA includes the companies already listed in Figure 2 (CEZ, ENEA, TAURON and PGE) as well as companies from the “other” group. However, stock exchange quotations of companies do not reflect their financial situation, although the financial situation of the issuer is one of the factors influencing the interest in the shares of the issuer. Currently, there is a noticeable increase in interest among authors in the impact of the quality of customer relations on the business success of enterprises. Research results show that the use of CRM (Client Relationship Management) systems strengthens customer loyalty towards the company. This may have an impact on the company’s financial situation and share price [10]. According to Torchała [11], the recent increases in the quotations of the largest energy companies listed on the WSE are caused by the government’s announcements regarding the restructuring plan for the energy sector. They would consist, inter alia, in the recapitalization of coal power plants and the separation of the so-called coal assets that would no longer burden the operations of energy companies. According to the author, the exclusion of coal assets from companies’ assets may significantly reduce the value of their assets, which may be viewed negatively by investors. In this way, we move from the analysis of stock exchange prices to the analysis of the financial and property situation of the surveyed entities. The main purpose of this study is to assess the financial situation of Polish companies in the energy sector listed on the WSE in 2015–2021. An additional aim is to define benchmarks for this sector. Determining the indicators for this industry will allow the assessment of the entity:
  • in space, based on the actual size of other companies in the sector, or
  • using the average values in a given sector as a reference basis.
In the course of the research, the following research theses were formulated:
Hypothesis 1 (H1).
Post-pandemic economic development and rising energy prices in 2021 has contributed to the increase in profitability in the sector.
Hypothesis 2 (H2).
Sectoral financial indicators of energy enterprises with a dominant share of private capital are concentrated closer to the average than enterprises with a dominant share of the State Treasury.
Hypothesis 3 (H3).
The financial situation of enterprises in the power engineering sub-sector is more stable than that of enterprises in the renewable energy sub-sector.

2. Literature Review

The relationship between the energy markets and the stock exchange was addressed by Stoupos and Kiohos [12] among others. They analyzed the relationship between oil and gas prices and stock indicators. They demonstrated the negative impact of changes in oil and gas prices in individual markets. Due to the different nature of the Polish coal-based energy sector, these studies will not be applicable to this work. Nevrla [13] dealt with the comparative analysis of systemic risk in the financial and energy sectors of companies operating in the EU. The author noticed that in the financial sector, compared to the energy sector, there is a much higher systemic risk, with Spanish companies being the most risky. From the point of view of the entities surveyed in this article, the study by Szarzec [14] makes a significant contribution. She indicated what effects the activity of state-owned and state-controlled enterprises may have on the free market. The largest share of the State Treasury is found in Poland and Hungary. These types of companies dominate the sectors of energy production, oil and gas industry and transport. The author suggests that governments can improve the financial situation of state-owned enterprises. According to Łusiewicz [15], such a large share of the State Treasury in the energy sector is due to two reasons: ensuring energy security and the need to ensure the stable operation of the energy system.
The source of data for sectoral financial analysis are financial statements / annual reports of both listed and unlisted companies. This analysis may focus on the entity as a whole or consider only certain aspects of its activities. Examples include the studies by Wieczorek-Kosmala, Błach and Gorzeń-Mitka [16]. The authors identified factors influencing the profitability of unlisted energy companies from Hungary, Poland, Slovakia and the Czech Republic. The authors confirmed the hypothesis that there is an inverse relationship between the financial leverage and the profitability of the surveyed entities.
Zamasz [17] studied the economic and financial situation of Polish energy companies in the years 2003–2016. The analysis demonstrated that in recent years (until 2016) the profits generated from the core activities of enterprises (i.e., from the sale of electricity) decreased. However, the author did not perform a financial sector analysis based on financial indicators. Bunea, Corbos and Popescu [18] studied the indicators that had the greatest impact on the ROE of Romanian energy companies based on the Du-Pont pyramid analysis. Using a linear regression analysis based on a sample of 1253 companies, the authors determined that the asset turnover and price-to-profit ratios had the greatest impact on ROE.
One aspect of studying the annual reports of companies from the energy sector is their involvement in activities related to corporate social responsibility (CSR). The annual reports of selected Polish entities from the sector in question contain information on this aspect. Nawrocki and Szwajca [19] examined the involvement of the six largest entities in the energy sector in CSR activities. An analysis of the annual reports of these companies has led the authors to conclude that the surveyed entities have a similar approach to engaging in CSR activities and disclosures. Entities are most active in this respect in the area of contacts with customers and employees. Stuss, Makieła, Herdan and Kuźniarska [20] analyzed the annual reports of three companies listed in the WIG-ENERGIA (ENEA, PGE, TAURON) in terms of the standardization of CSR activities. The authors found that the surveyed entities use similar tools to build a CSR strategy. Piesiewicz, Ciechan-Kujawa and Kufel [21] examined the annual integrated reports for differences in disclosure between the energy sector entities and other WSE-listed entities. The authors noted significant differences in the content and quality of the information presented. Reports from companies in the energy sector are of higher quality than those from companies in other sectors. As one can see, the current studies of annual reports addresses in particular the issues of integrated reporting with a particular emphasis on corporate social responsibility. There are no studies on the financial situation of companies in the energy sector, as well as attempts to position individual entities within the sector. The method used in this study is sectoral analysis, which is an extension of financial analysis methods.
Issues of sectoral analysis are discussed primarily in monographs on analysis or strategic management. Papers on the discussed issues focus primarily on the usefulness of the sector analysis in terms of macro and microeconomics. The research is conducted across various industries and in terms of individual activities of entities listed on the WSE. A list of the available studies in the field of sectoral analysis of Polish enterprises is presented in Table 2.
As can be observed from Table 2, the research to date has not only focused on the energy sector. This paper fills the research gap in this area.

3. Materials and Methods

The subject of the research are the financial statements of companies listed on the WSE, both on the main and alternative NewConnect (NC) market. The time range covers the reports for the years 2015–2021. The basis for qualifying the company for the audit was the sector indicated for the company on the WSE website:
  • “Energy” for the main market;
  • “Renewable energy” and “Fuels and energy—other” for NC.
For the sake of consistency of data and analysis over time, in the course of qualifying companies for the study, companies that did not provide financial data for any reporting year of the period under review were rejected during the qualification of companies for the study. Table 3 presents the companies qualified for the study. The research included companies that continued to do their business operations in the years 2015–2021. The power engineering sub-sector comprises enterprises generating and/or distributing coal-based electricity. The renewable energy group includes entities both generating energy and supplying equipment for this sub-sector.
The study applies the sector analysis method. Based on the data from the financial statements, an evaluation sheet was created, into which the values necessary for the calculation of individual items of the financial statements were entered. In order to verify the hypotheses, a sector analysis was carried out in the following analytical areas:
  • In terms of financial liquidity:
  • Current liquidity ratio = current assets/short-term liabilities. Quick liquidity ratio = short-term investments + short-term receivables/short-term liabilities;
  • In terms of profitability:
  • Sales profit margin ratio = profit (loss) on sales/sales revenue. Return on sales (ROS) = net profit (loss)/sales revenue. Return on assets (ROA) = net profit (loss)/assets. Return on equity (ROE) = net profit (loss)/equity;
  • The statistical analysis of the results of the profitability ratios excluded the results of enterprises that clearly stood out from the rest, were due to missing or low values, or were mutually exclusive;
  • In terms of debt:
  • Overall debt ratio = total liabilities/assets.
  • The statistical analysis of the results of the general debt ratio excluded the results of enterprises that had a loss and negative equity;
  • In terms of operational efficiency:
  • Asset turnover ratio = sales revenues/assets.
Additionally, the ratio summarizing the general financial situation of the units was calculated based on the ratio of the capital structure ratio to the asset structure ratio.
Then, the mean values of the indicators and other measures of descriptive statistics that illustrate the distribution of the examined variable and its variability were then calculated. The parameters listed below are the statistical parameters used to present the financial ratios of the business units under study [26].
  • The median that divides the set of indicators into two equal parts; 50% of the indicators are above the median and 50% below it.
  • The arithmetic mean that summarizes all information contained in the data set and becomes the center of gravity of the observed indicators.
  • The max value is the maximum value of the indicator in the set.
  • The min value is the minimum value of the indicator in the set.
  • The top box is the width of the interval with 25% of the indicators above the middle value of the set (between the median and the upper quartile).
  • The bottom box is the width of the interval in which 25% of the indicators are below the middle value of the set (between the median and the lower quartile).
  • Mustache top is the width of the interval adjacent to the maximum, which includes 25% of indicators (leaders).
  • The mustache bottom is the width of the interval adjacent to the minimum, which includes 25% of indicators (outsiders).
  • Additionally, skewness and kurtosis were calculated.
Based on the above-mentioned statistical parameters, the position of each enterprise in the analyzed sector was determined as shown in Table 4.

4. Results

In the energy sector, financial liquidity, based on the quick ratio and the current ratio presented in Table 5 and Table 6, clearly decreased in the analyzed period of 2015–2021. A decrease in financial liquidity affects the majority of the enterprises analyzed, as evidenced by the positive values of kurtosis. Skewness in the analyzed period is right-skewed, which means that there are more entities with higher financial liquidity than the sector average in the years analyzed. The values of skewness and kurtosis for the quick liquidity index in 2021 are noteworthy, which indicates that some enterprises may have problems with quick liquidity. The median financial liquidity ratios in the sector in 2021 decreased by approximately 50% compared to 2015. The highest financial liquidity for this sector was at the beginning of the analyzed period, in 2015. Despite the fact that the financial liquidity decreased, energy enterprises, due to the specific nature of their operations and the established receivables management policy, had no problems with settling their current liabilities in this period.
Financial liquidity management is a derivative of working capital management, in particular inventory management, which for energy companies is a very important element in the energy generation process. The energy crisis had a negative impact on the ability of enterprises to liquidate assets quickly, which resulted in a reduction in both quick and current liquidity in the sector.
The assessment of profitability in the energy sector can be divided into three periods: the first period from 2015 to 2017, the second period from 2018 to 2020 and the third period: 2021. The analysis of Table 7, Table 8, Table 9 and Table 10 shows that in the first period profitability increases, in the second period profitability decreases and in the third period profitability starts to increase again. The clearly rising profitability ratios in 2021 may indicate a growing investor confidence in energy sector companies, which translates into an increase in the WIG-energy index (Figure 3).
When analyzing different areas of profitability, the profitability of sales decreases, especially in the second half of the analyzed period of 2015–2020 and, as a result, reaches its lowest values in 2020, due to the government’s freezing energy sales prices. In the last analyzed year, the result on sales in the vast majority of analyzed enterprises drops sharply, and the net result is often a loss. It is only in 2021 that a rebound in the profitability of sales can be observed, mainly due to the increase in energy prices.
The industry trend in the energy sector in terms of ROA and ROE is similar to ROS, which indicates that the net result has the greatest impact on these indicators in the analyzed years. Changes in profitability affect the majority of enterprises analyzed, as evidenced by positive values of kurtosis. The profitability of sales and assets of most of the enterprises surveyed is below average, as indicated by the negative skewness values.
The overall debt in the energy sector is growing, as shown in Table 11. In the first three analyzed years, the median debt is around 40%, and in the following three years the median of the overall debt ratio reaches around 50% and will exceed this threshold in 2021, indicating non-compliance with the Golden Funding Principle, which reduces the financial security of the analyzed companies in the sector.
The increasing trend of the energy sector debt may be partly due to the declining liquidity trend in the industry.
According to Table 12, presenting the development of the asset turnover ratio, the ability to generate income from the assets employed in the energy sector is growing. The increasing trend in the industry in terms of operational efficiency is likely to be the result of the analyzed companies freezing their investments due to the uncertain market situation and making the most of their assets, while at the same time increasing revenues related to rising energy prices. The increase in asset utilization efficiency applies to the majority of enterprises under study, as evidenced by positive values of kurtosis. Skewness in the analyzed period is right-skewed, which means that in the years under review, there are more entities that are more efficient in generating income from assets held than the sector average.
Although the median (Table 13) of the overall financial situation index shows an improvement in the financial situation of companies in the energy sector, taking into account the statistical boundary values of the index, it can be concluded that the overall financial situation of enterprises is diversified. This is probably due to the fact that the different forms of energy generation by companies in the sector (Table 1) have an impact on their different financial situation.
Changes in the overall financial situation affect the majority of the enterprises analyzed, as evidenced by positive values of kurtosis. Skewness in the analyzed period is right-skewed, which means that in the years under review there are more entities with a better financial situation than the sector average. The exception is the year 2021 with a negative skewness value, due to a negative overall financial situation indicator of the company that went bankrupt in 2022 (ELEKTROCIEPŁOWNIA BĘDZIN S.A.).
To sum up, the overall financial situation of enterprises in the energy sector deteriorated in the years 2015–2020. It starts to improve in 2021.

5. Discussion and Conclusions

The global shortage of raw materials has significantly increased energy prices worldwide. The increase in energy prices was influenced by the high rate of economic growth and the so-called post-epidemic inflation. This, in turn, was reflected in the performance of companies in the energy sector, resulting in increased profitability (H1).
The previous research on sectoral analysis, shown in Table 2, did not cover the Polish energy sector. Due to its specificity, there was no basis for comparing the performance of the energy sector to other industries.
The research carried out by the authors confirmed that the sector financial indicators of energy enterprises with a dominant share of private capital are concentrated closer to the average value than enterprises with a dominant share of the State Treasury (H2). This is indicated by the results of the kurtosis calculations (Annex A). Thus, Szarzec’s [14] theses were confirmed. State-owned enterprises are characterized by a more stable financial situation in each analytical area during the period under review. This is indicated in particular by the evolution of the median value (Appendix A). Only the years 2019–2020 are an exception here, when domestic energy production decreased and a period of pandemic occurred.
The results presented in Appendix B confirm that the financial situation of power engineering companies is more stable than that of renewable energy companies (H3). This is indicated by the median values of all sectoral financial indicators analyzed. Merely in the years 2019-2020 the sectoral profitability ratios decreased significantly.
The uncertain market situation in the energy sector in the analyzed period 2015–2021 resulted in the optimal use of assets in enterprises in the sector and a reduction in investment activity, which was reflected in the increasing efficiency of the sector’s operation.
In addition, the crisis in the energy sector is forcing companies in the sector to reclassify their activities in order to stabilize their overall financial situation. In particular, the diversity of the form of energy generation is currently very important, which is clearly noticeable in the formation of their different financial situation.
The overall financial situation of the companies in the sector under analysis depends on the share of private or state capital. State-owned companies guaranteeing the country’s energy security are characterized by a more stable financial situation. Private companies with lower economic potential are more exposed to changes in the energy market. At the same time, they operate in the renewable energy sub-sector, which is sensitive to government regulations.
The sector analysis carried out in terms of financial liquidity, profitability, debt, operational efficiency and overall financial situation did not provide grounds for rejecting the hypotheses adopted at the beginning of the study of companies in the energy sector. The situation for these enterprises in 2022 may change dramatically due to: the end of the COVID-19 pandemic, the war in Ukraine as well as the rising prices and deficit of energy resources, which is worth analyzing in the future. The research conducted was a pilot study in the field of financial sectoral analysis of the Polish energy sector, filling the research gap in this area. The limitation was to cover only entities whose shares are listed on the Polish stock exchange. According to the authors, the results presented in the article are an inspiration for further research aiming to find the determinants influencing the situation of companies in the analyzed sector.

Author Contributions

This is a collaborative project, and the authors (K.G. and A.Z.) contributed equally. All authors have read and agreed to the published version of the manuscript.

Funding

This research received no external funding.

Acknowledgments

We would like to thank three anonymous referees for their helpful commentsand suggestions.

Conflicts of Interest

The authors declare no conflict of interest.

Appendix A. Sectoral Financial Analysis of Private and State-Owned Enterprises

Table A1. Statistical parameters of the quick liquidity for state-owned enterprises in the energy sector in the years 2015–2021.
Description2015201620172018201920202021
Maximum2.165.101.531.672.782.511.20
Upper quartile1.761.971.431.221.881.210.88
Median0.981.021.120.881.100.950.74
Lower quartile0.840.830.900.870.820.750.65
Minimum0.280.710.800.340.650.630.56
Arithmetic average1.201.821.161.001.421.170.80
Skewness0.411.930.160.170.981.891.16
Kurtosis−1.313.62−2.400.25−0.393.781.06
Table A2. Statistical parameters of the quick liquidity for private enterprises in the energy sector in the years 2015–2021.
Description2015201620172018201920202021
Maximum40.0020.1314.8310.9715.4520.521.52
Upper quartile9.435.043.643.312.371.461.15
Median2.191.601.241.311.311.190.88
Lower quartile1.130.920.820.670.800.510.57
Minimum0.570.510.590.050.170.300.15
Arithmetic average8.034.123.182.692.813.170.89
Skewness1.992.292.121.692.752.54−0.12
Kurtosis3.455.864.412.398.335.54−0.83
Table A3. Statistical parameters of the current liquidity for state-owned enterprises in the energy sector in the years 2015–2021.
Description2015201620172018201920202021
Maximum2.285.152.342.012.782.511.57
Upper quartile2.072.171.741.922.141.491.06
Median1.651.601.651.461.531.240.99
Lower quartile1.191.201.190.921.010.980.71
Minimum0.330.840.860.410.730.840.63
Arithmetic average1.532.101.551.361.621.380.98
Skewness−0.761.900.10−0.390.361.550.92
Kurtosis−0.423.86−0.28−2.00−1.732.601.10
Table A4. Statistical parameters of the current liquidity for private enterprises in thein the energy sector in the years 2015–2021.
Description2015201620172018201920202021
Maximum40.0020.1514.9811.0815.5421.143.64
Upper quartile11.327.476.164.653.841.891.58
Median2.223.131.661.471.811.591.38
Lower quartile1.221.140.970.781.481.030.82
Minimum0.740.590.670.630.500.400.19
Arithmetic average8.874.913.823.153.473.691.39
Skewness1.781.841.671.372.452.491.31
Kurtosis2.723.712.770.766.715.281.88
Table A5. Statistical parameters of the profit margin of sales ratio for state-owned enterprises in the energy sector in the years 2015–2021.
Description2015201620172018201920202021
Maximum18.25%19.55%18.13%13.07%11.54%4.25%10.30%
Upper quartile11.77%11.76%13.19%12.49%5.13%3.46%9.16%
Median8.25%5.65%9.09%7.82%2.83%0.02%6.15%
Lower quartile3.28%2.78%4.55%1.40%−1.03%−5.41%3.15%
Minimum−1.41%0.71%3.40%−0.65%−13.18%−7.93%2.02%
Arithmetic average7.99%7.86%9.55%6.90%1.27%−1.04%6.16%
Skewness0.120.930.39−0.24−0.94−0.340.00
Kurtosis−0.64−0.34−1.56−2.531.59−2.32−2.94
Table A6. Statistical parameters of the profit margin of sales ratio for private enterprises in the energy sector in the years 2015–2021.
Description2015201620172018201920202021
Maximum64.46%48.24%25.69%29.69%40.74%17.57%30.28%
Upper quartile12.82%5.81%13.15%10.47%16.82%8.05%10.45%
Median4.96%0.78%6.66%5.18%6.12%1.92%0.95%
Lower quartile−12.16%−76.16%0.62%1.75%−12.99%−3.88%−11.18%
Minimum−320.51%−217.45%−556.18%−336.32%−355.36%−160.03%−59.22%
Arithmetic average−49.62%−43.63%−34.00%−24.02%−24.43%−15.73%−3.74%
Skewness−1.64−1.20−3.68−3.04−3.13−2.34−1.12
Kurtosis1.280.1413.699.5210.505.091.51
Table A7. Statistical parameters of ROS for state-owned enterprises in the energy sector in the years 2015–2021.
Description2015201620172018201920202021
Maximum25.71%24.91%49.47%19.84%7.19%6.33%7.91%
Upper quartile14.62%13.91%28.46%14.93%5.18%1.94%7.38%
Median8.86%9.33%14.18%10.25%−0.15%−1.81%5.64%
Lower quartile−13.49%2.89%9.90%6.14%−7.32%−24.63%4.03%
Minimum−37.65%−2.08%7.49%−1.77%−8.72%−54.25%1.32%
Arithmetic average0.23%9.61%21.17%9.97%−0.76%−13.43%5.33%
Skewness−0.880.511.25−0.35−0.09−1.25−0.64
Kurtosis−0.63−0.090.54−0.50−2.720.20−0.84
Table A8. Statistical parameters of ROS for private enterprises in the energy sector in the years 2015–2021.
Description2015201620172018201920202021
Maximum69.17%118.24%32.70%34.62%26.32%76.96%35.11%
Upper quartile9.83%7.62%8.21%4.43%6.45%7.73%5.06%
Median0.78%−0.91%4.64%2.18%3.71%1.01%−2.78%
Lower quartile−84.18%−82.27%−2.17%−3.37%−82.84%−27.29%−13.70%
Minimum−527.47%−439.40%−345.18%−400.18%−397.60%−92.71%−126.81%
Arithmetic average−63.33%−53.21%−18.79%−44.77%−55.31%−9.61%−12.83%
Skewness−2.54−1.88−3.66−2.35−2.15−0.23−1.99
Kurtosis7.074.4213.584.384.691.464.08
Table A9. Statistical parameters of ROA for state-owned enterprises in the energy sector in the years 2015–2021.
Description2015201620172018201920202021
Maximum7.94%8.63%9.16%5.79%2.06%3.23%4.85%
Upper quartile4.53%3.54%7.53%4.19%1.37%0.58%4.54%
Median3.94%2.86%4.81%3.31%−0.19%−1.14%3.11%
Lower quartile−4.12%1.17%3.21%1.91%−2.25%−9.94%1.07%
Minimum−13.05%−0.60%2.82%−0.40%−4.77%−17.22%−0.08%
Arithmetic average0.12%3.02%5.45%2.99%−0.69%−4.67%2.73%
Skewness−1.071.100.48−0.49−0.59−0.91−0.27
Kurtosis−0.331.89−1.96−0.05−1.17−1.07−2.49
Table A10. Statistical parameters of ROA for private enterprises in the energy sector in the years 2015–2021.
Description2015201620172018201920202021
Maximum61.26%17.90%18.53%18.55%27.12%24.30%25.63%
Upper quartile9.22%3.47%2.91%2.82%6.31%2.85%3.73%
Median0.04%−0.60%0.58%0.57%0.08%0.91%−0.65%
Lower quartile−3.40%−3.40%−0.25%−1.39%−10.24%−5.22%−6.40%
Minimum−57.22%−91.39%−25.30%−14.59%−272.57%−19.36%−106.86%
Arithmetic average2.79%−5.45%0.43%0.98%−18.76%0.03%−5.97%
Skewness0.01−3.38−1.400.45−3.630.59−3.00
Kurtosis3.8512.486.924.2313.682.5210.67
Table A11. Statistical parameters of ROE for state-owned enterprises in the energy sector in the years 2015–2021.
Description2015201620172018201920202021
Maximum10.77%10.87%14.36%11.20%5.78%4.47%11.98%
Upper quartile9.07%5.71%10.79%6.76%2.03%1.75%9.34%
Median6.48%5.14%7.96%5.47%−0.64%−2.55%5.80%
Lower quartile−6.82%2.40%7.43%4.72%−3.30%−25.47%2.35%
Minimum−20.82%−1.01%4.92%−0.52%−10.81%−33.14%−0.55%
Arithmetic average0.26%4.59%9.03%5.55%−1.26%−10.62%5.79%
Skewness−1.130.230.70−0.21−0.71−0.83−0.03
Kurtosis−0.460.59−0.121.660.46−1.90−1.94
Table A12. Statistical parameters of ROE for private enterprises in the energy sector in the years 2015–2021.
Description2015201620172018201920202021
Maximum75.28%48.66%148.74%444.75%101.50%68.50%56.86%
Upper quartile21.79%8.77%5.46%5.54%11.47%7.05%10.37%
Median0.04%−0.62%0.60%1.07%0.13%2.58%0.24%
Lower quartile−6.54%−7.23%−0.39%−1.97%−15.81%−0.66%−16.11%
Minimum−111.42%−99.61%−36.96%−21.53%−295.27%−42.83%−122.12%
Arithmetic average6.68%−3.31%9.46%29.48%−20.47%4.95%−11.54%
Skewness−0.96−2.173.283.82−2.120.92−1.03
Kurtosis3.378.1412.2414.735.341.850.89
Table A13. Statistical parameters of the general debt ratio for state-owned enterprises in the energy sector in the years 2015–2021.
Description2015201620172018201920202021
Maximum0.560.590.600.670.640.670.86
Upper quartile0.490.500.520.510.550.600.58
Median0.380.400.430.450.480.520.55
Lower quartile0.290.270.260.290.300.330.48
Minimum0.150.210.200.190.220.270.46
Arithmetic average0.380.390.400.420.440.480.58
Skewness−0.30−0.08−0.31−0.09−0.41−0.431.79
Kurtosis−0.91−1.59−1.75−0.98−1.60−1.903.59
Table A14. Statistical parameters of the general debt ratio for private enterprises in the energy sector in the years 2015–2021.
Description2015201620172018201920202021
Maximum0.810.790.880.960.860.842.09
Upper quartile0.630.600.640.680.730.560.79
Median0.490.390.360.590.410.500.60
Lower quartile0.040.060.210.260.330.460.42
Minimum0.010.020.010.020.020.000.08
Arithmetic average0.370.350.390.480.470.490.64
Skewness−0.010.170.31−0.20−0.25−0.721.95
Kurtosis−1.89−1.66−1.07−1.09−1.110.586.02
Table A15. Statistical parameters of the asset turnover ratio for state-owned enterprises in the energy sector in the years 2015–2021.
Description2015201620172018201920202021
Maximum0.590.540.500.480.550.640.68
Upper quartile0.350.340.330.320.360.480.65
Median0.330.310.290.270.330.380.64
Lower quartile0.310.290.250.230.290.330.52
Minimum0.280.240.190.200.210.300.18
Arithmetic average0.360.340.310.300.340.420.55
Skewness2.161.871.161.391.201.06−1.88
Kurtosis4.984.011.891.992.440.163.44
Table A16. Statistical parameters of the asset turnover ratio for private enterprises in the energy sector in the years 2015–2021.
Description2015201620172018201920202021
Maximum2.763.463.704.674.873.255.74
Upper quartile0.410.320.510.731.240.891.20
Median0.140.150.200.470.480.450.68
Lower quartile0.040.040.080.060.080.130.26
Minimum0.000.000.000.000.000.010.01
Arithmetic average0.390.440.520.730.910.761.03
Skewness3.063.303.263.092.441.873.04
Kurtosis10.2511.6111.4710.636.872.8510.37
Table A17. Statistical parameters of the overall financial situation indicator for state-owned enterprises in the energy sector in the years 2015–2021.
Description2015201620172018201920202021
Maximum0.650.700.881.010.921.002.06
Upper quartile0.520.450.380.380.600.781.70
Median0.320.290.290.280.360.251.17
Lower quartile0.210.220.200.230.220.191.01
Minimum0.110.100.140.090.120.110.49
Arithmetic average0.360.350.360.380.440.451.29
Skewness0.400.861.831.910.770.910.15
Kurtosis−1.550.173.654.12−0.56−1.83−0.90
Table A18. Statistical parameters of the overall financial situation indicator for private enterprises in the energy sector in the years 2015–2021.
Description2015201620172018201920202021
Maximum26.0732.2519.2114.7529.0016.491.43
Upper quartile4.243.472.652.682.631.801.00
Median0.692.370.600.430.890.580.88
Lower quartile0.200.230.170.380.420.240.47
Minimum0.050.060.070.080.10−0.94−9.71
Arithmetic average4.425.573.512.733.531.820.11
Skewness2.352.252.072.073.393.52−3.77
Kurtosis5.785.083.384.0412.0913.0314.43

Appendix B. Sectoral Financial Analysis of Power Engineering (PE) and Renewable Energy (RE) Sub-Sectors

Table A19. Statistical parameters of the quick liquidity for PE sub-sector in the years 2015–2021.
Description2015201620172018201920202021
Maximum2.165.101.531.672.782.511.41
Upper quartile1.381.141.201.151.881.361.03
Median0.980.960.930.870.921.070.84
Lower quartile0.840.810.820.660.810.750.65
Minimum0.280.510.590.340.340.300.15
Arithmetic average1.141.441.010.911.291.160.84
Skewness0.552.570.650.630.871.00−0.32
Kurtosis−0.306.86−0.720.01−0.521.200.46
Table A20. Statistical parameters of the quick liquidity for RE sub-sector in the years 2015–2021.
Description2015201620172018201920202021
Maximum40.0020.1314.8310.9715.4520.521.52
Upper quartile13.507.445.055.253.951.421.15
Median4.273.192.172.421.981.190.87
Lower quartile1.991.431.051.010.940.510.57
Minimum0.590.630.760.050.170.370.35
Arithmetic average10.575.304.053.383.443.910.89
Skewness1.571.931.711.252.332.060.32
Kurtosis1.764.212.680.975.903.11−0.99
Table A21. Statistical parameters of the current liquidity for PE sub-sector in the years 2015–2021.
Description2015201620172018201920202021
Maximum2.285.152.342.012.782.511.57
Upper quartile1.911.651.681.742.141.511.06
Median1.321.171.050.961.041.261.03
Lower quartile1.091.020.890.760.970.980.71
Minimum0.330.590.670.410.500.400.19
Arithmetic average1.381.651.271.171.471.320.96
Skewness−0.082.440.800.510.550.62−0.37
Kurtosis−0.616.48−0.26−1.37−1.400.880.47
Table A22. Statistical parameters of the current liquidity for RE subsector in the years 2015–2021.
Description2015201620172018201920202021
Maximum40.0020.1514.9811.0815.5421.143.64
Upper quartile15.218.866.346.865.612.421.64
Median8.813.873.952.682.571.621.47
Lower quartile2.022.621.471.331.571.120.84
Minimum0.770.890.920.631.430.750.47
Arithmetic average11.676.344.893.974.294.591.56
Skewness1.381.561.330.922.132.021.15
Kurtosis1.342.751.78−0.404.952.910.91
Table A23. Statistical parameters of the profit margin of sales ratio for PE sub-sector in the years 2015–2021.
Description2015201620172018201920202021
Maximum18.55%24.01%18.13%13.07%11.54%8.75%10.30%
Upper quartile12.34%11.76%13.19%10.34%5.91%4.12%9.16%
Median8.25%5.50%6.19%4.94%4.74%0.63%5.02%
Lower quartile2.89%3.87%4.44%0.86%−1.03%−5.41%2.28%
Minimum−3.65%0.71%2.86%−8.21%−22.31%−42.90%−36.08%
Arithmetic average8.00%8.58%8.89%4.93%0.29%−3.44%−0.58%
Skewness−0.071.200.63−0.55−1.48−2.40−1.78
Kurtosis−1.050.26−1.31−0.021.656.532.15
Table A24. Statistical parameters of the profit margin of sales ratio for RE sub-sector in the years 2015–2021.
Description2015201620172018201920202021
Maximum64.46%48.24%25.69%29.69%40.74%17.57%30.28%
Upper quartile11.24%1.67%13.15%13.07%23.75%9.76%12.50%
Median−0.19%−31.11%7.33%5.77%7.96%1.92%0.95%
Lower quartile−148.96%−131.67%−6.34%1.75%−17.31%−3.88%−3.56%
Minimum−320.51%−217.45%−556.18%−336.32%−355.36%−160.03%−59.22%
Arithmetic average−72.67%−64.95%−50.76%−33.49%−32.89%−18.89%−1.21%
Skewness−1.12−0.66−3.11−2.55−2.66−2.11−1.58
Kurtosis−0.49−1.079.766.487.413.673.92
Table A25. Statistical parameters of ROS for PE sub-sector in the years 2015–2021.
Description2015201620172018201920202021
Maximum25.71%24.91%49.47%19.84%7.19%7.47%8.44%
Upper quartile10.05%11.14%15.78%11.77%5.22%5.23%7.38%
Median8.27%7.66%8.52%4.88%0.40%−1.81%4.33%
Lower quartile−14.82%2.37%6.36%0.42%−7.32%−26.21%1.97%
Minimum−98.50%−3.72%−3.17%−5.28%−47.10%−54.25%−86.22%
Arithmetic average−7.59%7.74%14.20%6.00%−4.52%−12.00%−5.45%
Skewness−1.970.641.590.45−2.40−1.06−2.92
Kurtosis4.050.772.35−0.766.48−0.438.75
Table A26. Statistical parameters of ROS for RE sub-sector in the years 2015–2021.
Description2015201620172018201920202021
Maximum69.17%118.24%32.70%34.62%26.32%76.96%35.11%
Upper quartile9.83%5.12%10.53%11.78%10.68%9.35%3.71%
Median−13.28%−36.55%3.19%3.10%3.71%1.01%−2.78%
Lower quartile−84.18%−131.46%−2.98%−3.06%−123.54%−27.29%−11.57%
Minimum−527.47%−439.40%−345.18%−400.18%−397.60%−92.71%−126.81%
Arithmetic average−82.90%−76.47%−27.80%−62.69%−71.74%−9.53%−9.63%
Skewness−2.12−1.36−3.09−1.84−1.72−0.20−2.46
Kurtosis4.682.449.681.942.660.967.43
Table A27. Statistical parameters of ROA for PE sub-sector in the years 2015–2021.
Description2015201620172018201920202021
Maximum27.80%17.90%18.53%18.55%27.12%24.30%20.31%
Upper quartile4.53%4.69%7.53%4.19%1.90%2.62%4.78%
Median2.76%3.04%3.79%2.33%−0.19%−1.14%3.11%
Lower quartile−4.46%1.17%2.87%0.19%−2.45%−11.24%0.15%
Minimum−57.22%−3.75%−3.29%−3.00%−22.52%−19.36%−106.86%
Arithmetic average−2.46%4.00%5.38%3.40%0.25%−2.68%−7.37%
Skewness−1.791.481.182.080.600.79−2.91
Kurtosis4.983.262.825.423.861.408.89
Table A28. Statistical parameters of ROA for RE sub-sector in the years 2015–2021.
Description2015201620172018201920202021
Maximum61.26%5.86%4.48%6.68%10.80%10.91%25.63%
Upper quartile8.37%1.26%1.33%2.82%5.06%2.15%1.37%
Median−1.91%−1.24%0.35%1.00%0.08%0.91%−0.65%
Lower quartile−3.40%−4.22%−0.25%−1.39%−9.33%−2.81%−3.01%
Minimum−9.71%−91.39%−25.30%−14.59%−272.57%−10.02%−16.22%
Arithmetic average6.11%−9.42%−1.33%−0.13%−26.18%−0.07%0.05%
Skewness2.38−3.13−3.05−1.85−3.200.101.22
Kurtosis6.1610.089.814.7810.431.233.61
Table A29. Statistical parameters of ROE for PE sub-sector in the years 2015–2021.
Description2015201620172018201920202021
Maximum75.28%48.66%148.74%444.75%101.50%48.90%51.07%
Upper quartile10.34%10.36%10.82%6.76%4.86%4.47%11.98%
Median6.48%5.70%7.96%4.97%−0.64%−0.03%8.36%
Lower quartile−6.94%2.40%6.33%0.63%−3.53%−14.28%2.05%
Minimum−111.42%−8.81%−7.43%−4.82%−160.49%−33.14%−60.42%
Arithmetic average−1.91%8.87%20.99%47.51%−6.17%−2.37%4.84%
Skewness−1.222.183.073.16−1.330.86−1.17
Kurtosis4.436.159.589.975.261.864.11
Table A30. Statistical parameters of ROE for RE sub-sector in the years 2015–2021.
Description2015201620172018201920202021
Maximum62.89%11.04%17.01%17.42%47.93%68.50%56.86%
Upper quartile16.74%2.31%1.94%5.54%9.49%4.18%4.79%
Median−2.17%−2.01%0.35%1.07%0.13%2.02%−0.72%
Lower quartile−6.54%−8.27%−0.39%−1.97%−14.98%−0.56%−14.79%
Minimum−10.16%−99.61%−36.96%−21.53%−295.27%−42.83%−122.12%
Arithmetic average11.00%−10.08%−1.25%0.03%−22.99%2.20%−15.49%
Skewness1.38−2.97−2.20−0.72−2.951.18−1.25
Kurtosis0.299.347.120.429.314.121.54
Table A31. Statistical parameters of the general debt ratio for PE sub-sector in the years 2015–2021.
Description2015201620172018201920202021
Maximum0.810.790.880.960.860.672.09
Upper quartile0.560.590.590.650.620.560.80
Median0.500.480.490.500.500.500.60
Lower quartile0.380.400.380.390.380.480.54
Minimum0.150.210.200.190.220.270.46
Arithmetic average0.470.480.500.520.510.490.77
Skewness−0.04−0.040.280.390.25−0.692.71
Kurtosis0.18−0.40−0.44−0.06−0.50−0.227.84
Table A32. Statistical parameters of the general debt ratio for RE sub-sector in the years 2015–2021.
Description2015201620172018201920202021
Maximum0.720.730.740.850.770.840.88
Upper quartile0.560.430.400.630.690.700.69
Median0.080.080.250.390.410.490.58
Lower quartile0.030.040.120.150.200.400.26
Minimum0.010.020.010.020.020.000.08
Arithmetic average0.270.260.300.410.420.480.50
Skewness0.650.890.73−0.03−0.10−0.60−0.29
Kurtosis−1.64−0.74−0.24−1.54−1.43−0.37−1.26
Table A33. Statistical parameters of the asset turnover ratio for PE sub-sector in the years 2015–2021.
Description2015201620172018201920202021
Maximum2.763.463.704.674.873.255.74
Upper quartile0.580.600.590.550.680.630.77
Median0.340.330.330.320.420.480.67
Lower quartile0.310.290.270.270.310.370.63
Minimum0.230.240.190.200.210.300.18
Arithmetic average0.660.740.750.850.920.761.15
Skewness2.812.852.862.952.993.003.06
Kurtosis8.248.438.488.909.159.259.52
Table A34. Statistical parameters of the asset turnover ratio for RE sub-sector in the years 2015–2021.
Description2015201620172018201920202021
Maximum0.630.370.701.322.122.741.61
Upper quartile0.180.180.260.701.020.781.10
Median0.050.100.150.190.220.180.33
Lower quartile0.030.030.040.040.070.060.23
Minimum0.000.000.000.000.000.010.01
Arithmetic average0.130.120.190.390.600.570.65
Skewness2.271.141.541.021.192.140.81
Kurtosis5.790.882.460.430.074.98−1.08
Table A35. Statistical parameters of the overall financial situation indicator for PE sub-sector in the years 2015–2021.
Description2015201620172018201920202021
Maximum0.700.700.881.010.922.152.06
Upper quartile0.520.450.330.400.620.891.39
Median0.270.250.240.280.420.281.02
Lower quartile0.190.210.150.180.220.190.65
Minimum0.110.100.140.080.10−0.01−9.71
Arithmetic average0.340.320.300.330.450.590.09
Skewness0.720.892.312.030.411.73−3.04
Kurtosis−1.13−0.186.035.18−1.133.249.44
Table A36. Statistical parameters of the overall financial situation indicator for RE sub-sector in the years 2015–2021.
Description2015201620172018201920202021
Maximum26.0732.2519.2114.7529.0016.491.36
Upper quartile9.8912.025.375.003.351.951.00
Median2.382.931.881.851.570.580.88
Lower quartile0.532.340.570.420.690.280.47
Minimum0.050.060.070.100.11−0.940.32
Arithmetic average6.477.694.833.634.652.200.77
Skewness1.811.821.601.662.913.050.13
Kurtosis3.343.101.342.298.869.70−1.25

References

  1. Bartosik, M.; Kamrat, W.; Kaźmierkowski, M.; Lewandowski, W.; Pawlik, M.; Peryt, T.; Skoczkowski, T.; Strupczewski, A.; Szeląg, A. Polityka i porządek prawny w polskiej energetyce na polityki Unii Europejskiej. Przegląd Elektrotechniczny 2016, 9, 288. [Google Scholar] [CrossRef]
  2. Mikołajuk, H.; Zatorska, M.; Stępniak, E.; Wrońska, I. Informacja Statystyczna o Energii Elektrycznej; Biuletyn miesięczny; Nr 1(325)Styczeń Agencja Rynku Energii S.A.: Warsaw, Poland, 2021; p. 12. [Google Scholar]
  3. Rynekelektryczny.pl. Available online: https://www.rynekelektryczny.pl/produkcja-energii-elektrycznej-w-polsce/ (accessed on 16 September 2021).
  4. Bernaciak, E. Fotowoltaika 2021—Nowe Przepisy. Co się Zmieniło? Enerad.pl. Available online: https://enerad.pl/aktualnosci/fotowoltaika-2021/ (accessed on 16 September 2021).
  5. Skłodowska, M. Produkcja Energii Elektrycznej z Węgla w Europie ostro Hamuje. Available online: https://wysokienapiecie.pl/26386-produkcja-energii-elektrycznej-z-wegla-w-europie-ostro-hamuje/ (accessed on 18 October 2022).
  6. Struktura Produkcji Energii w Polsce i Pozostałych Krajach UE. Available online: https://www.locja.pl/raport-rynkowy/struktura-produkcji-energii-w-polsce-i-pozostalych-krajach-ue,198 (accessed on 18 October 2022).
  7. Eurostat: W UE już 37% Energii Pochodzi z Odnawialnych Źródeł. Available online: https://e-magazyny.pl/zielone-wiadomosci/eurostat-w-ue-juz-37-energii-pochodzi-z-odnawialnych-zrodel/ (accessed on 18 October 2022).
  8. Patyk, A. Źródła Energii w Europie. Gdzie Dominuje OZE, a Gdzie Gaz? Available online: https://obserwatorgospodarczy.pl/2022/10/15/zrodla-energii-w-europie-gdzie-dominuje-oze-a-gdzie-gaz-mapa/ (accessed on 18 October 2022).
  9. Bankier.pl—Portal Fiansowy. Available online: https://www.bankier.pl/inwestowanie/profile/quote.html?symbol=WIG-ENERG (accessed on 12 September 2022).
  10. Guerola-Navarro, V.; Gil-Gomez, H.; Oltra-Badenes, R.; Sendra-García, H. Customer relationship management and its impact on innovation: A literature review. J. Bus. Res. 2021, 129, 83–87. [Google Scholar] [CrossRef]
  11. Torchała, A. Mocne Wzrosty Spółek Energetycznych. Inwestorzy Uwierzyli Ministrowi Sasinowi. Available online: https://www.bankier.pl/wiadomosc/Mocne-wzrosty-energetyki-Inwestorzy-uwierzyli-Sasinowi-8091030.html (accessed on 16 September 2021).
  12. Stoupos, N.; Kiohos, A. Energy commodities and advanced stock markets: A post-crisis approach. Resour. Policy 2021, 70, 101887. [Google Scholar] [CrossRef]
  13. Nevrla, M. Systemic risk in European financial and energy sectors: Dynamic factor copula approach. Econ. Syst. 2020, 44, 100820. [Google Scholar] [CrossRef]
  14. Szarzec, K. Własność państwowa a wolny rynek—Przykład krajów Europy środkowo—Wschodniej. Studia Ekon. Zesz. Nauk. Uniw. Ekon. Katowicach 2018, 349, 239. [Google Scholar]
  15. Łusiewicz, W. Bezpieczeństwo energetyczne a własność państwowa. Zesz. Nauk. Pol. Tow. Ekon. Zielonej Górze 2018, 9, 135. [Google Scholar] [CrossRef]
  16. Wieczorek-Kosmala, M.; Błach, J.; Gorzeń-Mitka, I. Does Capital Structure Drive Profitability in the Energy Sector? Energies 2021, 14, 4803. [Google Scholar] [CrossRef]
  17. Zamasz, K. Energy company in a competitive energy market. Energy Policy J. 2018, 21, 46. [Google Scholar] [CrossRef]
  18. Bunea, O.-I.; Corbos, R.-A.; Popescu, R.-I. Influence of some financial indicators on return on equity ratio in the Romanian energy sector—A competitive approach using a DuPont-based analysis. Energy 2019, 189, 116251. [Google Scholar] [CrossRef]
  19. Nawrocki, T.L.; Szwajca, D. A Multidimensional Comparative Analysis of Involvement in CSR Activities of Energy Companies in the Context of Sustainable Development Challenges: Evidence from Poland. Energies 2021, 14, 4592. [Google Scholar] [CrossRef]
  20. Stuss, M.M.; Makieła, Z.J.; Herdan, A.; Kuźniarska, G. The Corporate Social Responsibility of Polish Energy Companies. Energies 2021, 14, 3815. [Google Scholar] [CrossRef]
  21. Piesiewicz, M.; Ciechan-Kujawa, M.; Kufel, P. Differences in Disclosure of Integrated Reports at Energy and Non-Energy Companies. Energies 2021, 14, 1253. [Google Scholar] [CrossRef]
  22. Bieniasz, A.; Gołaś, Z. Sektorowe zróżnicowanie płynności finansowej przedsiębiorstw w Polsce. J. Agribus. Rural Dev. 2008, 2, 13–24. [Google Scholar]
  23. Mosiejko, L.; Bernadelii, M.; Sierant, A. Płynność Finansowa Spółek Notowanych na Giełdzie Papierów Wartościowych w Warszawie SA w Latach 2002–2017 w Ujęciu Sektorowym—Część 1; Studia i Prace Kolegium Zarządzania i Finansów; 173/2019; Oficyna Wydawnicza SGH: Warsaw, Poland, 2019; pp. 9–27. [Google Scholar]
  24. Figura, P. Sektorowe zróżnicowanie płynności finansowej przedsiębiorstw. Zarządzanie Finans. 2013, 1, 55–72. [Google Scholar]
  25. Gostkowska-Drzewicka, M.; Majerowska, E. Przynależność sektorowa a wyniki spółek notowanych na GPW w Warszawie (Industry effect vs. profitability: Evidence from companies listed on WSE). Prace Nauk. Uniw. Ekon. Wrocławiu. 2018, 531, 139–148. [Google Scholar] [CrossRef]
  26. Goldmann, K.; Zawadzki, A. Sectoral analysis of companies in the electronic games industry listed in Warsaw Stock Exchange. Eur. Res. Stud. J. 2020, 13, 1044–1056. [Google Scholar] [CrossRef]
  27. Dudycz, T.; Skoczylas, W. Wskaźniki sektorowe za rok 2012. Rachunkowość 2014, 3, 55–80. [Google Scholar]
Figure 1. The most commonly used energy sources in Europe [8].
Energies 15 08770 g001
Figure 2. Share of entities (capital groups) in the volume of electricity introduced to the grid in 2020 [2].
Energies 15 08770 g002
Figure 3. WIG-energy index quotations over the years 2016–2021 [9].
Energies 15 08770 g003
Table 1. Electricity production in Poland in 2020 and 2021 [3].
DescriptionAugust 2020August 2021August 2020August 2021
GWhShare in Total Production (%)
Total production11,401.0014,049.00100.0%100.0%
Professional power plants10,508.0012,549.0092.2%89.3%
Hydropower plants155.00211.001.4%1.5%
Thermal power plants10,353.0012,338.0090.8%87.8%
Hard coal5942.007167.0052.1%51.0%
Lignite3444.004202.0030.2%29.9%
Gas968.00970.008.5%6.9%
Other renewable power plants283.00563.002.5%4.0%
Wind power plants610.00937.005.4%6.7%
Table 2. Research on sectoral analysis of Polish enterprises.
AuthorThe Scope of the StudyConclusions
Bieniasz and Gołaś [22]Analysis of the diversification of financial liquidity of enterprises in Poland. It was carried out according to the sectors of the national economy and according to the section of industrial processing.The level of financial liquidity of Polish enterprises shows a steady upward trend, regardless of the sector in which the entity operates.
Mosiejko, Bernadelii and Sierant [23]Analysis of Polish listed companies in terms of financial liquidity management by sector.The financial liquidity of the public companies analyzed was demonstrated to vary by sector of activity. The most stable sectors were chemicals and raw materials, industrial production, construction and assembly production and consumer goods.
Figura [24]Research on the issue of financial liquidity by sector.For all the analyzed financial liquidity ratios, statistically significant differences were found between their sectoral distributions of values.
Gostkowska-Drzewicka and Majerowska [25]Dependence of the performance of companies listed on the WSE on the sector in which they operate.Significant differences were found in the level of the return on assets (ROA) and return on equity (ROE) ratios of the analyzed companies depending on their affiliation to particular sectors.
Goldmann and Zawadzki [26]Sectoral analysis of companies in the computer games industry in terms of liquidity, profitability and debt.Companies that offer a wider range of products tend to dominate the electronic games sector. In the electronic entertainment industry, it is standard to compete and promote the product even during production because promotional activities are essential for sales success. Marketing and product promotion contribute to better financial results. It is standard to compete and promote the product in the electronic games industry.
Table 3. Companies qualified for sectoral analysis (in alphabetical order).
Nb.Name of the Company/Capital GroupMarketSub-SectorDominant Share
101CYBERATON PROENERGY S.A.NCRenewable energyPrivate
2AB INTER RAO LIETUVAMainPower engineeringPrivate
3BIOMASS ENERGY PROJECT S.A.NCRenewable energyPrivate
4ČEZ. A.S.MainPower engineeringState treasury
5COLUMBUS ENERGY S.A.NCRenewable energyPrivate
6ELEKTROCIEPŁOWNIA BĘDZIN S.A.MainPower engineeringPrivate
7ELQ S.A.NCRenewable energyPrivate
8ENEA S.A.MainPower engineeringState treasury
9ENERGA S.A.MainPower engineeringState treasury
10FIGENE CAPITAL S.A.NCRenewable energyPrivate
11FOTO VOLT EKO ENERGIA S.A.NCRenewable energyPrivate
12G-ENERGY S.A.NCRenewable energyPrivate
13ML SYSTEM S.A.MainRenewable energyPrivate
14NOVAVIS S.A.NCRenewable energyPrivate
15PGE S.A.MainPower engineeringState treasury
16PHOTON ENERGY N.V. MainRenewable energyPrivate
17POLENERGIA S.A.MainPower engineeringPrivate
18TAURON POLSKA ENERGIA S.A.MainPower engineeringState treasury
19TERMO2POWER SPÓŁKA AKCYJNANCRenewable energyPrivate
20Z.E.W. KOGENERACJA S.A.MainPower engineeringState treasury
21Z.E.E. PĄTNÓW-ADAMÓW-KONIN SPÓŁKA AKCYJNAMainPower engineeringPrivate
Main means: WSE main market. NC means: a new market financing the growth of young companies with a large growth potential, organized and operated by the WSE.
Table 4. Positions of enterprises in the sector according to statistical parameters for financial indicators [27].
GroupStatistical Parameter
LeadersMaximum
Upper quartile
Upper middle classUpper quartile
Median
Lower middle classMedian
Lower quartile
OutsidersLower quartile
Minimum
Table 5. Statistical parameters of the quick liquidity ratio for enterprises in the energy sector in the years 2015–2021.
Description2015201620172018201920202021
Maximum40.0020.1314.8310.9715.4520.521.52
Upper quartile4.273.662.172.422.261.391.07
Median1.781.251.241.241.311.080.87
Lower quartile0.910.890.860.700.800.630.62
Minimum0.280.510.590.050.170.300.15
Arithmetic mean6.083.462.602.212.412.600.87
Skewness2.502.682.652.183.263.090.10
Kurtosis6.008.327.274.6111.938.91−0.52
Table 6. Statistical parameters of the current liquidity ratio for enterprises in the energy sector in the years 2015–2021.
Description2015201620172018201920202021
Maximum40.0020.1514.9811.0815.5421.143.64
Upper quartile8.815.153.952.682.741.861.57
Median2.052.101.661.471.811.471.06
Lower quartile1.171.090.980.811.080.930.64
Minimum0.330.590.670.410.500.400.19
Arithmetic mean6.774.113.172.642.943.031.27
Skewness2.272.252.171.832.923.051.66
Kurtosis4.985.775.012.589.768.623.34
Table 7. Statistical parameters of the profit margin of sales ratio for enterprises in the energy sector in the years 2015–2021.
Description2015201620172018201920202021
Maximum64.46%48.24%25.69%29.69%40.74%17.57%30.28%
Upper quartile12.54%7.77%13.68%12.47%10.66%6.88%9.93%
Median5.44%3.08%6.76%5.18%4.78%1.92%3.06%
Lower quartile−4.07%−18.98%3.27%1.33%−3.67%−6.01%−3.20%
Minimum−320.51%−217.45%−556.18%−336.32%−355.36%−160.03%−59.22%
Arithmetic mean−32.34%−28.18%−20.94%−15.19%−17.09%−11.54%−0.91%
Skewness−2.20−1.75−4.40−3.66−3.75−2.87−1.59
Kurtosis3.681.9919.5613.9515.148.273.30
Table 8. Statistical parameters of ROS for enterprises in the energy sector in the years 2015–2021.
Description2015201620172018201920202021
Maximum69.17%118.24%49.47%34.62%26.32%76.96%35.11%
Upper quartile10.01%10.53%12.73%13.51%5.72%6.33%6.91%
Median2.43%3.54%7.25%3.60%3.71%−0.06%1.60%
Lower quartile−29.19%−28.51%1.78%−0.37%−8.72%−30.76%−8.68%
Minimum−527.47%−439.4%−345.18%−400.18%−397.6%−92.71%−126.81%
Arithmetic mean−43.26%−34.37%−6.80%−28.35%−39.73%−10.70%−7.64%
Skewness−3.13−2.44−4.25−2.94−2.69−0.23−2.53
Kurtosis10.907.3318.647.727.671.736.90
Table 9. Statistical parameters of ROA or enterprises in the energy sector in the years 2015–2021.
Description2015201620172018201920202021
Maximum61.26%17.90%18.53%18.55%27.12%24.30%25.63%
Upper quartile4.55%3.58%3.83%3.44%2.06%2.36%4.56%
Median0.40%0.78%2.02%1.06%0.08%−0.02%0.84%
Lower quartile−4.29%−2.22%0.19%−0.40%−2.50%−5.44%−2.80%
Minimum−57.22%−91.39%−25.30%−14.59%−272.57%−19.36%−106.86%
Arithmetic mean2.03%−3.03%1.87%1.55%−13.59%−1.31%−3.48%
Skewness0.10−3.99−1.780.19−4.310.45−3.61
Kurtosis5.3117.428.385.2419.282.1215.30
Table 10. Statistical parameters of ROE for enterprises in the energy sector in the years 2015–2021.
Description2015201620172018201920202021
Maximum75.28%48.66%148.74%444.75%101.50%68.50%56.86%
Upper quartile10.62%8.74%8.34%7.18%5.78%4.42%10.14%
Median0.52%1.67%4.92%2.02%0.13%1.47%2.39%
Lower quartile−6.70%−3.01%0.20%−0.52%−3.59%−9.68%−4.21%
Minimum−111.42%−99.61%−36.96%−21.53%−295.27%−42.83%−122.12%
Arithmetic mean4.85%−1.06%9.34%22.64%−14.98%0.04%−6.34%
Skewness−0.91−2.663.764.52−2.611.00−1.50
Kurtosis4.5911.7416.5420.598.452.362.75
Table 11. Statistical parameters of the general debt ratio for enterprises in the energy sector in the years 2015–2021.
Description2015201620172018201920202021
Maximum0.810.790.880.960.860.842.09
Upper quartile0.560.570.560.650.640.590.74
Median0.390.400.390.480.450.500.59
Lower quartile0.080.080.210.240.320.420.46
Minimum0.010.020.010.020.020.000.08
Arithmetic mean0.370.360.400.460.460.480.62
Skewness−0.050.060.25−0.08−0.19−0.66−2.26
Kurtosis−1.47−1.31−0.77−0.82−0.850.538.34
Table 12. Statistical parameters of the asset turnover ratio for enterprises in the energy sector in the years 2015–2021.
Description2015201620172018201920202021
Maximum2.763.463.704.674.873.255.74
Upper quartile0.350.350.400.690.720.640.85
Median0.240.240.260.310.360.420.65
Lower quartile0.050.100.150.190.210.180.26
Minimum0.000.000.000.000.000.010.01
Arithmetic mean0.390.410.460.610.750.660.89
Skewness3.503.863.873.692.982.373.62
Kurtosis14.0016.1616.2515.1710.305.3814.75
Table 13. Statistical parameters of the overall financial situation indicator for enterprises in the energy sector in the years 2015–2021.
Description2015201620172018201920202021
Maximum26.0732.2519.2114.7529.0016.492.06
Upper quartile1.952.731.631.851.571.001.07
Median0.460.520.370.400.640.420.98
Lower quartile0.190.220.180.240.270.170.50
Minimum0.050.060.070.080.10−0.94−9.71
Arithmetic mean3.064.002.572.062.651.430.45
Skewness2.992.802.632.594.014.16−4.29
Kurtosis9.538.166.306.7316.9818.2719.21
Publisher’s Note: MDPI stays neutral with regard to jurisdictional claims in published maps and institutional affiliations.

