Article

Design and Implementation of Demand Side Response Based on Binomial Distribution

1
Department of Mechanical and Electrical Engineering, Yangjiang Polytechnic, Yangjiang 529500, China
2
School of Computer, Electronics and Information, Guangxi University, Nanning 530004, China
*
Author to whom correspondence should be addressed.
Energies 2022, 15(22), 8431; https://doi.org/10.3390/en15228431
Submission received: 9 October 2022 / Revised: 31 October 2022 / Accepted: 7 November 2022 / Published: 11 November 2022
(This article belongs to the Special Issue Emerging Technologies and Methods for Future Energy Markets)

Abstract

:
The application of microgrids (MG) is more and more extensive, therefore it is important to improve the system management method of microgrids. The intended costs can be further minimized when the energy management system is unified with demand side response (DSR) strategies. In this work, we propose a generic method of modeling the equipment in a microgrid including multiple stochastic loads. The microgrid model can be generated on a computer by converting the energy circuit diagram into a signal flow diagram. Then, a demand side response method based on binomial distribution is introduced, and loads are set to different probabilities according to importance. By applying the probability of loads and changing the return coefficient of loads, the problem of individual differences in demand side responses is solved, so as to improve consumer satisfaction. The proposed model is constructed as a mixed-integer linear program (MILP). Cases studies demonstrate feasibility of the proposed modeling method. The demand side response achieves the expected goal. The system management method reduces the operation cost of the energy system of microgrids.

1. Introduction

The problems of energy and environment have become important current issues, and integrated energy systems can effectively and economically solve these problems [1]. A microgrid is located at the end of the energy network. As a form of distributed generation, the application of a microgrid has become more and more extensive in the world due to its contribution to green environmental protection [2]. The fluctuating output power of renewable energy can destroy any interconnected large power grid. When a large amount of renewable energy is deployed on remote islands, it is difficult to connect the power grid with these renewable energy sources. Microgrids can isolate renewable energy power generation equipment to avoid the instability of large power grids [3].
A microgrid is a power distribution system, and distributed power, energy storage equipment, and load are its main equipment [4]. Photovoltaic power generation and wind turbine power generation, as distributed power sources, are developing rapidly [5]. The modeling methods proposed for these devices have achieved some results. According to the modeling method of graph theory, the multi-energy flow of an integrated energy system is modeled [6]. Ref. [7] proposes an automatic modeling method to model small combined heat and power generation equipment as input and output matrices. However, the product of scheduling factors and decision variables used in the coupling matrix is nonlinear, and nonlinear constraints are added. Ref. [8] expresses the devices of microgrids as directed graphs, which simplifies the analysis, research, design, and optimal operation of microgrids. However, there is no unified theoretical method for automatic modeling of these devices.
The energy storage system in a microgrid adds the flexibility of an energy system, but the difficulty of energy control and management also increases. Therefore, an energy management strategy (EMS) is very important in a microgrid [9]. The literature [10] studies the demand side response, the energy market, the optimal operation of wind power generation and storage systems, considering the uncertainty of demand, market price, and wind speed. The literature [11] uses intelligent optimization algorithm to obtain the optimal allocation scheme, but the intelligent algorithm is relatively complex, and it is easy to obtain local solutions. In [12], a nesting energy management strategy is proposed, which does not consider the uncertainty of the loads, and the uncertain parameters are not concerned.
Ref. [13] solves a constrained optimization problem, and gives the optimal control strategy in an islanded microgrid system. However, due to the increase of load uncertainty, it is difficult to make real-time decisions. In the optimal dispatch of a microgrid, many researchers are focused on the optimization between various distributed power sources and energy storage systems, but less on the load regulation [14]. However, with the development of microgrids, a demand side response (DSR) has been paid more and more attention in EMS. Ref. [15] puts forward an optimal dispatching model of flexible cold, heat, and electricity demand side responses, which is used to improve the energy supply flexibility of an isolated microgrid. The literature [16] proposes a zoning EMS control method of a DC microgrid by using a controllable load in demand management, which improves the stability of the demand side operation of a power grid. Ref. [17] puts forward a modified model of a demand side response to implement seven DSR strategies, which can improve the load factor. Household refrigeration equipment can be used for electrical load shifting from a peak demand period to an off-peak demand period [18]. However, energy systems of microgrids usually carry many loads, which are driven by variables, and it is difficult to forecast demand correctly [19]. Technology innovation is very important for obtaining renewable energy, improving energy efficiency, and reducing carbon dioxide emissions [20].
To sum up, an automatic and general modeling tool is needed for microgrid devices, which can be used to automatically create system structure models. Using DSR in a microgrid can improve the performance of EMS, promote the consumption of new energy, and improve the efficiency of equipment. However, most of the existing literature only considers the demand side response of a deterministic load. There is not much research on the differences of individuals participating in demand side response loads, and further research is still needed.
In this paper, a microgrid model based on an energy circuit diagram is established. A demand side response model is proposed, which includes an unresponsive electric load, non-interruptible electric load and interruptible electric load. Binomial distribution is used to describe the uncertainty of a participating load response, which solves the problem of individual discrimination in a participating load response. Some loads are shut down by using the difference of load probability, and customer satisfaction is improved. The operating cost of a microgrid energy system is reduced by using the response of energy system to energy price.
Different from all previous methods, probability distribution is used to determine the future load demand, which is determined by the binomial distribution probability model. There is no complicated calculation in the whole process. In addition, the model can be applied to the optimization calculation. The main contributions are as follows:
(1)
A generic modeling method combined energy circuit theory can be used easily create a model of a microgrid.
(2)
A DSR model is proposed, which includes non-interruptible electrical loads, shiftable undisturbed electrical loads and shiftable disturbed electrical loads.
(3)
A DSR method based on binomial distribution is proposed. By applying the probability of loads and changing the return coefficient of loads, the problem of individual differences in demand side responses is solved.
(4)
A MILP based on DSR is applied on a microgrid. The usage of the proposed method greatly improves the satisfaction value of users.
The rest of this paper is organized as followed: Section 2 presents the microgrid model based on an energy circuit diagram. Section 3 introduces the respond demand method based on binomial distribution. Section 4 proposes a system management method based on a demand side response. Case studies are conducted in Section 5. Section 6 shows the conclusions.

2. Microgrid Model Based on Energy Circuit Diagram

2.1. Schematic of the Microgrid

Microgrids can operate independently as a whole or in parallel with the power grid, which can provide a powerful supplement and support for the power grid. A microgrid is an important part of smart grid [11]. The general framework for the microgrid is shown in Figure 1.
The system of Figure 1 consists of wind generator (WG), photovoltaic (PV), battery (BAT), and so on. PV, WG, BAT, and loads are combined with corresponding sensors, controllers, intelligent switches, and power converters to form controllable element units. The electrical energy of distribution grid (DG) can be exchanged bi-directionally with the microgrid. The management system of microgrids realizes local decision-making management and collaborative optimization by interconnecting communication flows through communication networks.

2.2. Mathematical Model of Microgrid Components

The structure of a microgrid has been described in Figure 1. This section will build mathematical models of all components in the system. These components depend on some preconditions, which play an important role in the design process and decision-making process, and reasonable conditions can improve the economy and reliability of the system.

2.2.1. Solar Power Generation System

The relationship between electric power, temperature and solar radiation is shown in Equation (1) [21].
{ P PV ( t ) = P PVr × S I ( t ) 1000 × [ 1 + α C γ ] γ = ( ( τ a + ( 0.0256 × S I ) ) τ p ) α C = 3.7 × 10   ° C 1
where P PV represents the power output by solar panels, S I represents solar irradiance, P PVr represents rated power under standard conditions, α C represents temperature coefficient, τ a and τ p represent ambient and panel temperatures, respectively.

2.2.2. Wind Power Generation System

The output power of the wind farm depends on the wind speed. The relationship between the generated power of the wind farm and the wind speed is shown in Equation (2) [22]:
P WT ( v ( t , s ) ) = { 0 if             v ( t ) v in c               or         v ( t ) v out c       v ( t ) v in c v rated c v in c P r w if           v in c v ( t ) v rated c P r w if           v rated c v ( t ) v out c
where v ( t , s ) represents the wind speed at time t and scenario s, v in c and v out c represent speed of starting and stopping the wind turbine, v rated c and P r w represent the rated speed and rated output power of the wind turbine.

2.2.3. Energy Storage Device

An energy storage device is a battery in a microgrid system. The energy state of the energy storage device in the period t can be represented by the initial state and the energy charging or discharging process. The calculation equation is as follows [23]:
W ES t = W ES t 1 + ( P ES , ch t η ES , ch P ES , dis t η ES , dis ) Δ t
where W ES t represents the electric energy at the time t, P ES , ch t represents the charging power of the energy storage device, P ES , dis t represents the discharging power of the energy storage device, η represents the efficiency.

2.3. Energy Constraint Equation of Microgrids

The energy system of microgrids is composed of energy, energy conversion equipment, storage equipment, and load. Ref. [24] applies the method of a power network from “field” to “path” to the analysis of other energy networks by comparing the energy network with the circuit, and puts forward a unified energy circuit theory. These devices of microgrids are represented as directed graphs, each device is represented by an edge, and an edge with an arrow represents the flow of energy or matter between two nodes [8]. Based on Figure 1, a directed graph-energy circuit diagram based on energy circuit theory is established in this paper. The proposed microgrid energy circuit diagram is shown in Figure 2.
In Figure 2, there are three types of equipment: the production equipment of electric energy such as PV and WT, storage equipment BAT, and Load LD. In the figure, each device represents an edge of the energy circuit diagram, that is, a branch of the energy circuit diagram. There are m branches in the diagram, and the arrows of the branches indicate the flow direction of electric energy. The intersection points of branches are nodes, which represent energy or material, the node A represents electric energy, and node O represents the common node. The branch energy can be positive or negative, indicating that the energy can flow in both directions.
Figure 2 is transformed into an energy circuit signal flow diagram shown in Figure 3. There are two nodes, A and O, and there are m branches in Figure 3. The first branch is DG, which can exchange electric energy with the power grid in both directions. The second and third branches are PV and WT, which output electric energy. The fourth branch is BAT, which can store and release electric energy. The fifth to m branches are loads. Tellegen’s theorem is applicable to any lumped circuit with linear, nonlinear, time-invariant and time-varying elements. According to Tellegen’s theorem in Figure 3, it can be expressed as Equation (4) at node A.
i = 1 m E i = 0
where E represents the energy of the i-th branch, m represents the number of branches.
According to Equation (4), at any time t, the energy constraint equation of node A in Figure 3 is shown in Equation (5):
E DEG + E PV + E WT + E BAT + E LOAD = 0
In Equation (5), E DEG represents the electrical energy exchanged with the grid, E PV represents the energy provided by photovoltaic, E WT represents the electrical energy provided by wind energy, E BAT represents the electrical energy exchanged with the battery, and E LOAD represents the electrical energy consumed by all loads. According to the energy circuit diagram modeling method, the energy conservation equation can be conveniently generated by inputting the parameters of nodes and branches, and the energy conservation equation can easily be established by computer or traditional manual methods.

3. Respond Demand

In the system shown in Figure 1, the storage battery provides energy to supply the load if PV and WT cannot meet the load energy. However, the storage battery cannot fully meet the energy demand in heavy load in a microgid, and it can buy electricity from the power grid. When the electricity produced by PV and WT is greater than the load demand, it can also sell electricity to the power grid. In order to reduce the disturbance of a microgrid to a large power grid, the energy exchange between a microgrid and a large power grid should be reduced as much as possible. Considering the price of electricity exchanged with the grid, we must initiate the demand side response to minimize the cost, forcing some loads to stop or start. The demand side response can improve the charging and discharging times of the battery and reduce the operating cost of the microgrid.
We can use probability distributions to determine potential, time-dependent, and future load demands that are addressed by the proposed model. In [25], the load combination probability is used to determine the order of demand side response loads. If we have k loads, the number of combination probabilities is 2k, and the combination probabilities need to be sorted in decrease turn. Due to the large amount of calculation if k is large, a load probability demand side response method based on binomial distribution is proposed in this paper.

3.1. Load Model

The electrical loads are divided into non-interruptible electrical loads (NI), shiftable undisturbed electrical loads (SU), and shiftable disturbed electrical loads (SD).

3.1.1. Non-Interruptible Electrical Loads (NI)

The probability of non-interruptible electrical loads is 1, and the load model is:
P l a ( t ) = i = 1 n P l i T
where n represents the number of users, T represents working time, P l a ( t ) represents the load at time t, P l i represents the load of the i-th user.

3.1.2. Shiftable Undisturbed Electrical Loads (NI)

It is assumed that the working time of shiftable undisturbed electrical loads is [t1, t2]. The working time is t2t1 h. The NI load model is as follows:
P l b ( t ) = i = 1 n P l i ( t ) P r i ( t ) ( t 2 t 1 )
where P l b ( t ) it represents the load of NI equipment at time t, P r i ( t ) represents the load probability of the i-th user, which is determined by the following equation:
{ P r i ( t ) = 0       t ( t 1   t 2 ) P r i ( t ) = 1       t ( t 1   t 2 )

3.1.3. Shiftable Disturbed Electrical Loads (SD)

Shiftable disturbed electrical loads can be deactivated at any time. The SD load model is as follows:
P l c ( t ) = i = 1 n t = 0 24 P l i ( t ) ε i ( t )              
where P l c ( t ) represents the load of SD equipment at time t, ε i ( t ) represents a binary variable, which is determined by the following equation:
{ ε i ( t ) = 0       Deactivate   load ε i ( t ) = 1       Enable   Load

3.2. The Binomial Distribution Function

Considering the different characteristics of each SD load, the start-stop of the load is determined by the binomial distribution function. The n loads can be regarded as n random variables x, obeying binomial distribution with parameters n and p, and the distribution function is as follows:
P { x = k } = ( n k ) p k ( 1 p ) n k
where,
( n k ) = n ! k ! ( n k ) !
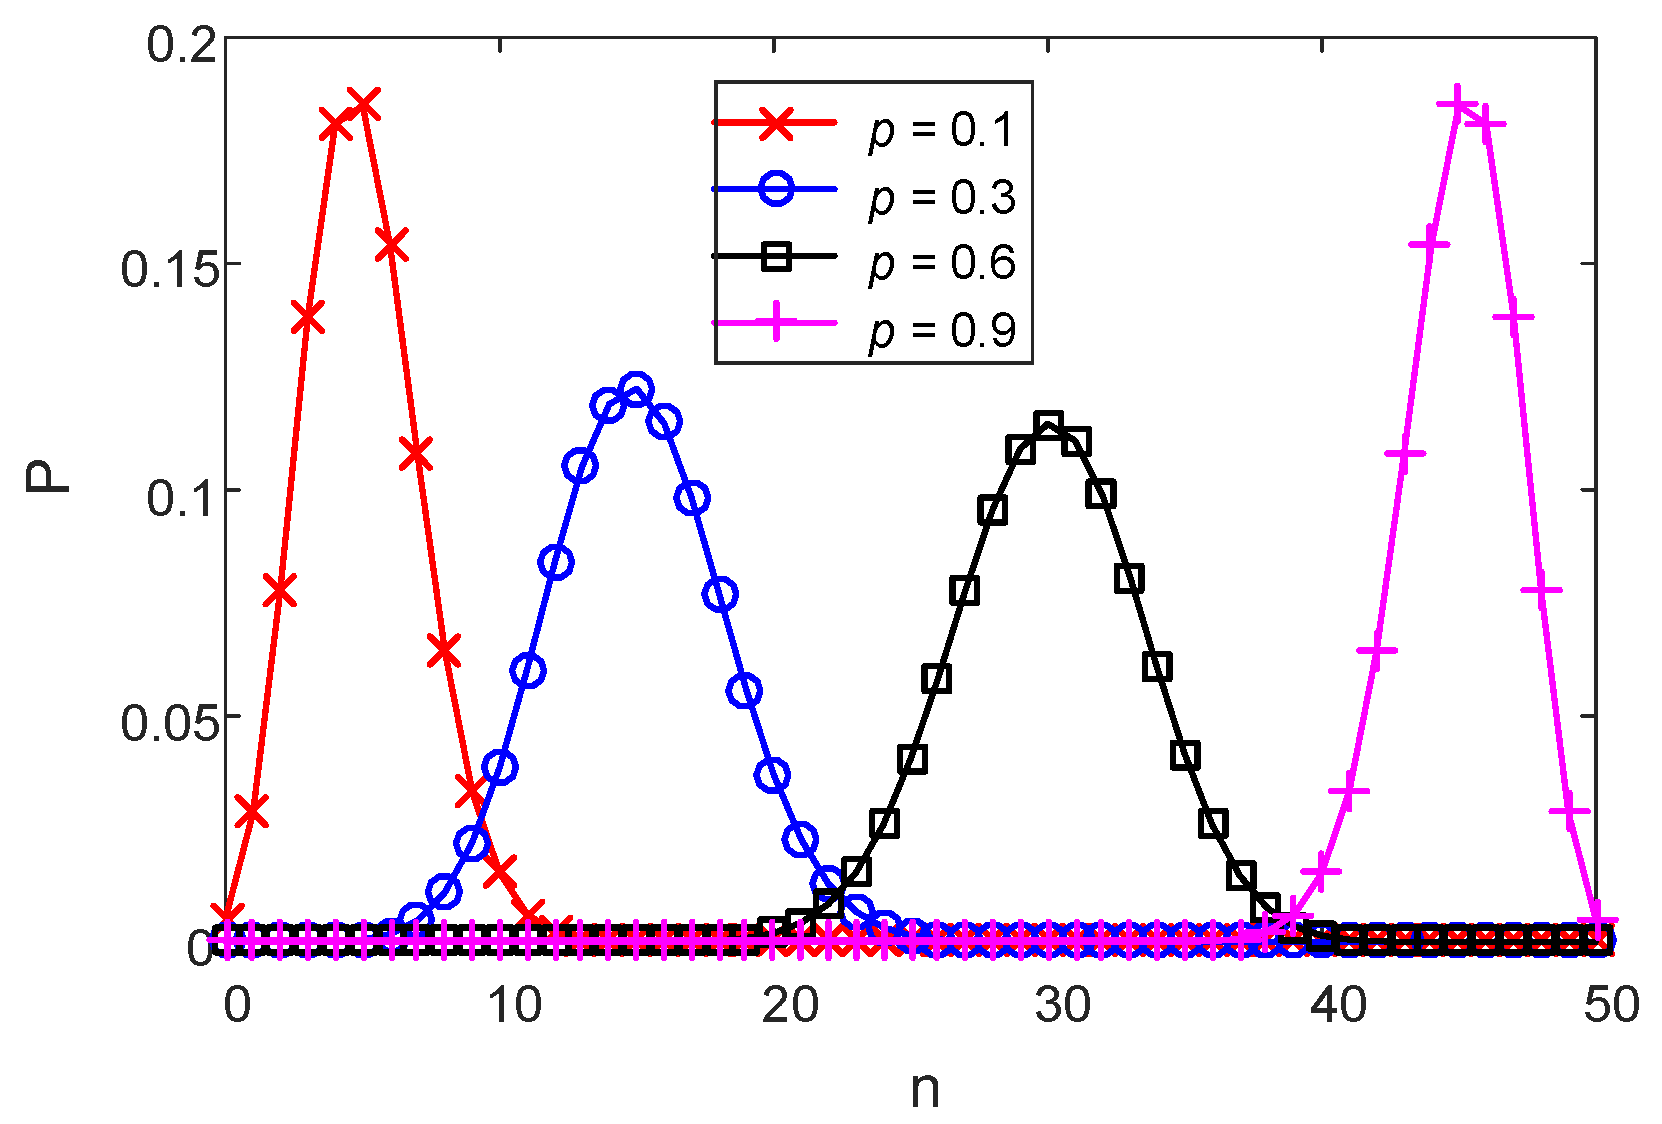
According to the load probability, the order of stopping the load is decided. It is assumed that p is randomly selected in [0.1 0.9], and n = 50. The binomial distribution probability is shown in Figure 4. The maximum probability Pmax of different p values is different, and the individuals of load response can be determined by the value of p and Pmax.
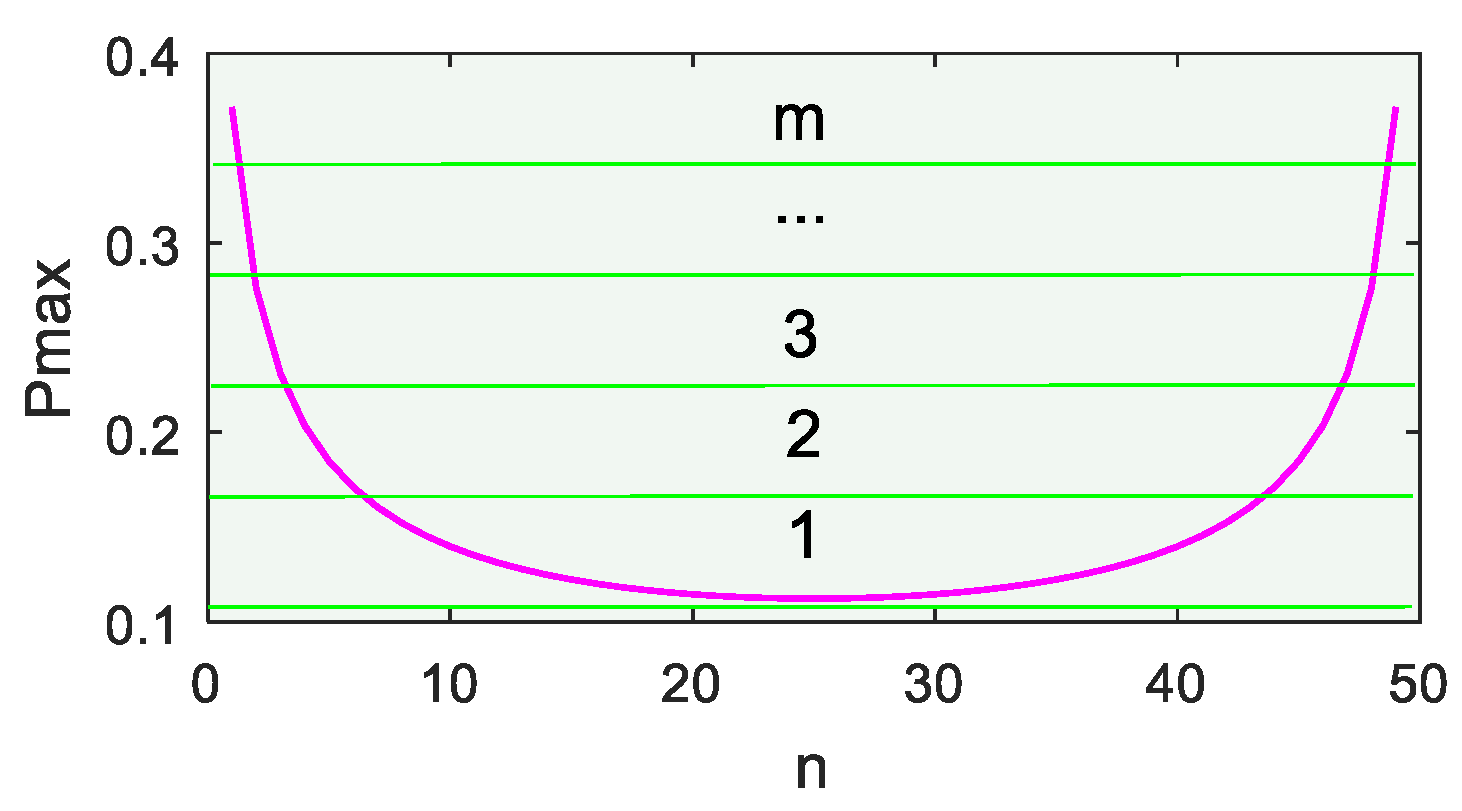
The maximum probability curve of binomial distribution from 0.01 to 0.99 is shown in Figure 5. The load number corresponding to Pmax is (n + 1) p rounded. According to the classification of interruptible loads, loads with different importance are defined in different areas. The curve in Figure 5 is divided into m areas as shown in Figure 6. The first interruptible load is defined in the m area, and the 1 area is the last interruptible load. The load near Pmax is disconnected first, so as to improve customer satisfaction.

3.3. Method of Demand Side Respond

In addition to considering the combination probability of load, in order to ensure that the deactivated load can be put to use in the next period of time, a return coefficient λ is set for each load, and the initial value is randomly set. After the load is disabled in the previous period, the value of λ becomes 1. At the same time, the demand side response should consider the following points:
(1)
The relation of the total load and the energy of PV and WT.
(2)
The charging state of the battery.
(3)
Probability of deactivating load.
(4)
The load with a coefficient of 1 is no longer disabled.
(5)
The price of the power grid.

4. System Management Method Based on Demand Side Response

4.1. User Satisfaction

Generally, the power consumption of a user is closely related to their comfort level. When the price level is relatively stable, users will choose the consumption mode with the greatest comfort. However, after the implementation of DSR, the satisfaction will be affected by the change of power consumption. The definition of power consumption satisfaction is as follows [26]:
θ = 1 t = 1 T | ( d ( t ) d 0 ( t ) ) | t = 1 T d 0 ( t )
where θ represents user satisfaction, d ( t ) represents actual consumption load in t period, d 0 ( t ) represents the load to be consumed in t period. The actual load of a microgrid is the sum of the three types of loads, which can be expressed as:
d ( t ) = P l a ( t ) + P l b ( t ) + P l c ( t )

4.2. Optimization Objective Function

The goal of a microgrid energy system is to minimize the total operating cost, which is as follows:
min F = t = 1 24 [ P b ( t ) c b ( t ) P s ( t ) c s ( t ) ] + U EQ + U SL
where F represents the total operating cost of MG, P b ( t ) and P s ( t ) represent the electricity purchased and sold in t period, respectively, c b ( t ) and c s ( t ) represent the electricity price purchased and sold in t period, U EQ represents the cost of equipment maintenance, U SL represents the cost of satisfaction loss.
The cost of equipment maintenance refers to the aging loss cost of unit energy generated by energy conversion equipment. We only consider the loss of photovoltaic, wind power, storage, and converter equipment, which can be expressed as [27]:
U EQ = m M t = 1 24 P m ( t ) γ m
where M represents all devices of microgrids; P m ( t ) represents the output power of the m-th equipment in microgrids at time t; γ m represents the loss coefficient of the m-th equipment.
After considering the demand side response, different users have appropriate energy consumption in each time period. The satisfaction loss will occur if the user’s electricity load deviates d 0 ( t ) . The loss is included in the total operating cost function and as follows [28]:
U SL = t = 1 24 [ 1 2 α ( d ( t ) d 0 ( t ) ) 2 + β | ( d ( t ) d 0 ( t ) ) | ]
where α and β represent the loss parameter.
According to the binomial distribution characteristics of interruptible loads, it is assumed that there are multiple groups of interruptible loads that obey the binomial distribution of n and p. If the value of the first group of interruptible loads is taken as small, this group of loads has the first interruption trend, so that α = p. In a group of p-fixed loads, the highest priority interruption with high distribution probability is to be achieved, so that β = 1 − Pmax. Therefore, the priority of interruptible loads can be distinguished by setting the group of interruptible loads and its position in this group.

4.3. Energy Management System Based on Demand Side Response

The energy management system of microgrids can improve the performance and efficiency of equipment, prolong their service life and reduce energy costs. The main objectives of EMS based on demand side responses are as follows:
(1)
Minimize the energy cost.
(2)
Maximize the use of wind and solar energy resources.
(3)
Maximize the average available storage energy of the battery.
According to the requirements of objective function, the order of electric energy exchange in microgrids is shown in Figure 6. Closing switch 1 indicates charging BAT, closing switch 2 indicates selling electricity to the grid, closing switch 3 indicates discharging BAT, and closing switch 4 indicates purchasing electricity. The difference between the load and the energy is monitored online. Switch 1 is closed when the load power is less than the power generated by renewable energy. Switch 2 is closed to transmit the electric energy to the power grid when the battery charging reaches the peak value. Switch 2 can also be closed at the same time as switch 1 when the price of purchasing electricity from the power grid is low, that is, the electricity is purchased from the power grid to charge BAT. Switch 3 is closed for battery power supply when the load power is less than the power generated by renewable energy. Switch 4 is closed to purchase electricity from the power grid when the battery has reached a certain discharge value. In this process, if the electricity price is too high, the demand side response is enabled. The load Lk corresponding to the maximum value of the distribution probability curve is turned off. If it still fails to meet the requirements, the nth loads near the maximum value of the distribution probability curve when p is a certain value are turned off in turn (n takes the K − 1, K + 1, K − 2, K + 2) until the load is equal to the power supply.
The flow chart of the demand side response is shown in Figure 7.

5. Case Study

5.1. Case Parameters

The maximum charging power of the battery is 600 kW. The initial power of the battery is 300 kW. The charging upper limit of the battery is 540 kW. The lower limit of the battery is 120 kW. The charging efficiency of the battery is 0.98, and the discharging efficiency is 0.97. According to the data of solar radiation, temperature, wind speed, and so on in a day [6], the predicted curves of photovoltaic, wind power, and load power in a day is as shown in Figure 8.
Assuming that there are three groups of interruptible loads, the power and load probabilities in one day are shown in Table 1. The transferable interruptible loads are shown in Table 2. The time-of-use electricity price of the power grid is shown in Table 3 [29].

5.2. Results

All the simulations are programmed with Matlab2016a by calling CPLEX12.8. The sampling time is 1 h and the cycle is 24 h. We investigate two cases.
  • Case 1: employ EMS without considering DSR;
  • Case 2: employ EMS considering DSR.
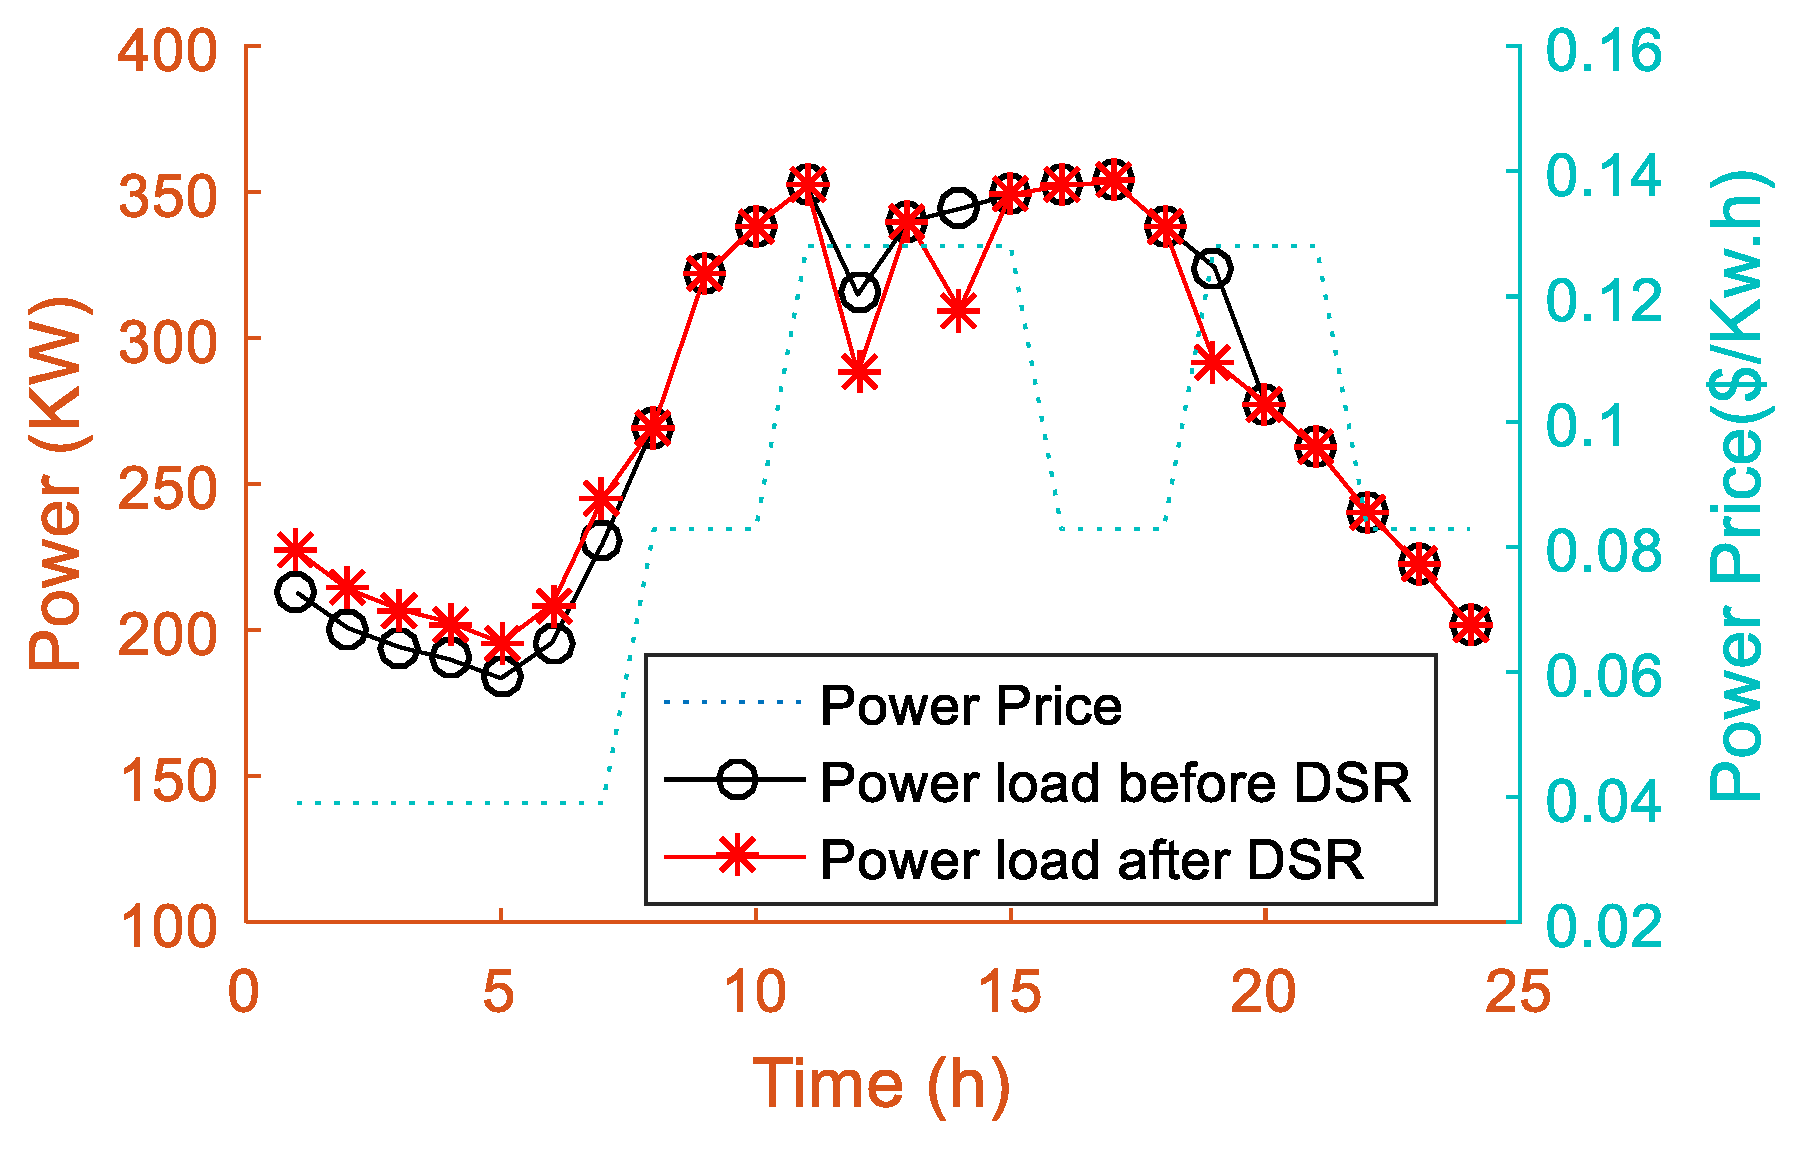
The load power before and after the demand side response is shown in Figure 9. During 12:00–15:00 and 17:00–20:00, part of the load is transferred to 0:00–7:00 because the purchase power price from the power grid is low. During the period 20:00–21:00, the energy price is high and there is no transfer because the output power of WT is high during this period. Therefore, the demand side response plays an important role in peak load shifting, which can promote the utilization of renewable energy and bring better economic benefits.
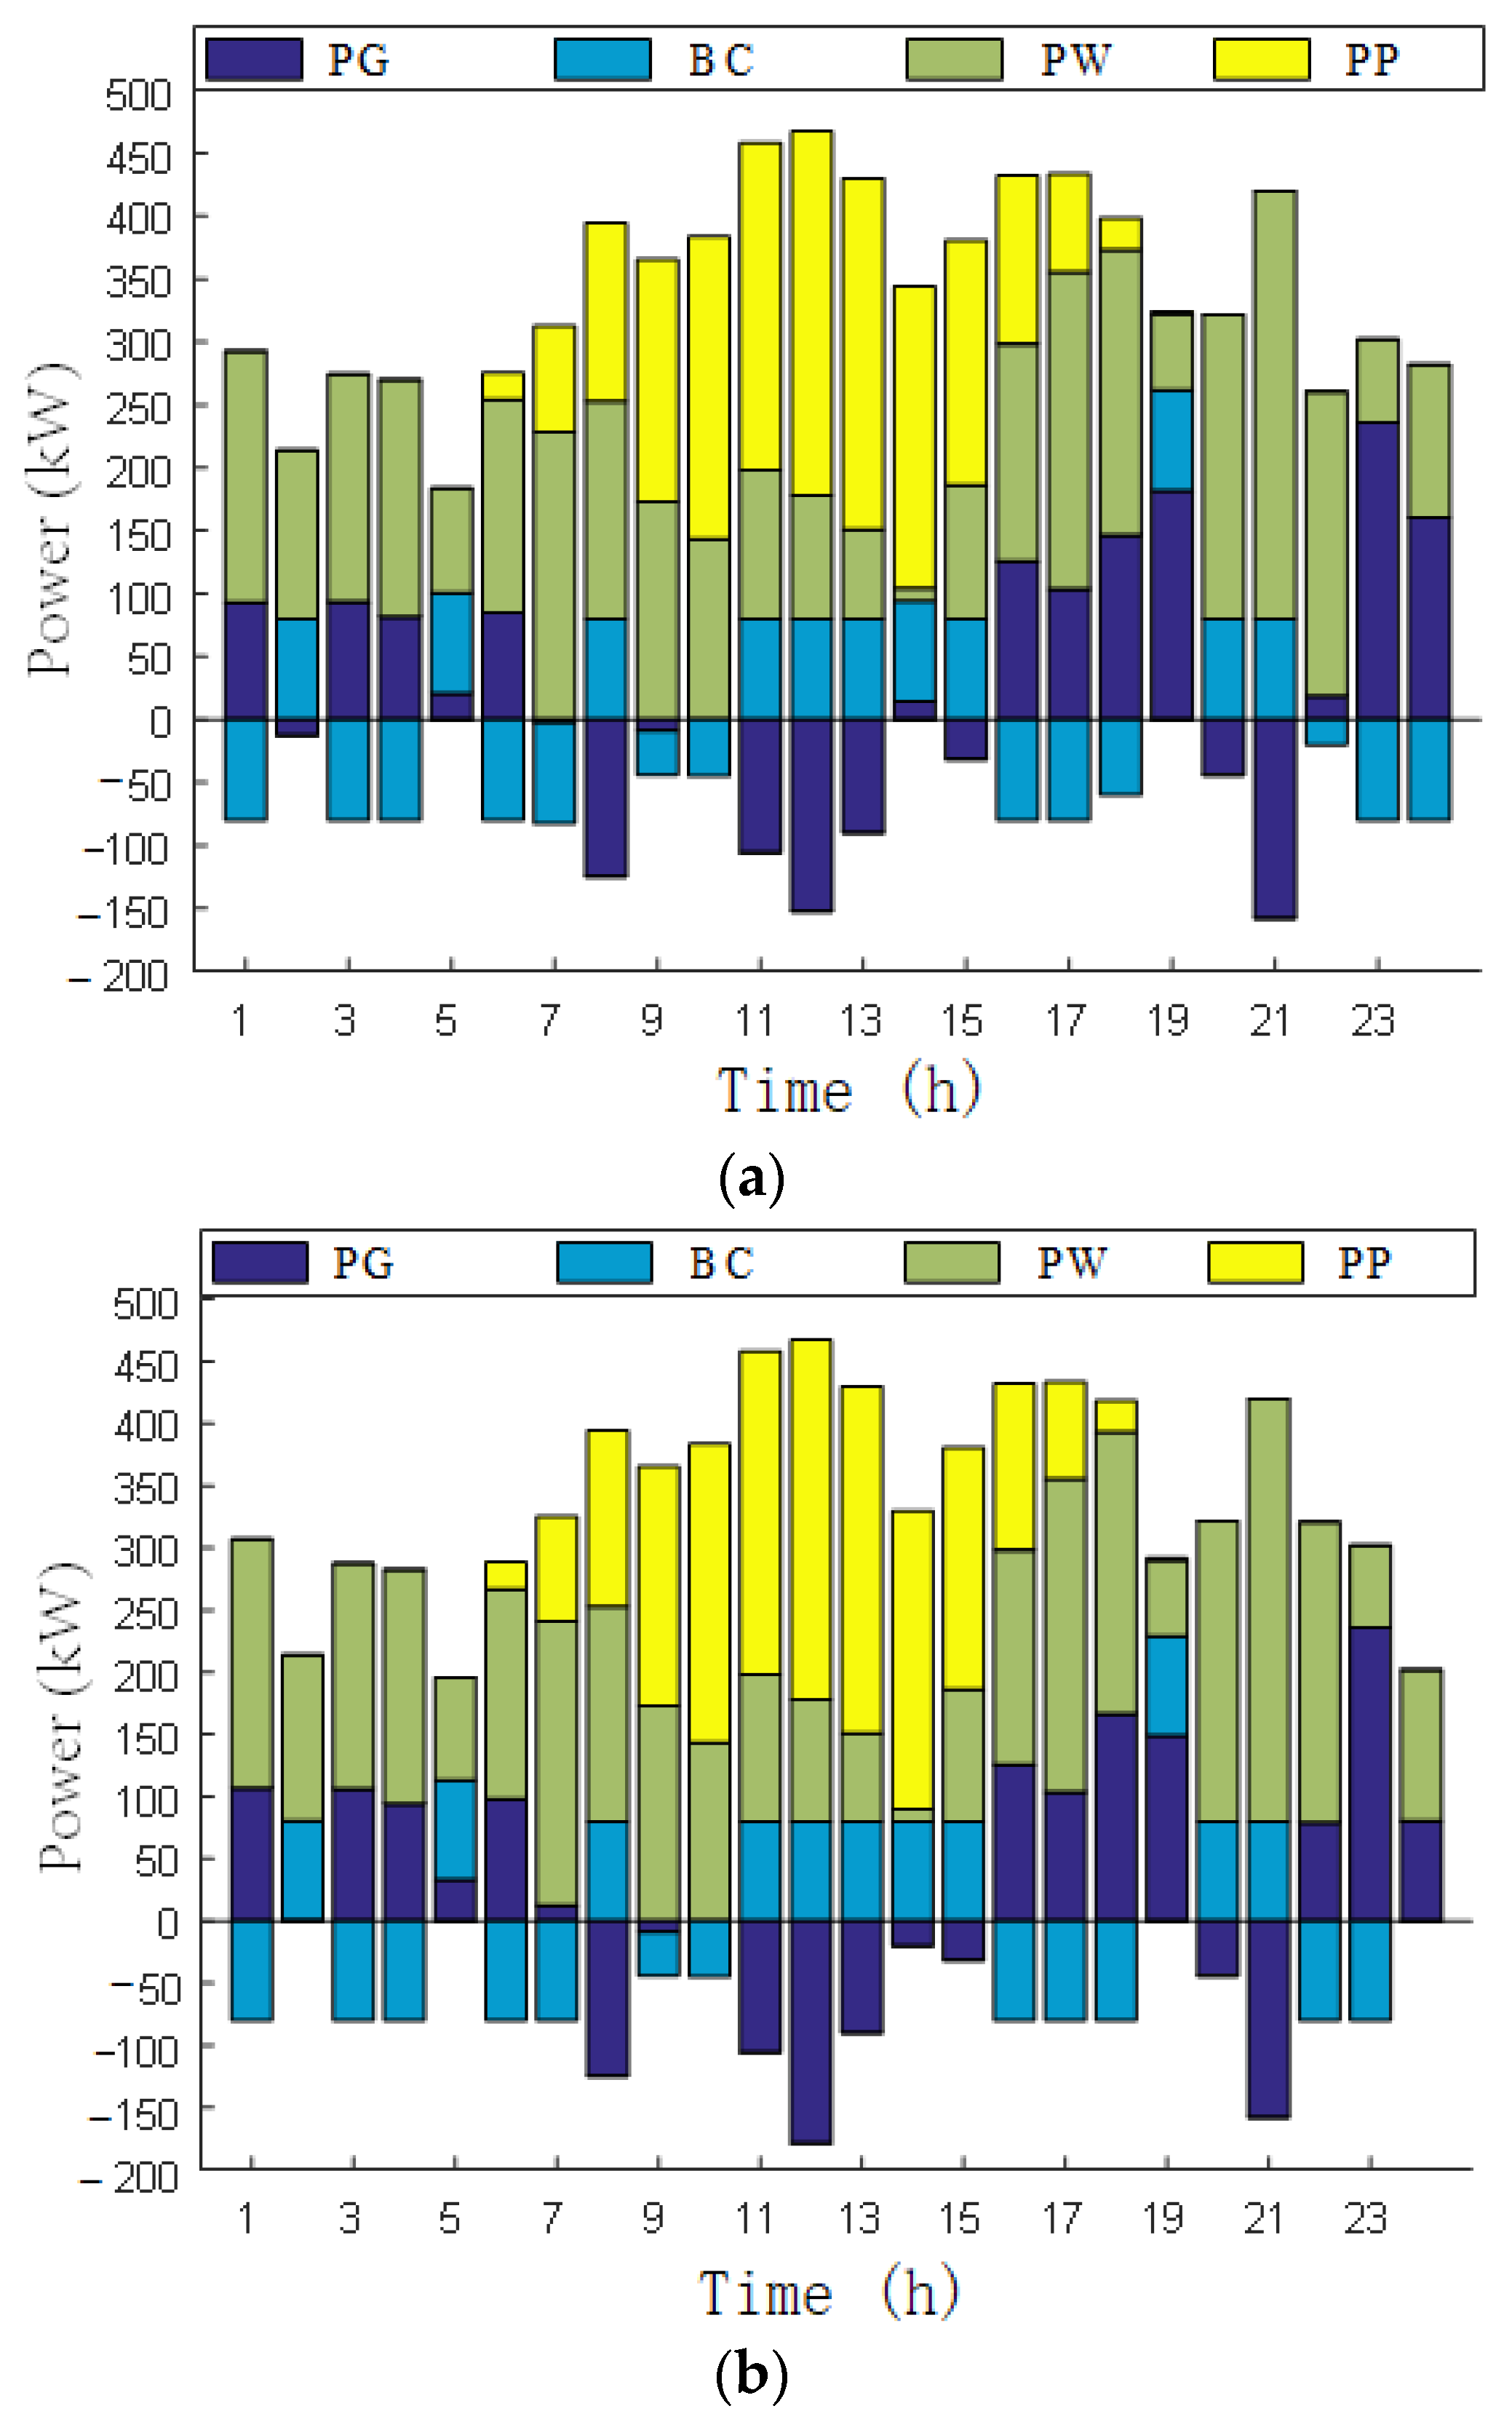
Figure 10 shows the results of the power optimization before and after the demand side response. In Figure 10, PG represents grid exchange power, BC represents battery charging power, PW represents the power of WT, and PP represents the power of PV. Due to the lower electricity price, the microgrid continues to purchase electricity and store it in the battery for use during peak hours during the period 1:00–7:00 after the demand side response, although the photovoltaic output is almost zero. During the peak load period from 11:00 to 15:00, although the output power of PV and WT is high, due to the higher electricity price, the battery keeps discharging. Particularly, after 19:00, the output power of PV and WT suddenly decreases, and the battery changes from charging state to discharging state. Compared with before the demand side response, the exchange power of the grid changes from negative value to zero at 2:00 because the electricity price is lower at this time. It changes from purchasing electricity to selling electricity at 14:00, mainly because the electricity price is high at this time. Therefore, EMS based on demand side response can comprehensively utilize energy and reduce the total cost.
Table 4 shows the operating costs of EMS in two cases. The power cost of the scheme is reduced by $31.1 in case 2, which is about 8.2%. There are two main reasons: energy storage and peak load shifting.
As shown in Table 5, the operation time of shiftable undisturbed electrical load can be transferred. All three groups of loads can be started at a lower electricity price or the higher power of new energy generation, thereby better utilizing photovoltaic or wind power to generate electricity. The purchased electricity of microgrids can be reduced, and the system can run more economically.
The results of shiftable disturbed electrical loads are shown in Table 6. Due to the consideration of demand side responses, a part of SD loads are transferred, and the SD loads are generally transferred in the period of larger photovoltaic output or lower electricity price. More to the point, according to the probability curve of binomial distribution, the satisfaction loss function value is included in the optimization objective function, and the individual difference control of SD loads is realized. After demand respond, the satisfaction value θ of users is 97.1%.

6. Discussion-Comparison

In this paper, the DSR method based on binomial distribution is applied to the EMS in microgrids. The method is similar to that in [25]. The differences between them are explained below. Ref. [25] calculates the probability of a specific combination of loads. All the probabilities of combinations must be calculated. The probabilities of 2k combinations must be calculated if there are k loads. Therefore, the amount of calculation is very large if there are too many loads and the calculation will be difficult. In this paper, we need to calculate k times by formula 11 under the same conditions.
Unlike all previous research model methods, our general model can be used to consider multiple energy sources at the same time. The model is based on the energy circuit theory, and the energy includes electricity, gas, heat, and other energy sources. Therefore, when there are multiple energy sources such as electricity, gas, and heat in the microgrid, the proposed model in this paper is still applicable. The probability distribution is used to determine the future load demand. Any load demand can be expressed as a proposed model because the probability of the load can be determined according to its importance and is independent of other factors. In addition, the model can be combined with an optimization algorithm for real-time decision-making.

7. Conclusions

In this paper, a modeling method based on an energy circuit is proposed for automatic modeling of microgrid systems. The parameters of nodes and branches can be input through the directed energy circuit graph, and the energy conservation equation can be conveniently generated on the computer. Then, the demand side response method based on binomial distribution is used to respond to the load differently when there is a high load or the electricity price is too high. The results show that the proposed method can provide the different characteristics to participating response loads differently. The effectiveness and feasibility of the system management method are verified by the comparative experiments of the two cases. According to the simulation results, the following conclusions can be drawn:
(1)
The model structure of a microgrid is optimized by the energy circuit diagram modeling method.
(2)
The problem of an individual response to an uncertain load is solved using the DSR method based on binomial distribution. According to the preset load probability, some loads can be switched off automatically and selectively by optimizing the objective function.
(3)
The proposed method can reduce the operating cost of microgrid energy systems.
The results of the DSR proposed model show that the satisfaction value of users is 97.1%. This proves the advantages of the improved model over the traditional DSR model. However, the method in this paper needs to define different probabilities for each load. How to automatically allocate probabilities according to user characteristics is the future research direction.

Author Contributions

Conceptualization, M.L. and J.Y.; methodology, M.L. and J.Y.; validation, M.L.; writing—original draft preparation, M.L.; writing—review and editing, J.Y.; supervision, J.Y.; funding acquisition, J.Y. All authors have read and agreed to the published version of the manuscript.

Funding

This research was funded by the National Natural Science Foundation of China, grant number (61762030).

Data Availability Statement

The data presented in this study are available on request from the corresponding author.

Acknowledgments

This work was supported by the Characteristic Innovation Project of Guangdong Colleges and Universities in China (2020KTSCX345).

Conflicts of Interest

The authors declare no conflict of interest.

Nomenclature

BATBattery
DGDistribution grid
DSRDemand side response
EMSEnergy management strategy
MGMicrogrid
MILPMixed-integer linear program
NINon-interruptible electrical loads
PVPhotovoltaic
SDShiftable disturbed electrical load
SUShiftable undisturbed electrical load
WGWind generator
Parameters and Variables
c b ( t ) Electricity price purchased in t period
c s ( t ) Electricity price sold in t period
d ( t ) Actual consumption load in t period
d 0 ( t ) Load to be consumed in t period
FThe total operating cost of MG
MAll devices of microgrid
nThe number of users
P b ( t ) Electricity purchased in t period
P ES , ch t Charging power of the energy storage device
P ES , dis t Discharging power of the energy storage device
P l a ( t ) Load at time t
P l b ( t ) Load of NI equipment at time t
P l c ( t ) Load of SD equipment at time t
P l i Load of the i-th user
P m ( t ) Output power of the m-th equipment in microgrid at time t
P PV Power output by solar panels
P PVr Rated power under standard conditions
P r i ( t ) Load probability of the i-th user
P r w Rated output power of the wind turbine
P s ( t ) Electricity sold in t period
S I Solar irradiance
TWorking time
U EQ Cost of equipment maintenance
U SL Cost of satisfaction loss
v in c Speed of starting the wind turbine
v out c Speed of stopping the wind turbine
v rated c Rated speed of the wind turbine
v ( t , s ) Wind speed at time t and scenario s
W ES t Electric energy at the time t
α , β Loss parameter
α C Temperature coefficient
τ a Ambient temperature
τ p Panel temperature
η Efficiency
θ User satisfaction
γ m Loss coefficient of the m-th equipment
ε i ( t ) Binary variable

References

  1. Li, G.; Zhang, R.; Jiang, T.; Chen, H.; Bai, L.; Cui, H.; Li, X. Optimal dispatch strategy for integrated energy systems with CCHP and wind power. Appl. Energy 2016, 192, 408–419. [Google Scholar] [CrossRef]
  2. Hussain, N.; Nasir, M.; Vasquez, J.C.; Guerrero, J.M. Recent Developments and Challenges on AC Microgrids Fault Detection and Protection Systems–A Review. Energies 2020, 13, 2149. [Google Scholar] [CrossRef]
  3. Obara, S.Y.; Fujimoto, S.; Sato, K.; Utsugi, Y. Planning renewable energy introduction for a microgrid without battery storage. Energy 2020, 215, 119176. [Google Scholar] [CrossRef]
  4. Beus, M.; Banis, F.; Pandžić, H.; Poulsen, N.K. Three-level hierarchical microgrid control-model development and laboratory implementation. Electr. Power Syst. Res. 2020, 189, 106758. [Google Scholar] [CrossRef]
  5. Hu, M.; Wang, Y.W.; Xiao, J.W.; Lin, X. Multi-energy management with hierarchical distributed multi-scale strategy for pelagic islanded microgrid clusters. Energy 2019, 185, 910–921. [Google Scholar] [CrossRef]
  6. Ma, T.; Wu, J.; Hao, L.; Li, D. Energy flow matrix modeling and optimal operation analysis of multi energy systems based on graph theory. Appl. Therm. Eng. 2019, 146, 648–663. [Google Scholar] [CrossRef]
  7. Chicco, G.; Mancarella, P. Matrix modelling of small-scale trigeneration systems and application to operational optimization. Energy 2009, 34, 261–273. [Google Scholar] [CrossRef]
  8. Giaouris, D.; Papadopoulos, A.I.; Ziogou, C.; Ipsakis, D.; Voutetakis, S.; Papadopoulou, S.; Seferlis, P.; Stergiopoulos, F.; Elmasides, C. Performance investigation of a hybrid renewable power generation and storage system using systemic power management models. Energy 2013, 61, 621–635. [Google Scholar] [CrossRef]
  9. Li, X.; Guo, L.; Wang, C.; Li, Y.R. Key technologies of DC microgrids: An overview. Proc. CSEE 2016, 36, 2–17. (In Chinese) [Google Scholar]
  10. Zhao, B.; Conejo, A.J.; Sioshansi, R. Unit commitment under gas-supply uncertainty and gas-price variability. IEEE Trans. Power Syst. 2017, 32, 2394–2405. [Google Scholar] [CrossRef]
  11. Farzin, H.; Fotuhi-Firuzabad, M.; Moeini-Aghtaie, M. A Stochastic Multi-Objective Framework for Optimal Scheduling of Energy Storage Systems in Microgrids. IEEE Trans. Smart Grid 2017, 8, 117–127. [Google Scholar] [CrossRef]
  12. Hussain, A.; Bui, V.-H.; Kim, H.-M. A Resilient and Privacy-Preserving Energy Management Strategy for Networked Microgrids. IEEE Trans. Smart Grid 2018, 9, 2127–2139. [Google Scholar] [CrossRef]
  13. Cagnano, A.; Bugliari, A.C.; De Tuglie, E. A cooperative control for the reserve management of isolated microgrids. Appl. Energy 2018, 218, 256–265. [Google Scholar] [CrossRef]
  14. Yu, W.W.; Liu, S.L.; Chen, Q.G.; Zhang, C. Multi-objective optimization scheduling method for photovoltaic based micro-grid considering demand side management. Acta Energ. Sol. Sin. 2017, 38, 2972–2981. [Google Scholar]
  15. Zhang, F.; Yang, Z.; Zhang, L.; Xu, Z. Optimal Operation of Islanded Micro Energy Grid With Multi-type Demand side responses. Power Syst. Technol. 2020, 44, 547–557. [Google Scholar]
  16. Fu, Y.; Wu, Q.; Sun, X.; Zhang, X. Virtual energy storage and partition operation control technology in DC microgrid. t. Acta Energ. Sol. Sin. 2020, 41, 319–328. [Google Scholar]
  17. Rezaei, N.; Ahmadi, A.; Deihimi, M. A Comprehensive Review of Demand-Side Management Based on Analysis of Productivity: Techniques and Applications. Energies 2022, 15, 7614. [Google Scholar] [CrossRef]
  18. Rodrigues, L.S.; Marques, D.L.; Ferreira, J.A.; Costa, V.A.F.; Martins, N.D.; Neto Da Silva, F.J. The Load Shifting Potential of Domestic Refrigerators in Smart Grids: A Comprehensive Review. Energies 2022, 15, 7666. [Google Scholar] [CrossRef]
  19. Silvente, J.; Aguirre, A.M.; Zamarripa, M.A.; Méndez, C.A.; Graells, M.; Espuña, A. Improved time representation model for the simultaneous energy supply and demand management in microgrids. Energy 2015, 87, 615–627. [Google Scholar] [CrossRef] [Green Version]
  20. Bibi, R.; Khan, I.; Sumaira; Rong, Z.; Sadiq, F.; Oanh, L.T.K. The nexus between energy consumption, carbon dioxide emission and technological innovation in the Global panel: Evidence from Panel quantile regression. J. Technol. Innov. Energy 2022, 1, 1–9. [Google Scholar] [CrossRef]
  21. Bukar, A.L.; Tan, C.W.; Lau, K.Y. Optimal sizing of an autonomous photovoltaic/wind/battery/diesel generator microgrid using grasshopper optimization algorithm. Sol. Energy 2019, 188, 685–696. [Google Scholar] [CrossRef]
  22. Soroudi, A. A Probabilistic Modeling of Photo Voltaic Modules and Wind Power Generation Impact on Distribution Networks. IEEE Syst. J. 2012, 6, 254–259. [Google Scholar] [CrossRef] [Green Version]
  23. Jiang, Y.; Guo, L. Research on Wind Power Accommodation for an Electricity-heat-gas Integrated Microgrid System with Power-to-Gas. IEEE Access 2019, 7, 87118–87126. [Google Scholar] [CrossRef]
  24. Chen, B.; Sun, H.; Chen, Y. Energy circuit theory of integrated energy system analysis(I): Gaseous circuit. Proc. CSEE 2020, 40, 436–444. (In Chinese) [Google Scholar]
  25. Giaouris, D.; Papadopoulos, A.; Patsios, C.; Walker, S.; Ziogou, C.; Taylor, P.; Voutetakis, S.; Papadopoulou, S.; Seferlis, P. A systems approach for management of microgrids considering multiple energy carriers, stochastic loads, forecasting and demand side response. Appl. Energy 2018, 226, 546–559. [Google Scholar] [CrossRef]
  26. Chen, J.J.; Qi, B.X.; Rong, Z.K.; Peng, K.; Zhao, Y.L.; Zhang, X.H. Multi-energy coordinated microgrid scheduling with integrated demand side response for flexibility improvement. Energy 2021, 217, 119387. [Google Scholar] [CrossRef]
  27. Kaluthanthrige, R.; Rajapakse, A.D.; Lamothe, C.; Mosallat, F. Optimal Sizing and Performance Evaluation of a Hybrid Renewable Energy System for an Off-Grid Power System in Northern Canada. Technol. Econ. Smart Grids Sustain. Energy 2019, 4, 24–30. [Google Scholar] [CrossRef] [Green Version]
  28. Li, P.; Wang, H.; Zhang, B. A Distributed Online Pricing Strategy for Demand side response Programs. IEEE Trans. Smart Grid 2017, 10, 350–360. [Google Scholar] [CrossRef]
  29. Shi, Q.; Jiang, Q. Real-time optimal energy dispatch for microgrid with battery storage. Electr. Power Autom. Equip. 2013, 33, 76–82. [Google Scholar]
Figure 1. Schematic of the microgrid.
Energies 15 08431 g001
Figure 2. Energy circuit diagram.
Energies 15 08431 g002
Figure 3. Signal flow diagram.
Energies 15 08431 g003
Figure 4. Binomial distribution probability.
Energies 15 08431 g004
Figure 5. Maximum probability curve of binomial distribution with different p values.
Energies 15 08431 g005
Figure 6. Energy exchange sequence.
Energies 15 08431 g006
Figure 7. The flow chart of DSR.
Energies 15 08431 g007
Figure 8. Loads, output powers of PV and WT.
Energies 15 08431 g008
Figure 9. Power loads before and after DSR.
Energies 15 08431 g009
Figure 10. The optimal power results before and after DSR. (a) The optimal power results before DSR. (b) The optimal power results after DSR.
Energies 15 08431 g010
Table 1. Parameters of disturbed loads.
Load GroupNumberPower (kW)Probability
1301.51–7: 0.9, other times: 0.1
220212–15: 0.7, other times: 0.5
3101.80.3
Table 2. Parameters of shiftable undisturbed loads.
Loads Rated Power (kW)Working Hours (h)Working Interval
washing machine0.62[10, 18]
dish-washing machine0.82[19, 24]
electric cooker112[8, 12]
Table 3. Electricity prices in different time periods.
The PeriodsPurchasing Electric Price ($/kWh)Selling Electric Price ($/kWh)
Peak (11–13, 19–21)0.1360.108
Flat (8–10, 16–18, 21–24)0.0880.070
Valley (1–7)0.0410.036
Table 4. Operation costs of EMS in two cases.
Cost of Electricity ($)Revenue ($)Cost of Equipment ($)Cost of DR ($)Total Cost ($)
Case 1673.3437.7143.60379.2
Case 2654.5464.9149.39.2348.1
Table 5. Operation time of the shiftable and undisturbed loads.
Loads Start TimeClose Time
washing machine16:0018:00
dish-washing machine22:0024:00
electric cooker8:009:00
Table 6. Transferring results of disturbed loads.
Load GroupClose TimeStart PeriodsThe Closed Number
111:001:00–7:003, 4, 5, 6, 7, 8, 9
213:001:00–7:008, 9, 10, 11, 12
318:001:00–7:00all
Publisher’s Note: MDPI stays neutral with regard to jurisdictional claims in published maps and institutional affiliations.