Article

Optical Evaluation of Effects of Energy Substrates on PHB Accumulation for Bioplastic Production

by
Alicja Staśczak
1,
Hanna Langer-Macioł
1,
Karolina Widzisz
1,
Wiktoria Śliwińska
1,
Kinga Lucińska
1,
Przemysław Wencel
1,
Barbara Strózik
1,
Mariusz Frąckiewicz
2,
Piotr Skupin
1,*,
Dariusz Choiński
1 and
Sebastian Student
3
1
Department of Automatic Control and Robotics, Silesian University of Technology, Akademicka 16, 44-100 Gliwice, Poland
2
Department of Data Science and Engineering, Silesian University of Technology, Akademicka 16, 44-100 Gliwice, Poland
3
Biotechnology Center, Silesian University of Technology, Krzywoustego 8, 44-100 Gliwice, Poland
*
Author to whom correspondence should be addressed.
Energies 2022, 15(22), 8390; https://doi.org/10.3390/en15228390
Submission received: 11 October 2022 / Revised: 7 November 2022 / Accepted: 7 November 2022 / Published: 10 November 2022
(This article belongs to the Special Issue Advanced Wastewater Treatment and Biomass Energy)

Abstract

:
To date, hundreds of millions tons of plastics has been produced worldwide. Their production and disposal are associated with high pollution and carbon release into the atmosphere. A more environmentally friendly alternative is bioplastics, and the most popular is polyhydroxybutyrate (PHB) polymer. Large amounts of PHB can be obtained from activated sludge where used cooking oil or other industrial waste can be used as potential substrates. In this work, efficient bioplastic production strategies are studied, and the considered substrate is a mixture of oil and peptone. Pseudomonas fluorescens bacteria are used to accumulate PHB, and the cultivation of microorganisms is carried out in batch and continuous-flow bioreactors. Microscopic observations and laboratory essays are performed to confirm presence of PHB and other key parameters. The obtained results allow us to determine the optimal feeding strategy.

1. Introduction

Plastic has become an integral part of our lives due to its practical properties. Although plastic has many advantages, it decomposes very slowly, which is a major reason for its accumulation in the environment. Plastic is used in almost all industrial sectors [1]. In 2015, most of the material (141 million tons) was produced for packaging purposes [2]. In the seas and oceans, plastic waste is a serious threat to marine animals. Currently, environmental contamination and, in particular, energy transformation related to the reduction in carbon dioxide emissions are closely associated with economic activity. Therefore, problems with the global environment and waste treatment have generated considerable interest in biodegradable plastics [3]. One of them is polyhydroxybutyrate (PHB), which is the most commonly synthesized form of polyhydroxyalkanoate (PHA). Its great advantage is its short decomposition time of only 60 days in industrial compost [4], whereas conventional plastic may not decompose for up to several hundred years.
PHA synthesized by microorganisms has a wide range of potential uses as a biodegradable plastic with thermoplastic properties, e.g., softness and reversible deformation. One of the major problems hindering profitable PHA production is the cost of carbon substrate. To minimize the cost and consumption of energy in bioplastic production, large amounts of PHA can be obtained from activated sludge and other mixed microbial cultures [5,6], where food wastes (e.g., cooking oil or other inexpensive waste material from industry) can be used as potential substrates. This is especially crucial for wastewater treatment plants, as the removal of fats from wastewater generates higher costs and consumes more energy. Therefore, the PHA obtained during biosynthesis is an environmentally friendly alternative to traditional plastics production. The application of used cooking oil or other industrial waste as a substrate makes it possible to create a regenerative system. This allows for raw material consumption to be reduced and waste to be minimized, but also reduces emissions and energy losses.
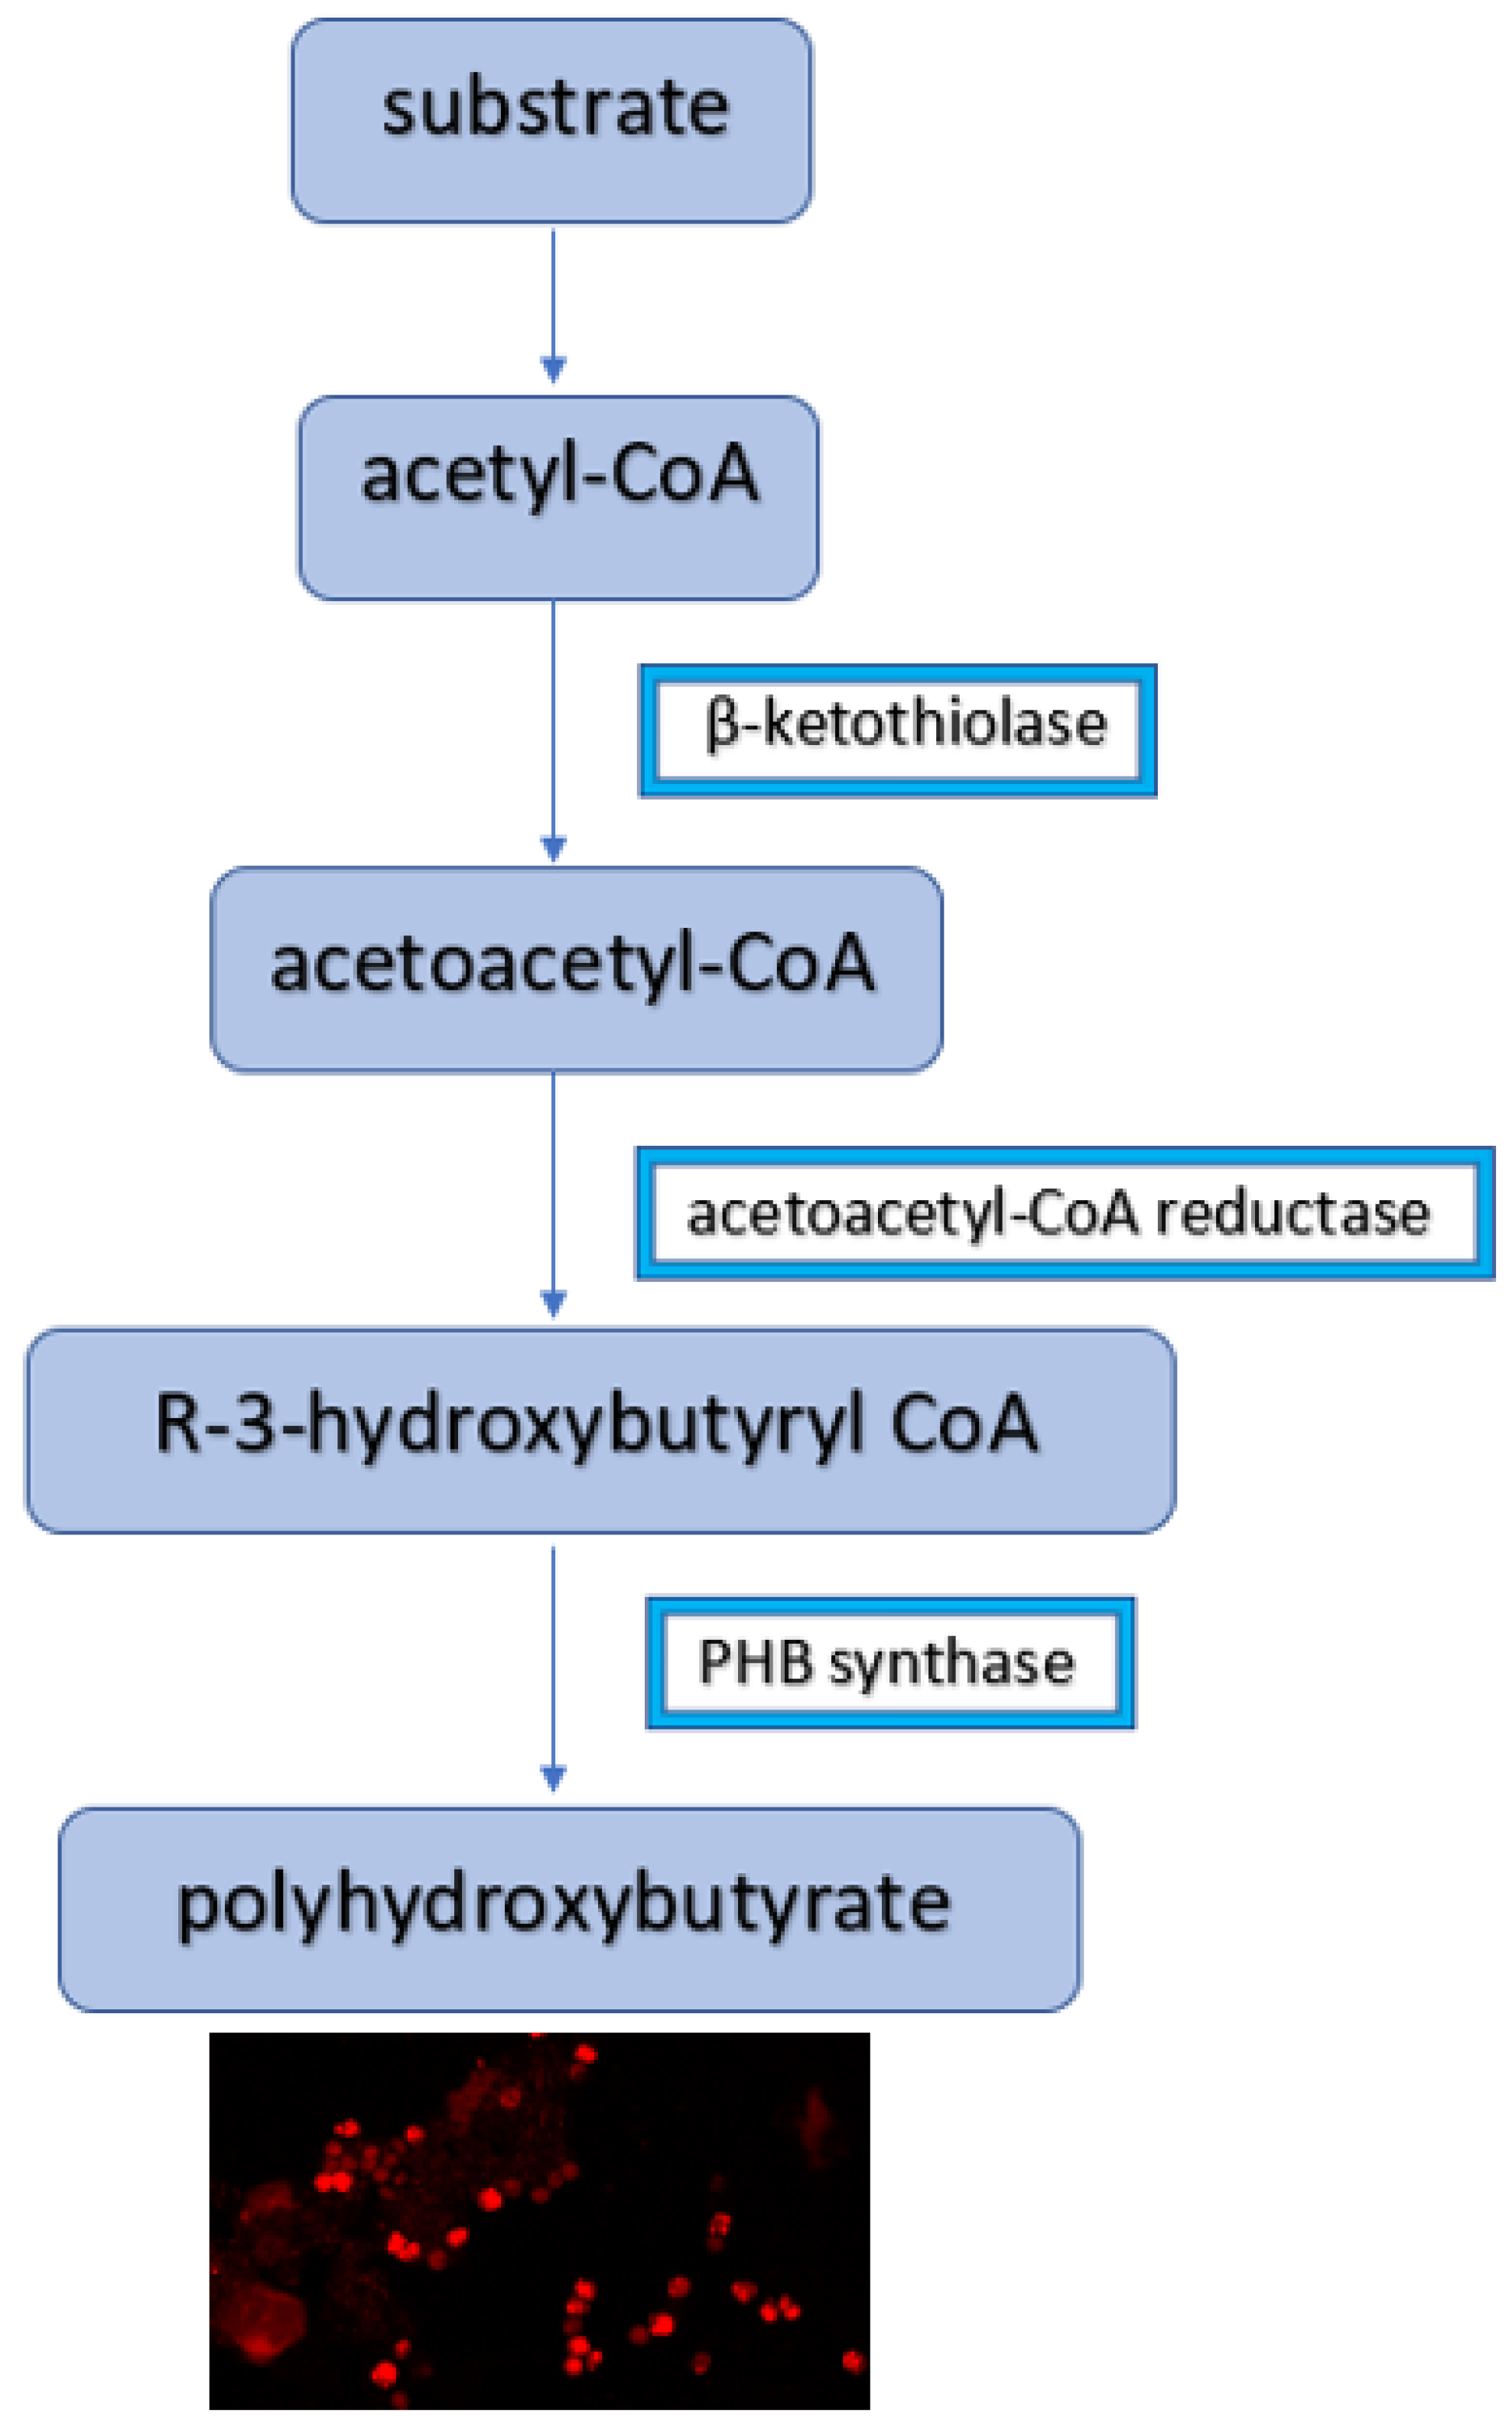
The cultivation of microorganisms that have high PHB accumulation capabilities usually takes place in continuous-flow bioreactors. Then, under stressful conditions, the microorganisms produce PHB as a reserve material. The individual steps in the polymer biosynthesis are shown in Figure 1.
The cultivation of microorganisms is started in a batch bioreactor; then, the culture is transferred to a continuous-flow bioreactor where the microorganisms are fed with oil and/or peptone. The oil consists of fatty acid esters, which makes it difficult for bacteria to access the peptone particles that are a sole carbon source. The limited nutrient access creates physiological stress conditions for microorganisms, and this leads to the higher accumulation of PHB in the microorganism cells. On the other hand, microorganisms require some access to the carbon source to maintain their growth. Thus, the effective production of PHB requires the development of a methodology for the cultivation of the microorganisms, as well as tools for controlling a bioreactor and assessing the production effectiveness.
Different approaches to microorganism, nutrient medium, and culture condition selection are reported in the literature. One example is the use of the microalgae Chlorella sp. and an anaerobic fermentation fluid with high content of volatile fatty acids (VFAs), which is one of the best substrates for PHB recovery [12]. Another approach is the use of CO2 as a carbon source and sulfur as an energy substance [13]. This has worked for Gram-negative aerobic heterotrophic bacteria of the species Acidiphilium cryptum. Additionally, it was shown that supplementing the medium with glucose can improve the growth of microorganisms. Peptone is also a popular component that is used in many ways. In studies on PHB production by Bacillus spp. [14], peptone was the main nitrogen source, while carbon was provided by glucose. In this case, attention was drawn to the importance of ensuring optimal conditions for the entire process. The results have shown that the environmental conditions play a crucial role in the optimization of PHB production.
In this study, we used Pseudomonas fluorescens bacteria, which are Gram-negative aerobic rods with a high capability of PHB accumulation and secretion of a fluorescent pigment which enables their observation under UV light [15]. Due to their ability to carry out the denitrification process and lipolysis, Pseudomonas fluorescens can be used in wastewater treatment plants [16,17]. Staining microscopic techniques in conjunction with digital microscopic image analysis were developed and applied to determine the amount of PHB in activated sludge. The major goal of this work was to study the effect of substrate composition on the accumulation of PHB by Pseudomonas fluorescens.

2. Materials and Methods

2.1. Cultivation of Microorganisms—Environmental Conditions

Two bioreactors operated in batch and continuous modes of operation were used during the research. The continuous culture was started 30 days later after transferring microorganisms from the batch bioreactor. The batch bioreactor, in which the fed-batch culture was carried out (periodic exchange of metabolites and nutrient supply), was equipped with a mechanical agitator and an aeration system providing comparable oxygen and nutrients amounts in the entire volume.
Each day, the activated sludge in the batch bioreactor was decanted, and the supernatant was taken for further analysis. The volume in the reactor vessel was kept constant by replenishing the mixture with fresh water and nutrient. The continuous culture was carried out in a five-liter Sartorius Biostat A+ bioreactor with a heating blanket and computer-based control equipment including level, dissolved oxygen, pH, and temperature sensors. The continuous flow was maintained by using the pump system: a substrate (SUBST) pump—for feeding the substrate; a foam/level (FO/LE) pump—for draining the liquid; and the air pump—for aeration. To control process parameters, PC-Panel μDCU software was used based on the observations made in the batch bioreactor. The measurement data from the continuous bioreactor were collected and visualized by using a dedicated software created in LabVIEW environment. The pH = 7 was kept constant by supplying a buffer solution, and the temperature was kept at 30 °C, which falls into an optimal range for Pseudomonas fluorescens [4]. Decreasing the temperature below 30 °C decreases the activity of enzymes.
The synthesis process and subsequent degradation of metabolic secondary products are cyclical mechanisms that occur in many bacteria [18]. The cultivation of microorganisms under stressful conditions promotes the conversion of intracellular metabolites into PHB, and in the presence of fatty acids, one can observe an increase in the lipase activity. If the lipase level is too low, the conversion of the fatty acids into PHB is not possible. Therefore, the nutrient is composed of peptone and oil in different proportions. In our case, the peptone was a sole carbon source, and the addition of oil that contains fatty acid esters created stressful conditions by preventing the microorganisms from accessing the carbon source. The medium composition was analyzed daily by determining the ammoniacal nitrogen, chemical oxygen demand, and lipase activity.

2.2. The Laboratory Analyses—Evaluation of the Culture Condition

Various macromolecules and metabolites are formed after the transport of substrates into the microorganism cells (Figure 2). Undesirable effects are caused by high concentrations of ammonium ions and ammonia. As in the high salt concentrations case, the high ammonium ion content in the medium rises osmotic stress. This results in a change in osmotic pressure inside the bacterial cell [19]. To function properly, the cells must maintain osmotic homeostasis to keep internal turgor pressure, which is necessary for growth. The ammonium ions present in the bacteria environment result in a cell turgor reduction, disturbances in the ion balance, and cytoplasm compaction. Then, the cell shrinks and dies [20]. Due to its small size, ammonia can penetrate the lipid bilayer of the bacterial cell membrane and increase the pH of the microorganisms. To maintain homeostasis, it is necessary to transport hydrogen ions from the external environment into the bacteria. This is accompanied by the potassium ions’ export, where the potassium pump’s work is disturbed, and respiratory activity is limited [20]. During the organic nitrogen decomposition, ammonia is formed in the bioreactor. The increase in the ammoniacal nitrogen concentration is caused by the peptone which contains organic nitrogen in large amounts. To reduce it, the NH3 content was determined by the Nessler method. Depending on the NH3 content, it was possible to estimate the amount of liquid that must be replaced with fresh water. The measurements were performed at a wavelength of 425 nm [21]. Systematic measurements were necessary to keep the microbial culture in good condition.
The determination of chemical oxygen demand (COD) by the dichromate method was performed to control the nutrient consumption in the bioreactor. The procedure was carried out with the potassium dichromate (K2Cr2O7) used at 150 °C and acidic environment. Ag2SO4 and HgSO4 were included in the reaction mixture. Silver (I) sulfate was a catalyst for the oxidation reaction, while the mercury (II) sulfate reduced measurement disturbances resulting from the presence of chlorides in the tested sample [22]. Measurements were made for a sample treated with an ultrasonic homogenizer in 1:2 or 1:4 dilutions using distilled water and bioreactor filtrate. The samples were left in the mineralizer for 90 min at 150 °C. The potassium dichromate reduction degree was determined by a colorimetric method, detecting the Cr3+ ions (green color) at 620 nm wavelength and the Cr6+ ions reduction (yellow color) at 420 nm wavelength [23]. When the measured value was over-range, the analysis was performed again, and the sample dilution was increased up to ten times.
Lipase activity was determined to identify the substrate degree consumption. These enzymes are responsible for fat digestion [24]. The lipase activity was measured spectrophotometrically in a thermostated cuvette. The nutrient medium used was a mixture of olive oil providing 33,890 kJ (8240 kcal) and peptone 81 6kJ. The lipase activity was determined by using p-nitrophenyl laurate (pNPL), and its reaction in an aqueous solution with the lipase acting as a catalyst can be described as follows:
1 pNPL + 3 H 2 O   lipase   1 pNP + fatty   acid
The maximum absorption for p-nitrophenyl laurate (pNPL) was observed at around 290 nm wavelength, while for p-nitrophenol (pNP), the maximum was observed at 410 nm wavelength. The measurements were taken at 15 min intervals to demonstrate the reaction progress. An increase in absorbance at 410 nm was interpreted as the product hydrolysis, and a decrease in absorbance at 290 nm was understood as substrate consumption. Then, the lipase activity was determined by calculating the time derivative of the product concentration.
The above-mentioned indicators were the basis for making decisions about the nutrient composition. High COD and significant lipase activity were interpreted as a large amount of organic substances and undecomposed oil in the reactor. In this case, more peptone was fed into the reactor. Nitrogen measurement provided information on the microorganism survival rate. Low ammoniacal nitrogen concentrations signaled the progressive dying out of the culture. It manifested itself with lower nutrient degradation. To avoid complete bacteria extinction, the nutrient dose was increased.
In order to determine biomass concentration, a sample was taken from the bioreactor and filtered. A moisture analyzer was used to perform the measurement. The result was strongly dependent on the nutrient composition.

2.3. Analysis of Microscopic Images

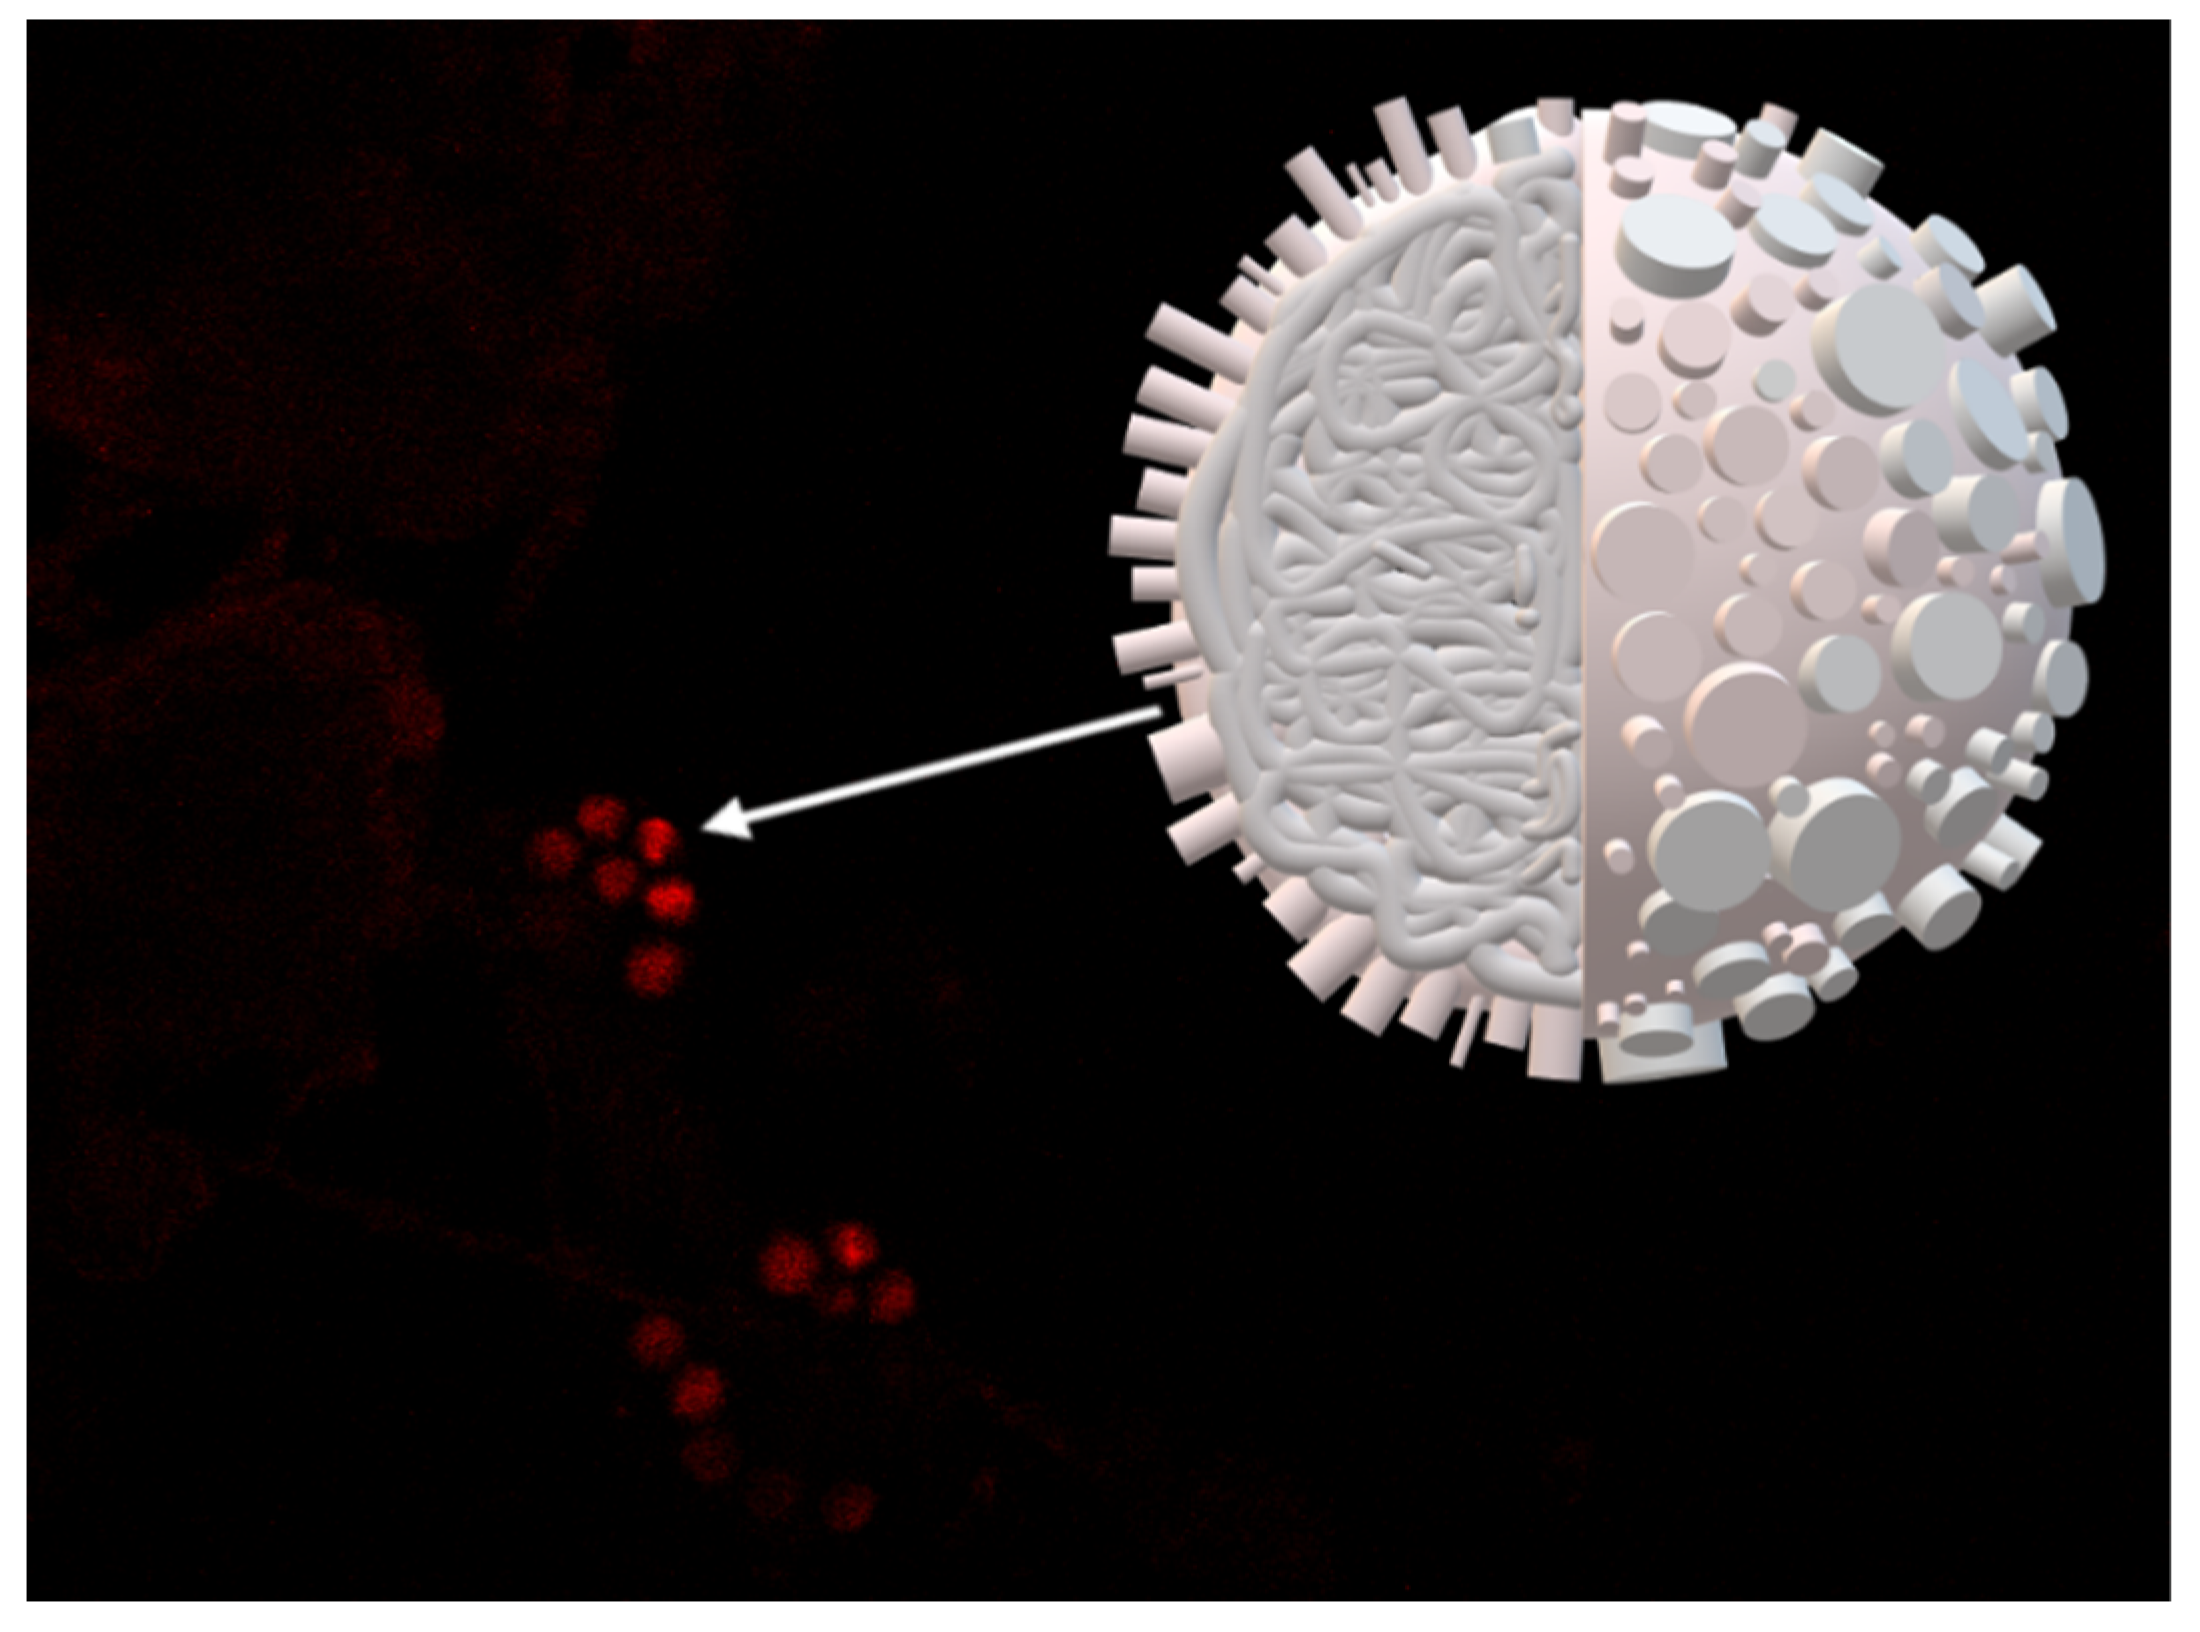
Samples taken from the bioreactors were also prepared for observations under fluorescence and confocal microscopy. A single granule mainly consists of PHB, PHA polymerase, PHA depolymerase, and a phospholipid monolayer (Figure 3). Their detection was possible by developing two staining procedures: Sudan III and Nile Blue A. Sudan III is a nonpolar, fat-soluble dye that forms hydrophobic interactions with the hydrocarbon lipid chains, staining them red [25]. The procedure involved a generous application of the substance and leaving the sample in a humid chamber for 30 min. The staining allowed for the identification of lipids, triglycerides, and lipoproteins [26]. Nile Blue A is a water-soluble fluorescent dye from the oxazine group. The methodology involved 10 min incubation of the samples in a Coplin staining jar placed in an incubator set at 50 °C. Removing excess dye was very essential for both procedures. As the Nile Blue A dyeing procedure turned out to be very effective in our case, it was decided to only use Sudan III procedure for checking the results obtained from the Nile Blue A. Each day, the microscopic images were analyzed to confirm PHB presence in the reactor.
The acquired photos were used to create an algorithm that determines the percentage amount of PHB in an observed area. The algorithm not only provides information on the percentage amount of polymer, but also a processed image with identified PHB granules with marked contours around them. The algorithm also returns a histogram showing the percentage area of identified objects (PHB granules) and their number with marked mean, standard deviation, and median.

3. Results

3.1. Batch and Continuous-Flow Bioreactors

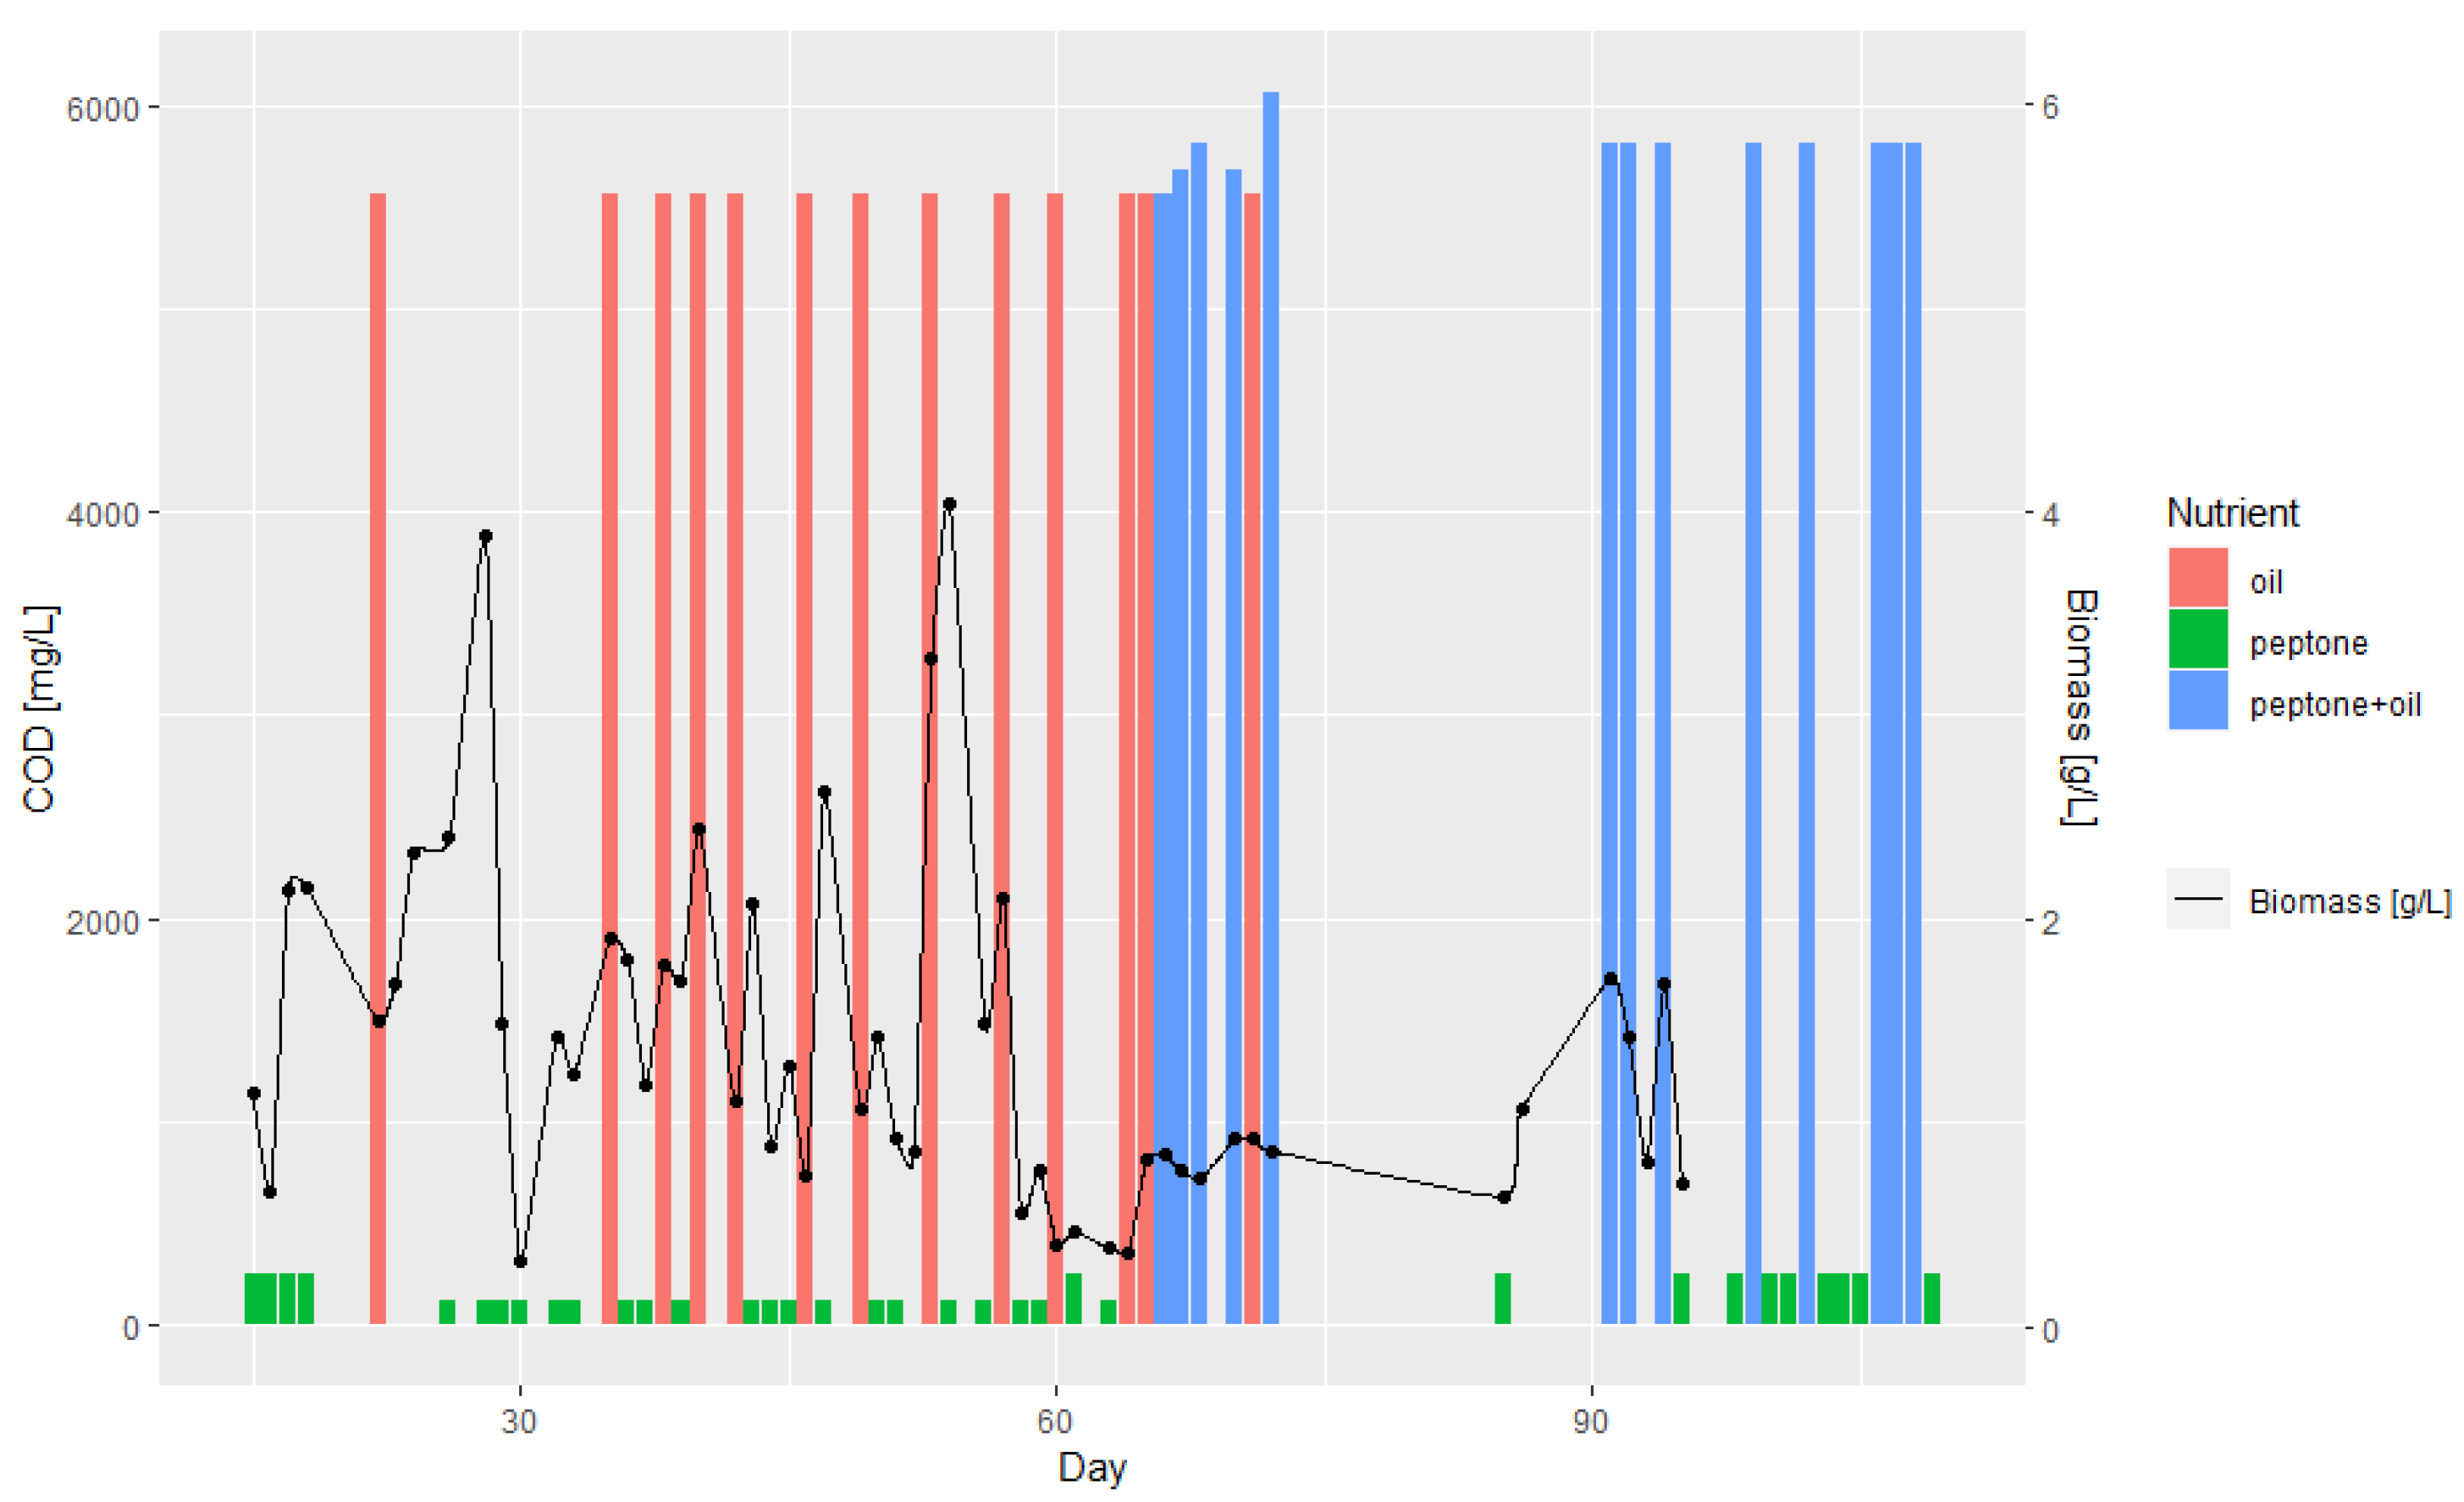
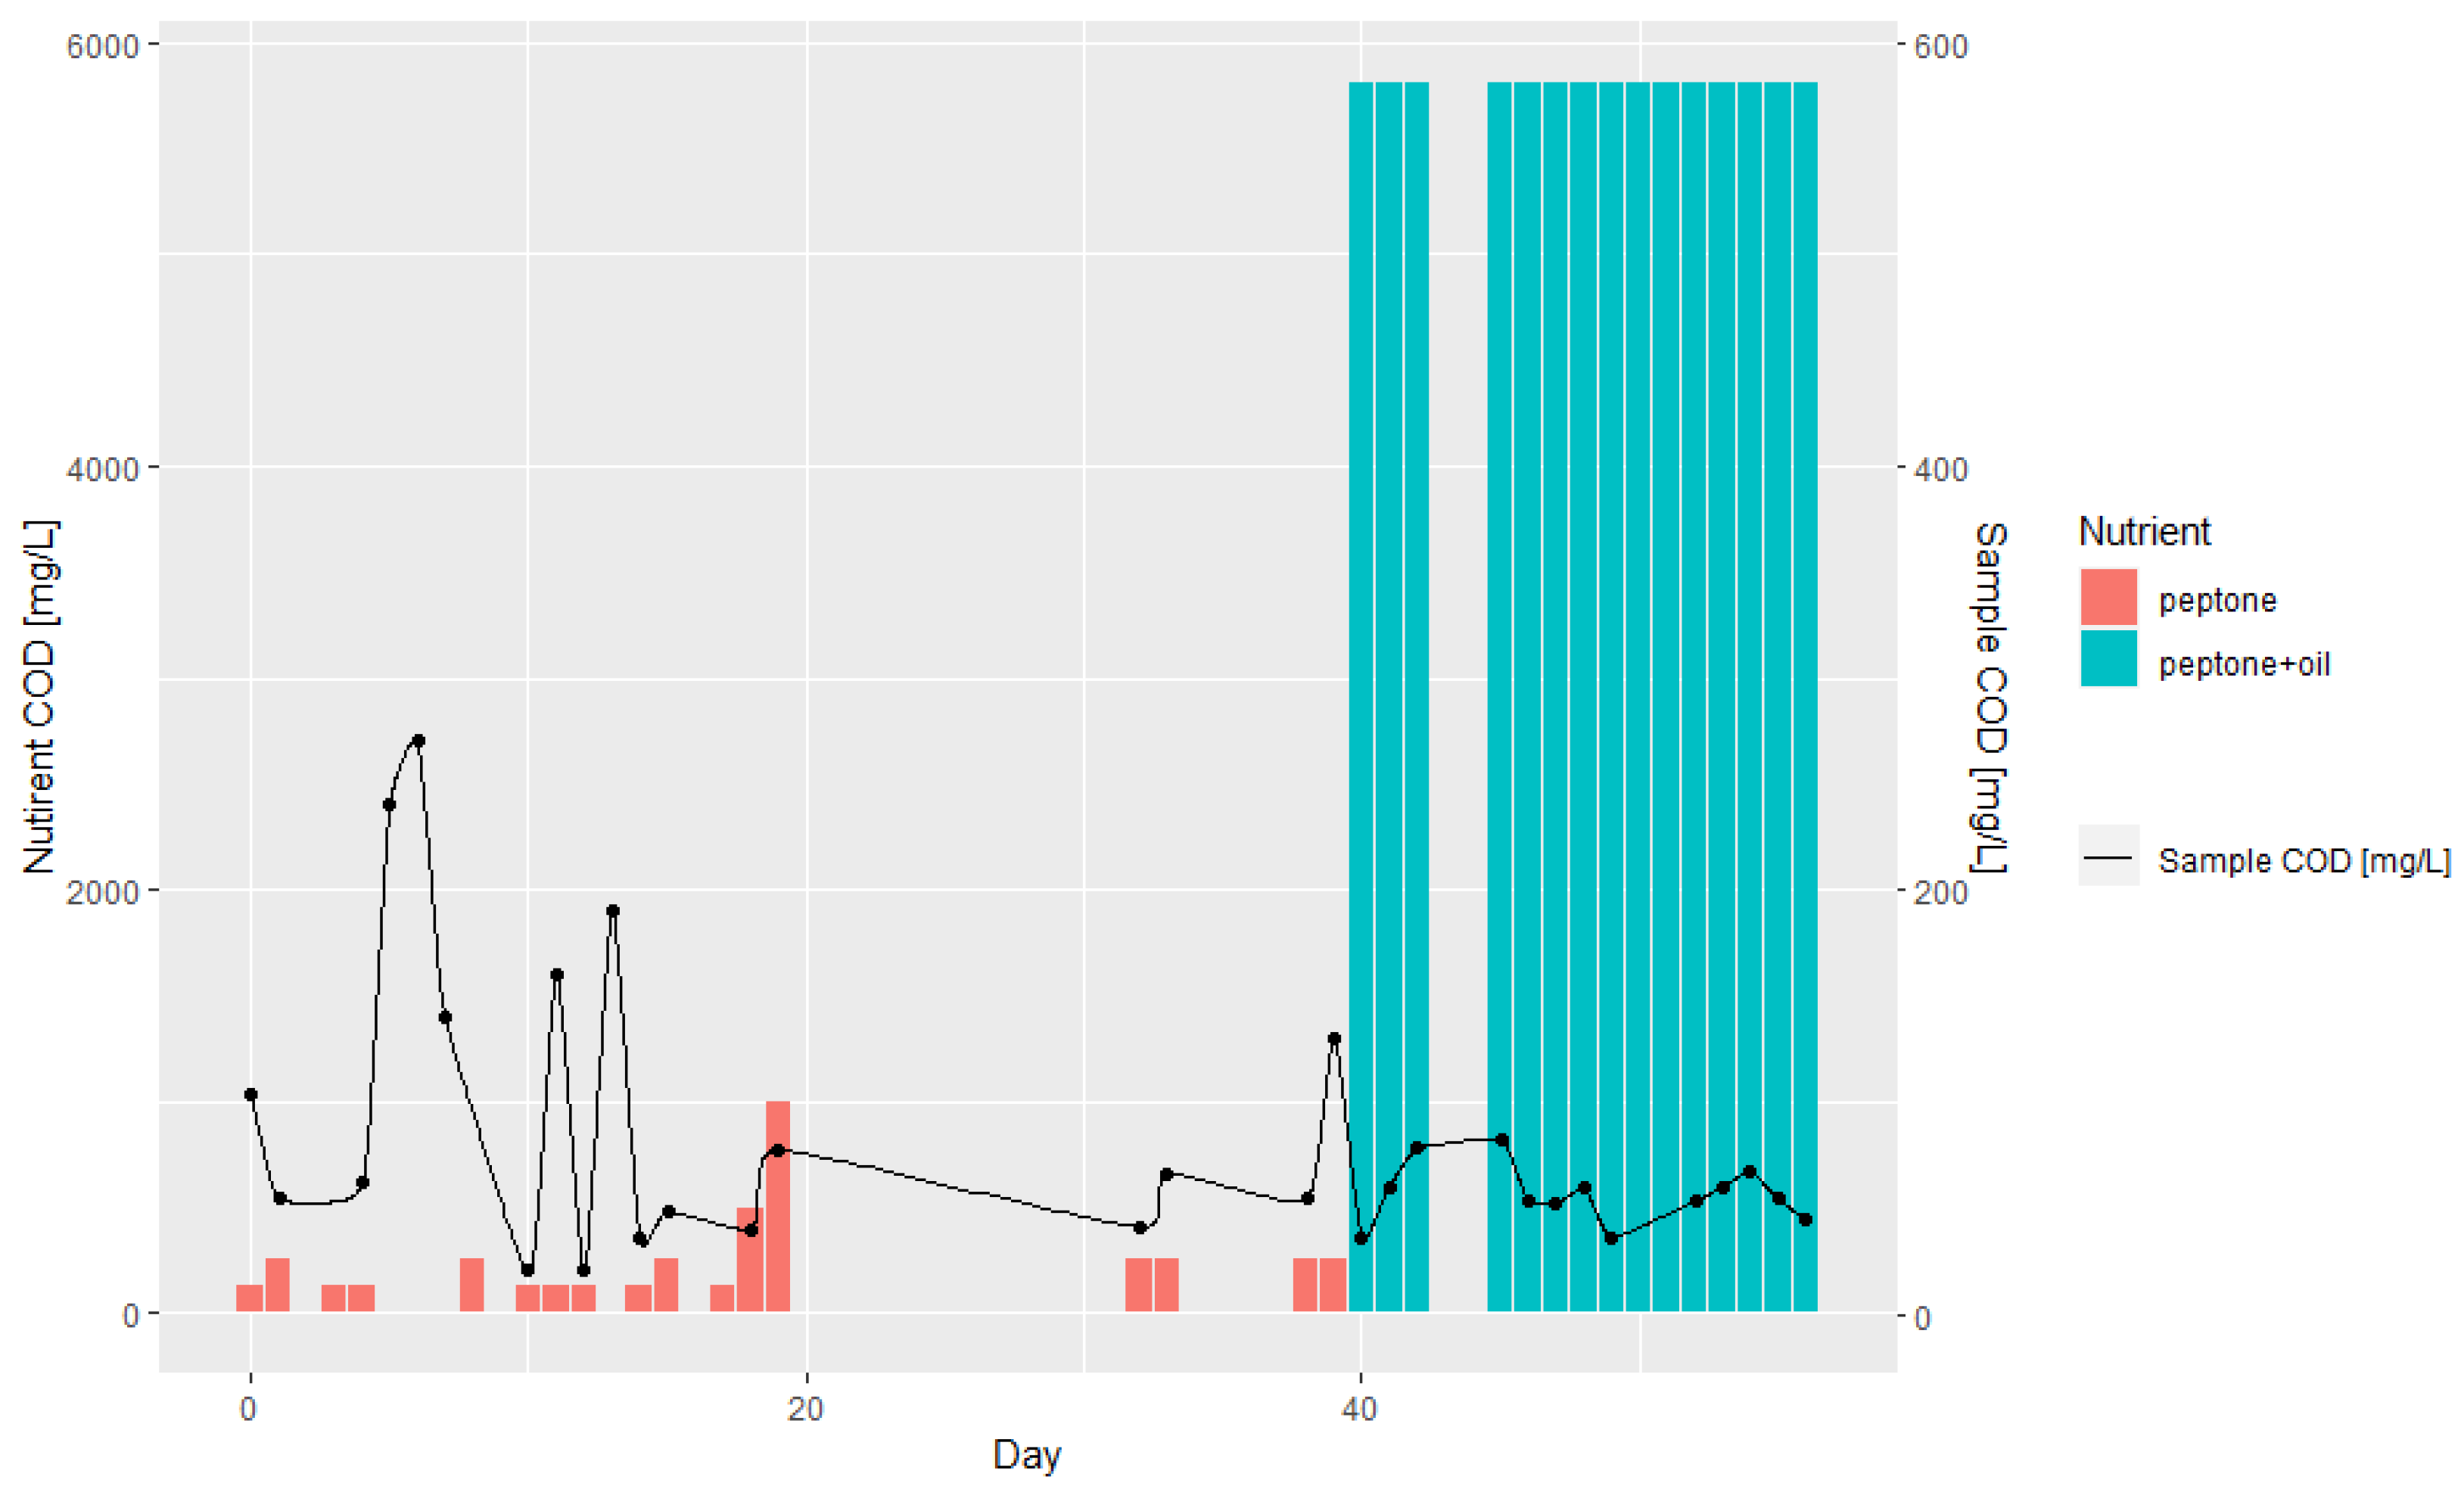
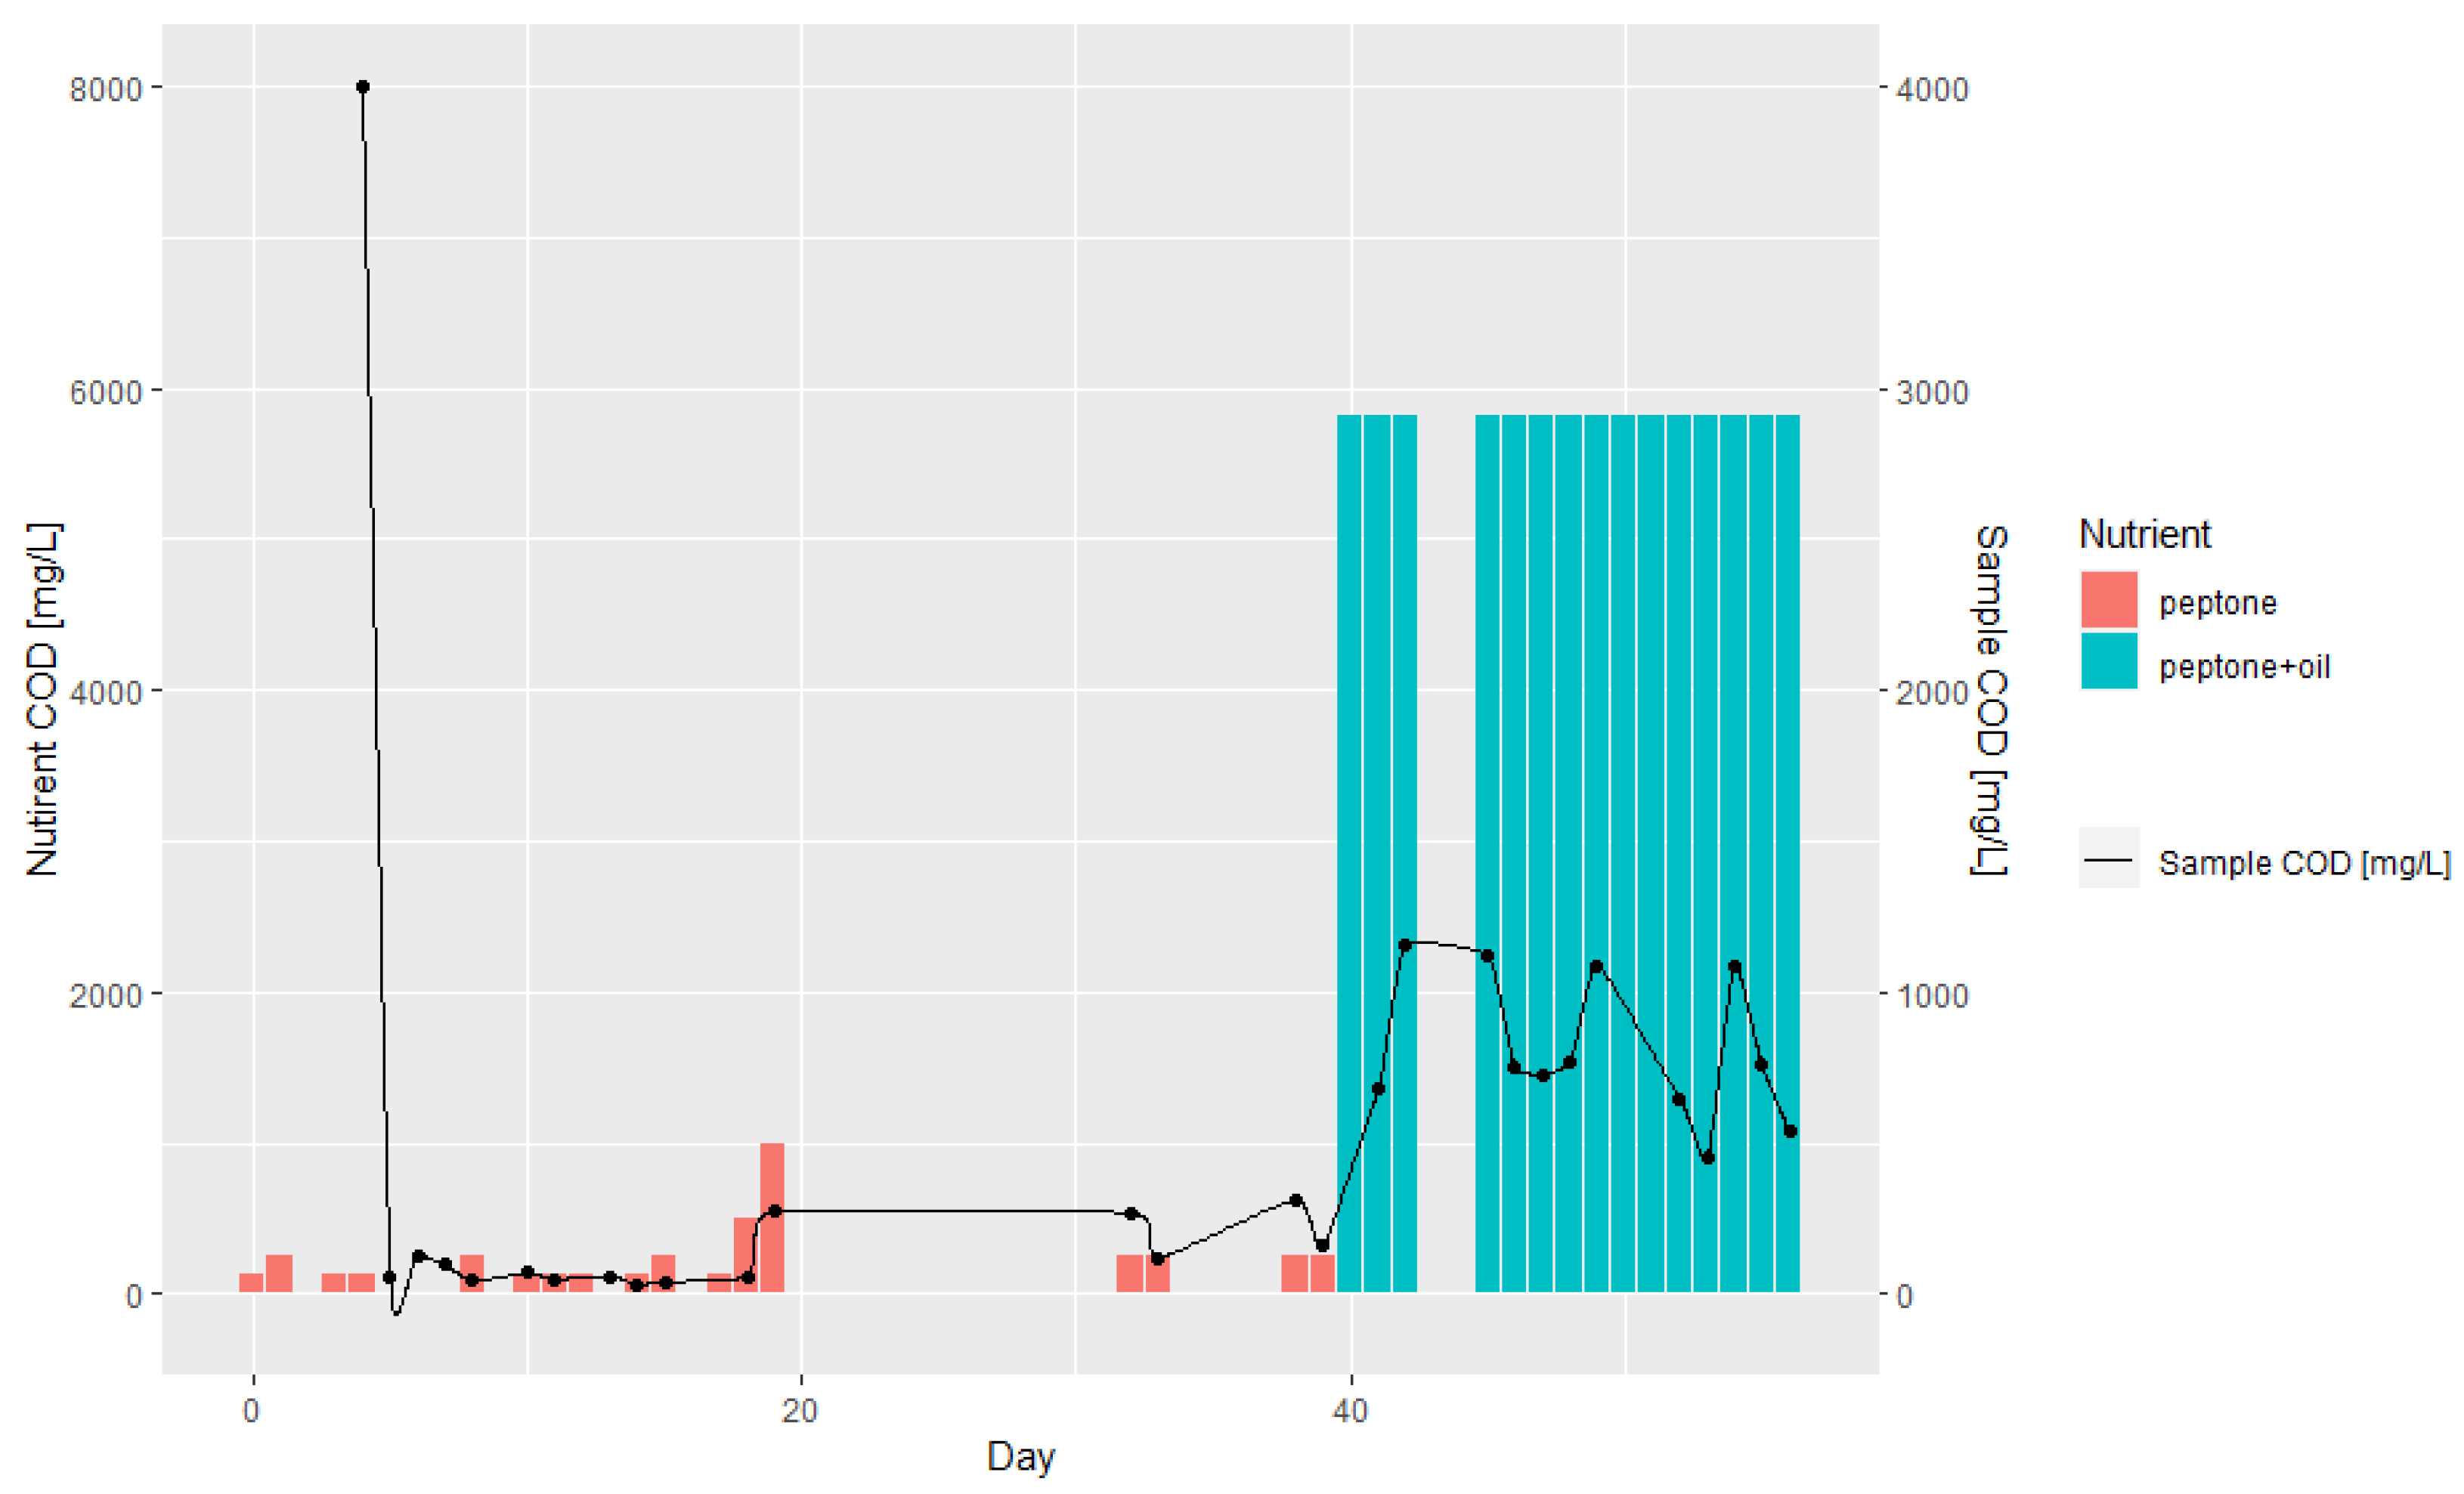
Month-long observations for the batch reactor provided information on the optimal conditions and composition of nutrient (Figure 4, Figure 5 and Figure 6). The algorithm for microscopic image analysis was used to visualize the results, which improved further planning of cultivation stages. After 30 days, the continuous-flow bioreactor was started and operated in parallel with the batch bioreactor. The reactor operating cycle was determined by the hydraulic retention time (HRT) parameter, and in our research, HRT was set to 6–8 days.
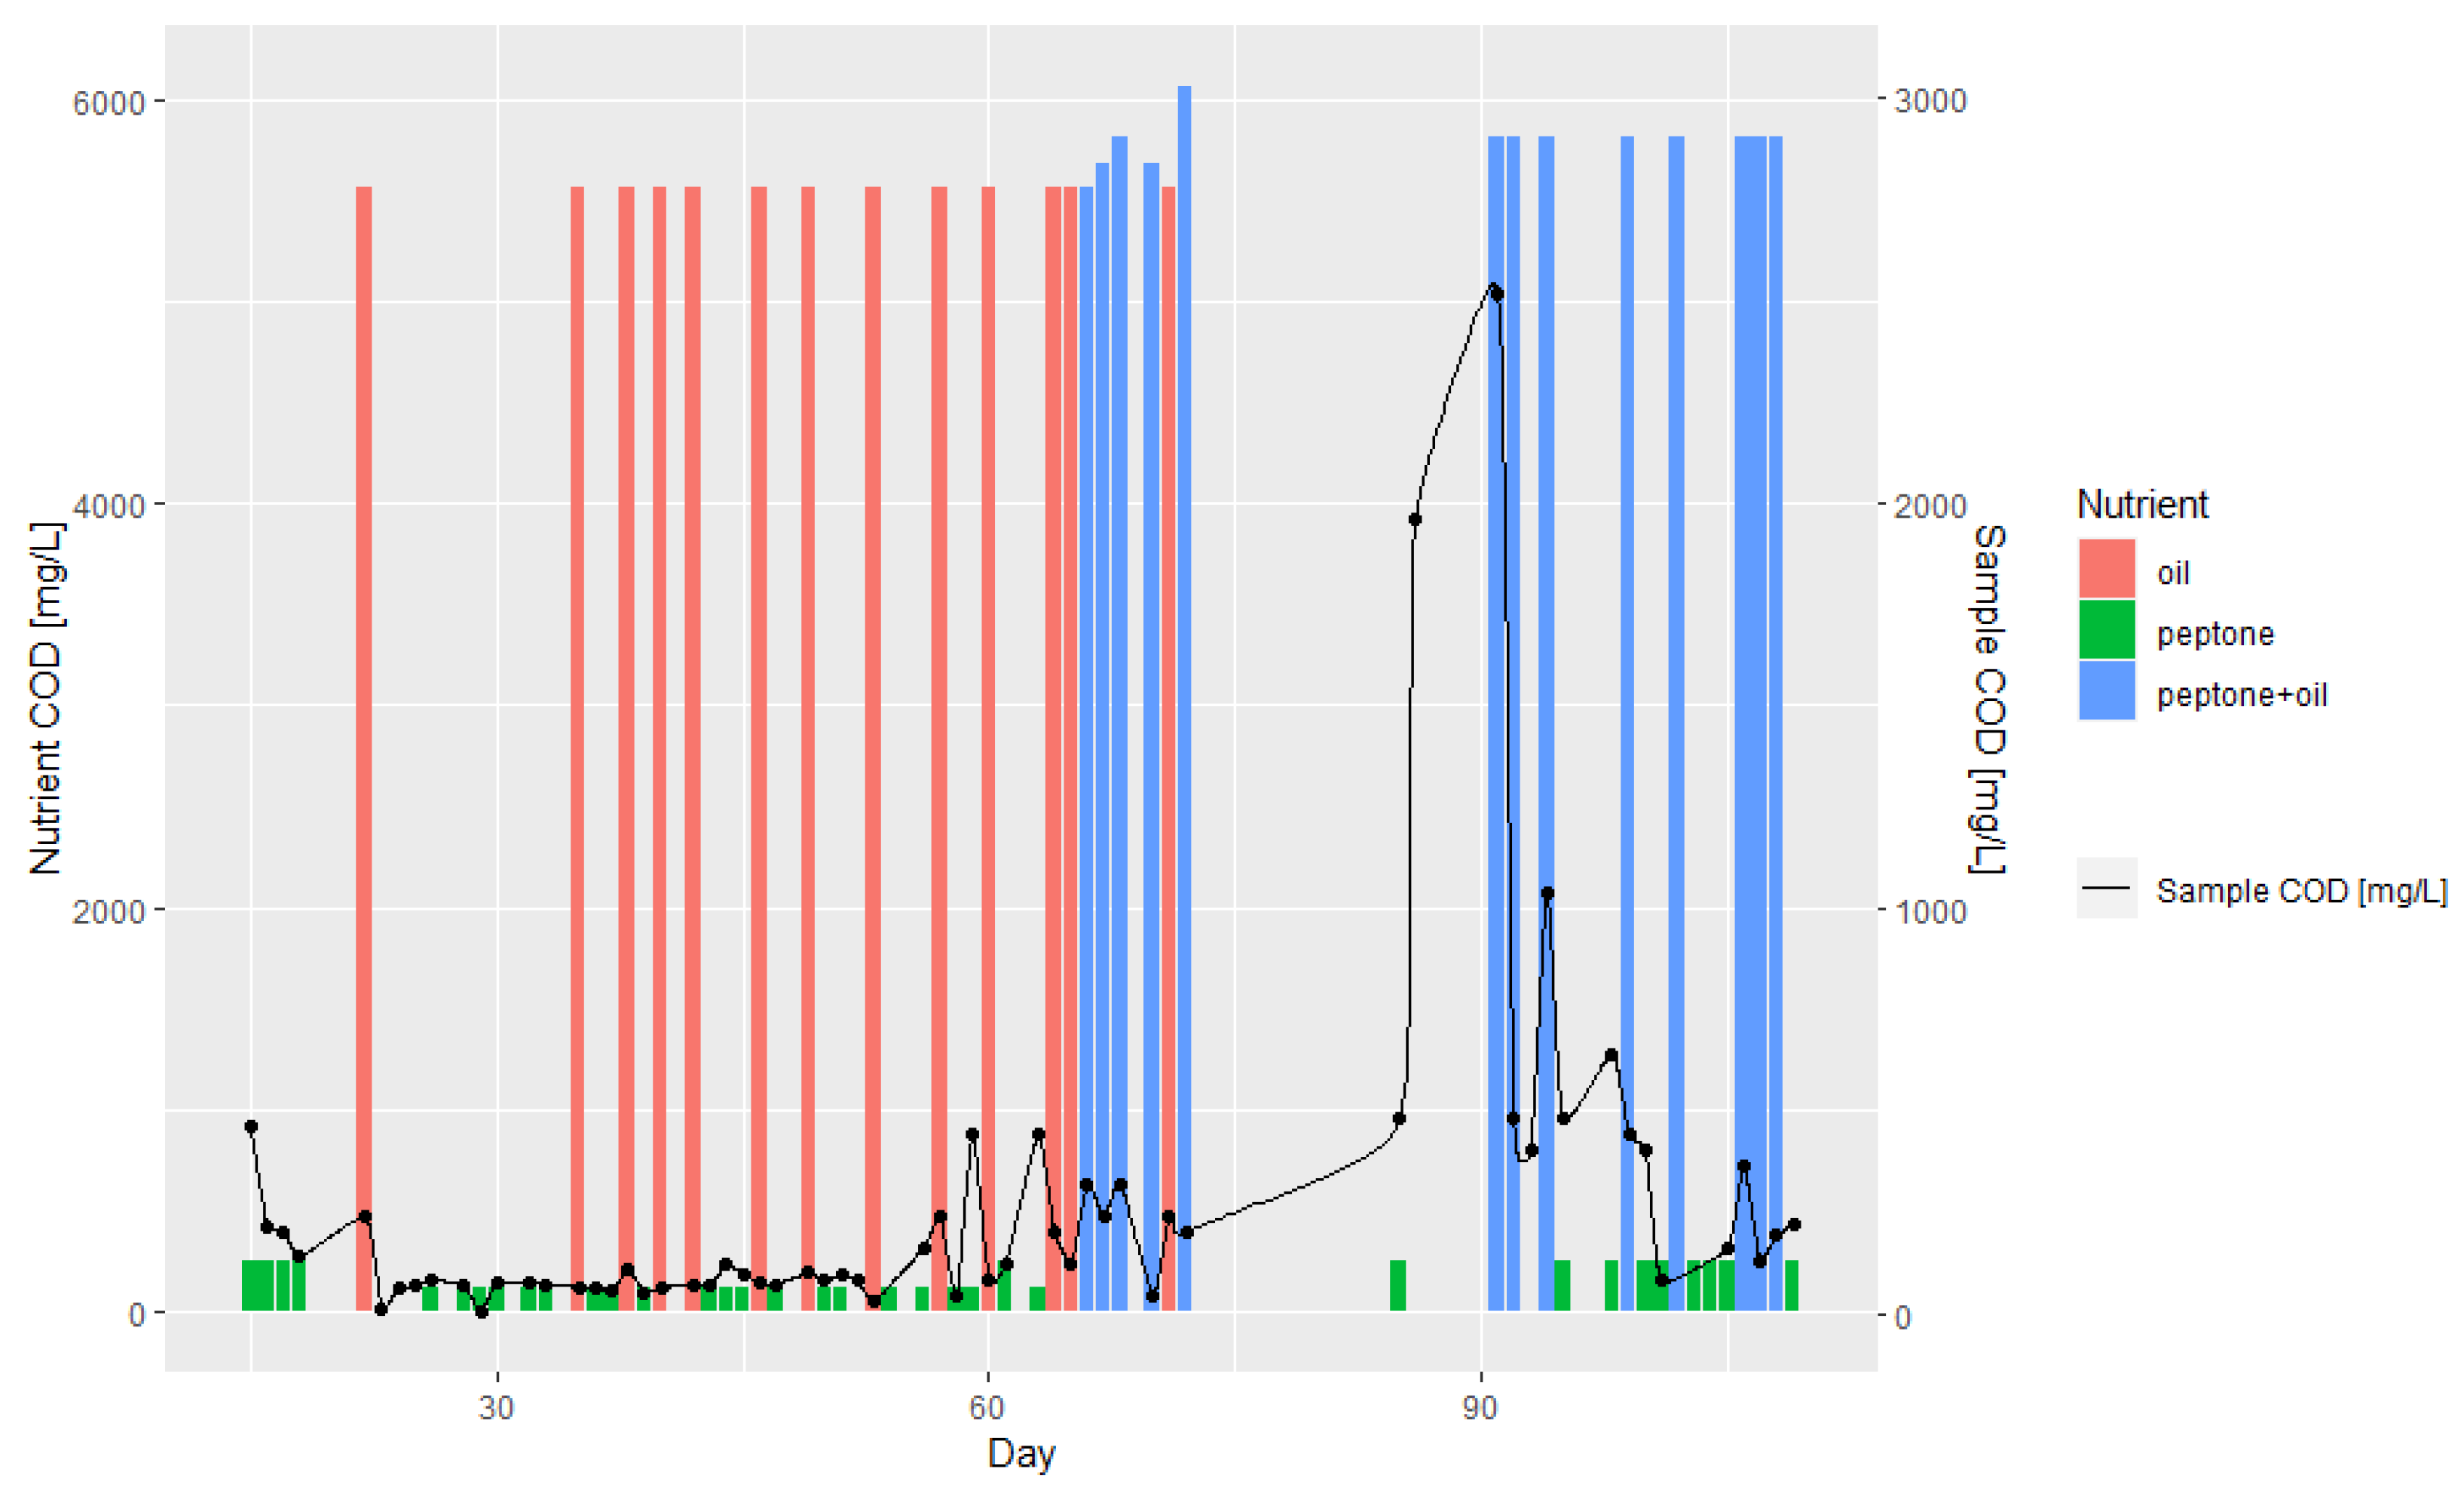
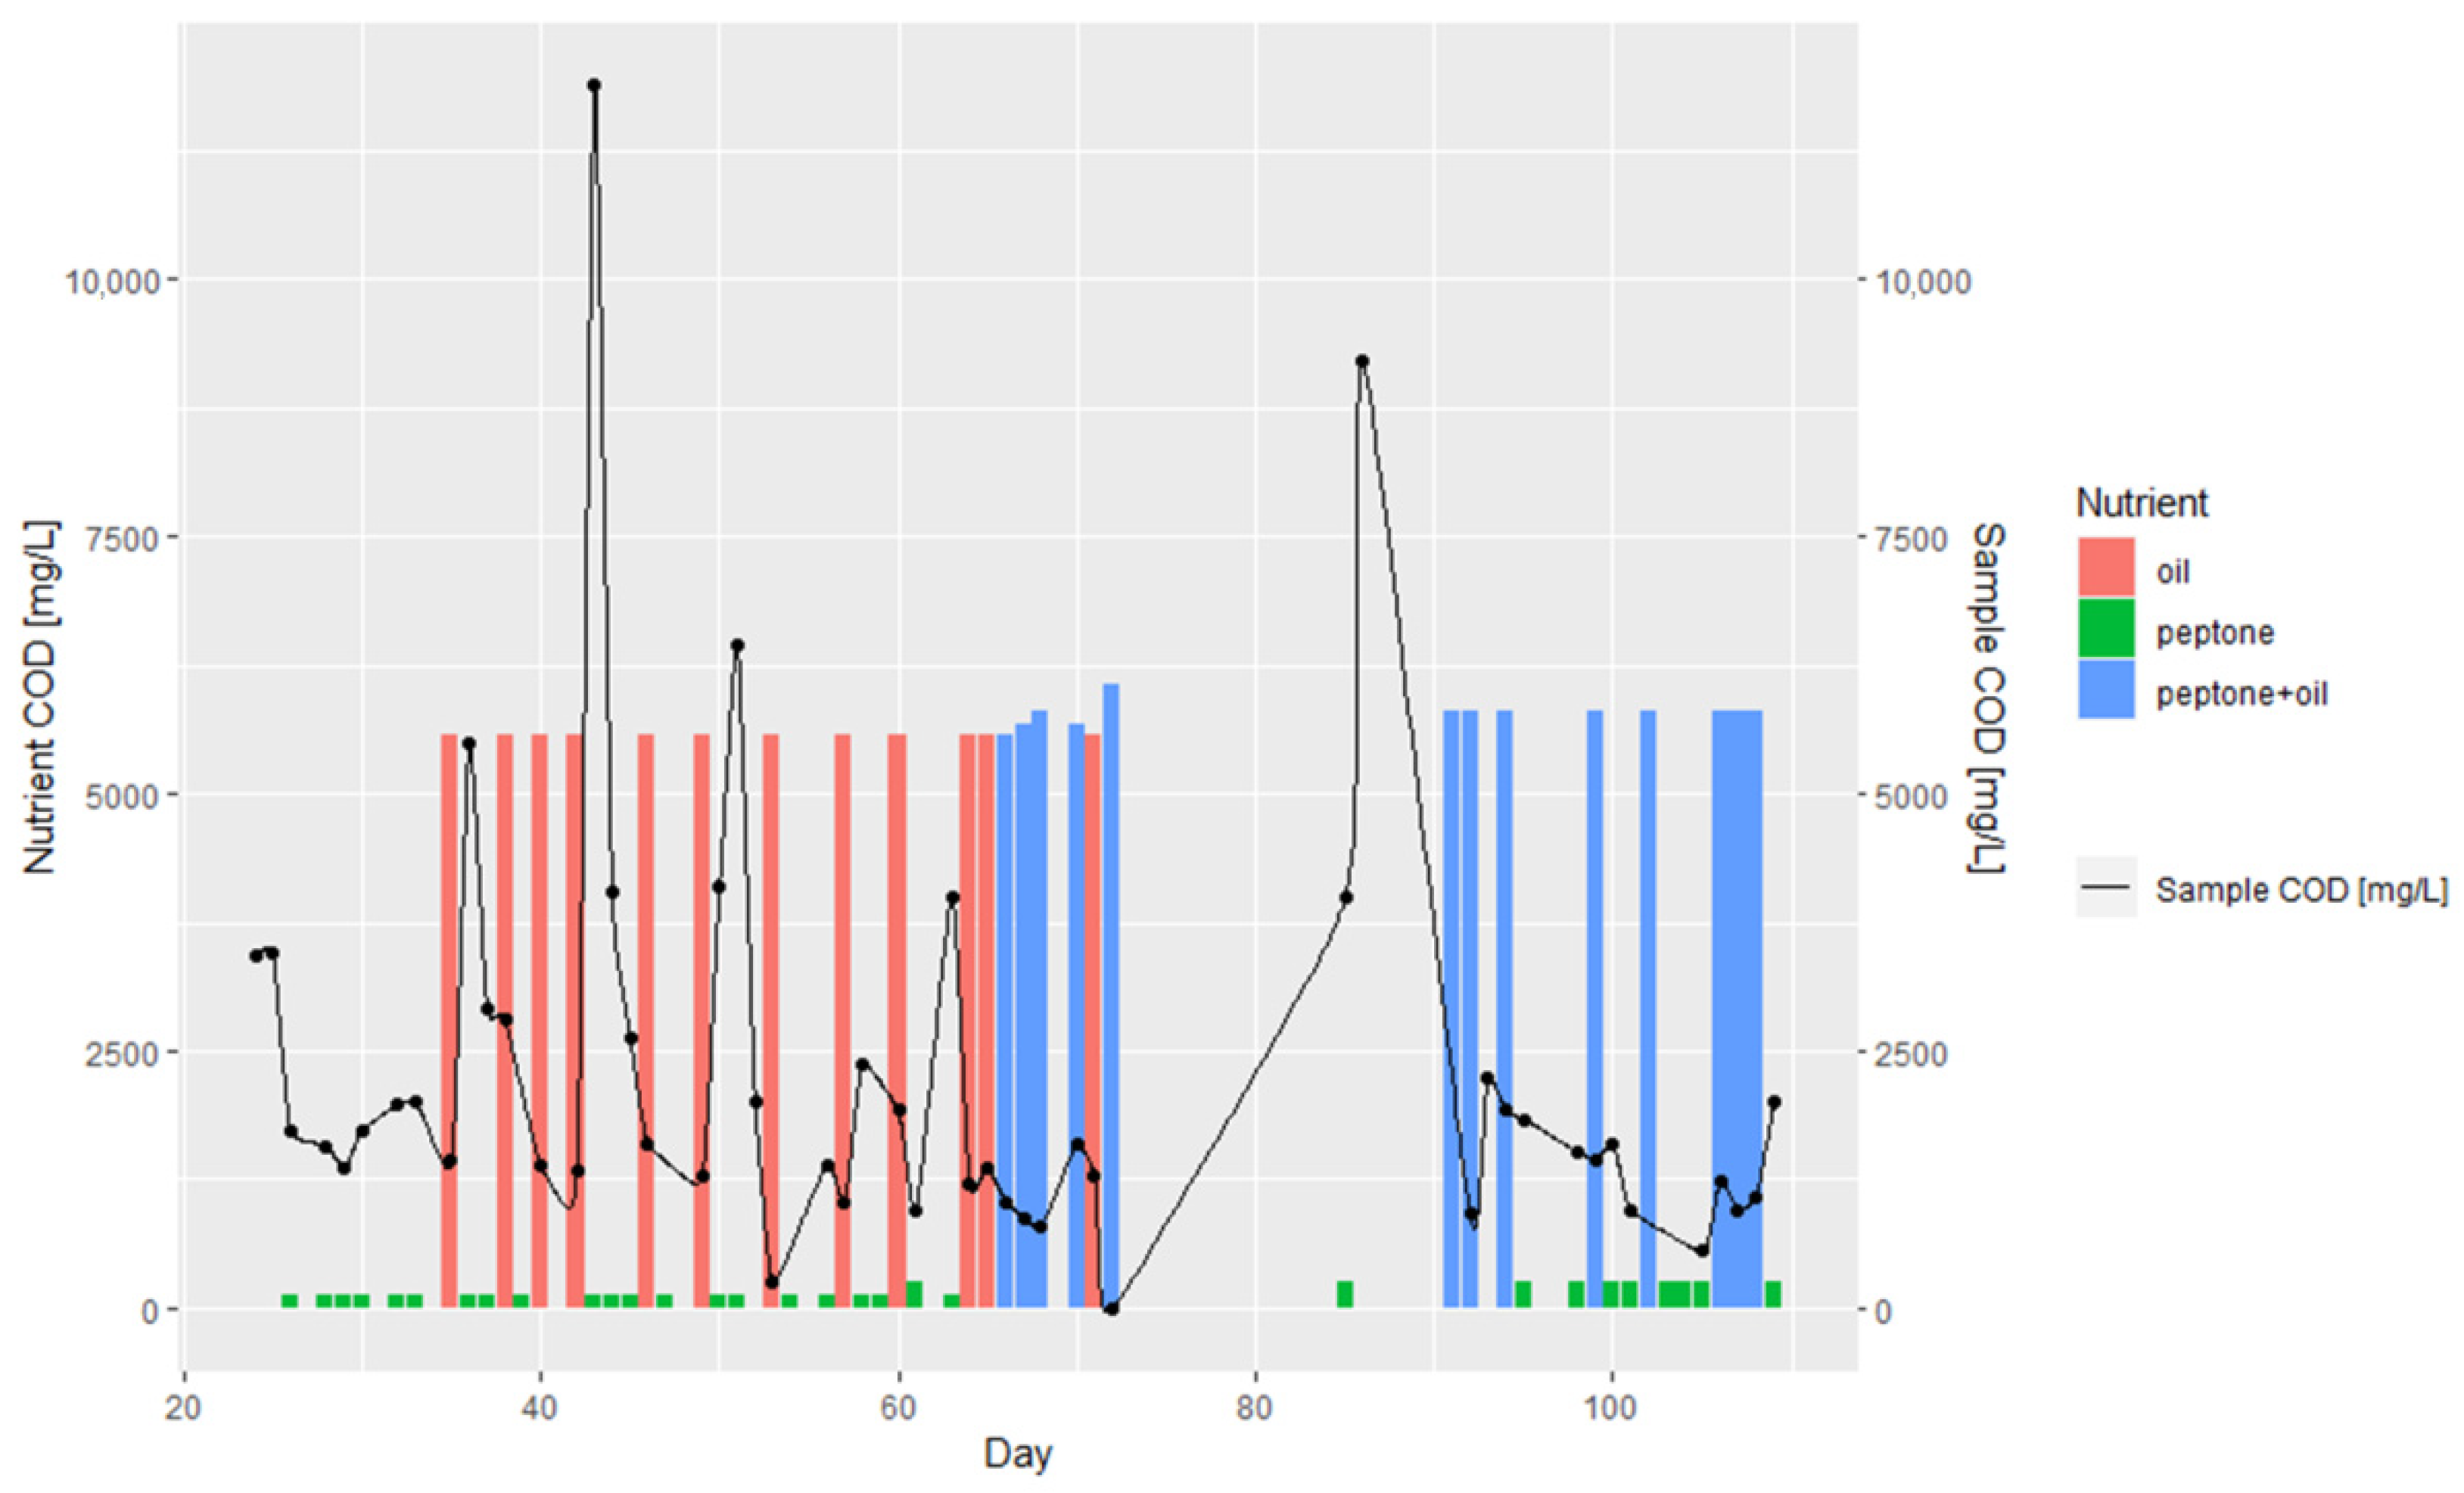
After the verification of the applied feeding strategy, it was decided to implement a more favorable procedure during the start-up of the bioreactor with automatic control, ensuring a continuous flow (Figure 7, Figure 8 and Figure 9). As expected, for the filtered sample, lower COD values were recorded (Figure 7). The graphs also show fluctuations in COD values, which are a consequence of using different strategies for feeding and different nutrient compositions. High values of COD were recorded during the peptone administration periods and low COD concentrations in the oil application case. After applying a mixture of oil and peptone, the resulting COD concentrations were dependent on the ratio of both components in the mixture. Therefore, it was decided to apply this feeding procedure, as there were no signs of dying out in the microorganism culture, and it also allowed for the maximization of PHB content.

3.2. Microscopic Images

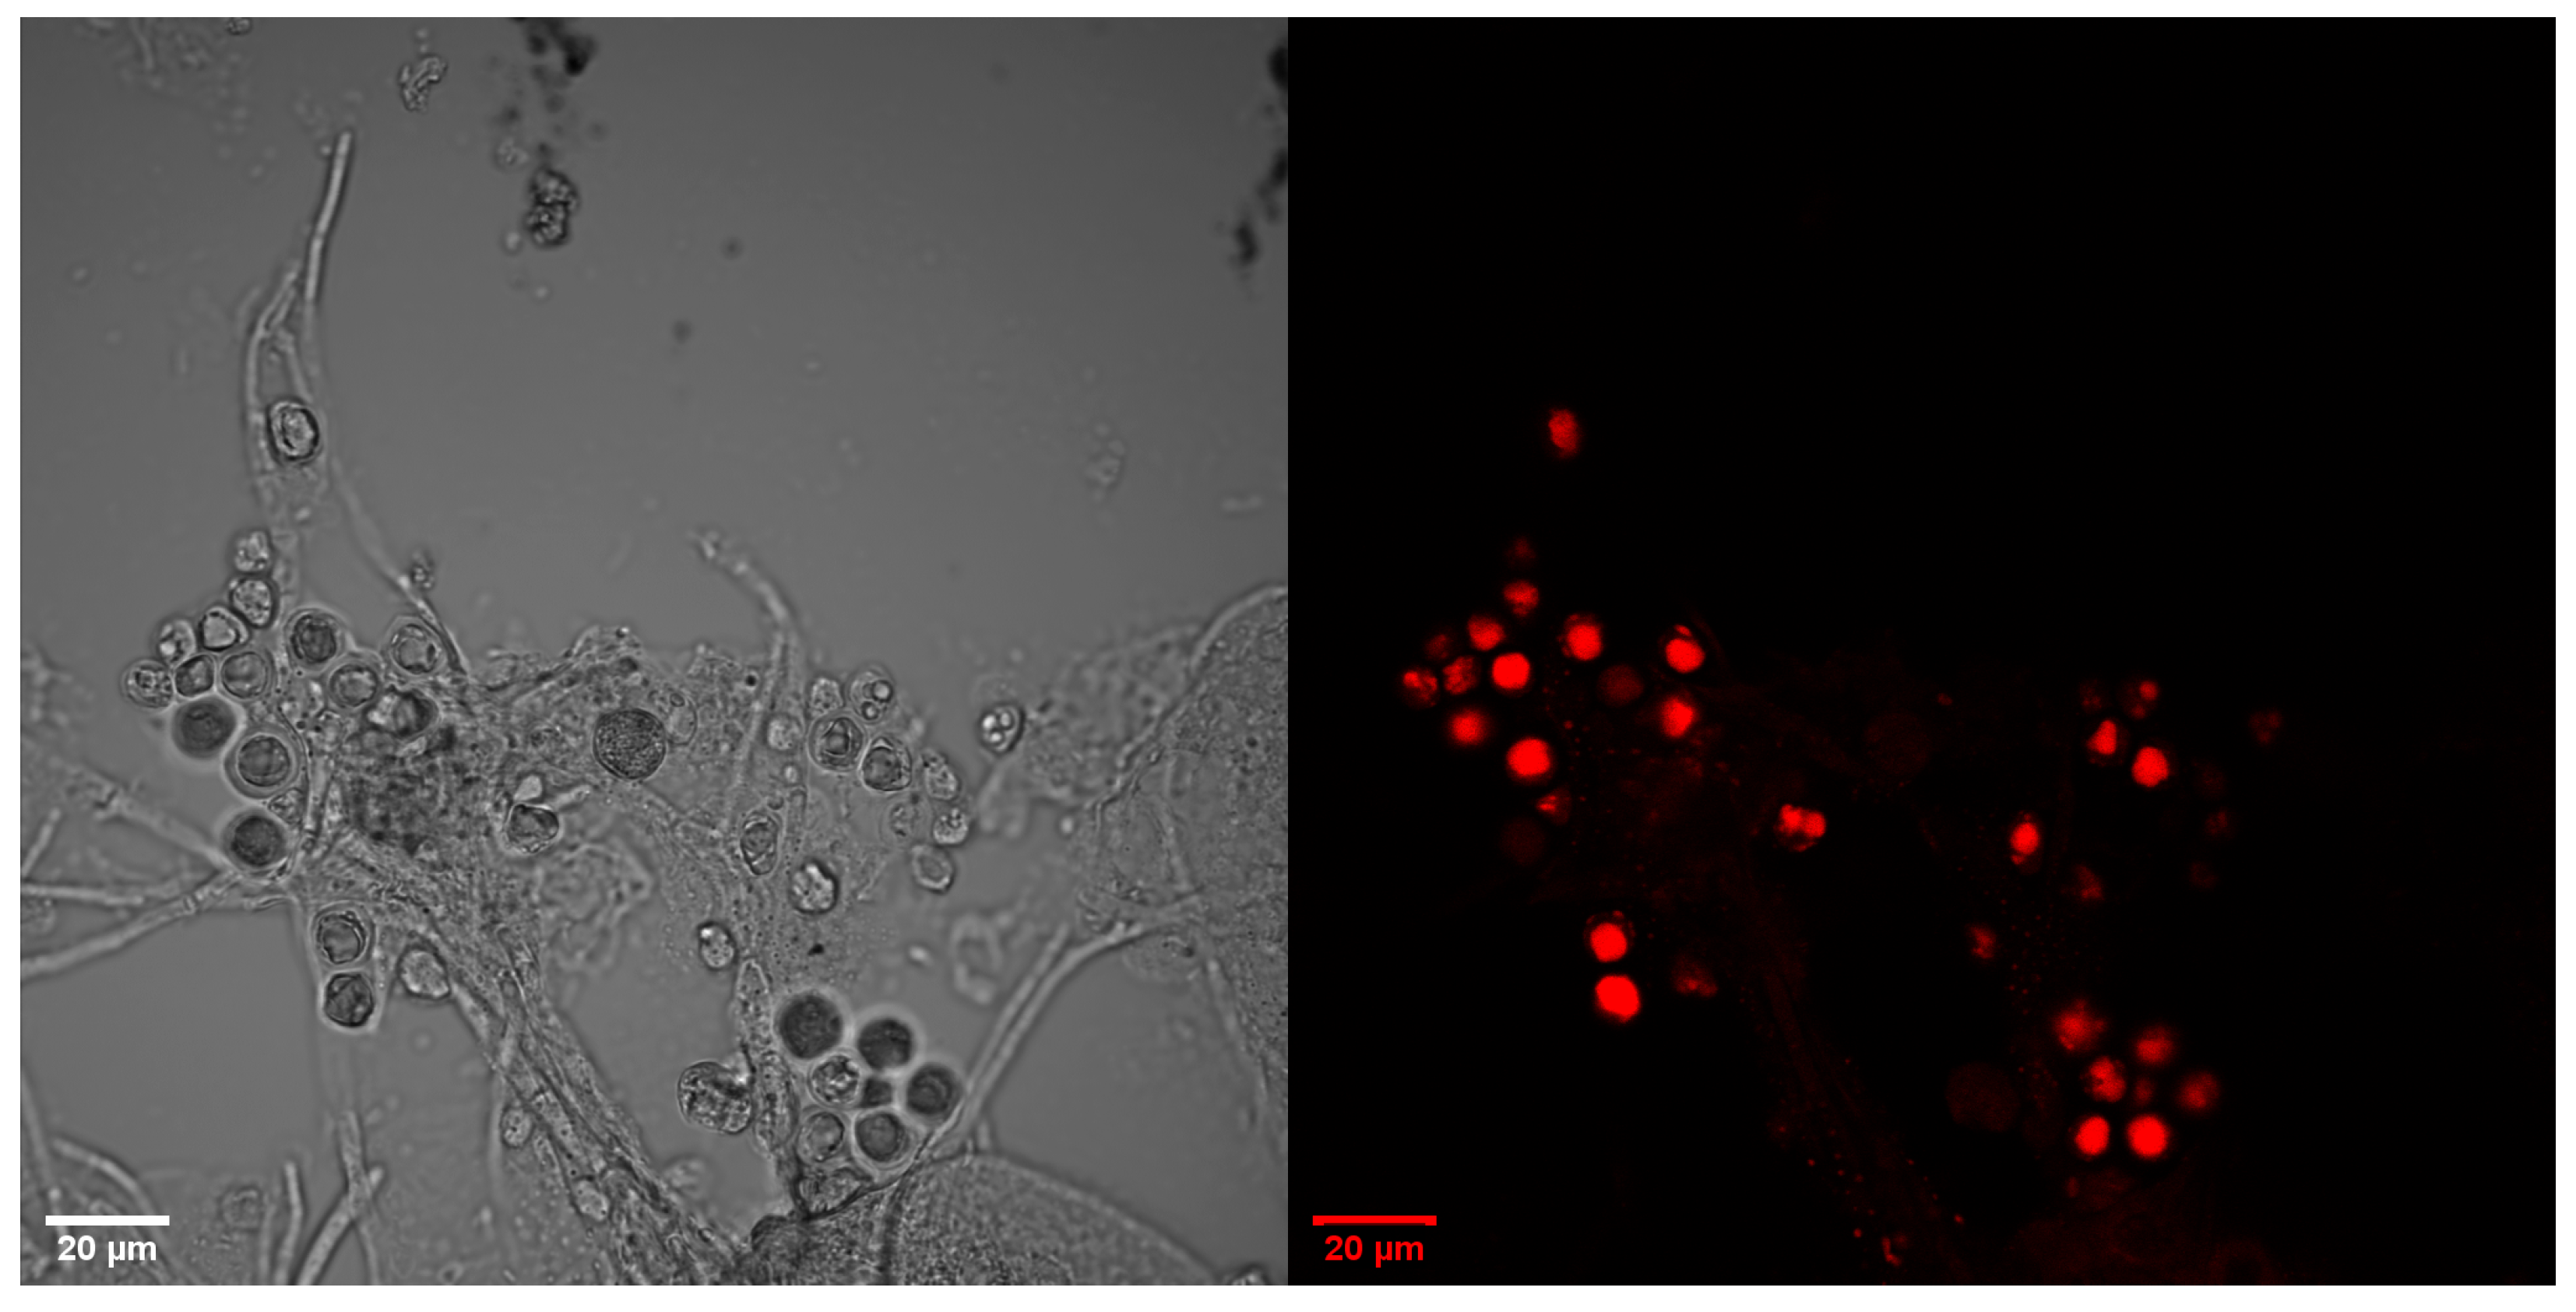
To confirm presence of PHB, microscopic images of stained samples were analyzed. Conclusions are drawn based on the photos that coincided with the data presented in Figure 4, Figure 5, Figure 6, Figure 7, Figure 8 and Figure 9. This confirmed that the developed feeding strategy and nutrient composition is effective and brings the desired effects. In the prepared microscopic samples, clusters of regular objects with high fluorescence, identified as polymer granules, were observed.
The obtained data were analyzed by the algorithm that estimates the percentage area of polymer granules in an identified structure. When the identified objects appeared separately in the image, the algorithm returned the information on the amount of PHB and a boxplot showing the expected value and the standard deviation. The results of microscopic image analysis (Figure 10) are shown in Figure 11. The proposed algorithm determines the percentage of polymer granules in the structure.

3.3. Optical Analysis and Lipase Activity

In this subsection, we present the measurement data collected between day 57 and day 66. Between those days, continuous measurements of lipase activity, nitrogen, COD with and without filtration, and biomass concentrations were carried out, and corresponding high-quality microscopic images were collected. Analyzing the results presented in Table 1, one can notice very high lipase activity on day 57, which entails an increase in easily digestible substrate. Fatty acids derived from the substrate are hydrolyzed and oxidized to acetoacetyl-CoA (Figure 1). In that case, P. fluorescens bacteria switch for the glyoxylate cycle (instead of the Krebs cycle), in which the energy can be accumulated faster. As a result, one can observe a faster growth of microorganisms, but the dividing cells cannot secrete lipase at this point. In turn, a decrease in lipase activity that is visible on day 60 (Table 1) results from the rapid growth and division of cells. Then, the lipase activity increases again as the fresh substrate is continuously fed into the reactor and a large number of cells have no accumulated energy. Therefore, the best results are obtained when oscillations in lipase activity and cell density are maintained. This is also confirmed by our research, as the best results are from periods of oscillating growth.
The microscopic observations were carried out regularly throughout the experiment to confirm presence of PHB granules and to understand the activated sludge structures in which the accumulation took place. Figure 12 shows microscopic observations of samples from the batch reactor on the 66th day. Other microscopic images from the same day are shown in Figure A1, in Appendix A. On that day, it was possible to identify large amounts of PHB granules in many areas, characterized by a strong fluorescence signal.
The lipolytic activity of P. fluorescens was kept nearly constant when the bacterial culture was fed with oil and peptone daily, as shown in Table 2. The stabilization in lipolytic activity was obtained from continuous feeding and the continuous removal of metabolites from the bioreactor. Such a strategy kept the bacterial culture in good conditions while maximizing the PHB yield.
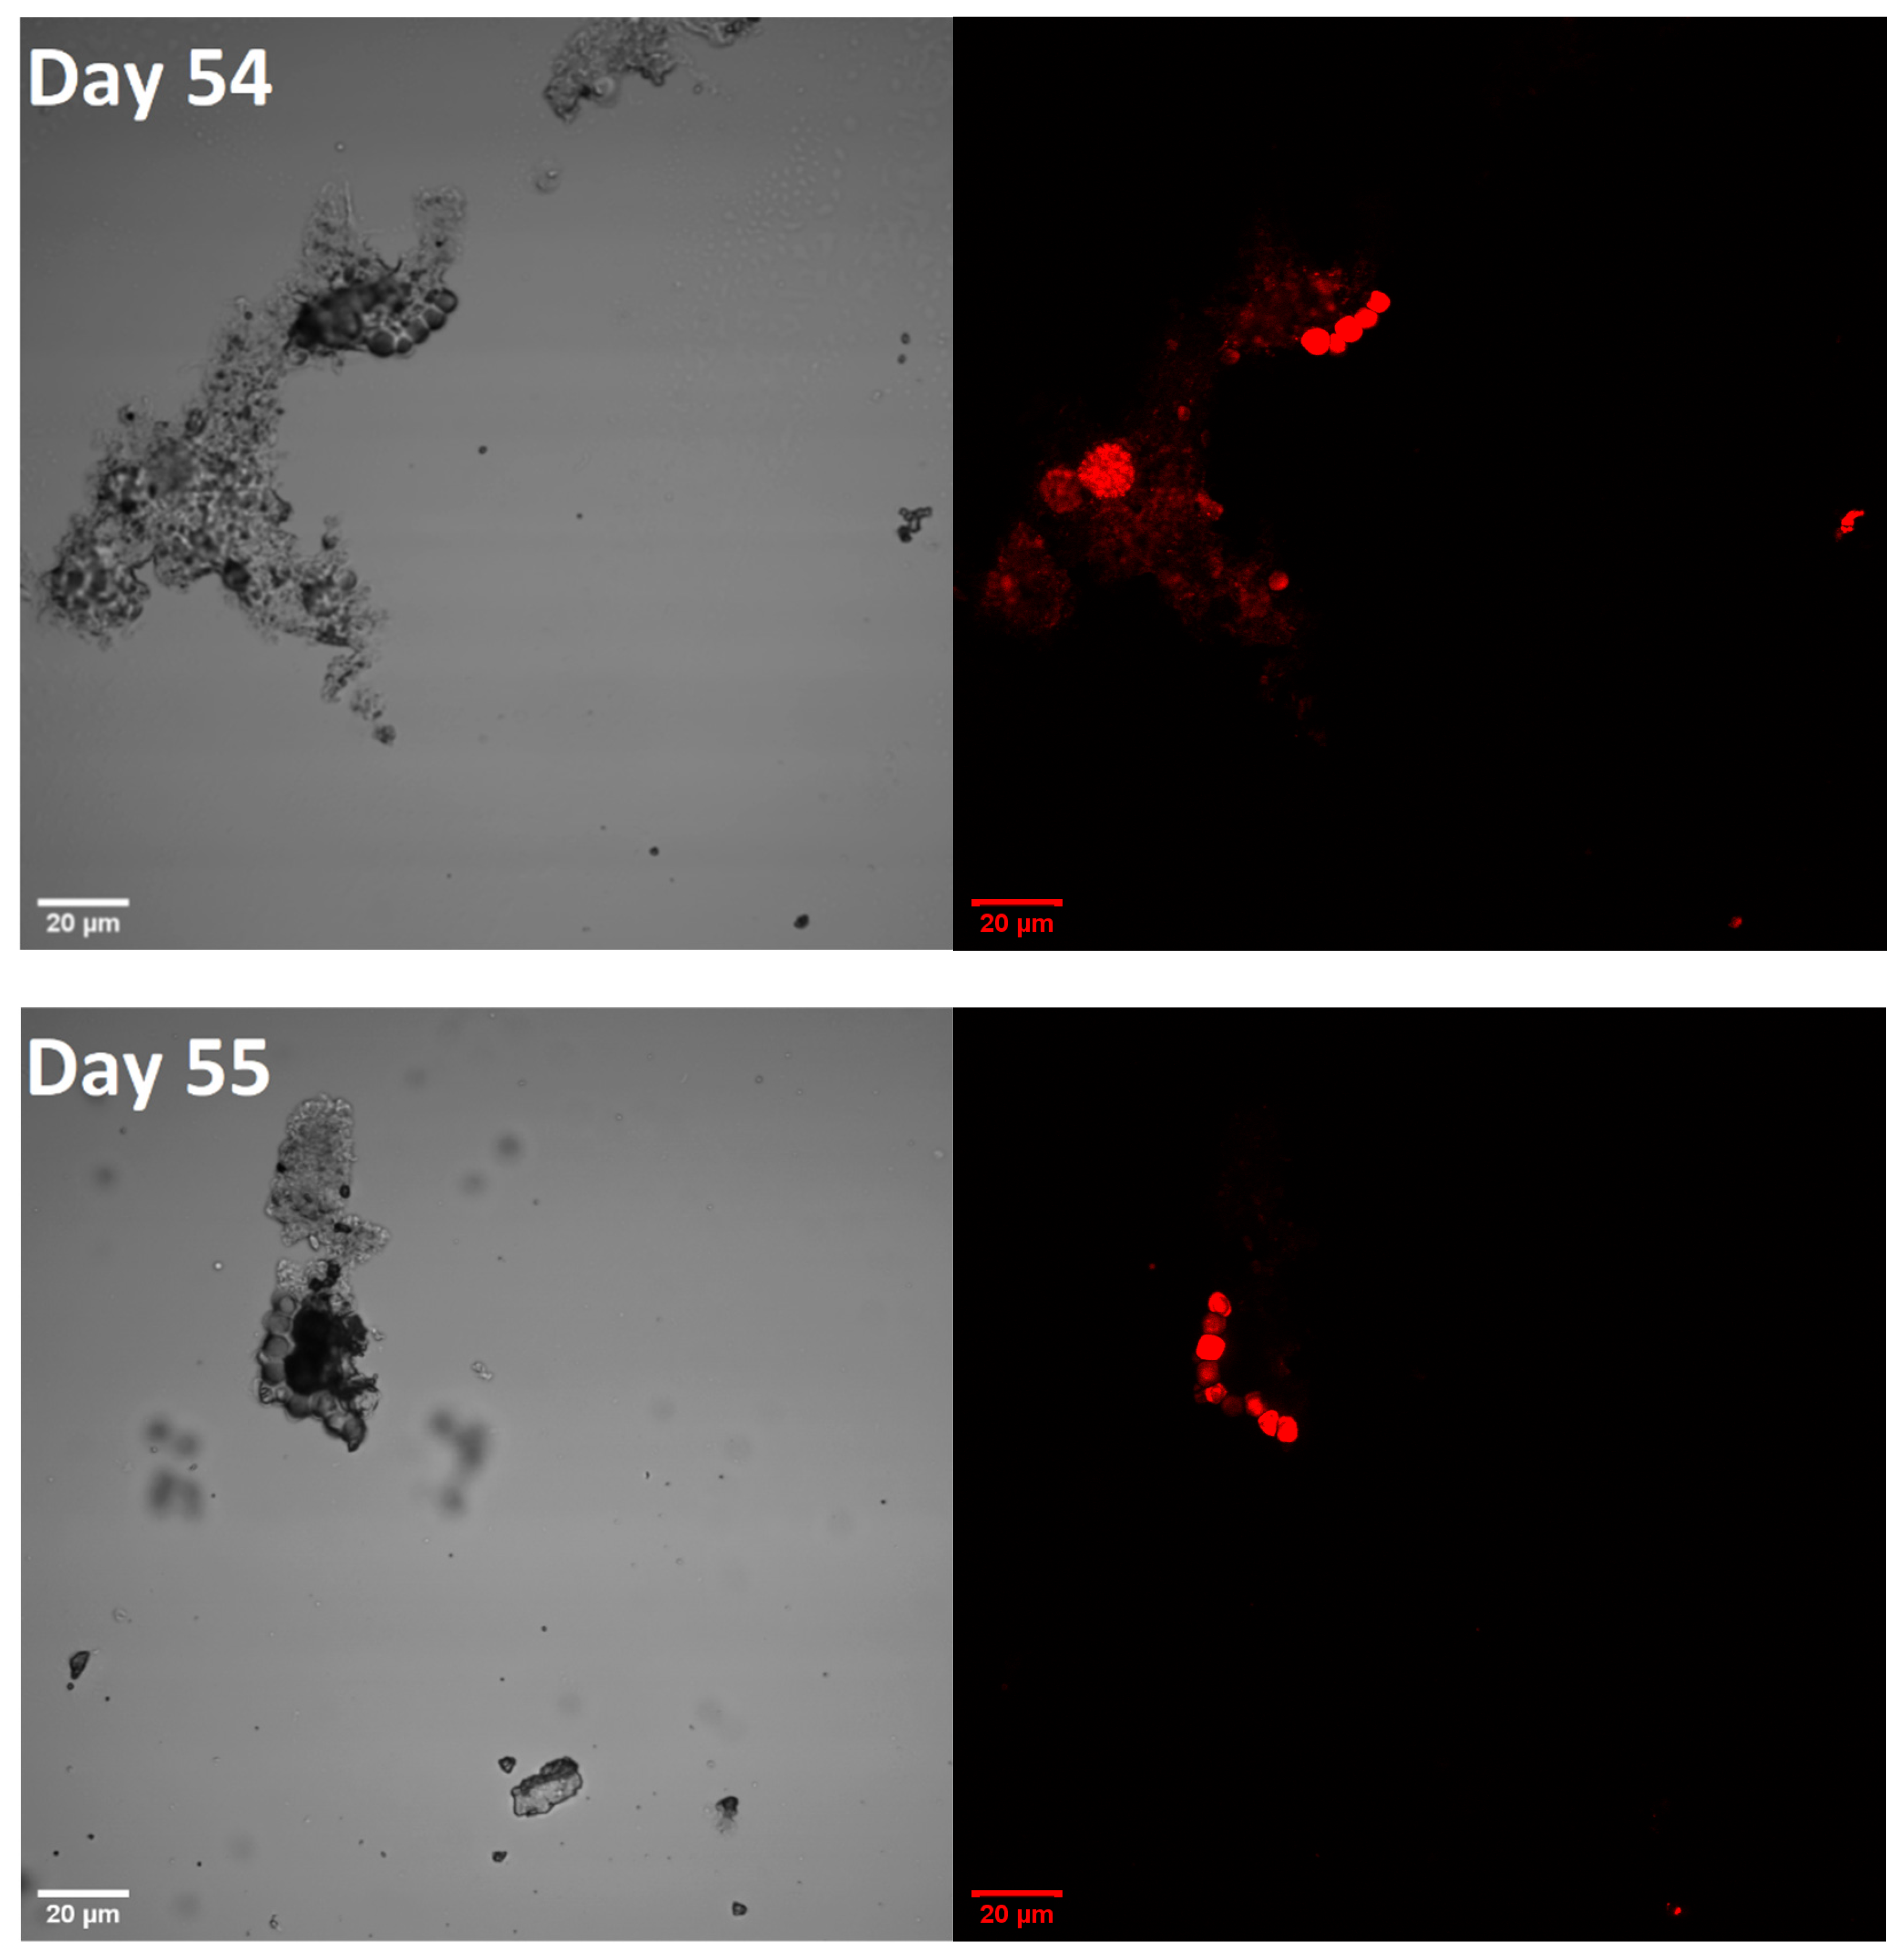
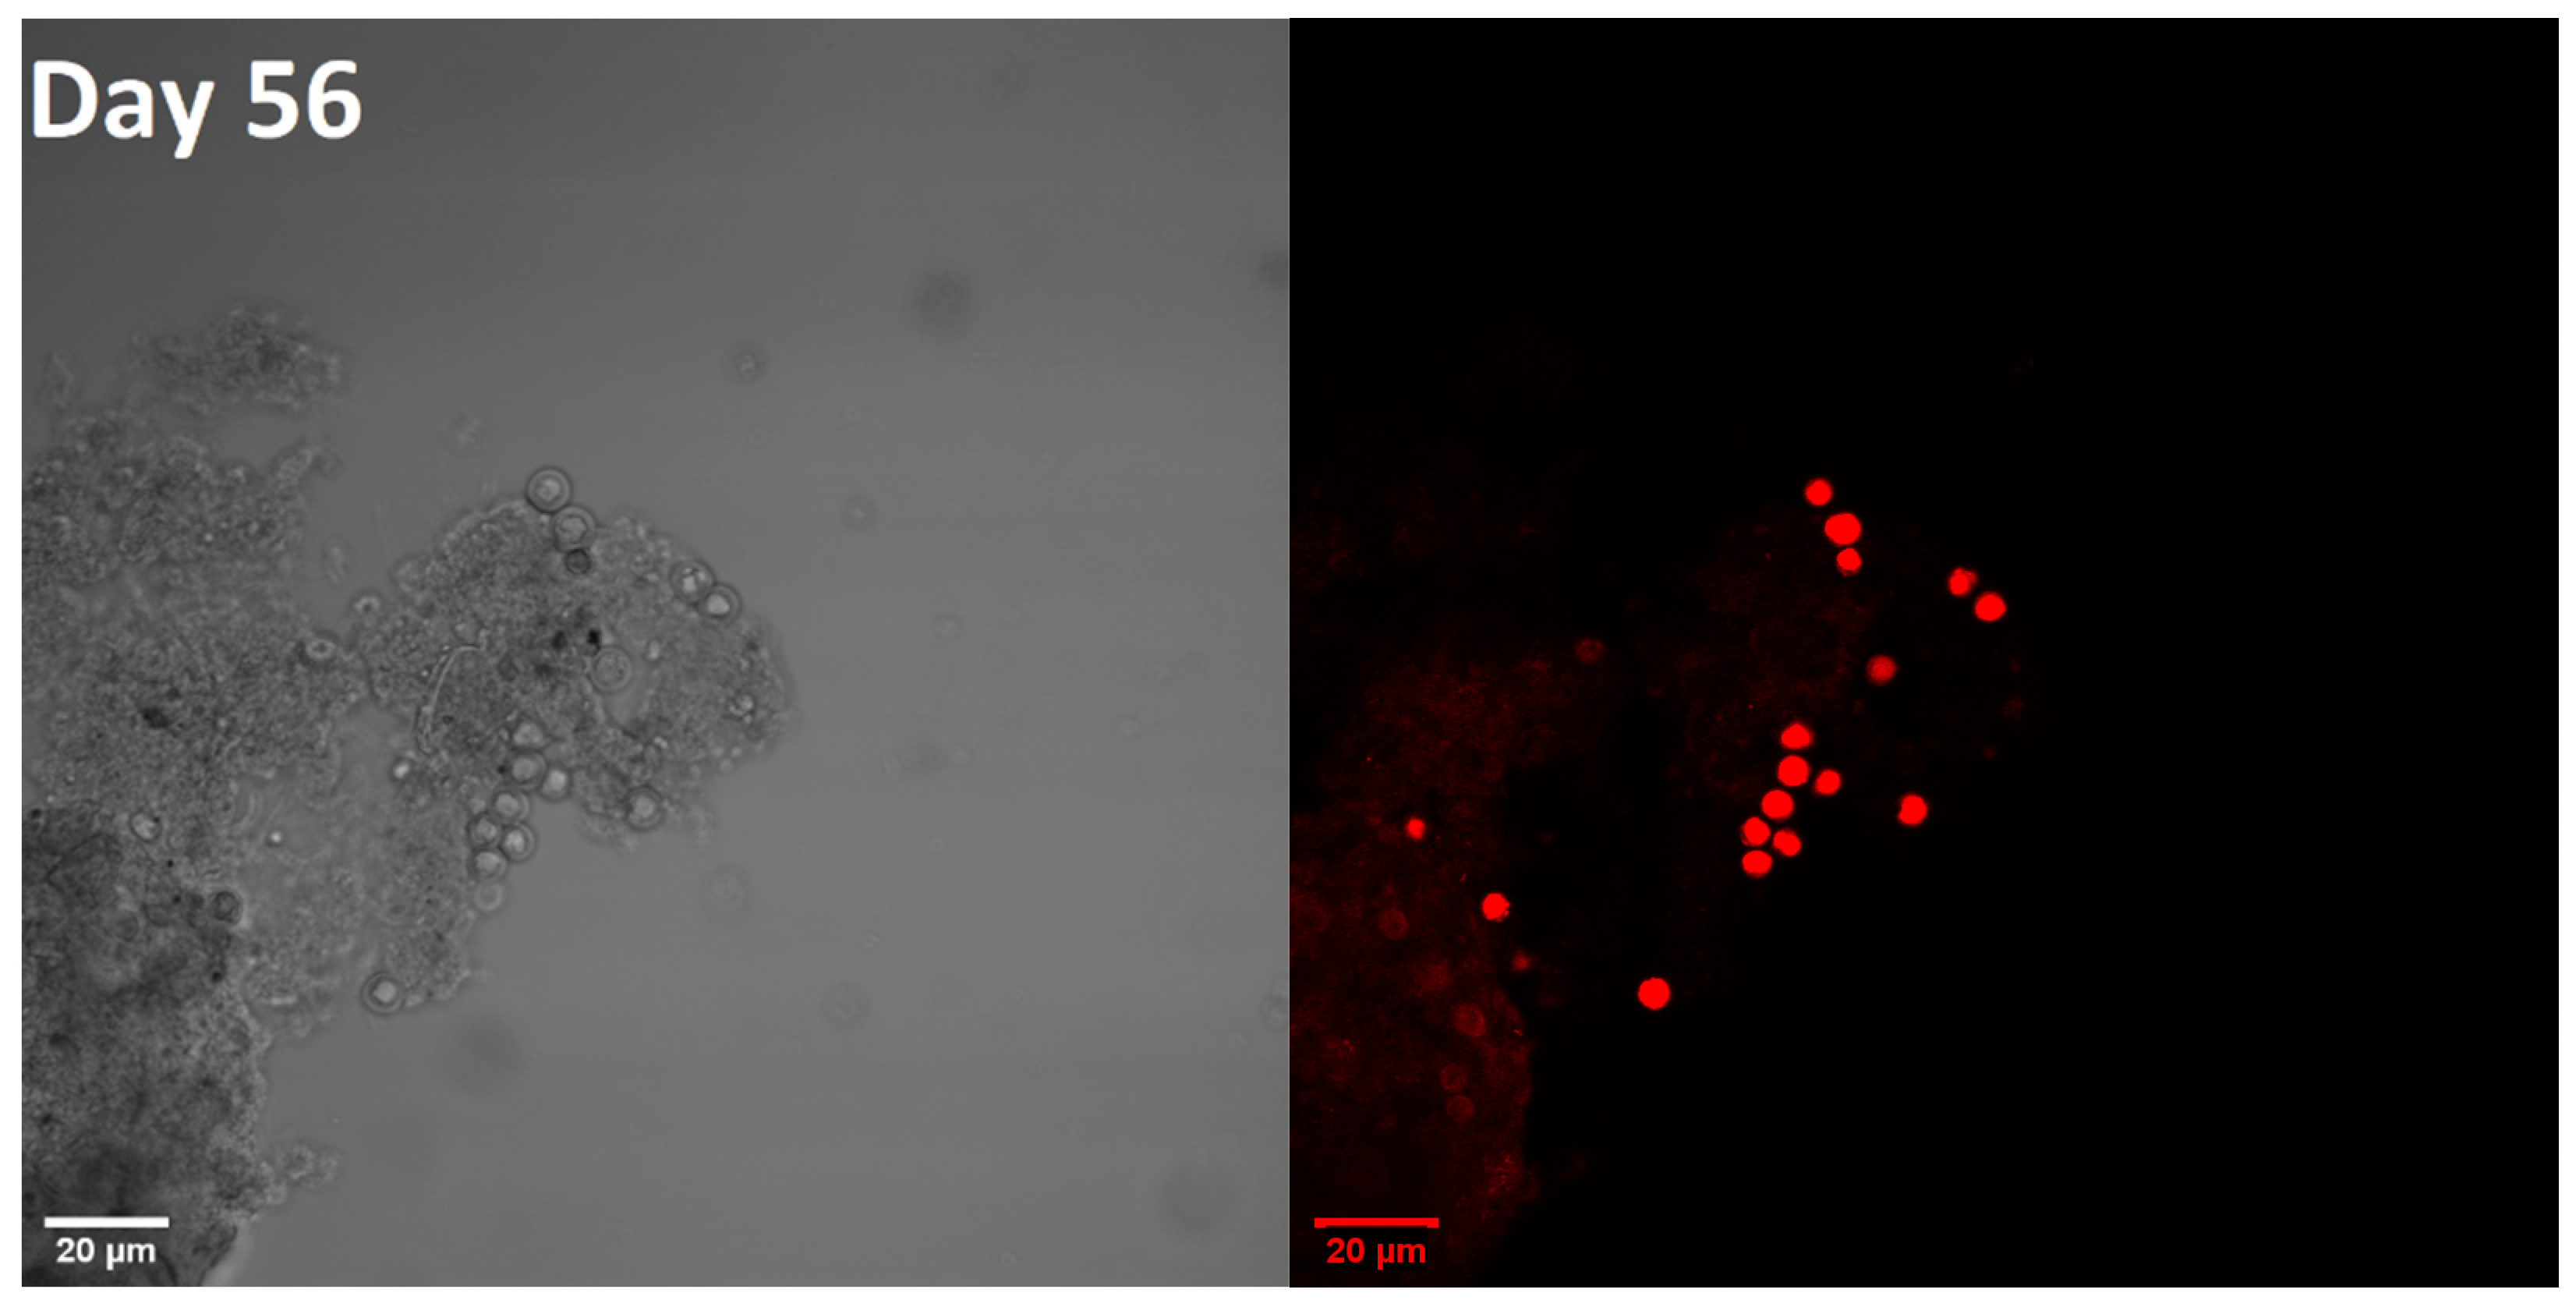
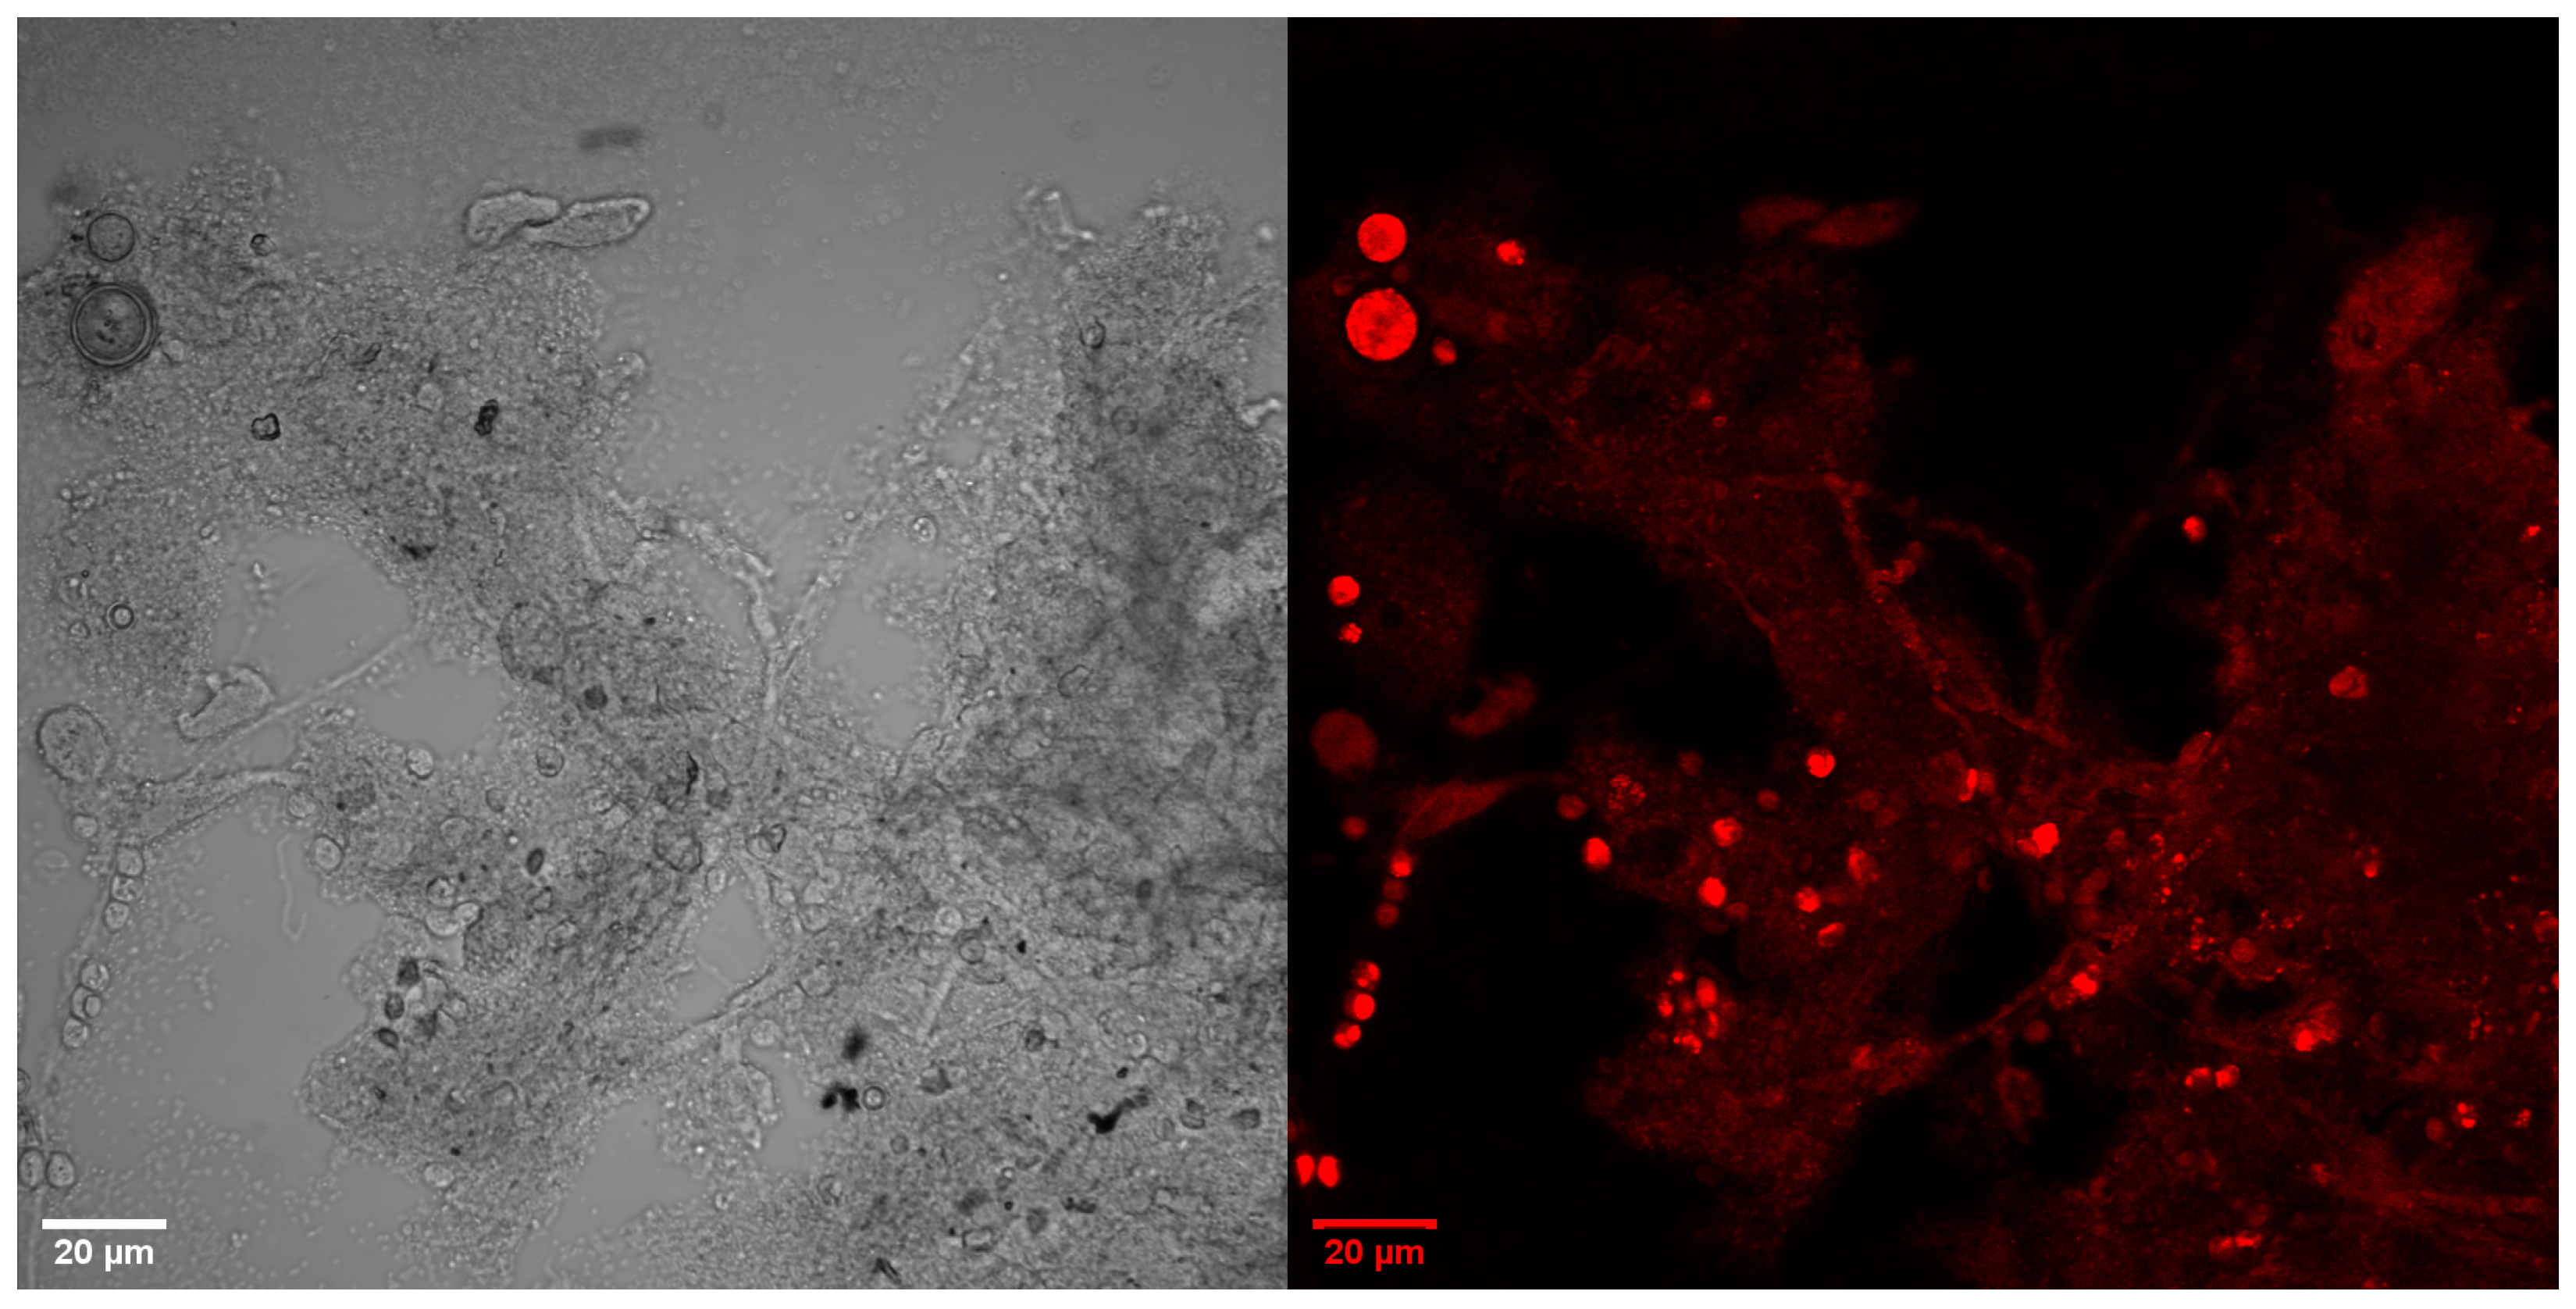
One week of continuous observation provided a microscopic image set showing activated sludge flocs. In the above-mentioned areas, PHB granules were identified when stained with Nile Blue A, and the use of an appropriate filter along with blue laser excitation gave a fluorescent signal. The polymer is accumulated in regular, round granules of similar size. The photo of the sample from day 53 (Figure 13) shows a plate fragment in which no areas characterized by a strong signal were observed. The images collected in the next days with visible PHB granules are shown in Figure A2, in Appendix A.

4. Discussion and Concluding Remarks

The goal of this study was to develop a feeding strategy aiming to maximize PHB in microorganism cells. Pseudomonas fluorescens were cultivated in two bioreactors operated as batch and continuous systems. The batch bioreactor was used to develop the feeding strategy by changing the composition of the substrate (a mixture of oil and peptone) and to provide microorganisms for the continuous bioreactor. The best feeding strategy was determined by choosing the optimal proportion between the oil and the peptone, which was a sole carbon source. In the case of the batch bioreactor, it was observed that the best results can be obtained when oscillations in lipase activity and cell density are maintained. An additional criterion was the use of a nutrient raw material that is either waste or another process by-product. The fatty acid esters in the oil impede microorganisms from accessing the carbon source. This induced physiological stress and promoted the secretion of PHB. The addition of oil at two-day intervals increased the polymer production. On the other days, the nutrient was only composed of the peptone. In the initial culture phase, the lipase activity measurements showed strong variability. Observing the chemical oxygen demand value and lipase activity allowed us to control of decomposition of organic matter. A decrease in these values, accompanied by a low ammoniacal nitrogen concentration, may indicate progressive dying out of the culture. In turn, the PHB production was determined by using microscopic observations preceded by the staining procedure. This is the easiest way to confirm the polymer accumulation in bacterial cells. The acquired images were subjected to further analysis, based on the algorithm determining the PHB percentage in a sample. It was observed that small bright flocs were formed in the bioreactor. The samples containing the described structures showed larger clusters of PHB. The use of a confocal microscope also allowed for the pictures’ generation in three dimensions and the spatial PHB granules’ observation. After 30 days, the culture was transferred to a continuous-flow bioreactor. The continuous-flow bioreactor allowed for almost full automation and high process stabilization. In this case, a mixture of 1 mL of oil, 0.5 g of peptone, and 0.2 g of NaHCO3 dissolved in water was applied. This strategy proved to be better in keeping the culture in good condition while maximizing polymer production. The process automation and the continuous feeding of nutrients resulted in the stabilization of lipase activity. This led to the assumption that the number of organic compounds and oil in the continuous-flow reactor was kept at a similar level. On this basis, it was concluded that the production and polymer accumulation is almost continuous. For confirmation, microscopic images were collected, and they revealed sludge flocs in which PHB granules were formed. The proposed algorithm allowed for the quantification of the polymer accumulation in the sample.
The bacteria that can accumulate PHB are normally present in activated sludge in biological wastewater treatment plants. As it is possible to use different organic wastes as substrates, the presented results make PHB production in continuous systems an interesting solution from the economic point of view. However, it should also be emphasized that the separation of bioplastic particles from biomass can be quite an expensive and time-consuming process. Therefore, our future studies will be focused on effective separation methods to reduce the overall cost.

Author Contributions

Conceptualization, D.C. and S.S.; methodology, H.L.-M. and A.S.; software, M.F., P.W. and B.S.; validation, A.S., H.L.-M. and K.W.; investigation, H.L.-M., A.S., K.W., K.L. and W.Ś.; data curation, H.L.-M. and A.S.; writing—original draft preparation, H.L.-M. and A.S.; writing—review and editing, P.S. and D.C.; visualization, H.L.-M., A.S., K.W., K.L. and W.Ś.; supervision, D.C. and S.S.; funding acquisition, D.C. All authors have read and agreed to the published version of the manuscript.

Funding

This research was partially supported by the project “Development and implementation of innovative technology intensification of the combustion of solid fuels” co-financed by the Polish National Centre for Research and Development, national program–R&D works and commercialization of R&D–Regional Scientific and Research Agendas/2017 (contract no. POIR.04.01.02-00.068/17-00). The research reported in this paper was co-financed by the European Union from the European Social Fund in the framework of the project “Silesian University of Technology as a Center of Modern Education based on research and innovation” POWR.03.05.00-00-Z098/17-00. This work was also supported by Silesian University of Technology statutory research funds, 02/0400/RGJ22/1023.

Data Availability Statement

Data available on request.

Conflicts of Interest

The authors declare no conflict of interest.

Appendix A

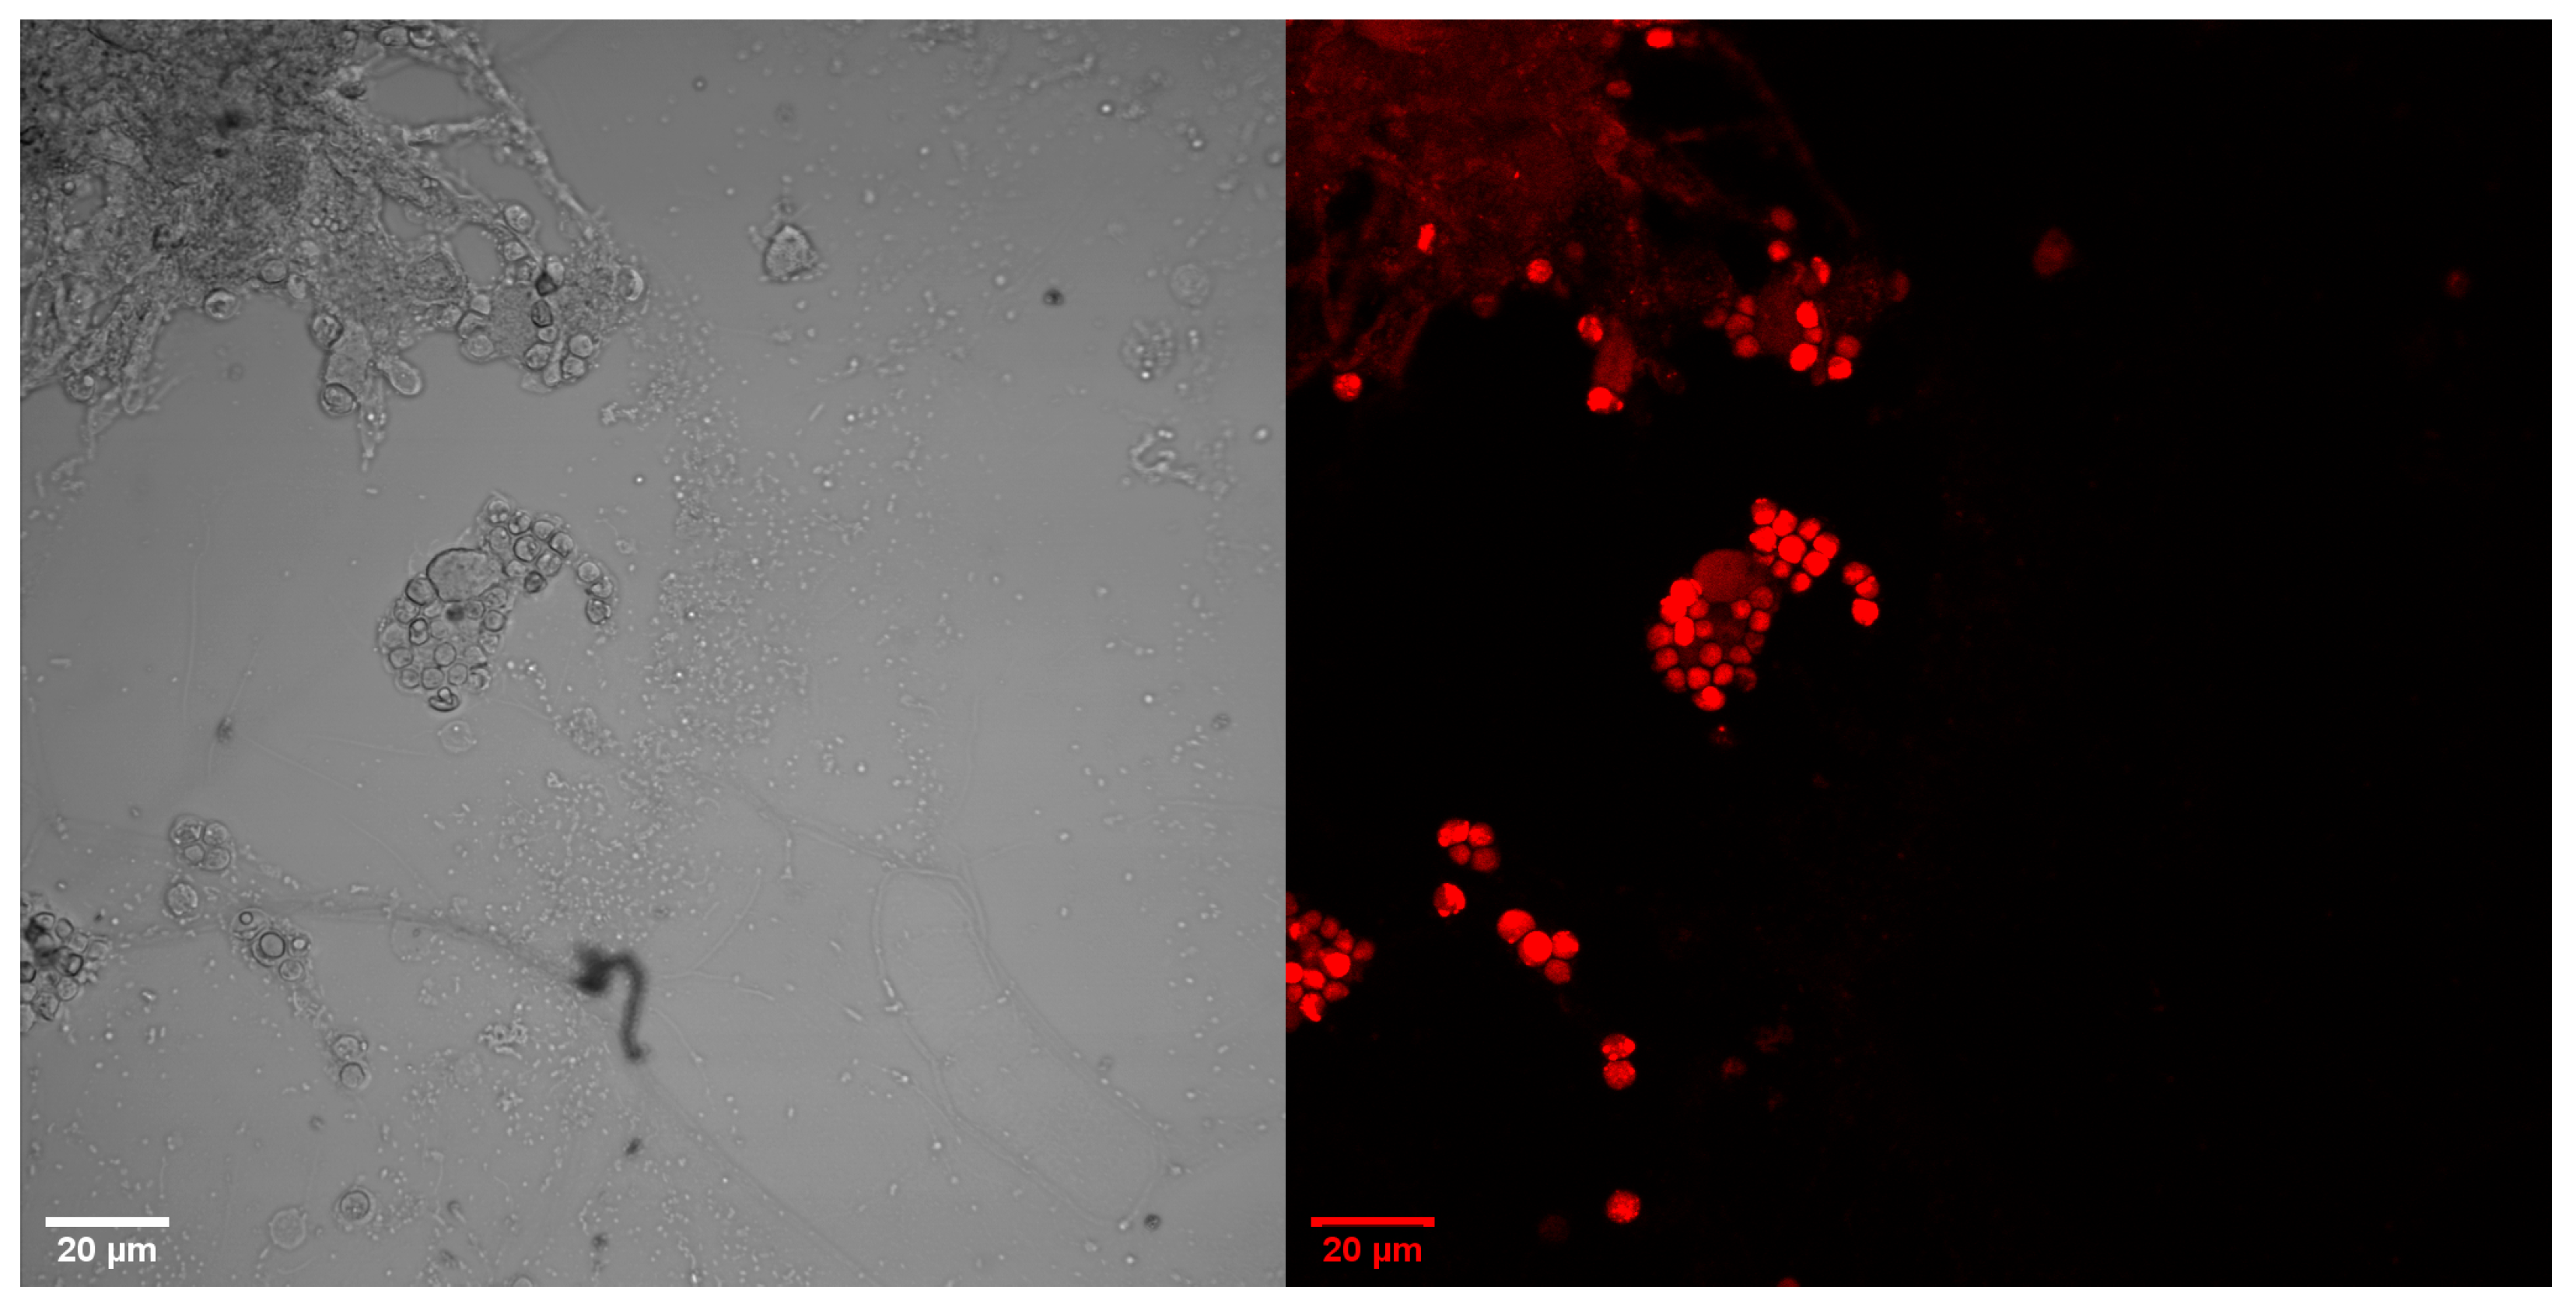
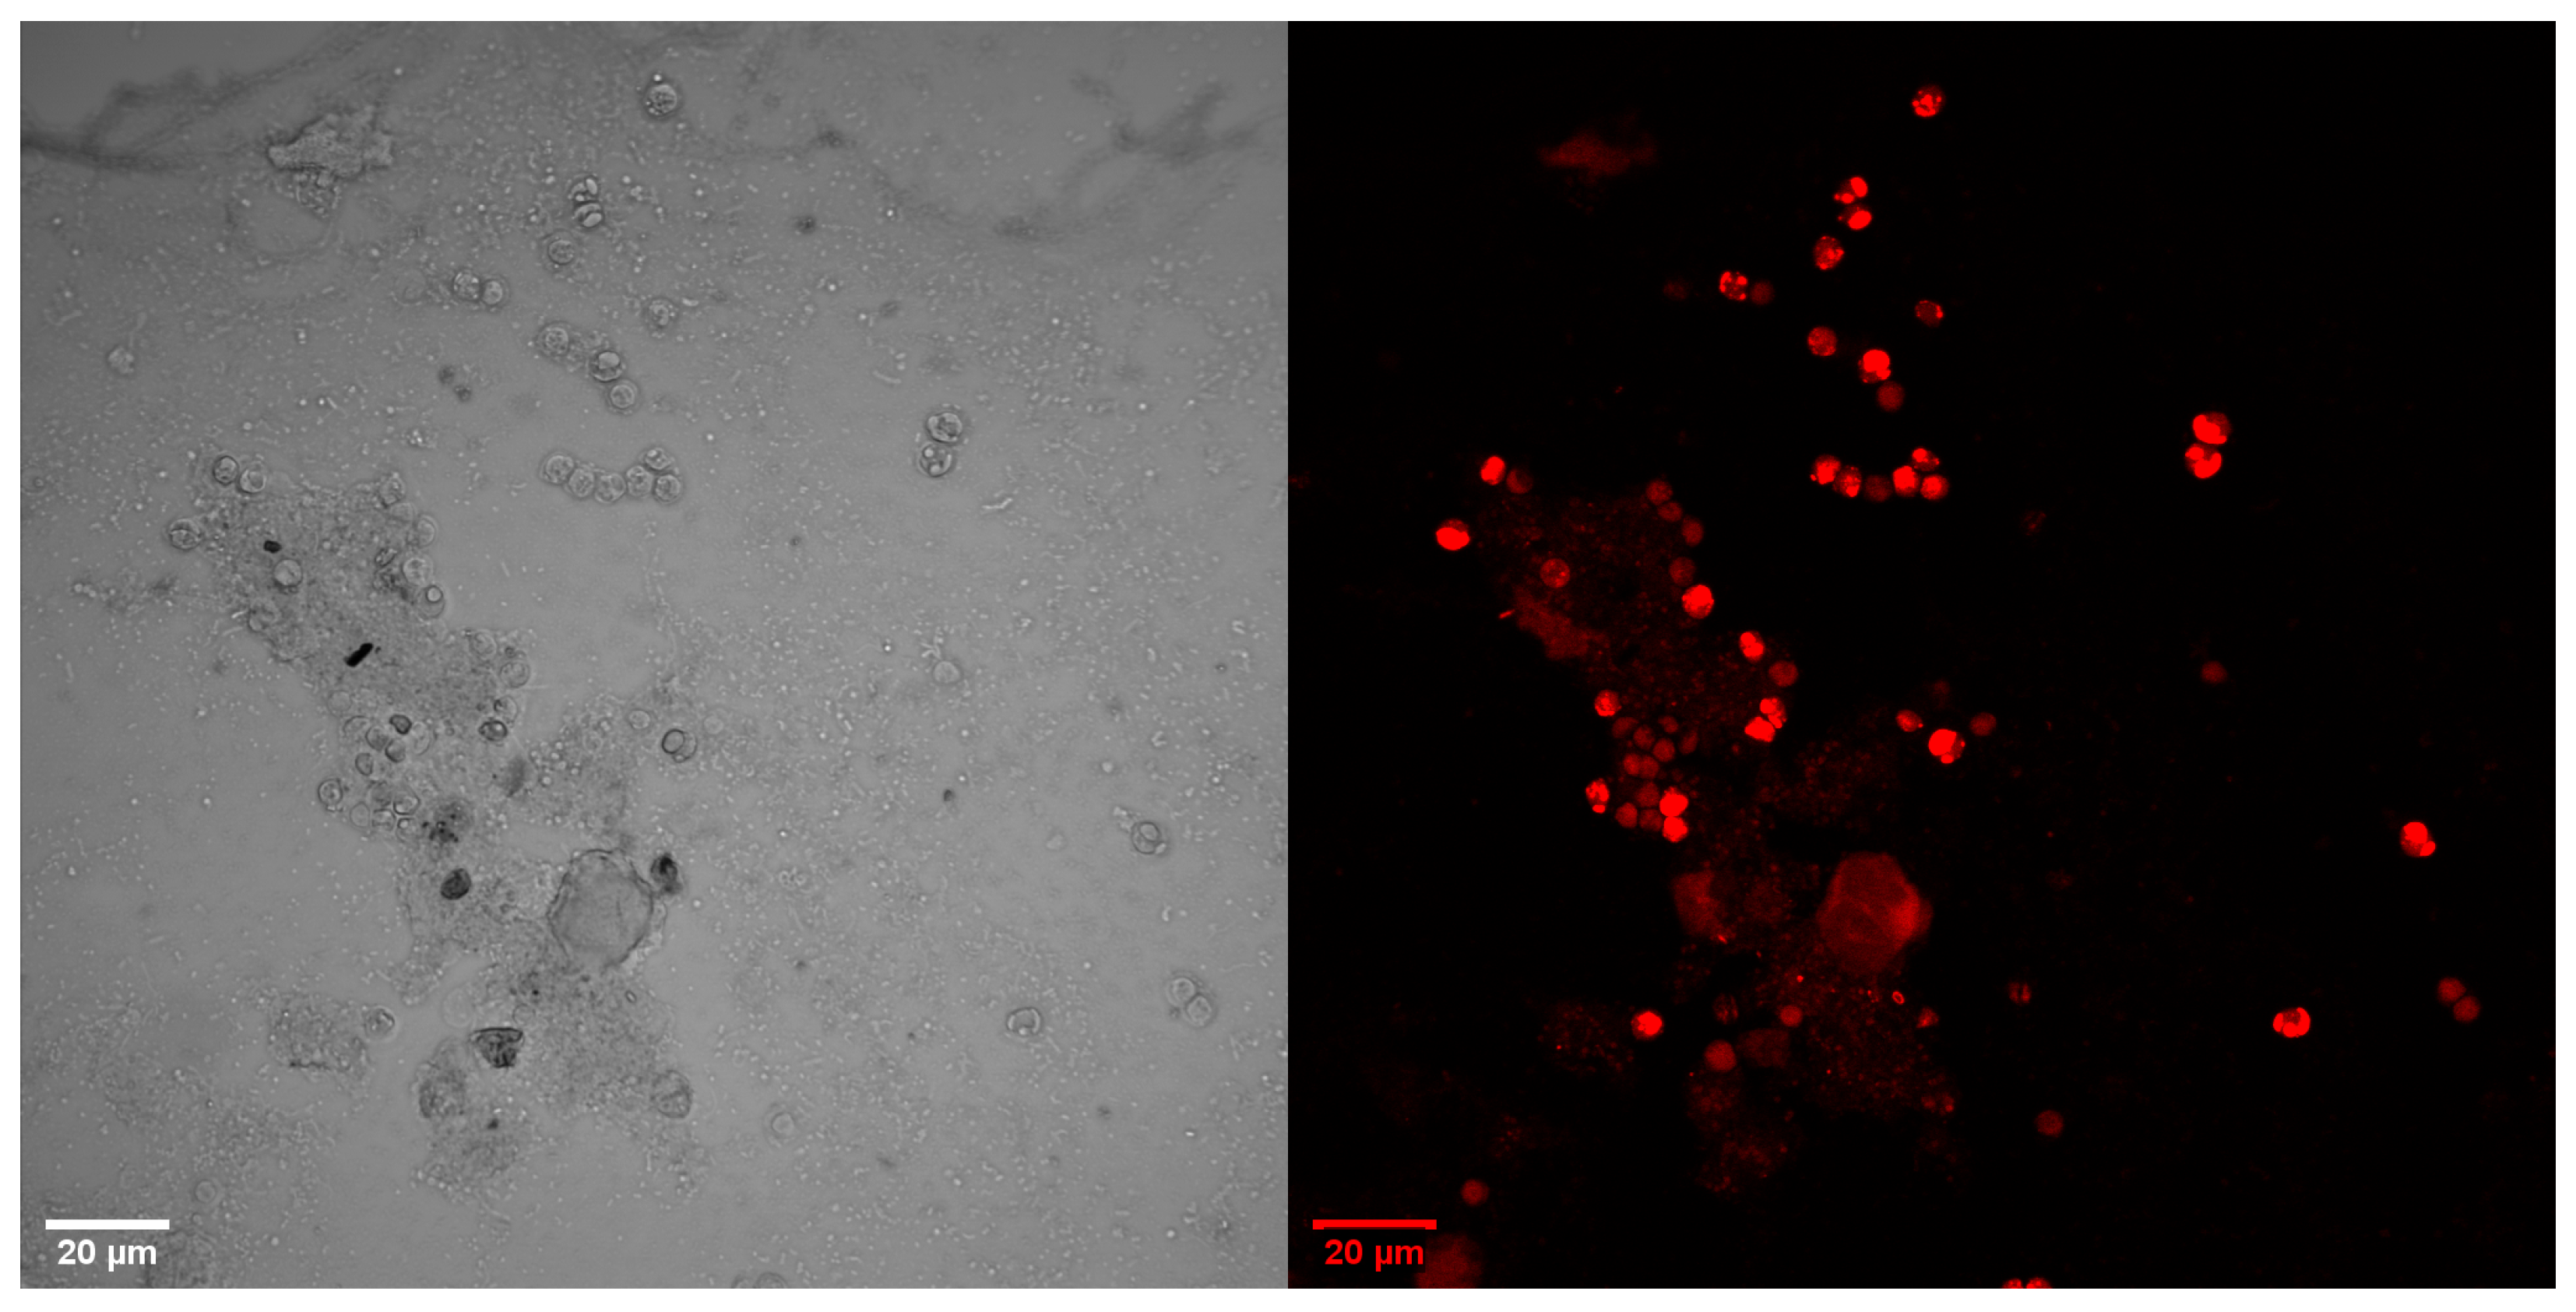
This section contains extra figures obtained from batch and continuous reactors for PHB production.
Figure A1. Microscopic images (objective 60×) of samples (batch reactor) observed in visible light and after using Nile Blue A procedure with red filter and blue laser excitation. Both photos were taken on day 66 of batch process and show variability in structure of PHB granules.
Energies 15 08390 g0a1aEnergies 15 08390 g0a1b
Figure A2. Microscopic images (objective 60×) of samples (continuous reactor) observed in visible light and after using Nile Blue A procedure with red filter and blue laser excitation. The photos were taken between day 54 and day 56 of continuous process.
Energies 15 08390 g0a2aEnergies 15 08390 g0a2b

References

  1. Gamal, R.F.; Abdelhady, H.M.; Khodair, T.A.; El-Tayeb, T.S.; Hassan, E.A.; Aboutaleb, K.A. Semi-scale production of PHAs from waste frying oil by Pseudomonas fluorescens S48. Braz. J. Microbiol. 2013, 44, 539–549. [Google Scholar] [CrossRef] [PubMed] [Green Version]
  2. Ritchie, H.; Roser, M. Plastic pollution. Our World in Data. 2018. Available online: https://ourworldindata.org/plastic-pollution (accessed on 1 September 2022).
  3. Coppola, G.; Gaudio, M.T.; Lopresto, C.G.; Calabro, V.; Curcio, S.; Chakraborty, S. Bioplastic from renewable biomass: A facile solution for a greener environment. Earth Syst. Environ. 2021, 5, 231–251. [Google Scholar] [CrossRef]
  4. Guzik, M. Bioplastiki Zapożyczone ze Świata Mikrobów, Technologiczny Niepokój. 2021. Available online: https://formy.xyz/artykul/bioplastiki-zapozyczone-ze-swiata-mikrobow/ (accessed on 11 October 2022).
  5. Pasternak, G. Bioreaktory oraz ich zastosowanie w inżynierii i ochronie środowiska. J. Ecol. Health 2011, 15, 121–125. [Google Scholar]
  6. Donnarumma, G.; Buommino, E.; Fusco, A.; Paoletti, I.; Auricchio, L.; Tufano, M.A. Effect of temperature on the shift of Pseudomonas fluorescens from an environmental microorganism to a potential human pathogen. Int. J. Immunopathol. Pharmacol. 2010, 23, 227–234. [Google Scholar] [CrossRef] [PubMed]
  7. Szewczyk, E. Biodegradable polyesters-polyhydroxyalkanoic acids (PHA)-synthetized by microorganisms. Biotechnologia 1996, 3, 97–115. [Google Scholar]
  8. Carpine, R.; Olivieri, G.; Hellingwerf, K.J.; Pollio, A.; Marzocchella, A. Industrial production of poly-β-hydroxybutyrate from CO2: Can cyanobacteria meet this challenge? Processes 2020, 8, 323. [Google Scholar] [CrossRef] [Green Version]
  9. Du, C.; Webb, C. Engineering Fundamentals of Biotechnology. In Comprehensive Biotechnology; Elsevier: Amsterdam, The Netherlands, 2011; Volume 2. [Google Scholar]
  10. Ushani, U.; Sumayya, A.R.; Archana, G.; Banu, J.R.; Dai, J. Enzymes/biocatalysts and bioreactors for valorization of food wastes. In Food Waste to Valuable Resources; Academic Press: Cambridge, MA, USA, 2020; pp. 211–233. [Google Scholar]
  11. Polyhydroxybutyrate. Available online: https://en.wikipedia.org/wiki/Polyhydroxybutyrate?fbclid=IwAR3phUlkTepcn6T_juLIGndkUbcFC9XwysgJ3titSdP8SZO4T2au7PHZbUQ (accessed on 11 October 2022).
  12. Amadu, A.A.; Qiu, S.; Ge, S.; Addico, G.N.D.; Ameka, G.K.; Yu, Z.; Xia, W.; Abbew, A.-W.; Shao, D.; Champagne, P.; et al. A review of biopolymer (Poly-β-hydroxybutyrate) synthesis in microbes cultivated on wastewater. Sci. Total Environ. 2021, 756, 143729. [Google Scholar] [CrossRef] [PubMed]
  13. Xu, A.L.; Xia, J.L.; Song, Z.W.; Jiang, P.; Xia, Y.; Wan, M.X.; Zhang, R.Y.; Yang, Y.; Liu, K.K. The effect of energy substrates on PHB accumulation of Acidiphilium cryptum DX1-1. Curr. Microbiol. 2013, 67, 379–387. [Google Scholar] [CrossRef] [PubMed]
  14. Getachew, A.; Woldesenbet, F. Production of biodegradable plastic by polyhydroxybutyrate (PHB) accumulating bacteria using low cost agricultural waste material. BMC Res. Notes 2016, 9, 509. [Google Scholar] [CrossRef] [PubMed] [Green Version]
  15. Jankiewicz, U. Characteristic and significance of pyoverdines of the genus Pseudomonas. Adv. Microbiol. 2009, 48, 243–254. [Google Scholar]
  16. Michałkiewicz, M. Mikrobiologia ścieków. Technol. Wody 2018, 6, 58–62. [Google Scholar]
  17. Tang, M.; Jiang, J.; Lv, Q.; Yang, B.; Zheng, M.; Gao, X.; Han, J.; Zhang, Y.; Yang, Y. Denitrification performance of Pseudomonas fluorescens Z03 immobilized by graphene oxide-modified polyvinyl-alcohol and sodium alginate gel beads at low temperature. R. Soc. Open Sci. 2020, 7, 191542. [Google Scholar] [CrossRef] [PubMed] [Green Version]
  18. Wang, Q.; Yu, H.; Xia, Y.; Kang, Z.; Qi, Q. Complete PHB mobilization in Escherichia coli enhances the stress tolerance: A potential biotechnological application. Microb. Cell Factories 2009, 8, 47. [Google Scholar] [CrossRef] [PubMed] [Green Version]
  19. Luther, A.K. Ammonia Toxicity in Bacteria and Its Implications for Treatment of and Resource Recovery from Highly Nitrogenous Organic Wastes; Rutgers The State University of New Jersey: New Brunswick, NJ, USA, 2015. [Google Scholar]
  20. Fiedurek, J.; Trytek, M. The effect of acid and osmotic stress on metabolite production by microorganisms. Post. Mikrobiol. 2016, 55, 195–204. [Google Scholar]
  21. Jeong, H.; Park, J.; Kim, H. Determination of NH4+ in environmental water with interfering substances using the modified Nessler method. J. Chem. 2013, 2013, 359217. [Google Scholar] [CrossRef]
  22. PanReac AppliChem ITW Reagents, Reagents for COD Analysis. Available online: https://www.itwreagents.com/download_file/info_point/IP-025/en/IP-025_en.pdf (accessed on 11 October 2022).
  23. Gaca, J.; Duszkiewicz, J.; Michalska, B. Porównanie Metod Oznaczania Chemicznego Zapotrzebowania Tlenu w Obecności Wysokiego Stężenia Chlorków. 1999. Available online: http://repozytorium.ukw.edu.pl/handle/item/3020 (accessed on 28 August 2022).
  24. Cerk, I.K.; Wechselberger, L.; Oberer, M. Adipose triglyceride lipase regulation: An overview. Curr. Protein Pept. Sci. 2018, 19, 221–233. [Google Scholar] [CrossRef] [PubMed]
  25. Smith, A. How Does Sudan III Detect Lipids? Rehabilitationrobotics.net. 2021. Available online: https://rehabilitationrobotics.net/how-does-sudan-iii-detect-lipids/ (accessed on 11 October 2022).
  26. Iyer, G.; Menon, S.; Gupte, Y.; Phadnis, S.; Pawar, Y. Morpho-physiological characteristics of Botryococcus Braunii (Kutzing, 1849) & its oil production from the species isolated from thane, Maharashtra, India. Asian J. Microbiol. Biotechnol. Environ. Sci. 2012, 14, 523–526. [Google Scholar]
  27. Aremu, M.O.; Olu-Arotiowa, O.A.; Layokun, S.K.; Solomon, B.O. Growth of Pseudomonas fluorescens on cassava starch hydrolysate for polyhydroxybutyrate production. J. Appl. Sci. Environ. Manag. 2010, 14, 61–66. [Google Scholar] [CrossRef]
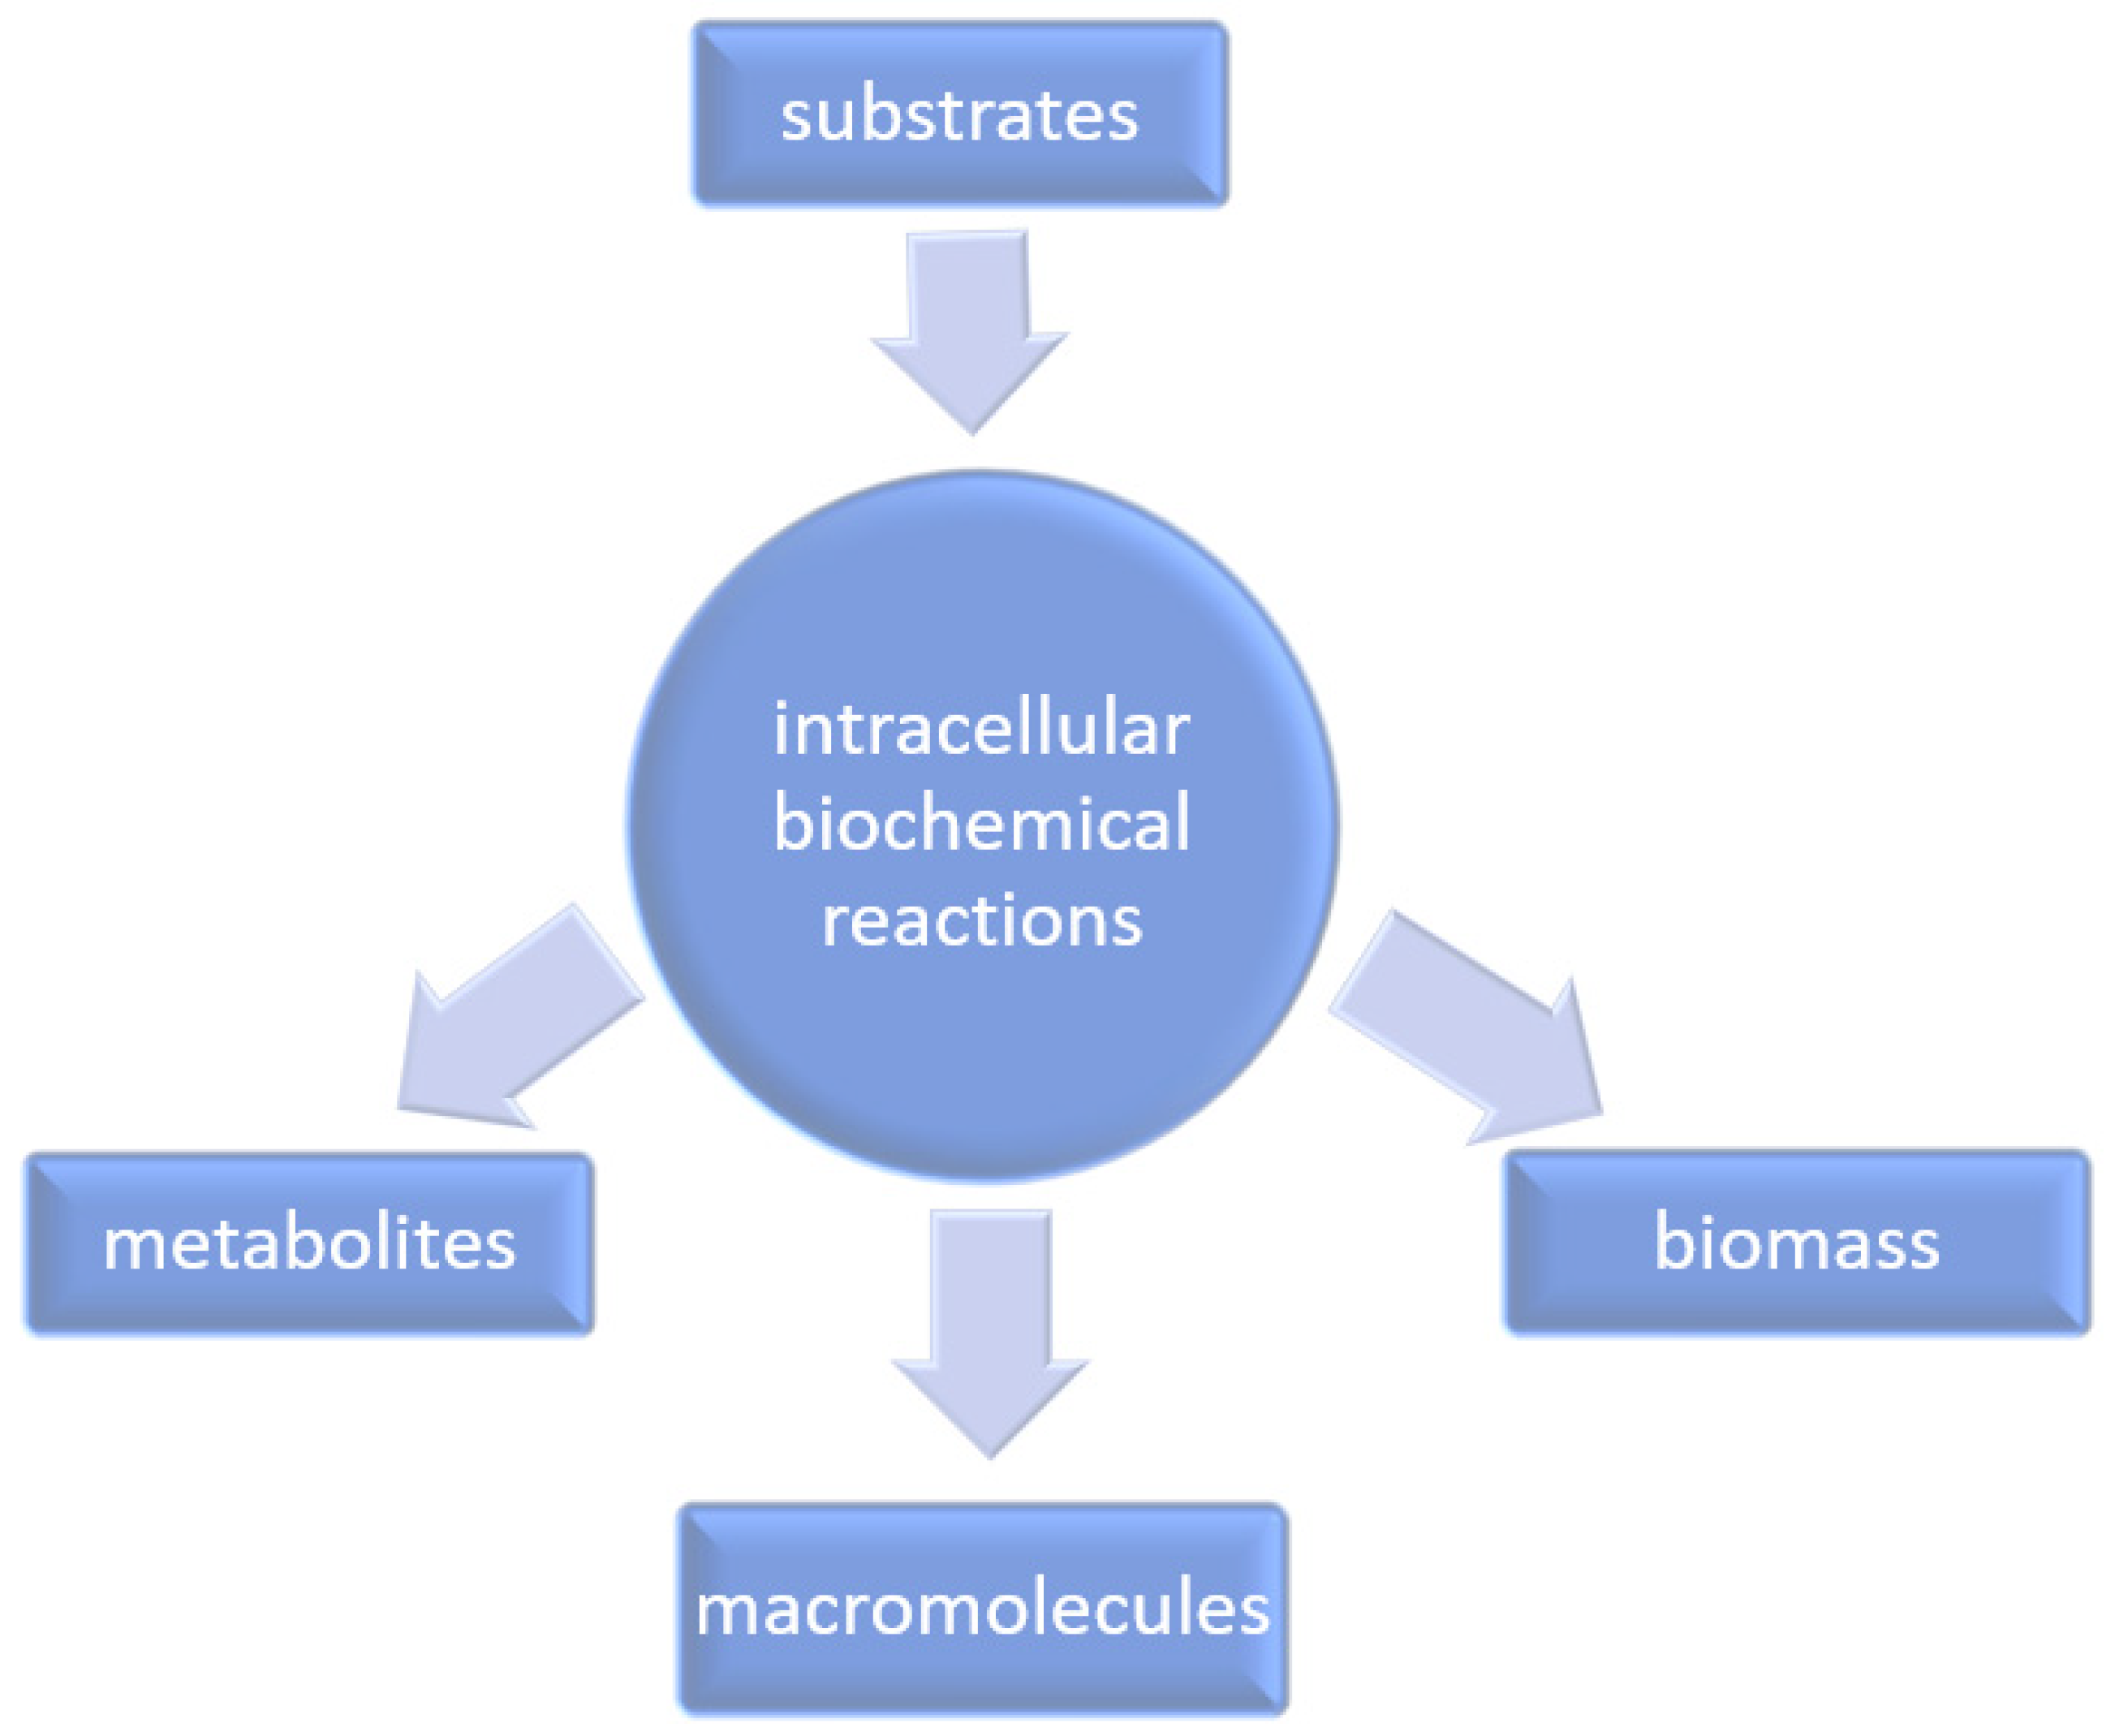
Figure 1. Scheme of PHB biosynthesis [7,8,9,10,11].
Energies 15 08390 g001
Figure 2. Scheme of the cell growth.
Energies 15 08390 g002
Figure 3. Structure of a single PHB granule [27].
Energies 15 08390 g003
Figure 4. Relationship in time between chemical oxygen demand, nutrient medium, and filtered sample from the batch bioreactor.
Energies 15 08390 g004
Figure 5. Relationship in time between chemical oxygen demand, nutrient medium, and unfiltered sample from the batch bioreactor.
Energies 15 08390 g005
Figure 6. Relationship in time between chemical oxygen demand, nutrient medium, and biomass in a batch bioreactor.
Energies 15 08390 g006
Figure 7. Relationship in time between chemical oxygen demand, nutrient medium, and filtered sample from the continuous-flow bioreactor.
Energies 15 08390 g007
Figure 8. Relationship in time between chemical oxygen demand, medium and unfiltered sample from the continuous-flow bioreactor.
Energies 15 08390 g008
Figure 9. The time relationship between chemical oxygen demand, nutrient medium, and biomass in a continuous-flow bioreactor.
Energies 15 08390 g009
Figure 10. Microscopic images (objective 60×) of the sample observed in visible light and after using Nile Blue A procedure with red filter and blue laser excitation.
Energies 15 08390 g010
Figure 11. Microscopic image with identified PHB granules (left) and histogram showing the percentage of PHB on the microscopic image (right), marked with vertical lines: m—median; x—mean; ±s—standard deviation.
Energies 15 08390 g011
Figure 12. Microscopic images (objective 60×) of the sample (batch reactor) observed in visible light and after using Nile Blue A procedure with red filter and blue laser excitation. The photo was taken on day 66 of batch process.
Energies 15 08390 g012
Figure 13. Microscopic images (objective 60×) of the sample (continuous reactor) observed in visible light and after using Nile Blue A procedure with red filter and blue laser excitation. The photo was taken on day 53 of continuous process.
Energies 15 08390 g013
Table 1. Batch bioreactor measurements between 57th and 66th days.
DayLipase Activity, mmol/dm3/sNitrogen, mg/LCOD, mg/LCOD (w/o Filtration), mg/LBiomass, g/LOil, mLPeptone, g
570.30064.1516014001.4800.25
580.22137.7524010402.1010
590.154512.54023600.5600.25
600.00832.75440-0.7600.25
610.167015.008019200.4010
620.10447.001209600.4600.50
640.054311.544040000.3800.25
650.083513.2520012000.3610
660.13363.7512013600.8210
Table 2. Continuous-flow reactor measurements between day 53 and day 57.
DayLipase Activity, mmol/dm3/sNitrogen, mg/LCOD, mg/LCOD (w/o Filtration), mg/LBiomass, g/LOil,
mL
Peptone,
g
H2O,
L
NaHCO3, g
530.27890.45536480.4610.50.50.2
540.27551.05604480.4810.50.50.2
550.28470.40676480.6810.50.50.2
560.32730.50547600.5610.50.50.2
570.33730.20445360.4010.50.50.2
Publisher’s Note: MDPI stays neutral with regard to jurisdictional claims in published maps and institutional affiliations.