Review

The Lean Blowout Prediction Techniques in Lean Premixed Gas Turbine: An Overview

by
Abdulrahman Abdullah Bahashwan
1,*,
Rosdiazli Bin Ibrahim
1,
Madiah Binti Omar
2 and
Mochammad Faqih
2
1
Department of Electrical and Electronics, Universiti Teknologi PETRONAS, Seri Iskandar 32610, Malaysia
2
Department of Chemical Engineering, Universiti Teknologi PETRONAS, Seri Iskandar 32610, Malaysia
*
Author to whom correspondence should be addressed.
Energies 2022, 15(22), 8343; https://doi.org/10.3390/en15228343
Submission received: 7 October 2022 / Revised: 1 November 2022 / Accepted: 3 November 2022 / Published: 8 November 2022
(This article belongs to the Section I2: Energy and Combustion Science)

Abstract

:
The lean blowout is the most critical issue in lean premixed gas turbine combustion. Decades of research into LBO prediction methods have yielded promising results. Predictions can be classified into five categories based on methodology: semi-empirical model, numerical simulation, hybrid, experimental, and data-driven model. First is the semi-empirical model, which is the initial model used for LBO limit prediction at the design stages. An example is Lefebvre’s LBO model that could estimate the LBO limit for eight different gas turbine combustors with a ±30% uncertainty. To further develop the prediction of the LBO limit, a second method based on numerical simulation was proposed, which provided deeper information and improved the accuracy of the LBO limit. The numerical prediction method outperformed the semi-empirical model on a specific gas turbine with ±15% uncertainty, but more testing is required on other combustors. Then, scientists proposed a hybrid method to obtain the best out of the earlier models and managed to improve the prediction to ±10% uncertainty. Later, the laboratory-scale combustors were used to study LBO phenomena further and provide more information using the flame characteristics. Because the actual gas turbine is highly complex, all previous methods suffer from simplistic representation. On the other hand, the data-driven prediction methods showed better accuracy and replica using a real dataset from a gas turbine log file. This method has demonstrated 99% accuracy in predicting LBO using artificial intelligence techniques. It could provide critical information for LBO limits prediction at the design stages. However, more research is required on data-driven methods to achieve robust prediction accuracy on various lean premixed combustors.

1. Introduction

Gas turbines have gained favor in the power industry as of late. The gas turbines of today are highly efficient and low maintenance. They have numerous benefits as a means of energy production on a variety of scales, including more fuel flexibility, lower weight, lower vibration levels, and a lower weight to net power output ratio [1,2]. A constant flame is supported by the turbulence and high rate of heat production in the reacting flow within a gas turbine combustor. In a turbine, gas may be ignited in one of three ways: premixed combustion, non-premixed combustion, or partially premixed combustion. Prior to the introduction of stringent NOx regulations, the early gas turbines with the diffusion flame were used widely in industry and were efficiently managing CO emissions because of the high flame temperature, at the same time achieving high combustion efficiency and low-pressure loss. On the other hand, NOx emissions were extremely high. As regulations on NOx emissions became more stringent, however, attention switched to the creation of alternative combustion techniques that would comply with these new regulations [3]. Because of this shift, lean premixed combustion technology for gas turbines was developed. The lean premixed (LPM) combustion has significantly reduced NOx emission while keeping high efficiency in power production. On the contrary, lean premixed combustors suffer from an undesirable event called lean blowout caused by the low flame temperature and combustion instability [4]. The lean blowout is a significant event that may cause serious harm to the combustor. The phenomenon has been investigated on a variety of combustors deeply. In order to determine the performance of gas turbine combustors and engines, cut-and-try testing is often used. Since the high expense of experimentation makes it impractical to routinely test complex combustion systems, combustion experts have developed a wide range of methods and processes for predicting combustor instabilities as simplified in Figure 1 [5].
Starting from the 1970s, the industrial heavy duty gas turbine manufacturers have been required to meet the emission limitations on carbon oxide (CO) and nitrogen oxide (NOx) and satisfy the environmental rules and legislation of the country [6,7]. However, because of the significant increase in pollution and its extreme harm toward the environment and humanity, the regulations on emission limits have become even more strict over time [8,9]. Therefore, the technology has evolved from the conventional gas turbines to the water/steam injection systems to lean premixed gas turbines such as the dry low emission/NOx (DLE/DLN) technologies [10]. Nowadays, advanced combustors may achieve NOx and CO emissions with a single digit by ultra-lean premixed combustion at very low air/fuel equivalence ratios. On the other hand, ultra-lean combustion is very prone to thermoacoustic instabilities and lean blowout [11,12].
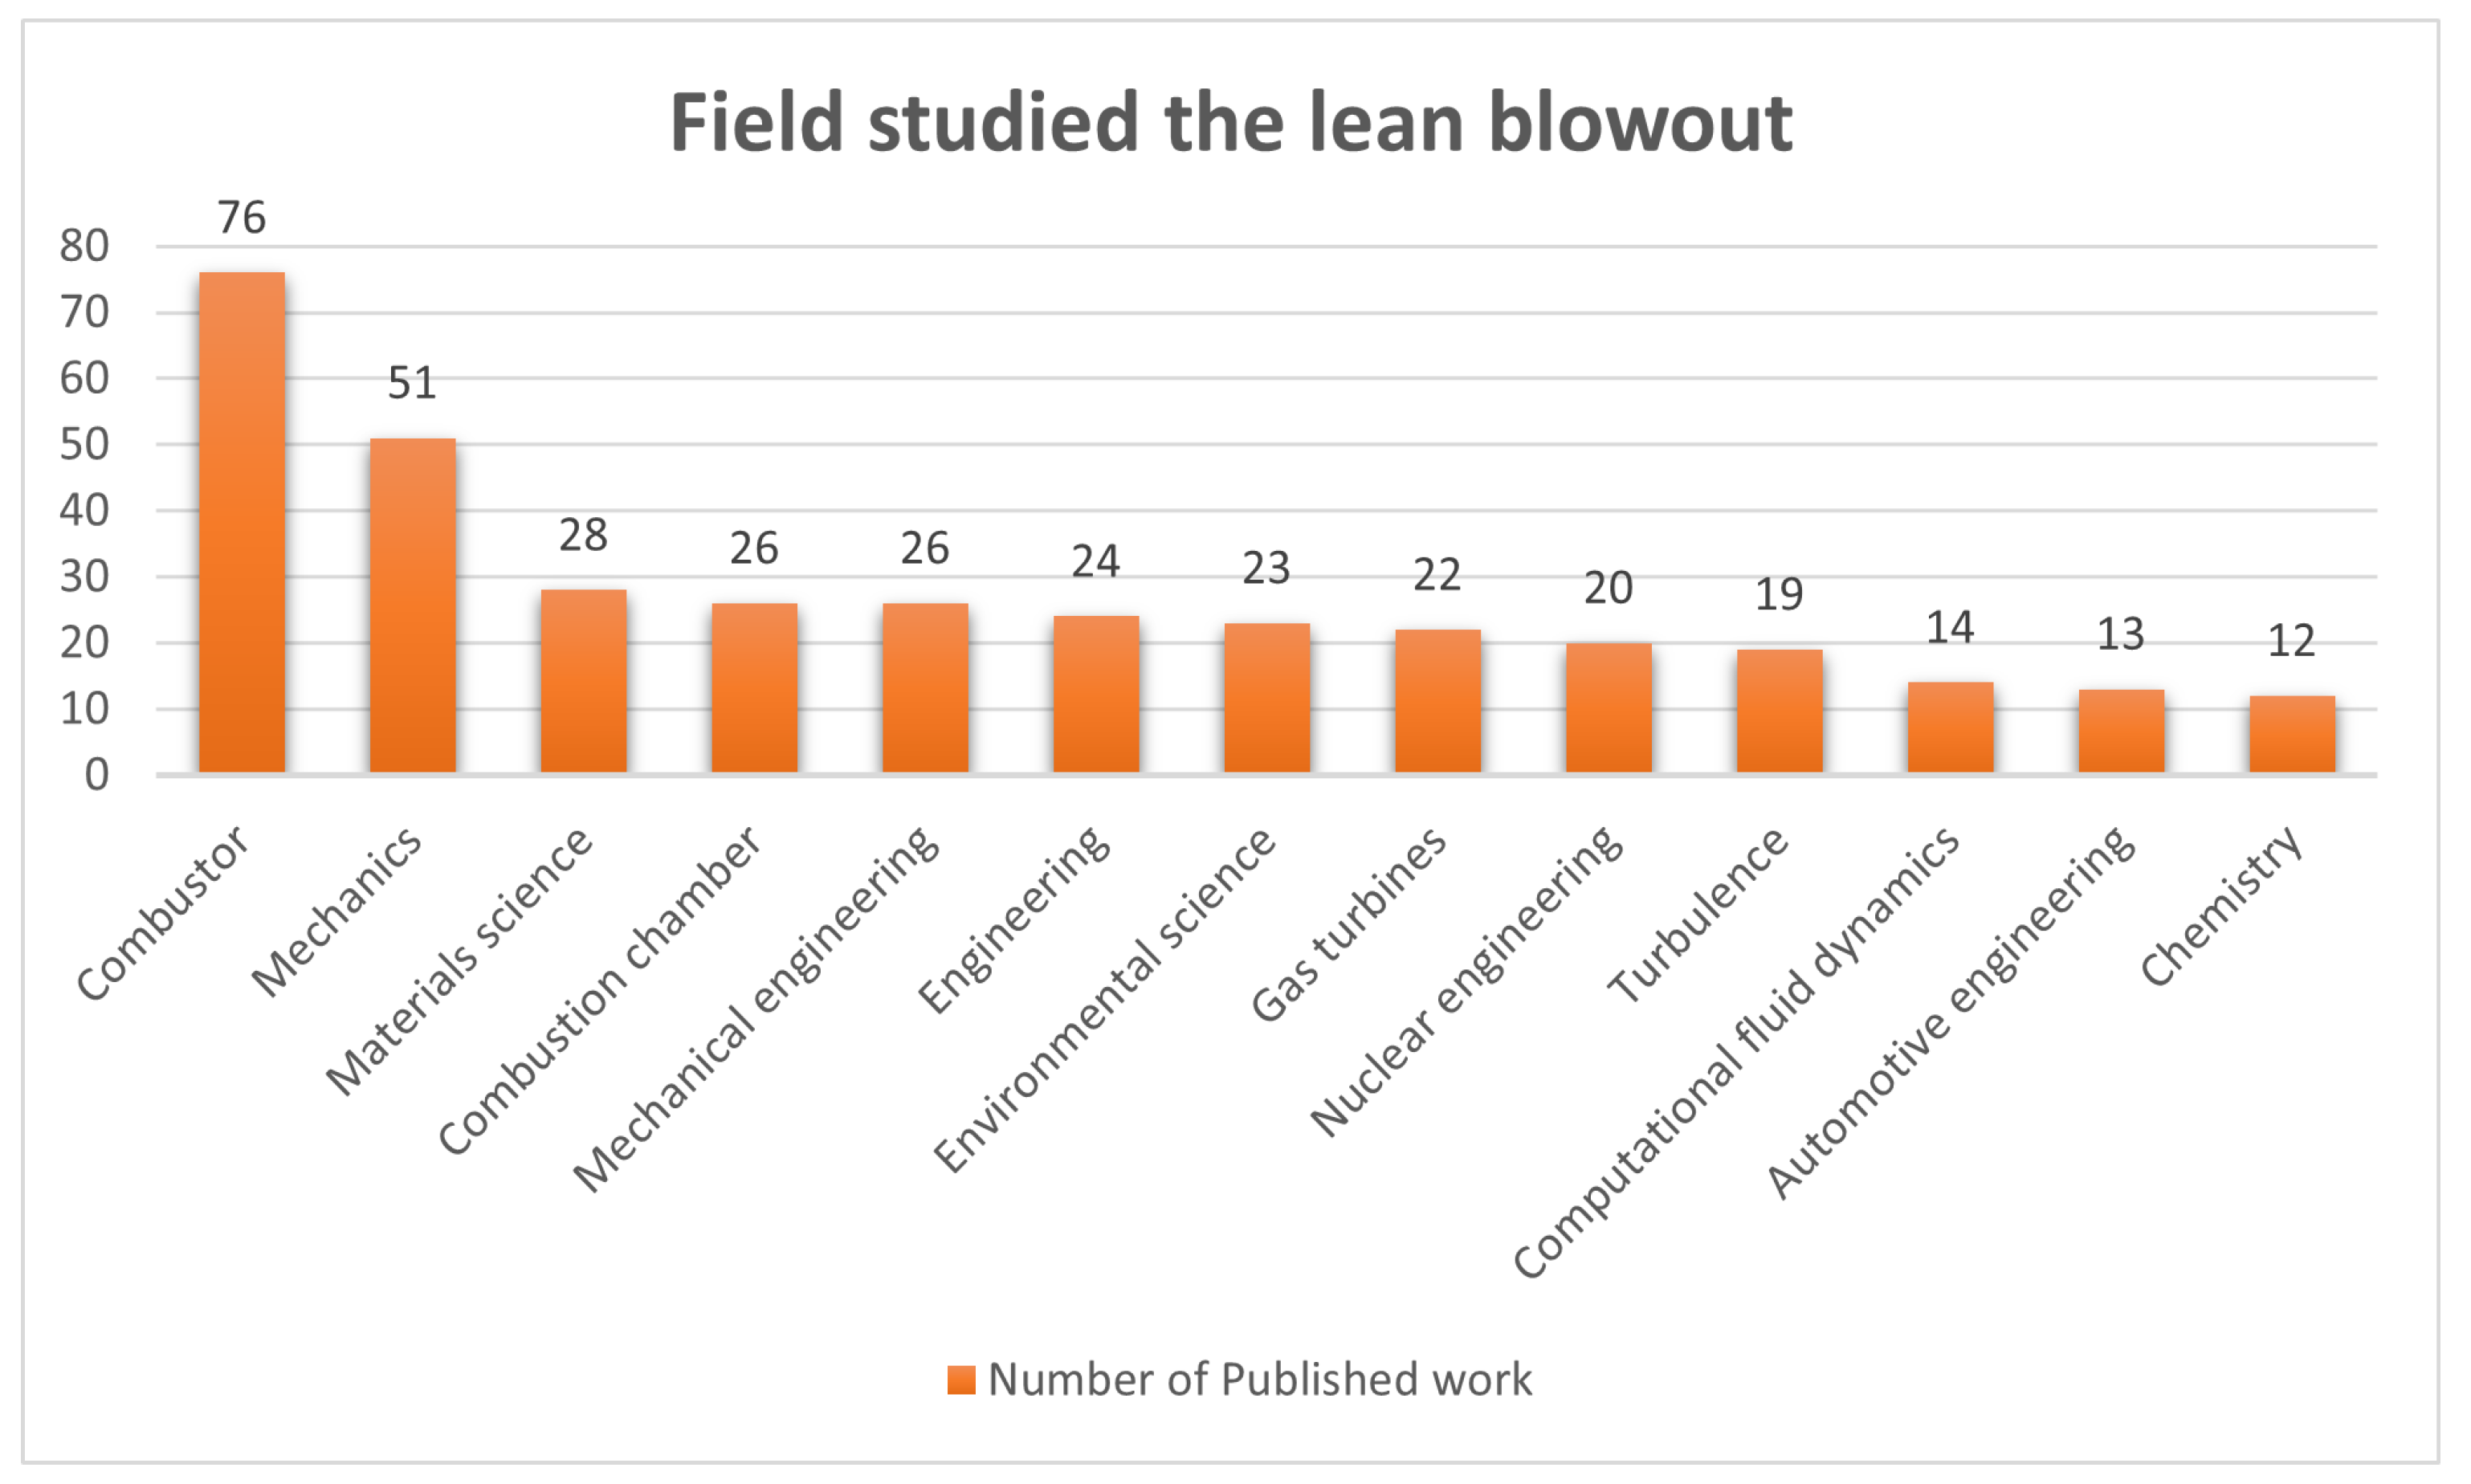
Similarly in aircraft engines, with the conventional gas turbines, the LBO issue was considered to be of minor importance. These types of gas turbines with a poor mixing of fuel/air have the advantageous property of letting the combustion operate even with low combustion efficiency, which in return produces high emissions [13]. Therefore, endless efforts have been made over the last decades to reduce the harmful emissions produced by aircraft engines [14]. In order to achieve relatively lean combustion, high-efficiency combustion along with better fuel and air mixing prior to combustion have been extensively used, which has resulted in a reduction in stability and the emergence of the LBO as a serious issue in aircraft operation. From the statistical graph in Figure 2, such phenomenon have been studied by a variety of fields as well.
Basically, LBO is a total flameout of one or more combustion chambers in heavy duty gas turbines using lean premixed technologies. It may have a variety of effects depending on the severity of the factors that caused it. Incipient LBO may occur randomly and resolve without affecting gas turbine performance, for example, during load or combustion mode transients, or it can occur with full flameout and a subsequent unscheduled engine stop [15]. The latter leads to the gas turbine’s unavailability, faster component deterioration, ultimate loss of output and increase in CO emissions [16,17].
Furthermore, LBO has been detected as a result of variations in the composition of the fuel gas, incorrect fuel split, poor operation/tuning of control components, instrumentation failure or calibration shift, and difficulties with the combustion hardware. When an LBO occurs, the gas/air premix continues to enter the combustion chamber with decreased or absent combustion, resulting in two immediate effects: load reduction and the appearance of a cold spot in the Exhaust Gas Temperature (EGT) profile [18]. Even by tuning of the lean premixed system, as in optimizing the distribution of fuel streams in the combustion chambers across the whole operating range, is thus essential to achieve an optimal balance between emissions level, limits from LBO, and an acceptable level of dynamics, and even with a correctly calibrated system, drastic changes in ambient conditions (in general, any factor affecting the fuel/air ratio) may have an effect on emissions or diminish the LBO limits [19].
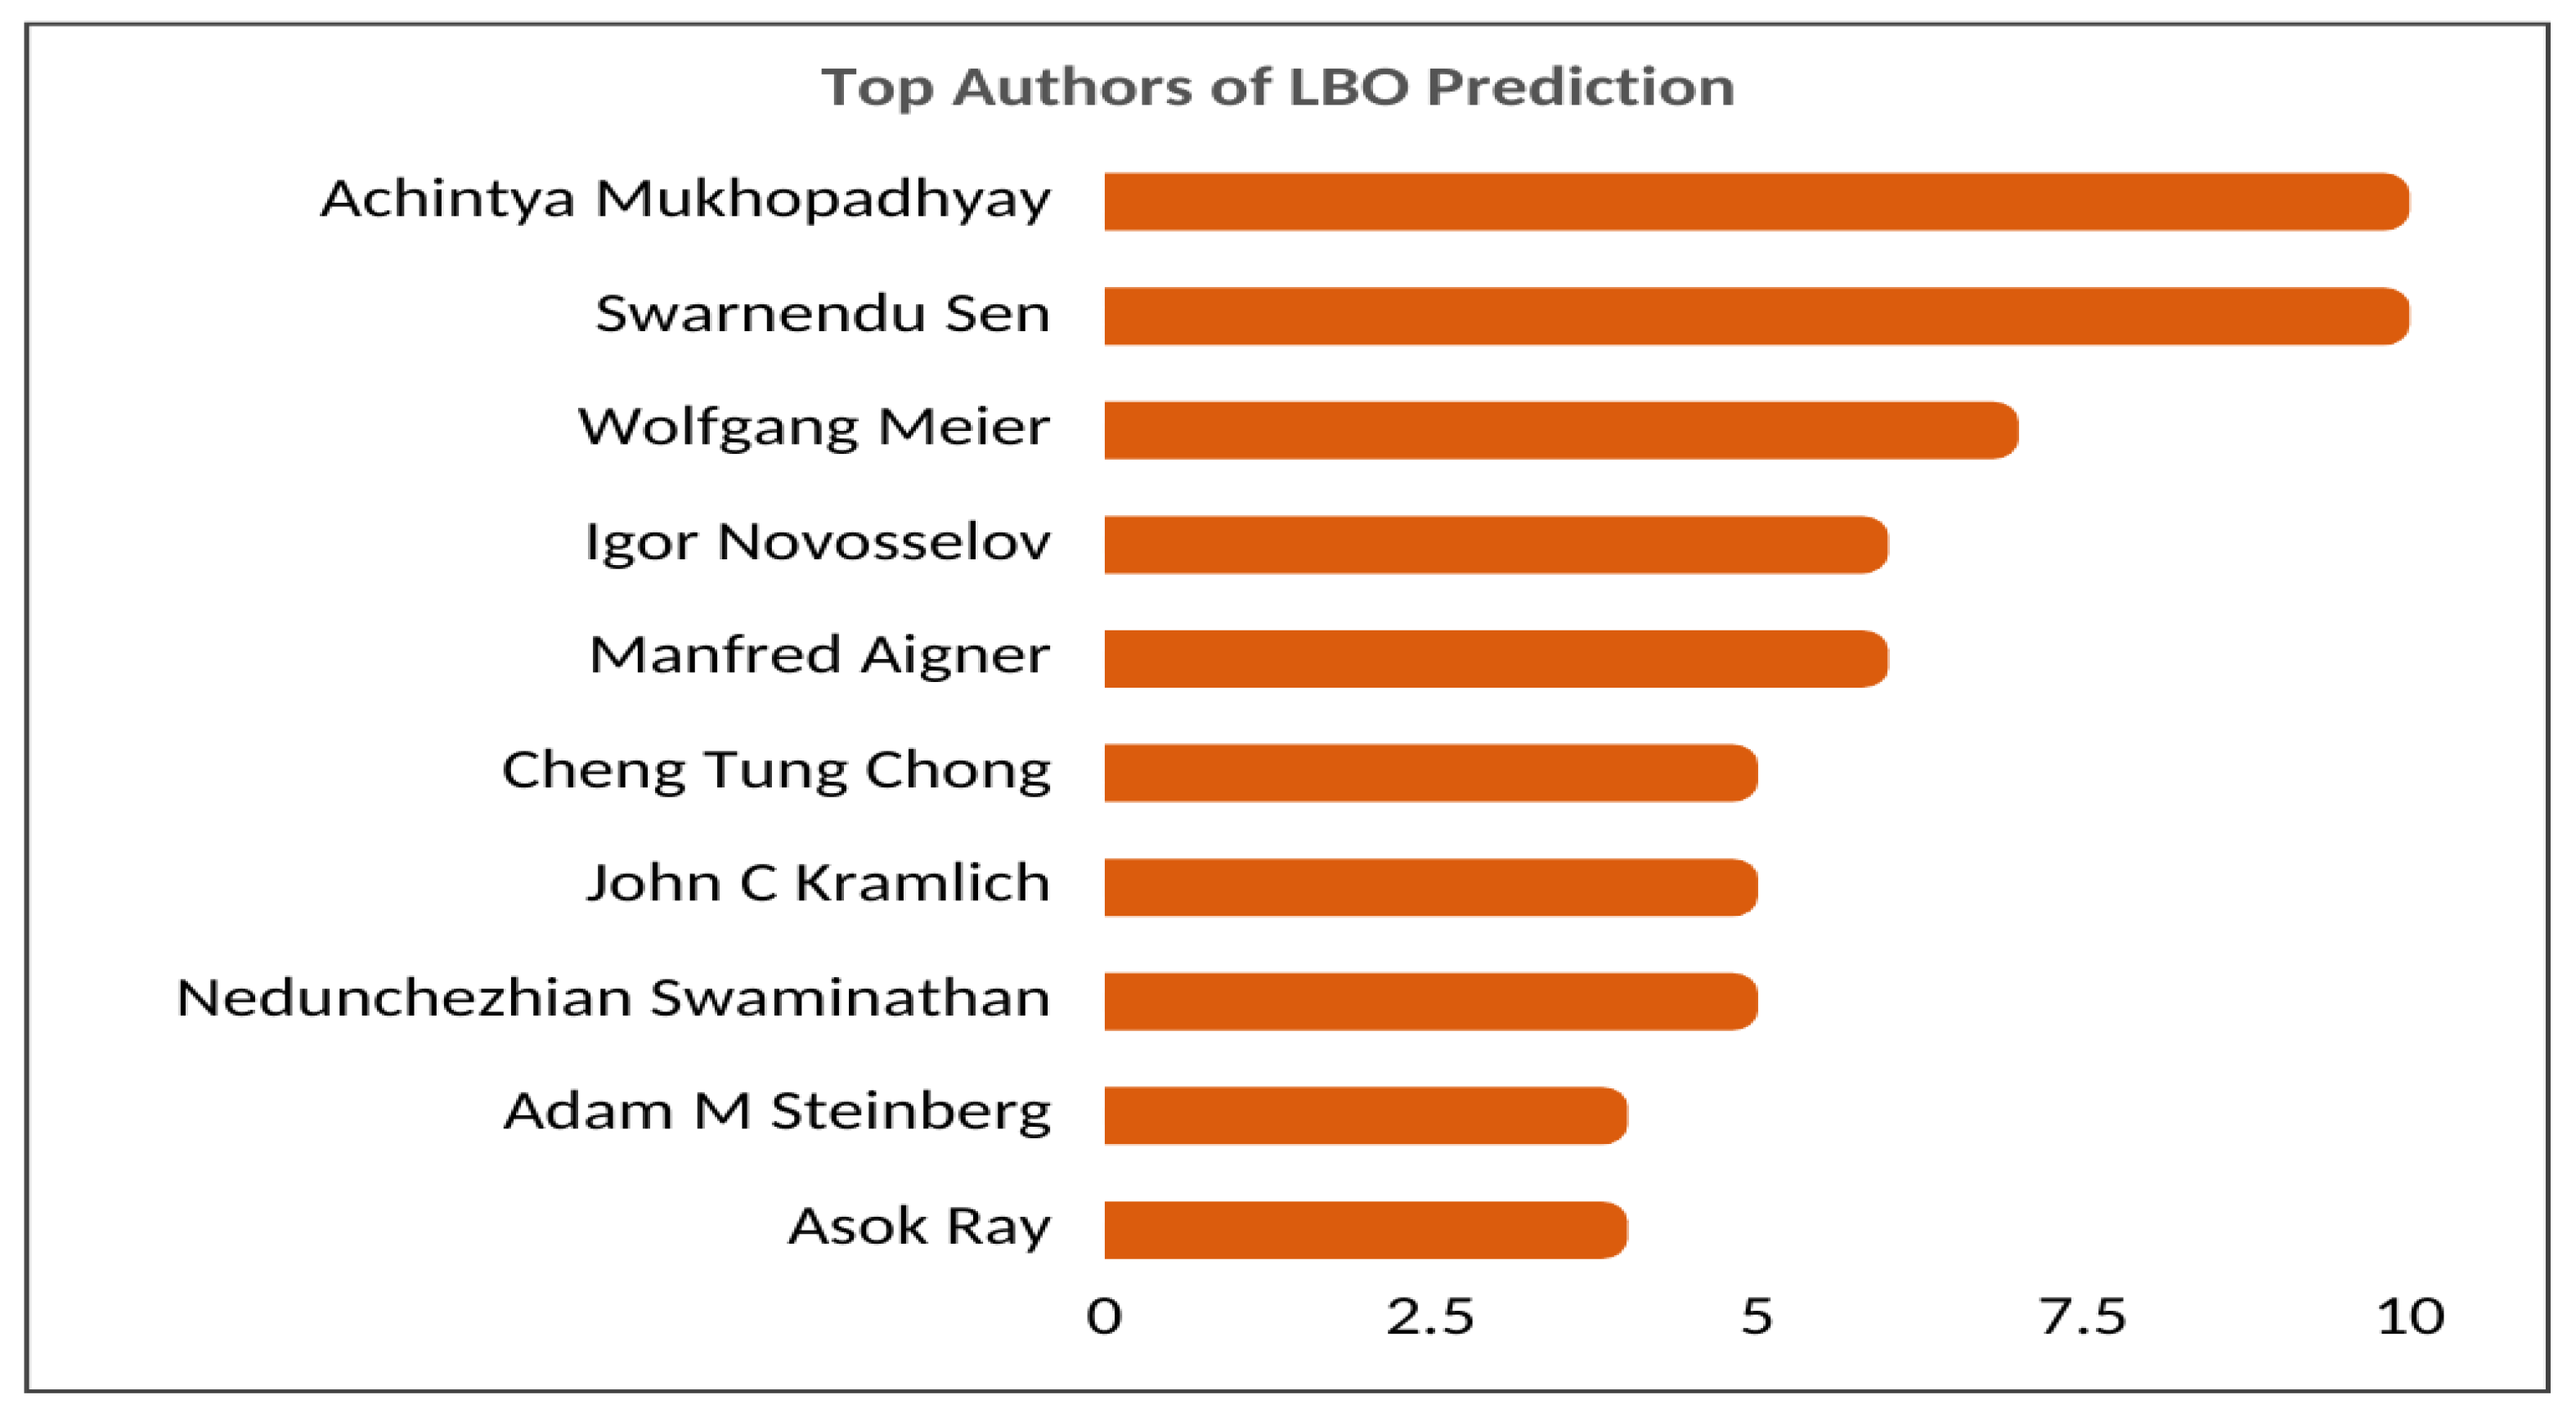
Since LBO is the major critical error in a premixed gas turbine, that could cause a major financial loss and component damages, besides the fatality of such an error in the aerojet lean premixed combustors. The prediction of LBO has emerged as a significant research area for combustion scientists and combustor design engineers in recent decades, as Figure 3 shows the top contributed scientist to the field of LBO prediction [20]. Nowadays, the most widely used approaches for LBO prediction are semi-empirical, the numerical simulation, the hybrid of the first two, the experimental laboratory combustor approach and the recent method of a data-driven approach. This paper represents a comprehensive review of the techniques used to predict the LBO error in the LPM combustors. A comparison of their advantages and disadvantages and the prediction accuracy follows.

2. LBO Prediction Techniques

2.1. The Semi-Empirical Model

The combustors’ geometries are pretty complicated. Because of the high complexity, the semi-empirical model is proposed based on the physical approach to simplify the system because the physical-based model is the preferred model within the semi-empirical. In addition, the semi-empirical model could help provide a good estimation of the gas turbine performance and can be used to improve the LBO limits at the design stages of the LPM combustors. Because of this simultaneous complexity, it is recommended that a semi-empirical model be used to simplify the system [20].
The swirl-stabilized combustor is the most common form of the gas turbine. The LBO mechanism and prediction techniques for such combustors have been extensively explored during the last decades. One of the most widely used approaches for predicting the lean blowout gas turbine is the the semi-empirical-based model. Since the semi-empirical approach was developed earlier, it has gone through a lengthy study process and has been progressively changed and enhanced to ensure its suitability for engineering applications. The model is mainly used for LBO limits prediction in the gas turbine. It was an essential tool for designing a lean premixed combustor with better LBO limits. The semi-empirical approach can be divided into two categories: the first is the characteristic time (CT) and the second is the perfect stirred reactor (PSR).
The CT model is based on the Damkohler (Da) number, and it was was pioneered by Zukoski and Marble [21], who made a breakthrough in the semi-empirical models in 1955. The authors used the ignition delay time of the fuel/air mixes as an equivalent to the time required for shear layer mixing. In another word, The LBO would occur when the ignition delay time is longer than the particle time spent in the shear layer. On the opposite side, the combustion is stable when the ignition delay time is shorter. Therefore, the indication of LBO is when both times are equal. The equation can be written as follows
τ s h = τ i g
where τ s h and τ i g are the particle time spent in a shear layer and the ignition delay time, respectively. Such a simple equation was beneficial in the early stages of LPM combustion design to predict the LBO limits in terms of determining the best recirculating zone length and the stream velocity, as the equation can be further written as follows
τ s h L r z V s
where L r z and V s are the length of the recirculation zone and the steam velocity. Because of the simplicity of the model, it needed further development to predict the LBO limit accurately. Later, Plee and Mellor [22] improved the characteristic time model’s prediction formula of Zukoaki and Marble, and they added droplet evaporation rates to the preceding model and successfully validated the model on three types of combustors [23,24,25,26]. The equation of Plee and Mellor can be expressed as follows
τ s h τ i g + τ d r
where τ d r is the droplet evaporation rate. However, the performance of the model was not optimum.
On the other hand, Longwell et al. [27] in 1953 hypothesized that the recirculation zone behind a bluff body might be idealized as a Perfect Stirred Reactor (PSR), with the burning zone being the PSR. The PSR model became a central tenet in the research of the LBO semi-empirical models. The authors suggested that when the heat loss in the recirculation zone and the heat released are equal, LBO will occur. Additionally, they observed that the pressure of the recirculation zone is proportional to the stability of LBO velocity.
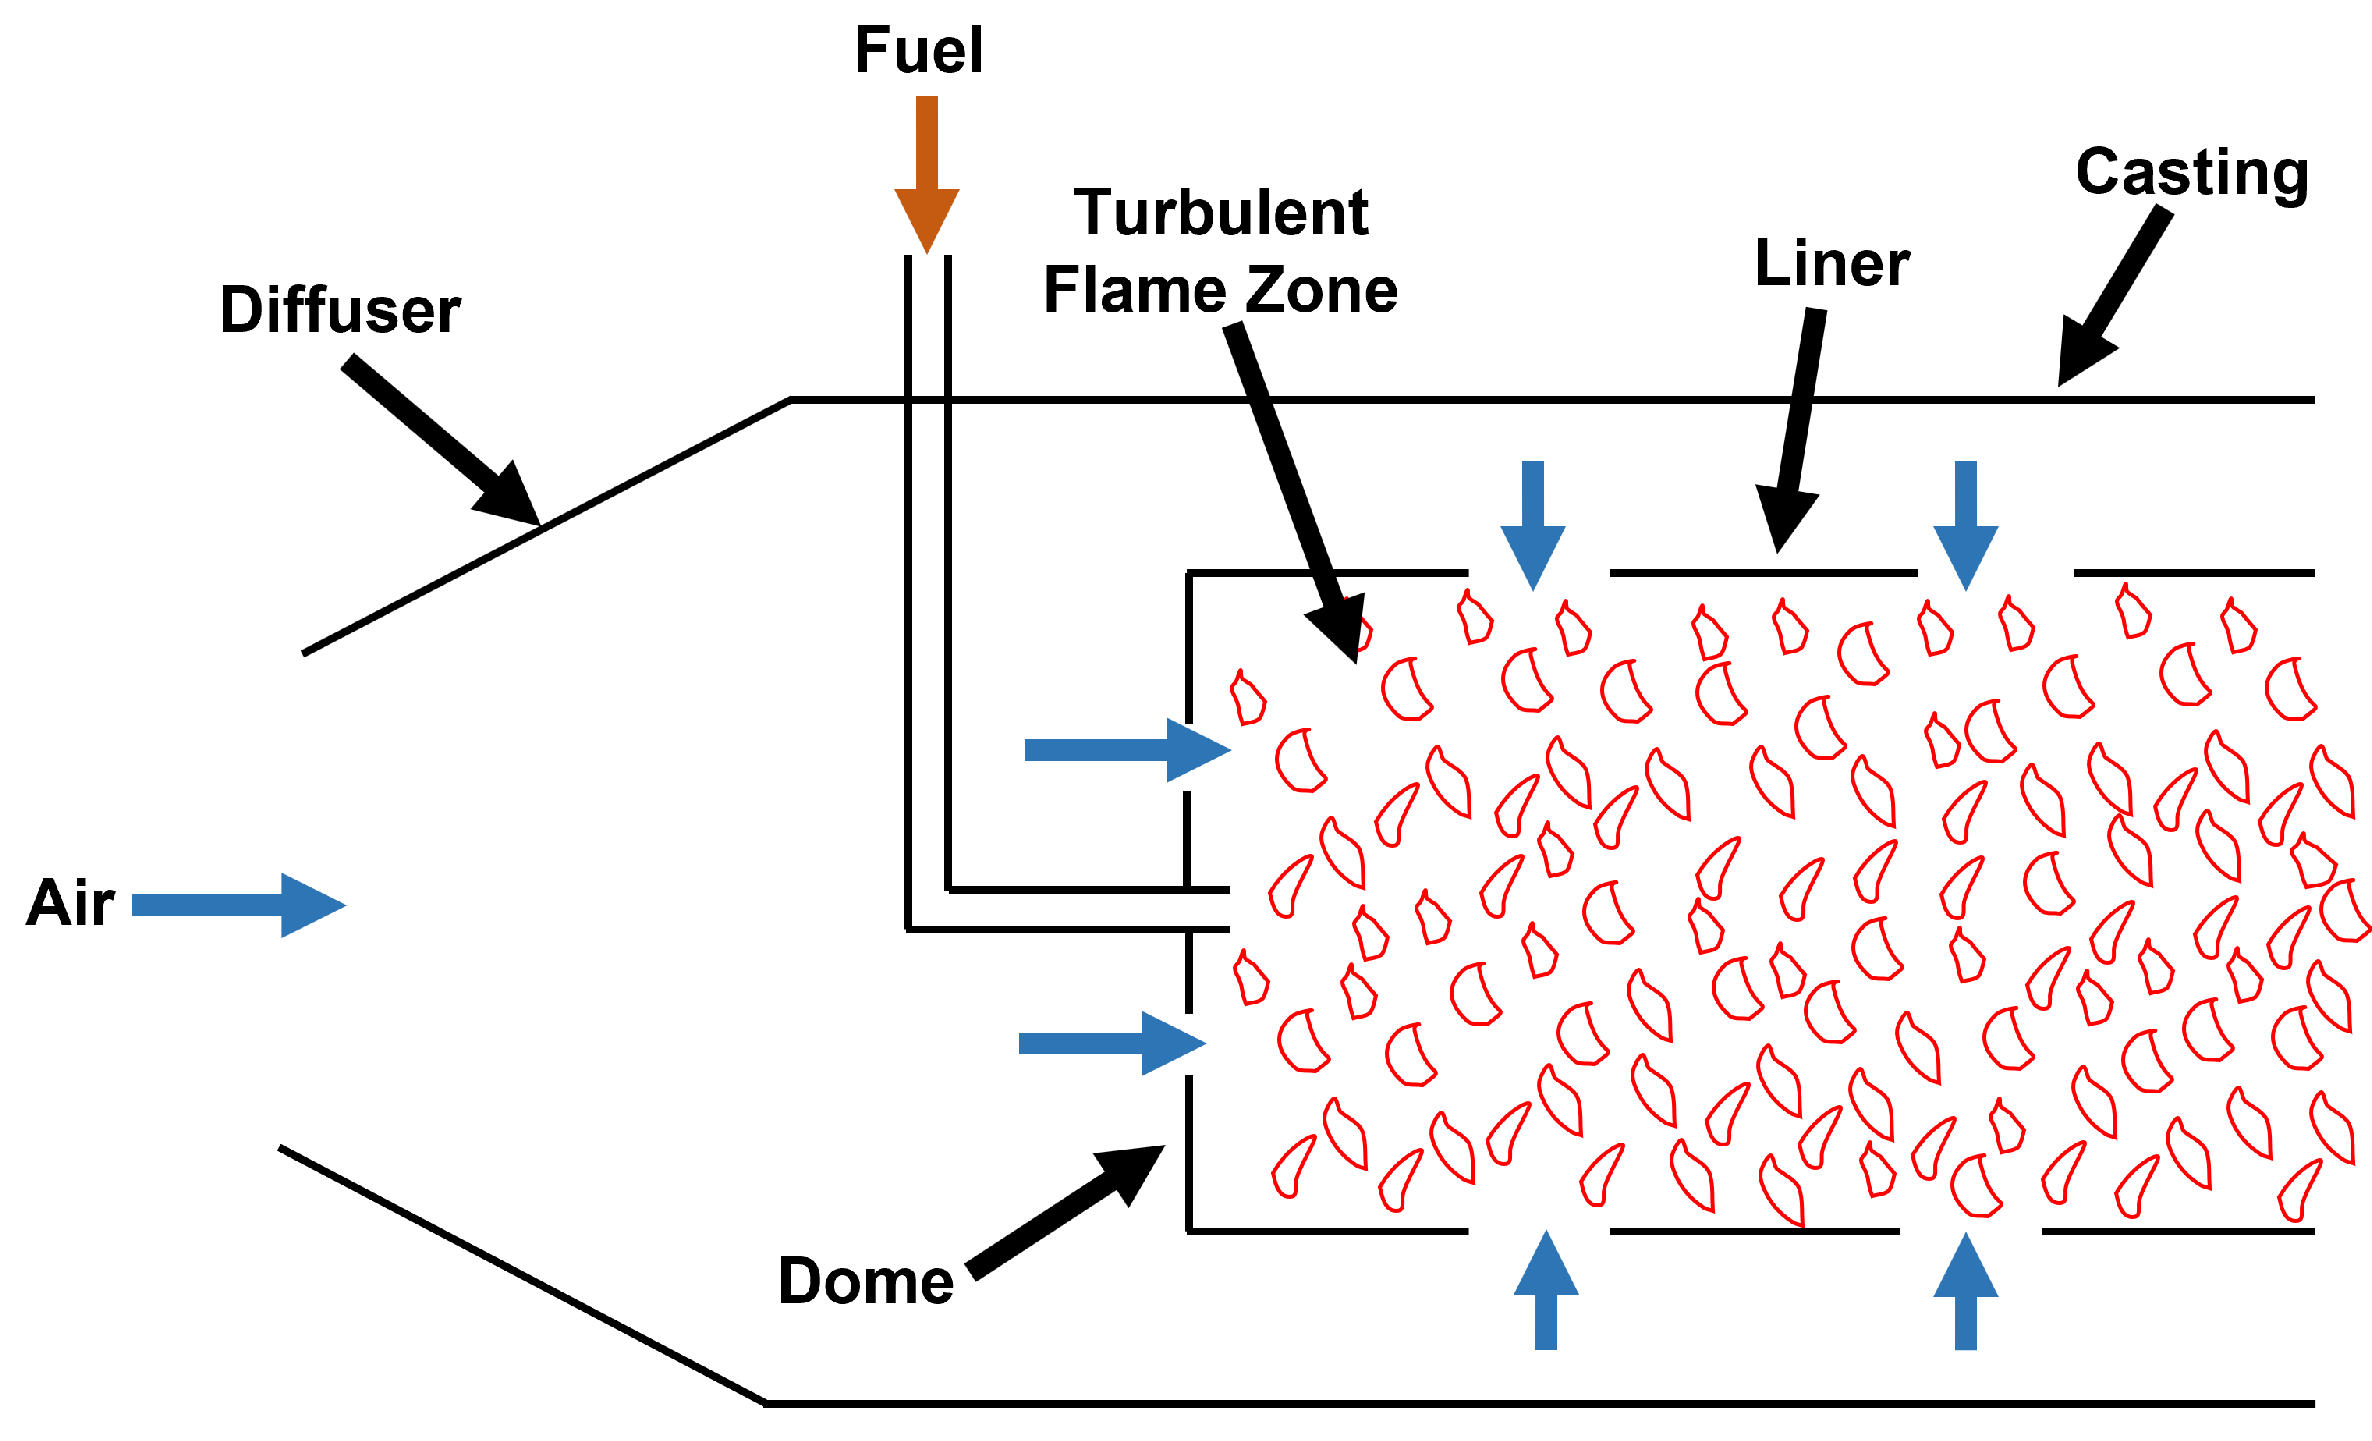
Later, Lefebvre [28,29], one of the pioneers of the semi-empirical model, developed a model and advanced the prediction formula and expression based on Longwells’s work to make it capable of predicting LBO limits in the swirl-stabilized combustors. According to Lefebvre’s LBO model, the LBO limitations are determined by combustor geometries, operation conditions, and fuel characteristics. The main assumptions of Lefebvre’s model are that the whole inlet air flow is involved in the fuel mixing and combustion at the LBO, and secondly, the turbulent flame filled the whole combustor at LBO, as shown in the physical model of Lefebvre’s expression in Figure 4. The model was validated on eight different combustors with uncertainties of ±30% [30].
Afterward, numerous works to improve the Lefebvre model have been suggested, as Lefebvre’s formula uses a constant to represent the combustor configurations of the upstream dilution holes, which limits the model’s applicability in different variations of combustors. Therefore, a study used a formula to replace the constant value in Lefebvre’s model, as documented by Ateshkadi et al. [32], and they included a temperature-based parameter collected from their experimental results. However, Mongia et al. [33] revealed that none of the existing models can be used for modern combustion and suggested that the focus should be on the flame volume rather than the combustion volume to improve Lefebvre’s model further. Later, Mongia et al. [34] used a data reduction to evaluate the test data in order to achieve more accurate predictions. They then optimized Lefebvre’s LBO model’s parameters and exponents to be applicable to 5 different combustors.
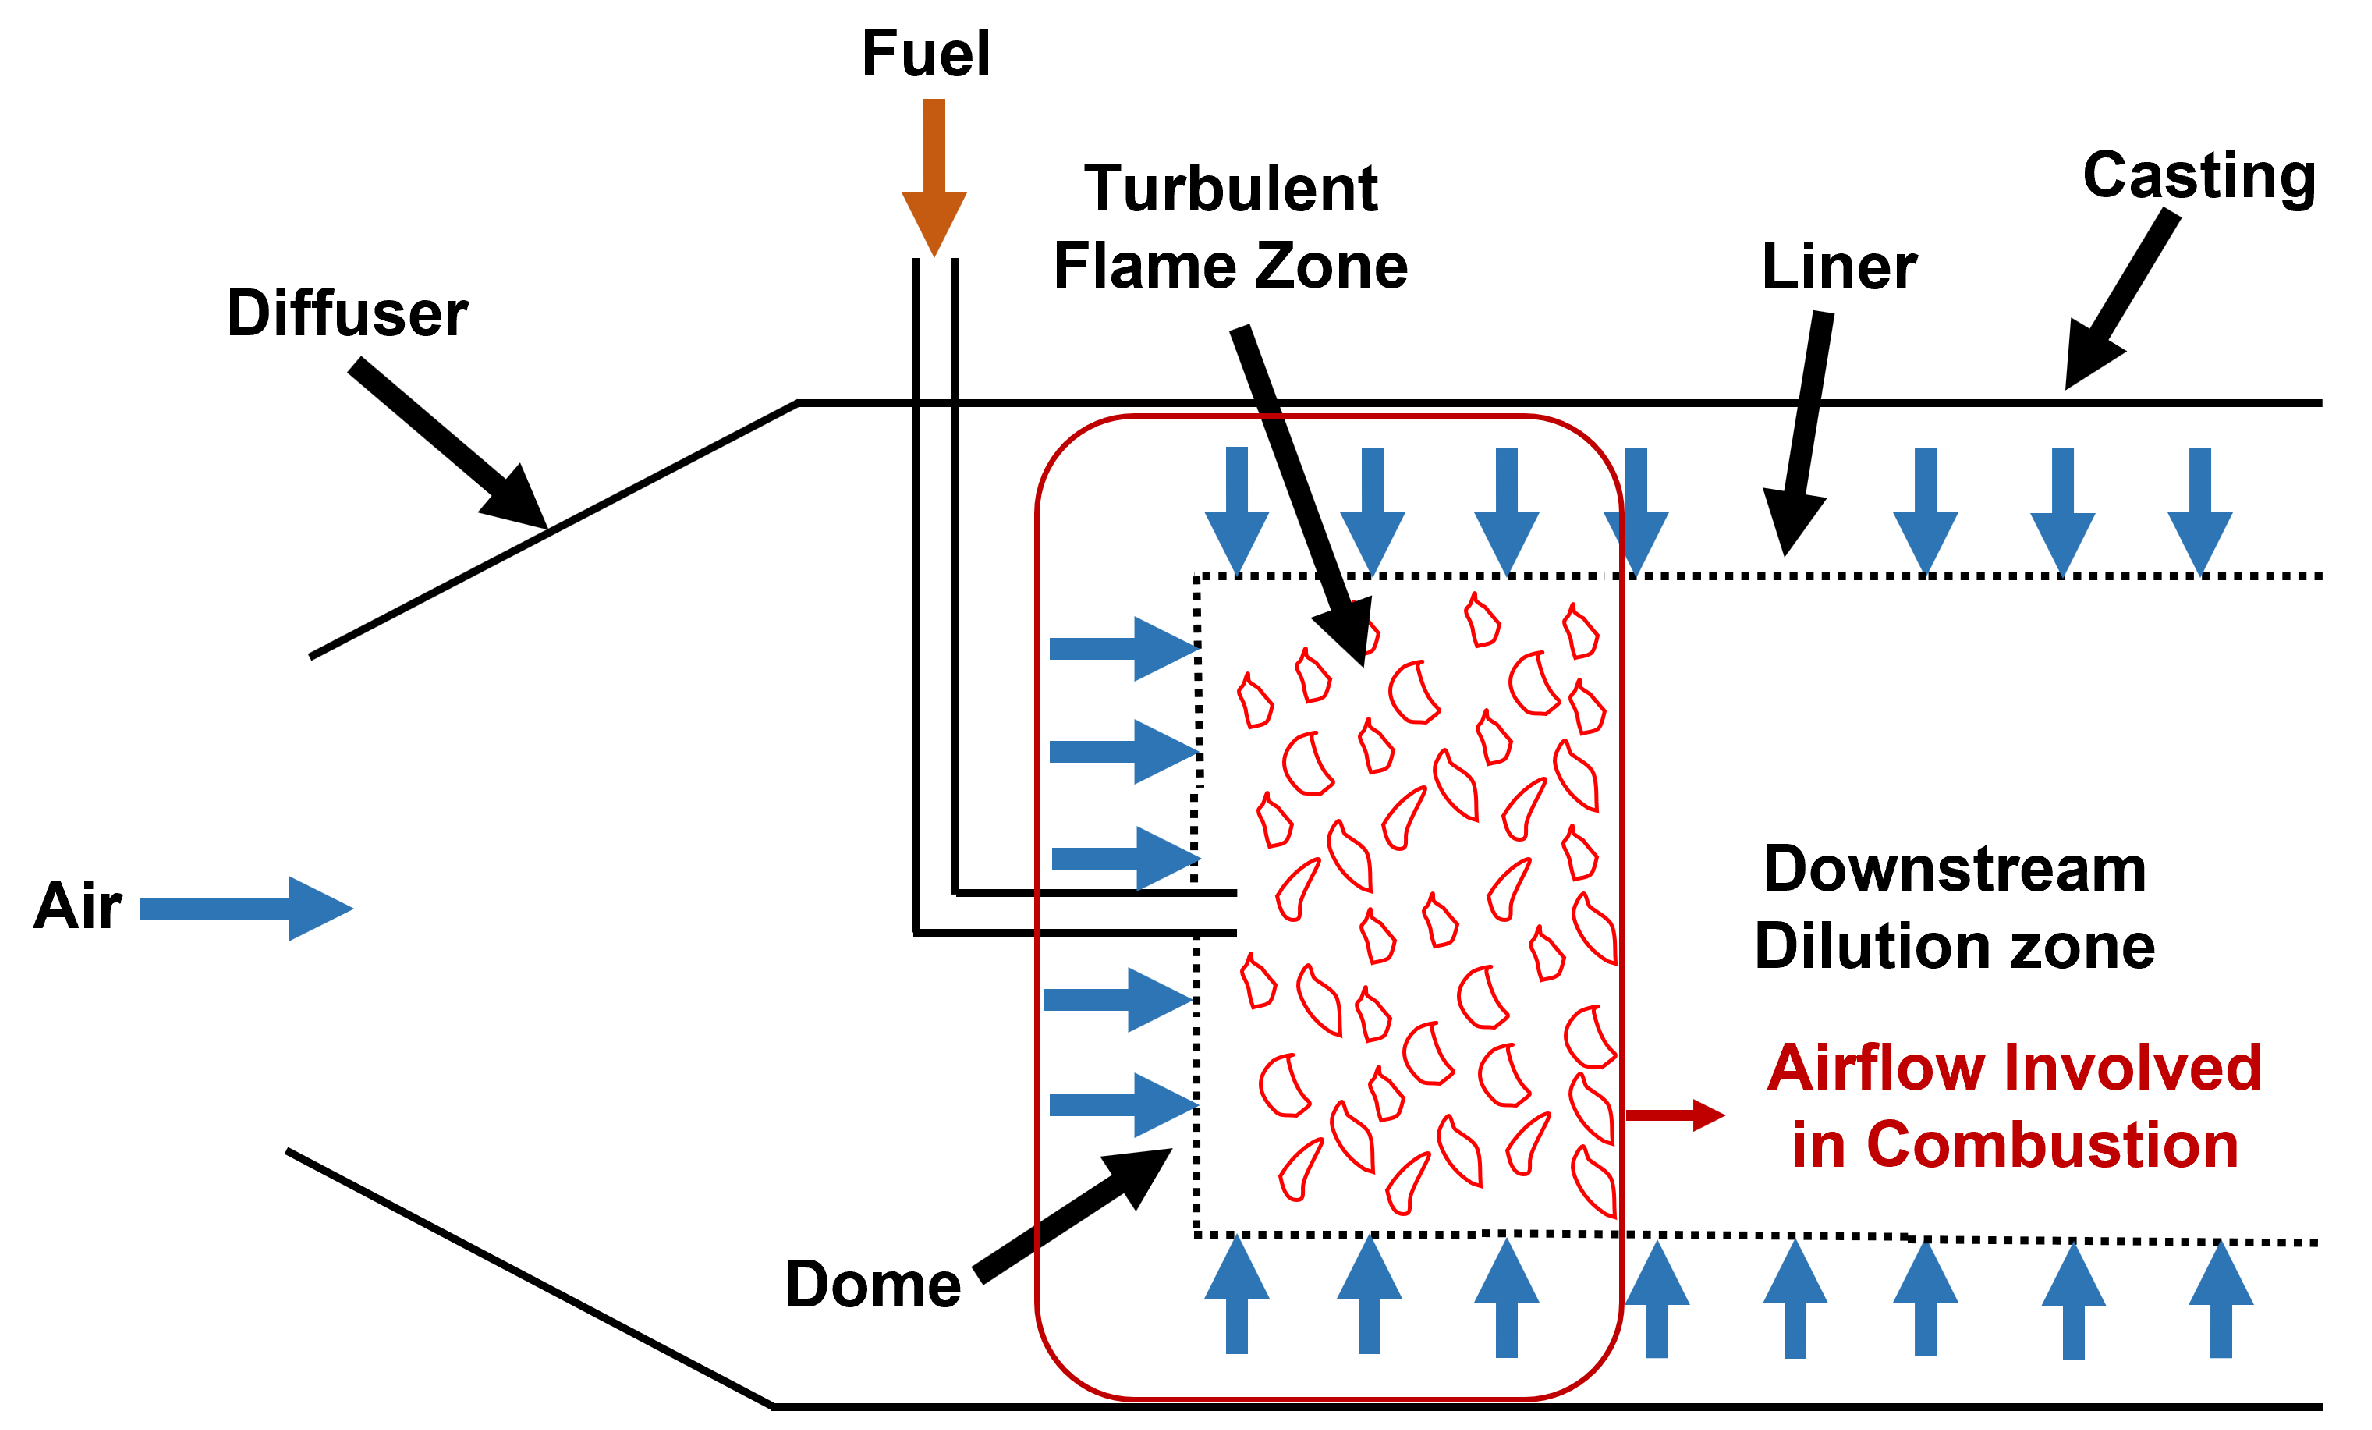
Furthermore, Xie et al. [31] proposed a new semi-empirical model based on Lefebvre’s model better to investigate the impact of geometrical structural factors on combustors. The authors used the concept of flame volume (FV) observations based on a visualization experiment of the flame size at different fuel/air ratios. It was noticed that the flame could not fill the whole area within the combustor liner near the LBO, and it was instead very short. Adding the FV approach has improved Lefebvre’s model. It considers the effect of the variation in primary zone configuration and the dome geometry as the FV varies depending on the combustor’s design. The main assumptions of the FV model at LBO are that the inlet airflow can be divided into two parts: the airflow involved in the combustion (dome airflow and part of the liner airflow) and the airflow in the dilution downstream, as shown in the physical model of FV LBO expression in Figure 5. The second assumption is that the remaining airflow enters the liner uniformly, and the airflow involved in the combustion depends on the size of the turbulent flame zone.
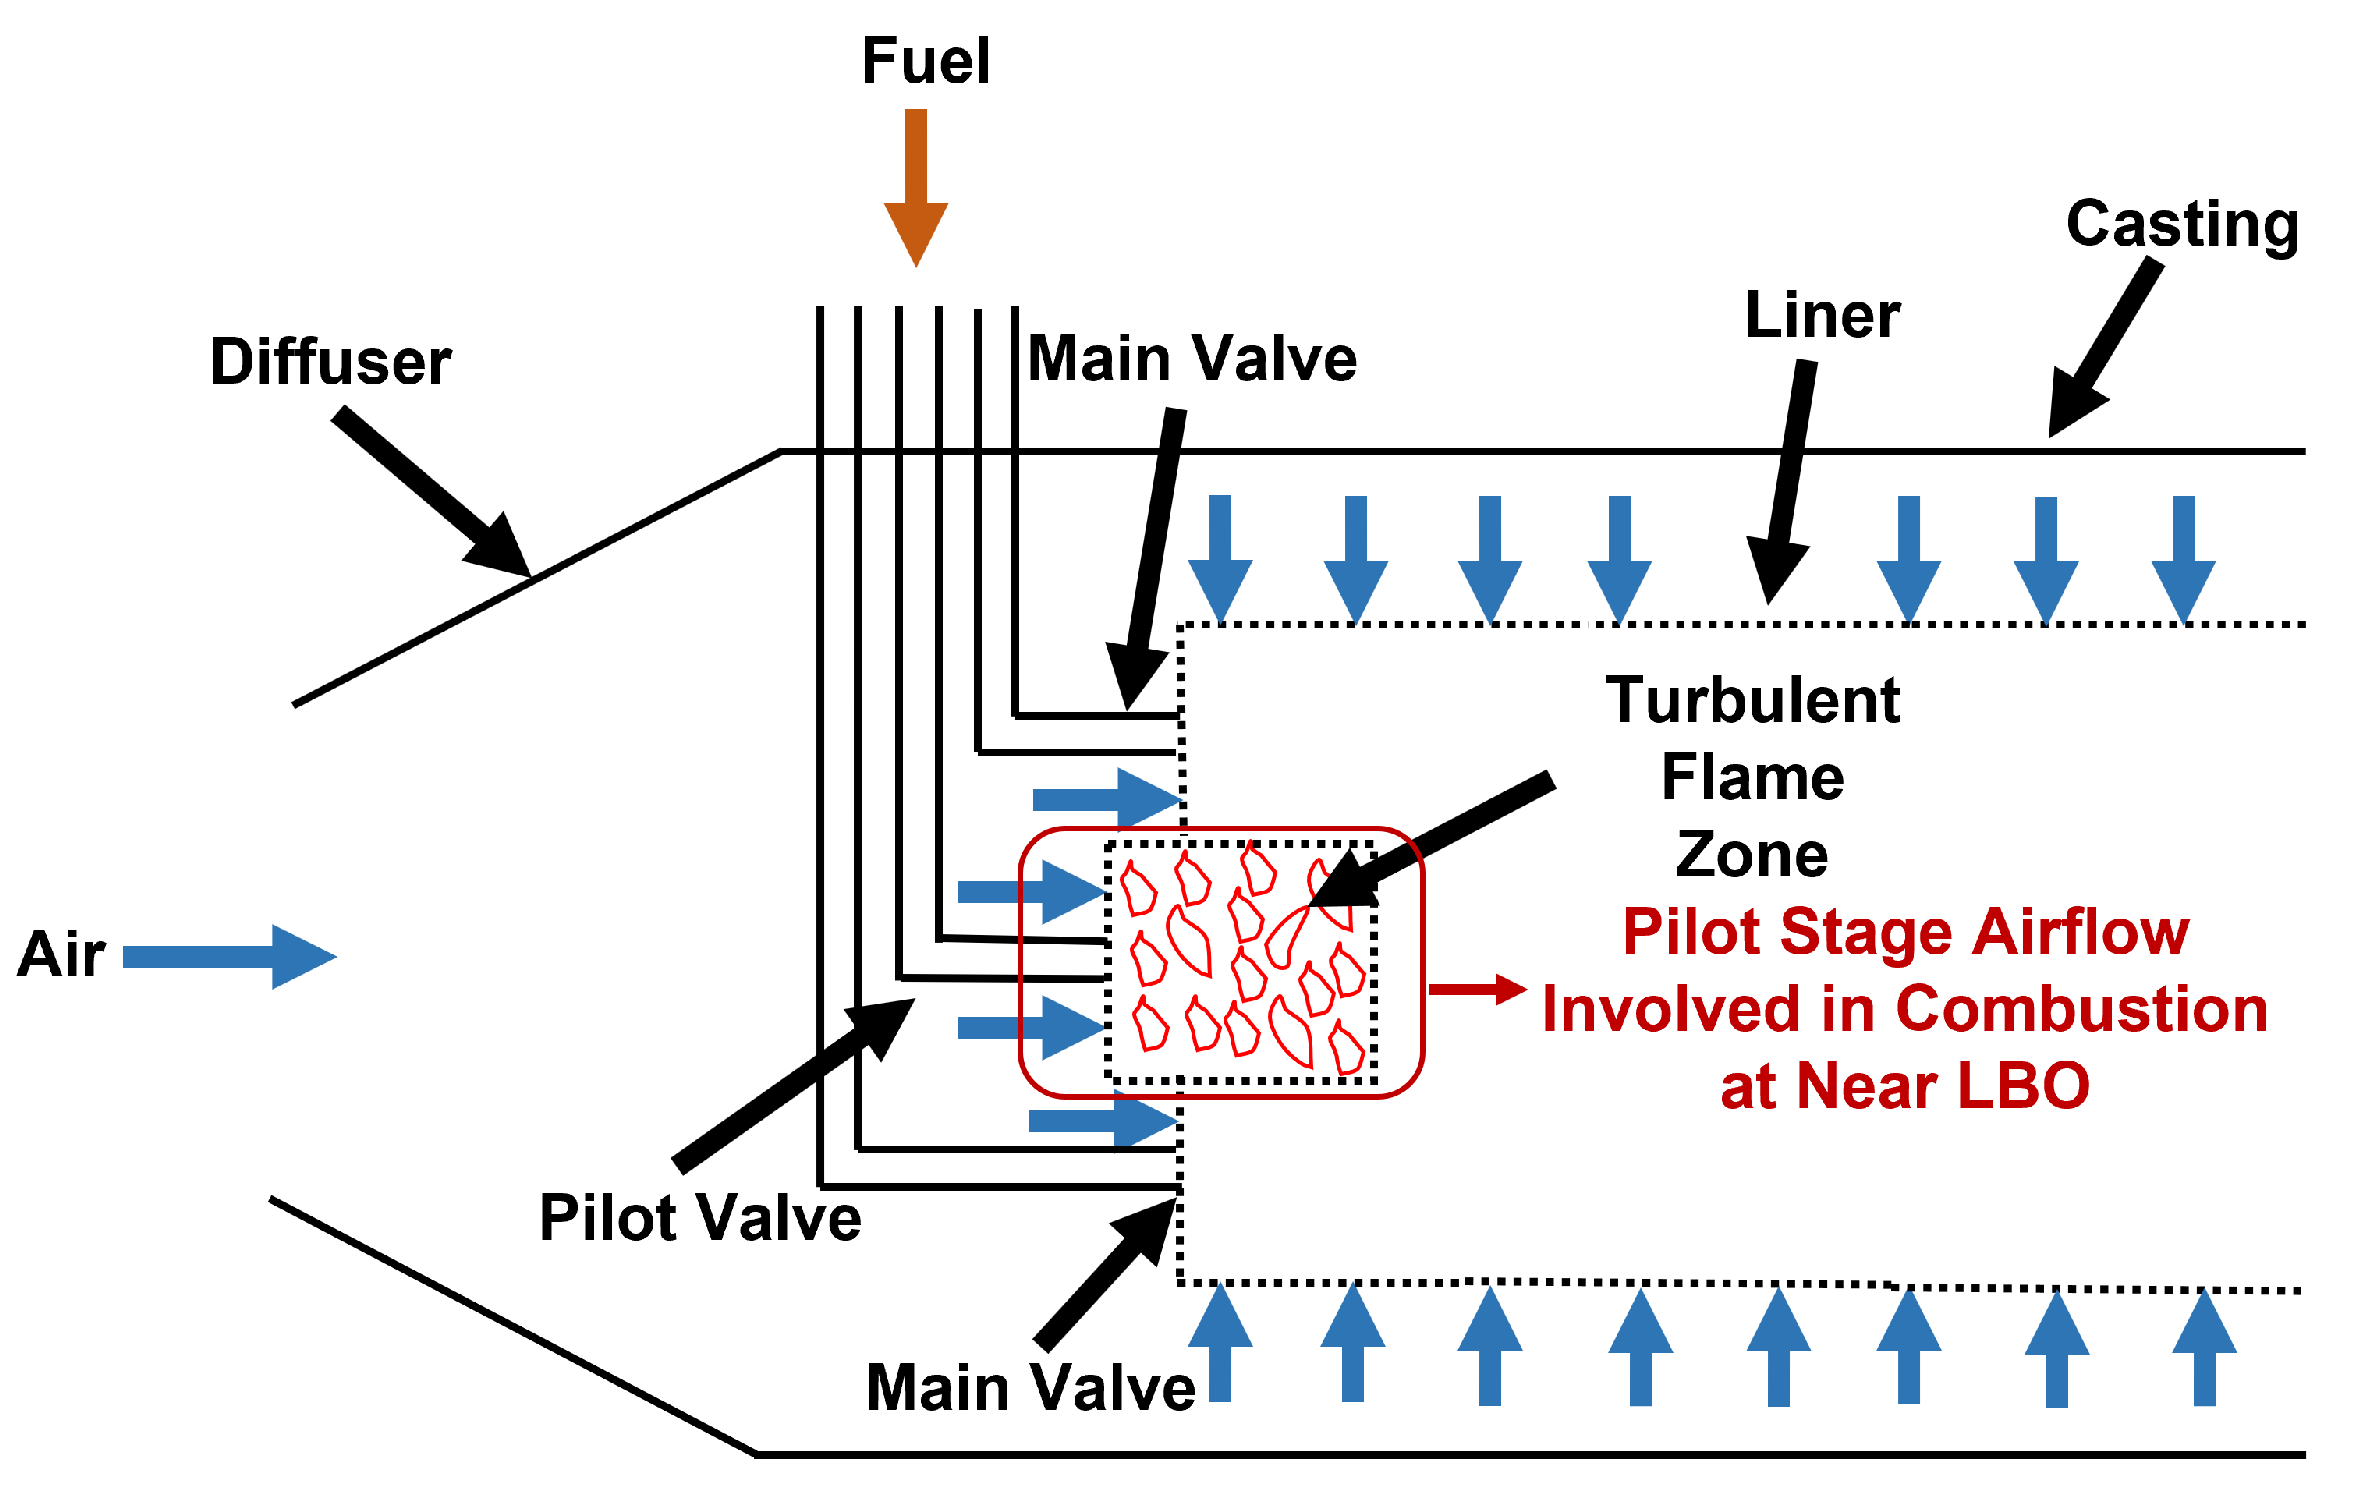
The flame volume approach offers a more direct link between LBO performance and flame characteristics, so increasing the modeling depth and, consequently, the prediction accuracy [35]. On the other hand, with the recent development in LPM combustion, the ultra-low NOx emission gas turbine came into existence. The geometry of the new combustor’s dome differs from the previous combustors to achieve lower NOx emission and better stability. The fuel/air inlets are divided into the main and pilot stages. Only the pilot stages operate near LBO to ensure power and flame stability. Due to the differences in the previous and the current dome configuration, the earlier models’ performance was not ideal for predicting the LBO limits. Therefore, another study was conducted by Sun et al. [36], who improved the FV model by using a novel flame volume and multi-point (FV-MP) to be used for the low NOx combustor. As shown in Figure 6, the airflow is subdivided into the main and pilot stages. The study showed better accuracy than both Lefebvre’s and FV models in predicting the LBO limits, which could be beneficial at the design stages of the combustors.
Similarly, Rowen’s model is a well-known semi-empirical model that is used explicitly for heavy-duty gas turbines [37]. Rowen’s model is a simplified mathematical representation of the conventional gas turbine, as shown in the simplified block diagram in Figure 7. However, due to the recent development and the existance of the dry low emission (DLE) gas turbine, the model was improved by Omar et al. [38,39,40,41] by adding a pilot fuel valve based on the DLE gas turbine operational data. The improved model could produce high accuracy prediction for the gas turbine performance, and it can be used for LBO limits prediction for the new combustors.
When it comes to dealing with lean blowout limit prediction, the semi-empirical methodologies are often the most practical options due to their simplicity, robustness, and cost-effectiveness. Its primary use is in the design stage, where it assists in the investigation of the limits of the LBO and developing combustors that are more resistant to such an occurrence. Until today, the semi-empirical model is widely utilized in aero-engine lean blowout prediction but not in heavy-duty industrial gas turbines. Although this strategy is the oldest one compared to the others, and even though it has undergone many different types of development and refinement, it still has significant drawbacks, as shown in Table 1. It exhibits little generalizability in a variety of combustors; therefore, the degree of uncertainty might be as high as fifty percent, particularly with regard to newly developed combustors [42]. Similarly, the lack of depth in the semi-empirical modeling substantially impacts the accuracy and inability to associate the geometric variation with the LBO events [35]. On the other hand, as was mentioned earlier, various semi-empirical models, such as Rowen’s model, show promising results in presenting the lean premixed heavy-duty gas turbines. These results are especially promising when the models are associated with a numerical simulation approach or a data-driven configuration to improve their accuracy of LBO limits predictions.

2.2. Numerical Simulation

The semi-empirical model provided fundamental information for the prediction of LBO limits. However, it was a simplistic approach and does not provide deeper knowledge on the matter as shown in the development process in Figure 8. Therefore, there has been an increase in the reporting of numerical prediction methods in recent years. The LBO limits are often determined using either the Large Eddy Simulation (LES) or Unsteady Reynolds-averaged Navier–Stokes (URANS) methods. In the past, LES and Direct Numerical Simulation (DNS) have been used in numerical modeling to capture the dynamic features of the flame close to the LBO. Furthermore, the flow features have been studied extensively [43]. As a result, several articles published use numerical simulations to investigate the LBO phenomena. The main strength of numerical simulation is the capacity to construct complicated flow fields, both non-reactive and reactive. Nearly all studies using numerical models have revealed that the flow field is volatile close to the LBO [44].
Although there have been many advancements in modeling techniques over the last several decades, two main frameworks have arisen depending on the degree of characterization of the underlying flow: the Reynolds-averaged Navier–Stokes (RANS) approach and the recent Large Eddy Simulation (LES) method, as shown in Table 2. The RANS approach is still a popular method for LBO prediction and is preferred to the LES in some studies due to its low computational cost and complexity, due to the disregard of the time resolution, as documented by Ahmed and Yong [35]. The authors predicted the LBO using the primary zone’s flow structure. Then, the data were simulated using RANS simulation and compared with experimental data. The result showed high efficiency in predicting LBO. Later, Akhtar et al. [5] used a combination of a flame-generated-manifold (FGM) model and Reynolds-Averaged Navier–Stokes (RANS) turbulence modeling to explore a turbulent premixed single jet flame at an enhanced preheating temperature and pressure. They discovered that the flame location depended on the input velocity or turbulence and could compute LBO limits with a ±20% uncertainty compared to the experimental blowout velocity. Nevertheless, RANS is less accurate than LES and considered a non-universal approach [45].
On the other hand, the LES technique has emerged as the go-to numerical tool for combustion applications because of its efficacy in describing turbulent physical processes. In addition, the LES framework may take advantage of the exponential growth of computation speed by steadily amplifying the range of physical length and time scales that are directly resolved rather than modeled. This is where LES comes in handy as it provides a smooth transition to model-free DNS [46]. As a result, the discipline of turbulent combustion has majorly chosen the LES method, leading to impressive developments in a number of subfields [47,48]. It have been used in a number of studies, such as those of Ihme and Pitsch [49], Garmory and Mastorakos [50], Ayache et al. [51], and Hasti et al. [52], to predict the LBO successfully.
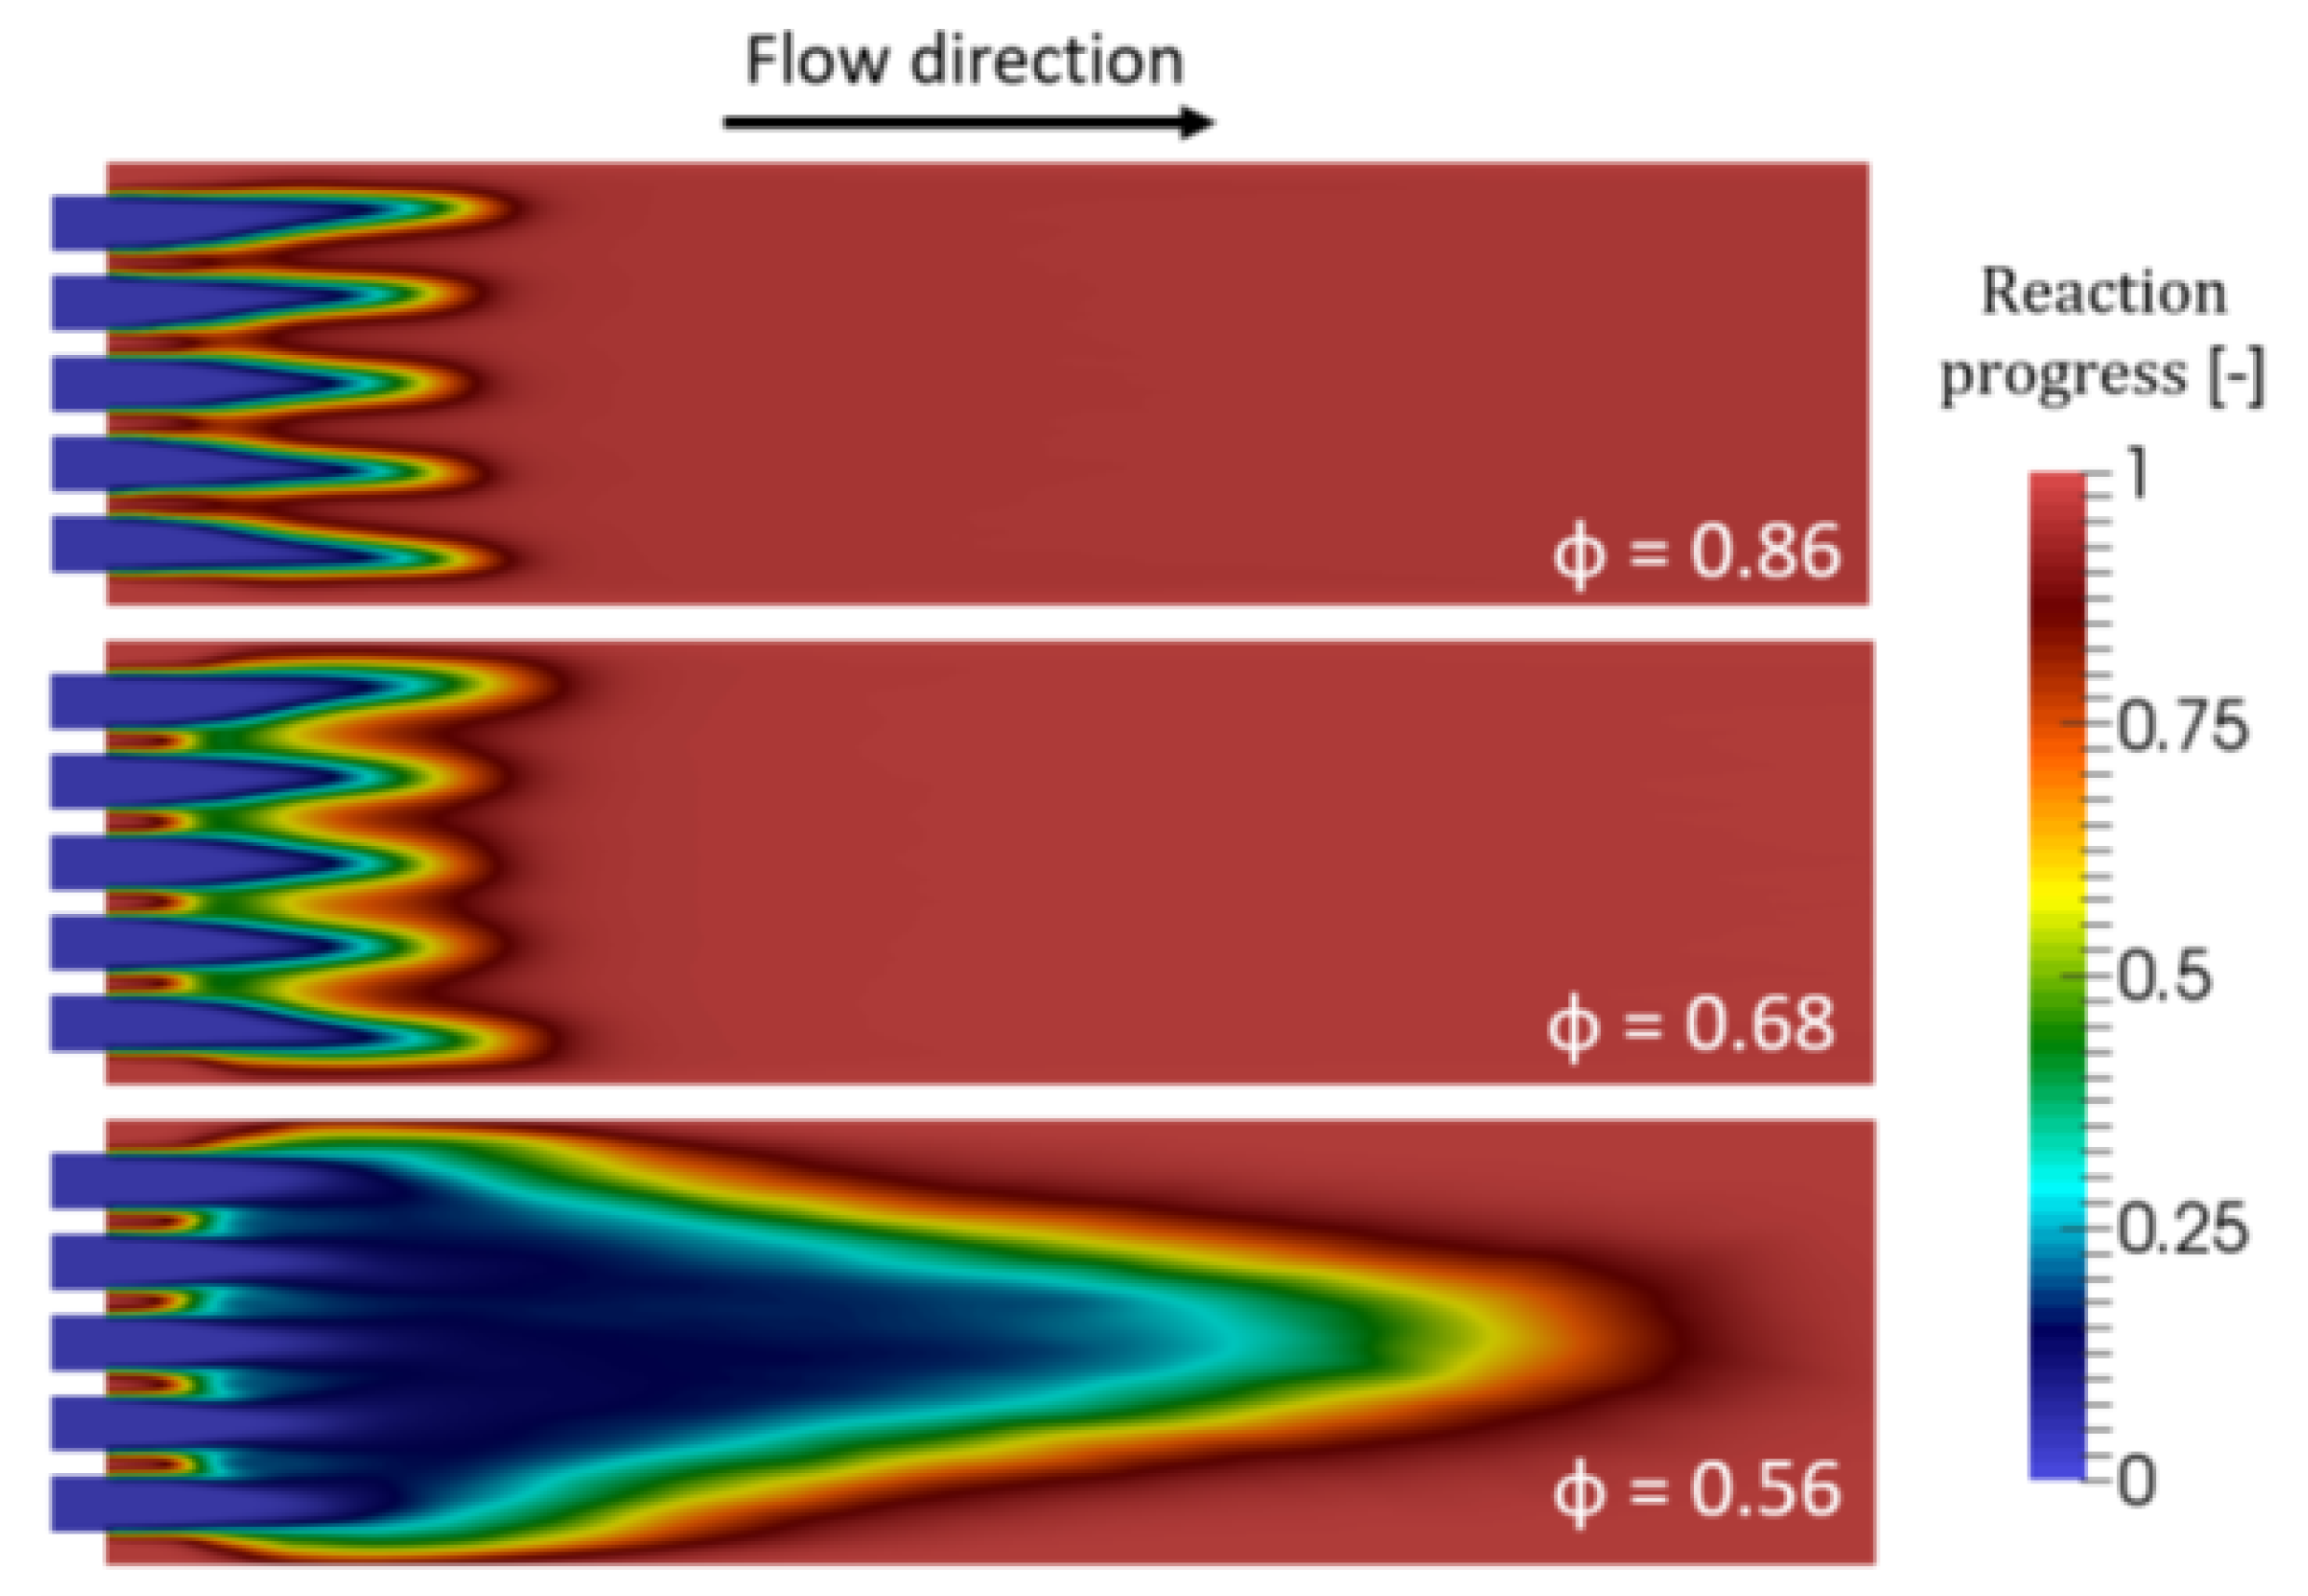
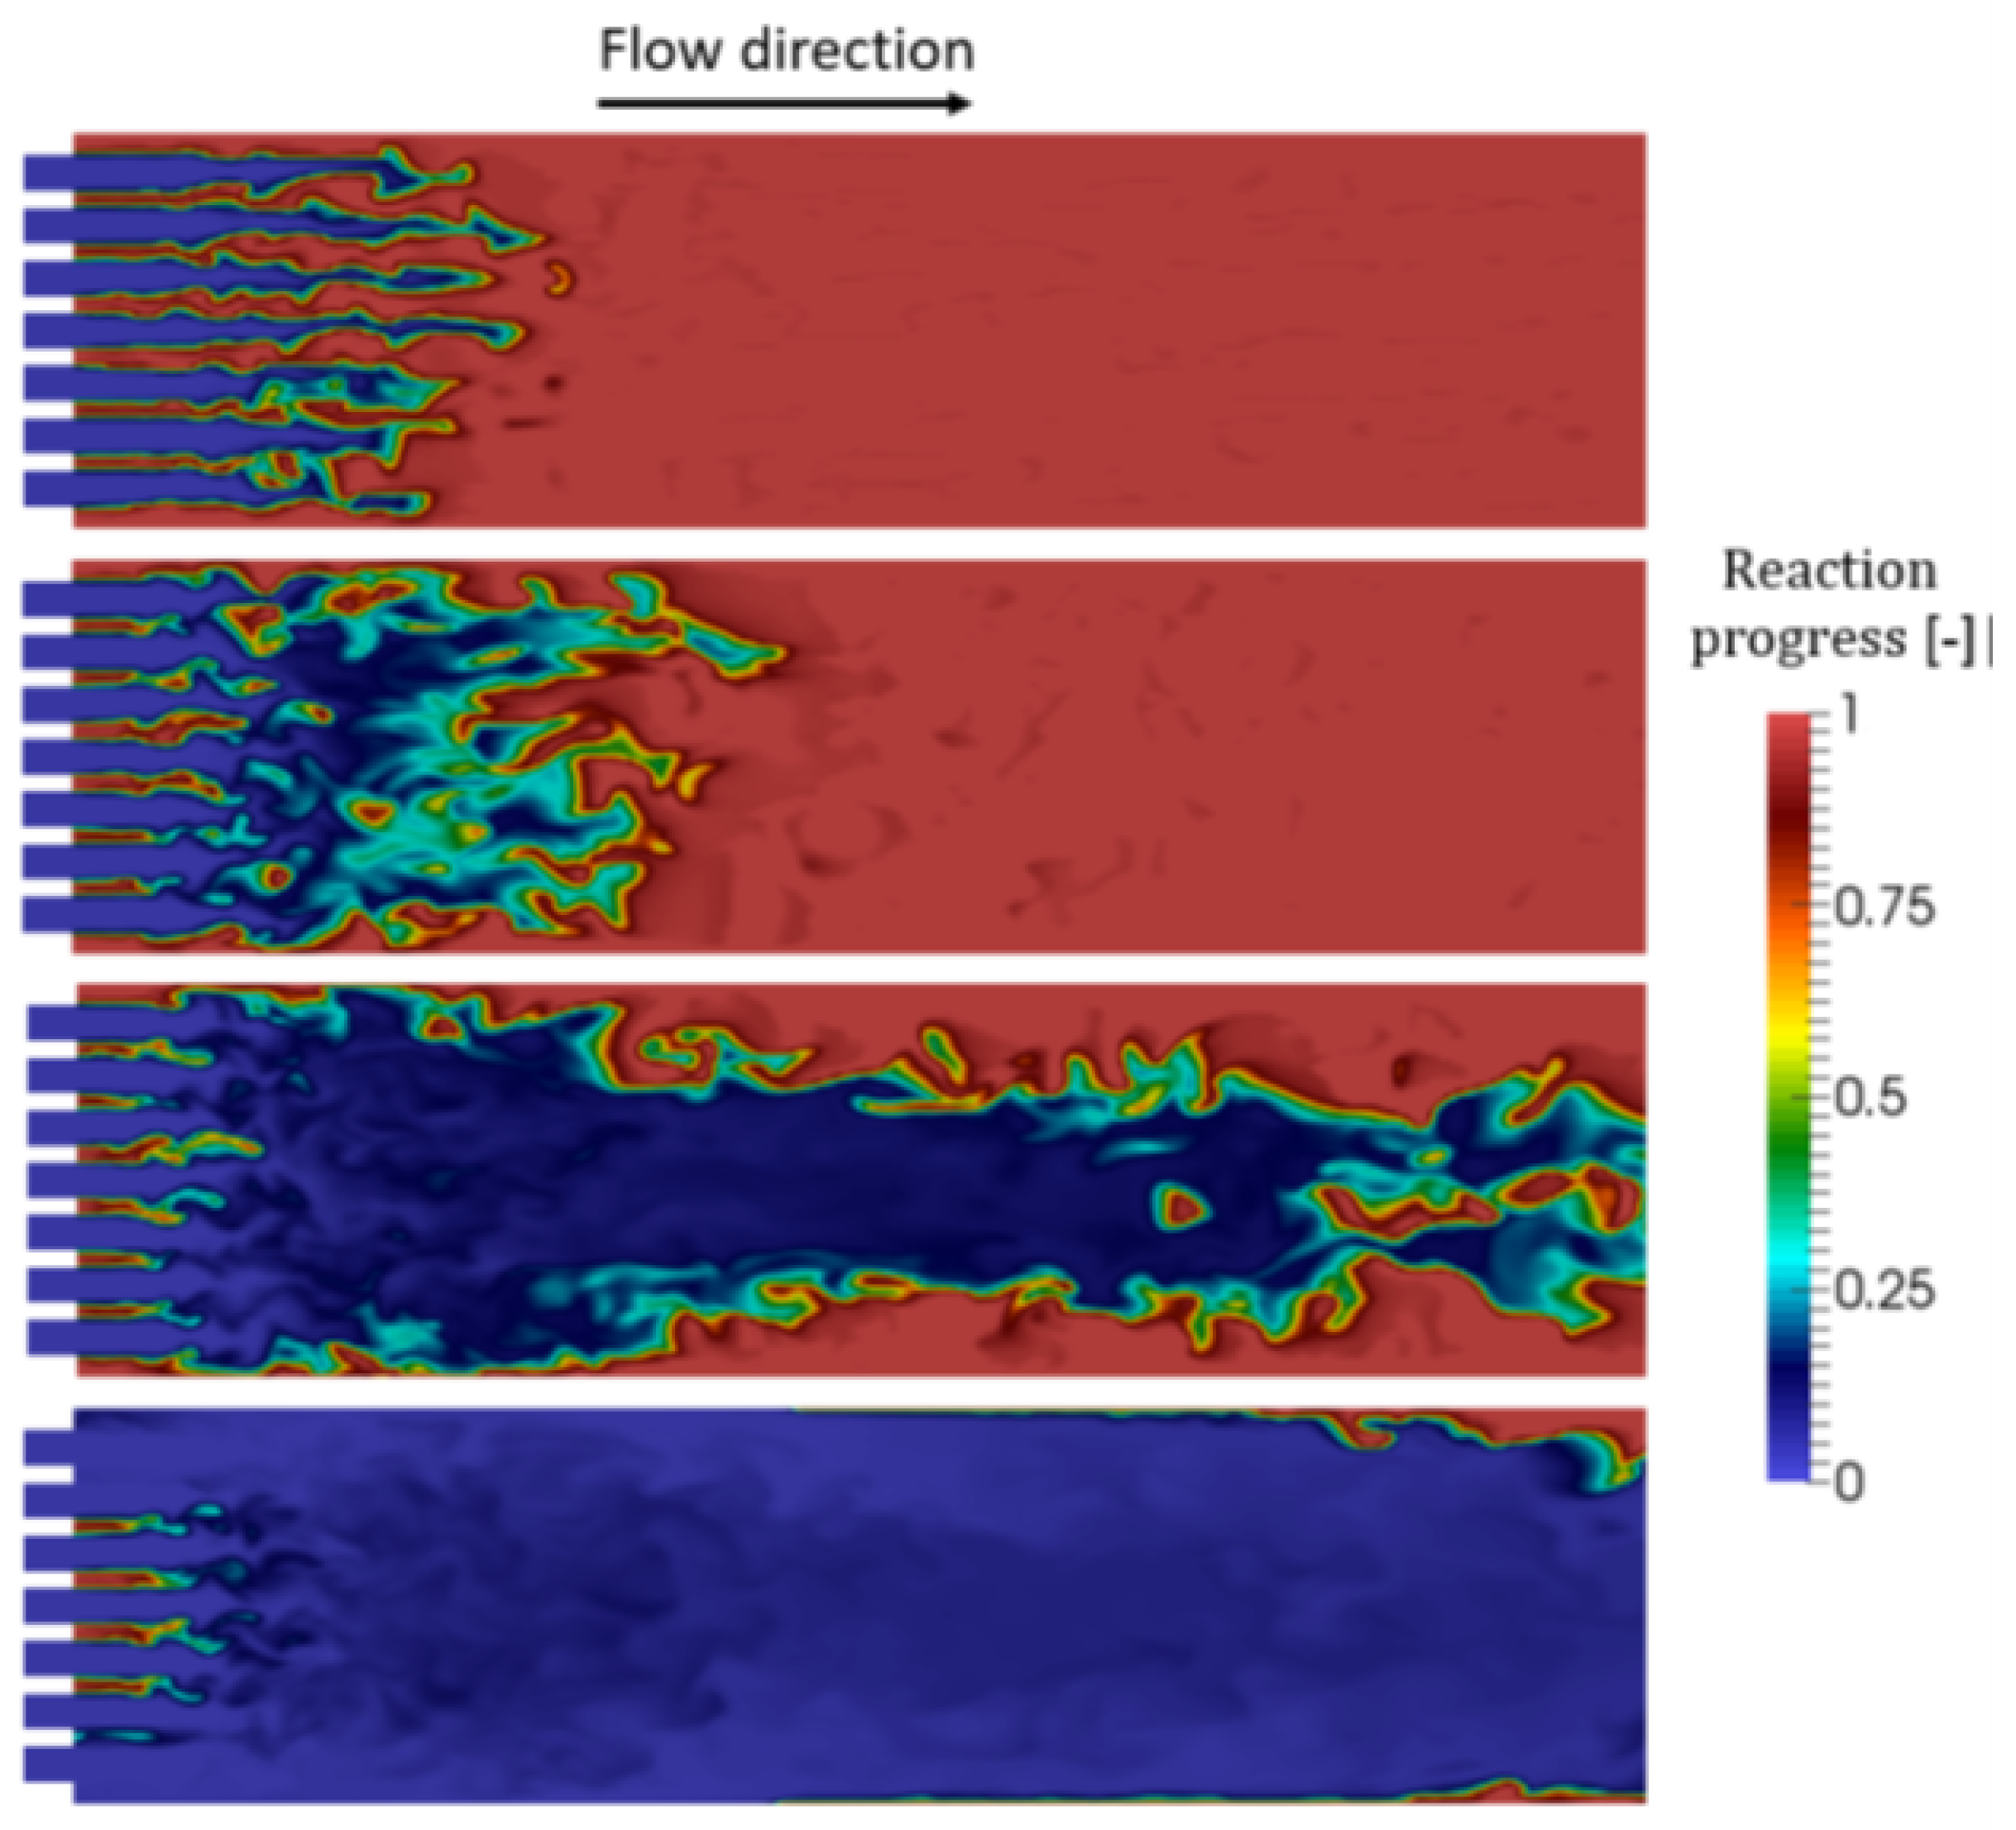
Furthermore, some studies suggested using the chemical reduction technique to reduce the computation time, especially by utilizing the FGM model with the LES model as documented by Nassini et al. [53]. The authors investigated the flame behavior and fragmentation of the flame using the FGM model based on an expanded turbulent flame closure (TFC) technique and the LES simulation. The two tested operating conditions deviated from the computed equivalence ratio by ±5% and ±10% from the experimental LBO point. Similarly, Schwagerus et al. [54] used FGM with LES simulation to reduce computation time. The authors focused on observing flame shape changes close to LBO by decreasing the fuel/air equivalence ratios Φ with constant inlet velocity, as shown in Figure 9. Secondly, by increasing the inlet velocity with a constant fuel/air equivalence ratios Φ as shown in Figure 10, the result showed a conical flame under unstable conditions and the flame extended near LBO. The LBO occurs after reducing the equivalence ratios Φ and increasing the inlet velocity. The results of the proposed approach were very close to the experimental findings.
The combustion process is highly complex as it includes the turbulent chemistry interaction and the turbulent dynamics, making it challenging for the numerical simulation, specifically for the CFD simulation, to accurately predict the LBO, especially in the actual gas turbines [55]. Therefore, few models have been used that produce a different outcome of the prediction accuracy of LBO. Such models include the reduced chemical kinetic model [56], the commonly used FGM [57], and the G-equation model, which is a flame-tracking-based technique [58].
Table 2. Numerical simulation models.
AuthorMethodToolsStrengthWeakness
Ahmed and Yong [35]Using the flow structure in the primary zone as indicator of LBORANSProvide better generalizability to be used in wider range of combustorsNot robust enough due to the long process
Akhtar et al. [5]Using the relationship of the flame location and the input velocity as LBO indicatorFGM and RANSProvide better accuracy than the semi-empirical models to 16%High uncertainty of 20%
Nassini et al. [53]Studying the flame behavior as LBO indicator using the FGM based on the TFC techniqueFGM and LESImproved the uncertainty to 5%Computationally expensive
Schwagerus et al. [54]Using the FGM and LES to flame shape while changing the inlet velocityFGM and LESStrong observation of flame shapeNot validated in higher pressure conditions
Kaluri et al. [59]Using the temperature measurement in real time by using the RT-CRNCRNShows deep view of the chemical reaction near LBOLong calculation time is required
Additionally, other studies used the simulation method to predict the LBO away from the LES and RANS as documented by Maran et al. [60]. The authors used simulations for various intake pressures and V-gutter angles. A simplified approach was used for predicting the LBO for an afterburner combustor by using the recirculation zone’s average gas temperature (AGT). The prediction was successful and showed ±10% uncertainty compared to the experimental values. Similarly, V and R [61] tested the influence of combustor inlet air ratio (CIAR) on the LBO of a micro gas turbine of a swirl stabilized can-type combustor. The author used the 2D simulation method on FLUENT software by using the average exit gas temperature (AEGT) as the parameter. The result showed that the LBO limit increases with the decrease of inlet air velocity and significantly decreases with low inlet air velocity and reduction in CIAR, matching accuracy with the experimental findings with a deviation of ±6.23%. The chemical reactor network (CRN) simulation has been utilized as well for LBO prediction as seen in Kaluri et al. [59] and Gupta et al. [62]. The authors used a real-time model to predict the event of LBO by using temperature measurements in real time using the real-time chemical reactor network (RT-CRN). The input is the measured temperature and mass flow rate of fuel/air. The result showed that near LBO, a maximum concentration of hydroxy OH radicals was downstream. The difference in the concentration of OH radicals in the flame zone and recirculation zone indicates near LBO. However, the CRN approach was not easy to implement.
When compared to the semi-empirical model, the simulation technique for LBO prediction employing CFD technologies such as large eddy simulation (LES) and Reynolds-averaged Navier–Stokes equations (RANS) exhibited superior accuracy in terms of prediction. In addition to this, the simulation approach is not influenced in any way by the construction of the combustor, which means that it may be utilized for a wider variety of applications [63]. In addition, computational fluid dynamics (CFD) have demonstrated a new and more in-depth perspective on the basic activity that takes place in the case of a lean blowout. Such technologies as LES simulation allowed researchers to analyze the flame features approaching lean blowout with finer resolution. It was also utilized as a predictor of LBO, and it revealed a realistic depiction of the distribution of the fuel in the injector side as well [64,65]. Even with the existence of data-driven techniques, the employment of numerical approaches has been a focus of research in the field of combustion and more especially in the field of lean blowout inquiry.
On the other hand, the numerical/simulation technique is still somewhat expensive, and it is growing more difficult with a rise in the computing expenditures. For instance, a multi-dimensional simulation model in CFD modeling, which can offer a deeper understanding, is quite complicated [66]. As a result of these challenges with the simulation technique, the researchers decided to utilize a more straightforward type of simulation such as RANS in order to stay away from complexity and high cost. Even after that, the more sophisticated simulation, such as DNS, did not demonstrate any convergence in the correctness of the simulation model, and it was determined that it was not fit for use [67,68,69]. To put it simply, the modeling approach has to be improved more since it is still difficult to precisely reproduce the lean blowout and the eddies, both of which contribute significantly to the extension of the flame [70,71,72,73]. As of right now, the LES simulation approach is not appropriate for real combustors at high Reynold numbers since they become computationally complex, and they are only applicable to flames found in laboratories [35]. In conclusion, the existing numerical prediction methods were unable to achieve the degree of precision required for the design of an aircraft engine [33]. The best uncertainty that may be attained is not lower than 6%, as well as it is still insufficient to be utilized in the industry for a real gas turbine [74,75].

Hybrid Method

The hybrid prediction methods can be achieved by combining the semi-empirical models and numerical simulation. The semi-empirical model is used to determine several important flow field characteristics. At the same time, the numerical simulation is used for a precise flow field in the combustor. Therefore, the hybrid approaches have the potential to optimize the benefits of both of the preceding two strategies. Several hybrid approaches have been suggested and implemented, which can be divided into two: the semi-empirical based hybrid and the numerical based hybrid. As shown in Table 3, Rizk and Mongia [76,77] pioneered the use of multi-dimensional methods in conjunction with semi-empirical models to forecast aero-engine combustor LBO. Given the FV model’s superior performance, a hybrid technique combining the FV model with numerical simulation might be possible to achieve high prediction accuracy while maintaining a high degree of generality. Another work by Hu et al. [78] combined the FV model with the numerical simulation. The parameters in the FV were estimated using the simulation non-reacting flow. The proposed method was validated in 11 different combustors with an average uncertainty of ±16% from the experimental flame volume as shown in Figure 11. Another attempt by the same authors [78,79,80] was to improve Lefebvre’s model by using a hybrid approach with CFD simulation to predict the LBO. The result showed an average of ±15% uncertainty to the experimental values.
Similarly, a more recent work of a hybrid method based on FV to predict the LBO was documented by Sun et al. [44]. The authors used the threshold value of the flame temperature with the FV. They tested it on 15 different types of combustors, and the results showed better accuracy than previous work with the uncertainty of ±10% compared to the experimental results. Lately, Hu et al. [42] proposed a Fuel Iterative Approximation (FIA) approach based on the FV model. There LBO prediction results were consistent with the experimental values.
The hybrid method is a promising approach and could maximize the advantages since they combine the benefits of both models. The simplicity and robustness of the semi-empirical model and the better accuracy of the numerical model are where the inadequacies in the earlier model can be compensated. The hybrid method could have a wider range of applications while producing higher accuracy than a single method. However, more validation is needed for such a method [81]. Despite this, the hybrid model is still limited in its applicability due to its inability to be employed in a variety of combustor configurations. It is necessary to do more validation and further development on the operational circumstances, particularly the semi-empirical-based hybrid model. The relatively high level of uncertainty, which can range anywhere from 5% to 15% with such a model, is the primary downside.

2.3. Experimental Method

The experimental method in this review paper refers to the use of the laboratory-scale combustor to study the LBO. As it is mimicking the lean premixed gas turbine, the flame characteristics are the most frequently used LBO prediction parameter in most setups, as shown in the summary in Table 4, especially in the laboratory-scale combustors. A variety of methods were performed for LBO prediction, such as using sensors, the statistical approach, image processing using a camera or the observational method. The sensor method is mainly used for exhaust temperature detection, as documented by Rieker et al. [82], using a diode absorption sensor. However, the most recent sensor used for LBO prediction is the ion current sensor. It is simple, cheap, and easy to maintain [83]. Many experiments through the last decades with various combustors have shown that an ion current sensor with a central electrode may be installed simply in a combustor chamber without significant modification. Ion current signals may be used as a quick and reliable indication of flame conditions and essential operating parameters. The ion current sensor was used successfully to predict the LBO when mounted in a suitable position, as documented by Li et al. [84], Wollgarten et al. [85] and Chang et al. [86]. Nevertheless, ion current sensors provide weak ion current signals easily interfered with by other electronic devices and are difficult to gather by the acquisition system. Additionally, the weak signals would significantly limit the sensor’s accuracy and reliability for flame detection [83].
Many authors used the statistical approach by collecting experimental data and used an artificial intelligence (AI) technique for the LBO prediction. One of the studies documented by De et al. [87]. The authors utilized the CH* chemiluminescence data that were obtained experimentally with statistical analysis using the recurrence quantification analysis (RQA). The findings suggested that RQA could accurately predict LBO by recording the transition to LBO. However, the authors determined that adopting statistical approaches such as RQA required significant processing time. Later, the same authors [88] employed different statistical methods to determine the heat release rate variability while witnessing the flame transition toward LBO. The findings indicated that frequency analysis based on the heat release rate was appropriate for early LBO prediction and could be applied in an actual combustor. Then, recently, ref. [89] described the use of flame color to identify combustion while reaching lean blowout. The study used the RGB colors to create an anomaly measure and observed the relation with LBO. The findings indicated that the anomaly measure of the RGB successfully predicted LBO.
Furthermore, different studies analyzed the flame color by using the camera for image collections of the flame near LBO. For example, Chaudhari et al. [90] have developed a unique approach for detecting LBOs based on flame colors. They utilized a commercial CCD camera to determine the ratio of red to blue intensities in the flame picture as the LBO indicator. The experiment showed that using the ratio of red and blue is suitable for LBO detection. They were followed by the investigation of [91]. The authors confirmed the result of the previous experiment by using a similar technique of observing the red and blue color and image processing tools. Consequently, Bhattacharya et al. [92] attempted an online prediction of LBO successfully by collecting the heat release data and RGB images of the flame colors at near LBO conditions. Another experiment of flame color in addition to chemiluminescence was used to forecast LBOs, as De et al. [93] demonstrated. Two approaches were employed to capture the flame colors: a spectrometer and a charged-coupled device camera (CCD) to examine the flame’s red, green, and blue hues. The observation was made during the shift from stability to LBO-like behavior. The findings indicated that the approaches were effective at predicting LBO, particularly when combined with a spectrometer. Although the CCD camera was capable of producing a comparable forecast, it was less precise than the spectrometer.
Additionally, different methods have been used lately, as shown in Bhattacharya et al. [94]. The authors used a frequency-based fast Fourier transform (FFT) technique in time series. The experiment successfully detected the thermoacoustic instability and the change of the combustor from stability to LBO. However, the proposed method requires deep knowledge of the combustor’s acoustic mode. Furthermore, in recent years, CH* chemiluminescence image processing techniques have been widely employed to characterize the heat release and local equivalence ratio of stabilized flames [95]. OH* chemiluminescence is a common technique for capturing the flame shape [96]. Mondal et al. [15] relied on the CH* chemiluminescence. They investigated an alternative prediction approach for the lean blowout by using the AI technique of hidden Markov modeling (HMM) technique to observe the change in chemiluminescence data over time using a time series. The research mainly focused on the transition of the combustor from stable to LBO and near LBO to stable and effectively predicted LBO. Nevertheless, chemiluminescence emissions are susceptible to other species’ influence [97]. Lastly, an interesting study by Kirubakaran and Bhatt [98] by using a laboratory-scale combustor of a micro gas turbine. The authors used inlet velocity in a range of 1.70 to 11 m/s to study its effect on the LBO. The result shows that inlet velocity could be used to predict the LBO in a statistical approach and showed that inlet velocity significantly affects combustion.
The experimental method using a laboratory combustor was very useful in understanding the operation of the gas turbines and the lean blowout. The prediction of LBO in such a setup could produce high accuracy of an average of 91%. Nonetheless, laboratory-scale combustion is a simplified combustor and demonstrates only a basic and restricted representation of an industrial gas turbine.
Table 4. The top experimental techniques summary.
AuthorMethodToolsStrengthWeakness
Rieker et al. [82]Using the exhaust temperature as an indicator of LBODiode laser-based absorption sensorIt can detect the fluctuation and instability in temperatureSuch sensor has a critical heat problem
Li et al. [84], Wollgarten et al. [85], Chang et al. [86]Detecting the frequency fluctuation to prediction the LBOIon current sensorDoes not require significant modificationThe frequency signal can be easily interfered
De et al. [87], Mondal et al. [15]Using the collected data of the CH* in a statistical analysis to predict LBOAI (RQA) (HMM)Non-intrusive and provide strong performanceRequires significant processing time
De et al. [88]Using the heat release rate as LBO indicatorFrequency analysisNon-intrusive statistical method with high accuracyCant be used with changes in fuel flow
Chaudhari et al. [90] De et al. [93]By using a CCD camera to collect images and use RGB colors intensity as the LBO indicationCCD cameraLow-cost toolsThe CCD camera provides low-precision images
Bhattacharya et al. [94]Using the frequency fluctuation in the combustion as LBO indicatorFFTProvide high accuracy predictionRequires deep knowledge of acoustic mode

2.4. Date-Driven Method

Historically, modern science and engineering have relied on semi-empirical-based models that are often developed to improve complicated systems’ design stages. The primary benefit of employing semi-empirical models is that they are based on simplified mathematical equations and adequately explain the topic under consideration. Unfortunately, these models need significant engineering work to construct, and in certain circumstances, reliable models are impossible to acquire owing to the system’s complicated or unknown physical and chemical reactions [18]. On the other side, the recent exponential expansion of data enables the creation and dissemination of novel techniques that are entirely data-driven [99,100,101]. These data-driven models may be constructed more simply by gathering measurements taken over the system’s operational range and then learning or embedding the connection between the sensor measurements into the model architecture using mathematical approaches.
Additionally, the data-driven approach has been widely used in various fields, especially for performance enhancement and fault prediction. In the area of gas turbines, the data-driven approach has been used exponentially for fault detection, such as detecting the fault in the gas turbine engine sensors as demonstrated by Naderi and Khorasani [102], Pourbabaee et al. [103], Navi et al. [104], and Cartocci et al. [105]. Similarly, it was used for aircraft engine health prediction, as demonstrated by Bathaie and Khorasani [106], Liu [107] and Liu et el. [108]. It was also used to predict gas turbine system degradation over time by Olsson et al. [109] and Sanaye et al. [110]. The previous studies show the data-driven technique’s robust performance and high-accuracy fault prediction. Regarding LBO prediction, the fully data-driven approach is a promising technique to achieve the highest performance and accuracy. Multiple indicators could be used to accurately predict the LBO, such as the fuel/air ratio, sudden drop in load, and flame temperature, which are essential parameters found in most historical data in the LPM gas turbines.
Nevertheless, only one study in the literature utilizes the data-driven methods using a real data set from an industrial gas turbine to predict the LBO. The reason could be the sensitivity and confidentiality of the recorded data from the gas turbine industry as it is a very competitive market. However, the study includes a physical parameter in hybrid with the data-driven approach to predict the LBO. The work was documented by Iannitelli et al. [18]. The authors used a data-driven approach to classify the lean blowout event. The data were collected from a GE dry low NOx (DLN) gas turbine based on the premixed technology and processed to develop a prediction model using different hybrid AI techniques and a physical parameter to compare their accuracy. First, one method used the principal component analysis (PCA) with the linear regression (LR), then with the decision tree (DT) and lastly with a physical parameter using a threshold. The result shows the high accuracy of the AI techniques of an average of 99.7% in predicting the LBO. The study concluded that the hybrid of data-driven and physical models could produce very high accuracy.
The fully data-driven method outperforms all the previously discussed techniques and significantly improves LBO prediction accuracy as shown in the comparison in Table 5 and Table 6.
The impact of such a technique’s great accuracy in forecasting and early detecting the LBO might make a huge difference in the aircraft’s safety and engine performance. Furthermore, component damage, financial loss, and a rise in CO emissions caused by incomplete combustion in a heavy-duty LPM gas turbine could be prevented or mitigated. However, the peculiarity of these data-driven models is that they are correct only in the learnt space, which means that if the system’s operation changes drastically, the model is compelled to extrapolate. The result might be no longer accurate. Additionally, more work is needed to validate the robustness of the data-driven approach and expose the challenges and the difficulty of such a method in the LBO prediction.

3. Recent Trends and Possible Future Work

All the LBO prediction techniques are still being researched for more developments and improvements. Each technique could serve a crucial part in gas turbine design, performance and fault reduction.
  • The LES simulation is a powerful tool and has been extensively used to study the chemistry and dynamics of the combustion near LBO. With the increase of computational power, a 3D simulation could give deeper information on the combustion system.
  • As of today, the existence of strong mathematical/simulation software such as MATLAB and Scilab allowed the improvement of a complex mathematical and physical representation of a gas turbine which integrates multiple parameters that can be adjusted for the testing of gas turbine performance and LBO limit. Such software could be used in a hybrid approach such as by using the Rowen’s model in simulation to be used for LBO limits.
  • The data-driven approach could make a significant improvement in the LPM combustors. LBO limits prediction at the design stages and in the early detection of a variety of faults, including the LBO during the operation. However, the data-driven model is a promising technique in all fields, especially in engineering, machinery, automotive, and power generation fields for faults and performance prediction. In fact, the model has been successfully used in gas turbines to predict faults in sensors, blades, and combustion health and performance.
  • The hybrid of multiple models, such as using historical data from an actual gas turbine to develop a powerful numerical simulation, could significantly impact the combustion field by forecasting and predicting the faults beforehand, preventing sudden accidents.

4. Conclusions

The lean blowout is the most important consideration when using a lean premixed gas turbine for combustion. Years of study have shown encouraging results in LBO prediction systems. In terms of approach, we may divide the LBO predictions into five categories: starting from the semi-empirical model, numerical simulation, hybrid, experimental, and lastly, the data-driven model. The semi-empirical model was the first to be used in the design stages to predict the LBO limits. The pioneer model was Lefebvre’s LBO model, which could be used for eight different combustors with about ±30% uncertainty. Due to the lack of depth in the semi-empirical model, the numerical simulation was suggested, leveraging the significant development in computation power. The numerical simulation exceeded the semi-empirical model on a specific gas turbine with ±10% uncertainty, but further testing is needed on different combustion engines. Later, combustors scientists suggested the hybrid method of both models to predict the LBO and achieved similar uncertainty of ±10%. The experimental model based on the laboratory-scale combustor came into existence with the effort to analyze the LBO events and the flame characteristics. Nevertheless, because the gas turbine is so complicated, all the previous methods show it in a simple way without associating the whole gas turbine parameters, which might be the reason behind their inability to achieve a satisfactory accuracy to be used in the gas turbine industry. On the other hand, the data-driven method using a historical dataset of an actual gas turbine demonstrated greater accuracy and replication of the industrial gas turbine. Additionally, with the utilization of the AI techniques, there was a significant increase in LBO prediction with a 99.7% accuracy. Such accuracy would make a major difference in the combustion industry to avoid or mitigate the consequences of the LBO such as components damages, financial loss and increase of CO emissions. However, because of the confidentiality and sensitivity of the data collected from the industries, very few studies utilized the model for LBO prediction. Therefore, additional analysis on the method is necessary to attain robust prediction accuracy on various lean premixed combustors.

Author Contributions

Conceptualization, A.A.B.; validation, R.B.I. and M.B.O.; investigation, R.B.I.; writing—original draft preparation, A.A.B.; writing—review and editing, A.A.B.; visualization, M.F.; supervision, R.B.I. All authors have read and agreed to the published version of the manuscript.

Funding

This research received no external funding.

Acknowledgments

We thank the Universiti Teknologi PETRONAS for providing the best facilities for our research and we want to thank the Center of Graduate studies for their unlimited support.

Conflicts of Interest

The authors declare no conflict of interest.

References

  1. Tahan, M.; Tsoutsanis, E.; Muhammad, M.; Abdul Karim, Z.A. Performance-based health monitoring, diagnostics and prognostics for condition-based maintenance of gas turbines: A review. Appl. Energy 2017, 198, 122–144. [Google Scholar] [CrossRef] [Green Version]
  2. Tsoutsanis, E.; Meskin, N.; Benammar, M.; Khorasani, K. A dynamic prognosis scheme for flexible operation of gas turbines. Appl. Energy 2016, 164, 686–701. [Google Scholar] [CrossRef] [Green Version]
  3. Chen, W.; Jin, D.; Cui, W.; Huang, S. Characteristics of Gliding Arc Plasma and Its Application in Swirl Flame Static Instability Control. Processes 2020, 8, 684. [Google Scholar] [CrossRef]
  4. De Giorgi, M.G.; Campilongo, S.; Ficarella, A.; De Falco, G.; Commodo, M.; D’Anna, A. Pollutant Formation during the Occurrence of Flame Instabilities under Very-Lean Combustion Conditions in a Liquid-Fuel Burner. Energies 2017, 10, 352. [Google Scholar] [CrossRef] [Green Version]
  5. Akhtar, S.; Piffaretti, S.; Shamim, T. Numerical investigation of flame structure and blowout limit for lean premixed turbulent methane-air flames under high pressure conditions. Appl. Energy 2018, 228, 21–32. [Google Scholar] [CrossRef]
  6. Pavri, R.E.; Moore, G.D. GE Power Systems Gas Turbine Emissions and Control; GE Energy Services: Atlanta, GA, USA, 2001. [Google Scholar]
  7. Faqih, M.; Omar, M.B.; Ibrahim, R.; Omar, B.A.A. Dry-Low Emission Gas Turbine Technology: Recent Trends and Challenges. Appl. Sci. 2022, 12, 10922. [Google Scholar] [CrossRef]
  8. Feng, R.; Sun, Z.; Hu, X.; Li, G.; Deng, B. Role of particle oxidation catalyst on emission reduction of a non-road diesel engine: A multi case study. Chem. Eng. Sci. 2022, 260, 117914. [Google Scholar] [CrossRef]
  9. Deng, B.; Li, Q.; Chen, Y.; Li, M.; Liu, A.; Ran, J.; Xu, Y.; Liu, X.; Fu, J.; Feng, R. The effect of air/fuel ratio on the CO and NOx emissions for a twin-spark motorcycle gasoline engine under wide range of operating conditions. Energy 2019, 169, 1202–1213. [Google Scholar] [CrossRef]
  10. Nemitallah, M.A.; Rashwan, S.S.; Mansir, I.B.; Abdelhafez, A.A.; Habib, M.A. Review of novel combustion techniques for clean power production in gas turbines. Energy Fuels 2018, 32, 979–1004. [Google Scholar] [CrossRef]
  11. Kirubakaran, V.; Bhatt, D. Experimental and numerical prediction of lean blowout limits for micro gas turbine combustor. Aircr. Eng. Aerosp. Technol. 2021, 93, 607–614. [Google Scholar] [CrossRef]
  12. Yoshida, S.; Hassa, C.; Yamamoto, T.; Heinze, J.; Schroll, M. Influence of Fluidic Control in a Staged Lean Jet Engine Burner on Combustor Performance. Fluids 2019, 4, 188. [Google Scholar] [CrossRef]
  13. Dubey, A.; Nema, P.; Kushari, A. Investigation of Reverse Flow Slinger Combustor with Jet A-1 and Methanol. J. Eng. Gas Turbines Power 2021, 143, 916. [Google Scholar] [CrossRef]
  14. Mongia, H.C. N+3 and N+4 Generation Aeropropulsion Engine Combustors: Part 6: Operating Conditions, Target Goals and Lifted Jets. In Proceedings of the 49th AIAA/ASME/SAE/ASEE Joint Propulsion Conference, San Jose, CA, USA, 14–17 July 2013. [Google Scholar] [CrossRef]
  15. Mondal, S.; De, S.; Mukhopadhyay, A.; Sen, S.; Ray, A. Early Prediction of Lean Blowout from Chemiluminescence Time Series Data. Combust. Sci. Technol. 2020, 194, 1108–1135. [Google Scholar] [CrossRef]
  16. Vignat, G.; Minesi, N.; Soundararajan, P.R.; Durox, D.; Renaud, A.; Blanchard, V.; Laux, C.O.; Candel, S. Improvement of lean blow out performance of spray and premixed swirled flames using nanosecond repetitively pulsed discharges. Proc. Combust. Inst. 2021, 38, 6559–6566. [Google Scholar] [CrossRef]
  17. Li, M.; Tong, Y.; Thern, M.; Klingmann, J. Influence of the Steam Addition on Premixed Methane Air Combustion at Atmospheric Pressure. Energies 2017, 10, 1070. [Google Scholar] [CrossRef] [Green Version]
  18. Iannitelli, M.; Allegorico, C.; Garau, F.; Capanni, M. A Hybrid Model for on-line Detection of Gas Turbine Lean Blowout Events. PHM Soc. Eur. Conf. 2018, 4. [Google Scholar] [CrossRef]
  19. Musa, G.; Alrashed, M.; Muhammad, N.M. Development of big data lean optimisation using different control mode for Gas Turbine engine health monitoring. Energy Rep. 2021, 7, 4872–4881. [Google Scholar] [CrossRef]
  20. Lei, S.; Yong, H. An overview of methodologies to predict lean blowout limits for gas turbine combustors. In Proceedings of the 2019 16th International Bhurban Conference on Applied Sciences and Technology (IBCAST), Islamabad, Pakistan, 8–12 January 2019; pp. 709–718. [Google Scholar]
  21. Zukoski, E.E.; Marble, F.E. Experiments concerning the mechanism of flame blowoff from bluff bodies. Caltech 1983. Available online: https://resolver.caltech.edu/CaltechAUTHORS:20110203-125953778 (accessed on 6 October 2022).
  22. Plee, S.; Mellor, A. Review of flashback reported in prevaporizing/premixing combustors. Combust. Flame 1978, 32, 193–203. [Google Scholar] [CrossRef]
  23. Plee, S.L.; Mellor, A.M. Characteristic time correlation for lean blowoff of bluff-body-stabilized flames. Combust. Flame 1979, 35, 61–80. [Google Scholar] [CrossRef]
  24. Derr, W.S.; Mellor, A.M. Characteristic times for lean blowoff in turbine combustors. J. Propuls. Power 1987, 3, 377–380. [Google Scholar] [CrossRef]
  25. Jarymowycz, T.A.; Mellor, A.M. Correlation of lean blowoff in an annular combustor. J. Propuls. Power 1986, 2, 190–192. [Google Scholar] [CrossRef]
  26. Leonard, P.; Mellor, A. Correlation of lean blowoff of gas turbine combustors using alternative fuels. J. Energy 1983, 7, 729–732. [Google Scholar] [CrossRef]
  27. Longwell, J.P.; Frost, E.E.; Weiss, M.A. Flame Stability in Bluff Body Recirculation Zones. Ind. Eng. Chem. 1953, 45, 1629–1633. [Google Scholar] [CrossRef]
  28. Lefebvre, A. Fuel effects on gas turbine combustion—ignition, stability, and combustion efficiency. J. Eng. Gas Turbines Power. 1985, 107, 24–37. [Google Scholar] [CrossRef]
  29. Lefebvre, A.H.; Ballal, D.R. Gas Turbine Combustion: Alternative Fuels and Emissions; CRC Press: Boca Raton, FL, USA, 2010. [Google Scholar]
  30. Ballal, D.R.; Lefebvre, A.H. Weak Extinction Limits of Turbulent Flowing Mixtures. J. Eng. Power 1979, 101, 343–348. [Google Scholar] [CrossRef]
  31. Xie, F.; Huang, Y.; Hu, B.; Wang, F. Improved Semiempirical Correlation to Predict Lean Blowout Limits for Gas Turbine Combustors. J. Propuls. Power 2012, 28, 197–203. [Google Scholar] [CrossRef]
  32. Ateshkadi, A.; McDonell, V.G.; Samuelsen, G.S. Lean blowout model for a spray-fired swirl-stabilized combustor. Proc. Combust. Inst. 2000, 28, 1281–1288. [Google Scholar] [CrossRef]
  33. Mongia, H.; Vermeersch, M.; Held, T. A simple reactor-based approach for correlating lean blowout of turbopropulsion engine combustors. In Proceedings of the 37th Joint Propulsion Conference and Exhibit, Salt Lake City, UT, USA, 8–11 July 2001; p. 3420. [Google Scholar]
  34. Mongia, H.; Vermeersch, M.; Held, T. Data Reduction and Analysis (DRA) for Emissions and Lean Blowout. In Proceedings of the 41st Aerospace Sciences Meeting and Exhibit, Reno, NV, USA, 6–9 January 2003. [Google Scholar] [CrossRef]
  35. Ahmed, E.; Yong, H. Prediction of lean blowout performance of gas turbine combustor based on flow structures. Aeronaut. J. 2017, 122, 238–259. [Google Scholar] [CrossRef]
  36. Sun, L.; Huang, Y.; Wang, R.; Feng, X.; Liu, Z.; Wu, J. FV-MP model to predict lean blowout limits for multi-point lean direct injection combustors. Aerosp. Sci. Technol. 2019, 88, 185–192. [Google Scholar] [CrossRef]
  37. Rowen, W.I. Simplified Mathematical Representations of Heavy-Duty Gas Turbines. J. Eng. Power 1983, 105, 865–869. [Google Scholar] [CrossRef]
  38. Omar, M.; Ibrahim, R.; Abdullah, M.F.; Tarik, M.H.M. Modelling and System Identification of Gas Fuel Valves in Rowen’s Model for Dry Low Emission Gas Turbine. In Proceedings of the 2018 IEEE Conference on Big Data and Analytics (ICBDA), Langkawi, Kedah, Malaysia, 21–22 November 2018; pp. 33–37. [Google Scholar] [CrossRef]
  39. Omar, M.; Tarik, M.H.M.; Ibrahim, R.; Abdullah, M.F. Suitability study on using rowen’s model for dry-low emission gas turbine operational performance. In Proceedings of the TENCON 2017—2017 IEEE Region 10 Conference, Penang, Malaysia, 5–8 November 2017; pp. 1925–1930. [Google Scholar] [CrossRef]
  40. Omar, M.B.; Ibrahim, R.B.; Abdullah, M.F.; Tarik, M.H.M. Modelling of Dry-Low Emission Gas Turbine Fuel System using First Principle Data-Driven Method. J. Power Technol. 2020, 100, 1–13. [Google Scholar]
  41. Faqih, M.; Omar, M.B.; Ibrahim, R.B. Development of Rowen’s Model for Dry-Low Emission Gas Turbine Dynamic Simulation using Scilab. In Proceedings of the 2022 IEEE 5th International Symposium in Robotics and Manufacturing Automation (ROMA), Malacca, Malaysia, 6–8 August 2022; pp. 1–5. [Google Scholar]
  42. Hu, B.; Huang, Y.; Wang, F. FIA method for LBO limit predictions of aero-engine combustors based on FV model. Aerosp. Sci. Technol. 2013, 28, 435–446. [Google Scholar] [CrossRef]
  43. Huang, Y.; Sun, L. On the Quick Prediction of Lean Blowout Limits for Gas Turbine Combustors. Destech Trans. Environ. Energy Earth Sci. 2018. [Google Scholar] [CrossRef]
  44. Sun, L.; Huang, Y.; Wang, X.; Zheng, Z.; Wang, R.; Feng, X. Hybrid method based on flame volume concept for lean blowout limits prediction of aero engine combustors. Chin. J. Aeronaut. 2021, 34, 425–437. [Google Scholar] [CrossRef]
  45. Ladeinde, F. Advanced computational-fluid-dynamics techniques for scramjet combustion simulation. AIAA J. 2010, 48, 513–514. [Google Scholar] [CrossRef]
  46. Chen, J.H. Petascale direct numerical simulation of turbulent combustion—Fundamental insights towards predictive models. Proc. Combust. Inst. 2011, 33, 99–123. [Google Scholar] [CrossRef]
  47. Mercier, R.; Auzillon, P.; Moureau, V.; Darabiha, N.; Gicquel, O.; Veynante, D.; Fiorina, B. Les modeling of the impact of heat losses and differential diffusion on turbulent stratified flame propagation: Application to the tu darmstadt stratified flame. Flow Turbul. Combust. 2014, 93, 349–381. [Google Scholar] [CrossRef]
  48. Gonzalez-Juez, E.; Kerstein, A.; Ranjan, R.; Menon, S. Advances and challenges in modeling high-speed turbulent combustion in propulsion systems. Prog. Energy Combust. Sci. 2017, 60, 26–67. [Google Scholar] [CrossRef]
  49. Ihme, M.; Pitsch, H. Prediction of extinction and reignition in nonpremixed turbulent flames using a flamelet/progress variable model: 2. Application in LES of Sandia flames D and E. Combust. Flame 2008, 155, 90–107. [Google Scholar] [CrossRef]
  50. Garmory, A.; Mastorakos, E. Capturing localised extinction in Sandia Flame F with LES–CMC. Proc. Combust. Inst. 2011, 33, 1673–1680. [Google Scholar] [CrossRef] [Green Version]
  51. Ayache, S.; Mastorakos, E. Conditional Moment Closure/Large Eddy Simulation of the Delft-III Natural Gas Non-premixed Jet Flame. Flow Turbul. Combust. 2012, 88, 207–231. [Google Scholar] [CrossRef]
  52. Hasti, V.R.; Kundu, P.; Kumar, G.; Drennan, S.A.; Som, S.; Won, S.H.; Dryer, F.L.; Gore, J.P. Lean blow-out (LBO) computations in a gas turbine combustor. In Proceedings of the 2018 Joint Propulsion Conference, Cincinnati, OH, USA, 9–11 July 2018. [Google Scholar] [CrossRef]
  53. Nassini, P.C.; Pampaloni, D.; Meloni, R.; Andreini, A. Lean blow-out prediction in an industrial gas turbine combustor through a LES-based CFD analysis. Combust. Flame 2021, 229, 111391. [Google Scholar] [CrossRef]
  54. Schwagerus, A.; Habisreuther, P.; Zarzalis, N. Lean-Blow-Out Simulation of Natural Gas Fueled, Premixed Turbulent Jet Flame Arrays with LES and FGM-Modeling. In Proceedings of the ASME Turbo Expo 2021: Turbomachinery Technical Conference and Exposition, Combustion, Fuels, and Emissions, Online, 7–11 June 2021; Volume 3A. [Google Scholar] [CrossRef]
  55. Ren, Z.; Lu, Z.; Hou, L.; Lu, L. Numerical simulation of turbulent combustion: Scientific challenges. Sci. China Phys. Mech. Astron. 2014, 57, 1495–1503. [Google Scholar] [CrossRef]
  56. Li, R.; Konnov, A.A.; He, G.; Qin, F.; Zhang, D. Chemical mechanism development and reduction for combustion of NH3/H2/CH4 mixtures. Fuel 2019, 257, 116059. [Google Scholar] [CrossRef]
  57. Bongers, H.; Van Oijen, J.; Somers, L.; De Goey, L. The flamelet generated manifold method applied to steady planar partially premixed counterflow flames. Combust. Sci. Technol. 2005, 177, 2373–2393. [Google Scholar] [CrossRef]
  58. Kim, W.W.; Lienau, J.J.; Van Slooten, P.R.; Colket, M.B., III; Malecki, R.E.; Syed, S. Towards modeling lean blow out in gas turbine flameholder applications. J. Eng. Gas Turbines Power. 2006, 128, 40–48. [Google Scholar] [CrossRef]
  59. Kaluri, A.; Malte, P.; Novosselov, I. Real-time prediction of lean blowout using chemical reactor network. Fuel 2018, 234, 797–808. [Google Scholar] [CrossRef] [Green Version]
  60. Maran, P.; Boopathi, S.; Gowtham, P.; Chidambaram, S. Prediction of Lean Blowout Limits for Methane-Air Bluff Body Stabilized Combustion using a Temperature Gradient Method in a Model Gas-Turbine Afterburner. Int. J. Turbo Jet-Engines 2020, 37, 343–352. [Google Scholar] [CrossRef]
  61. Kirubakaran, V.; Naren Shankar, R. Prediction of lean blowout performance on variation of combustor inlet area ratio for micro gas turbine combustor. Aircr. Eng. Aerosp. Technol. 2021, 93, 915–924. [Google Scholar] [CrossRef]
  62. Gupta, S.; Malte, P.; Brunton, S.L.; Novosselov, I. Prevention of lean flame blowout using a predictive chemical reactor network control. Fuel 2019, 236, 583–588. [Google Scholar] [CrossRef]
  63. Tian, D.; Xin, H.; Zhang, X.-C. Numerical Simulation Research on the Lean Blowout Boundary of the Multi-Point LDI Combustor. J. Aeronaut. Astronaut. Aviat. 2020, 52, 293–310. [Google Scholar]
  64. Li, S.; Li, S.; Mira, D.; Zhu, M.; Jiang, X. Investigation of dilution effects on partially premixed swirling syngas flames using a LES-LEM approach. J. Energy Inst. 2018, 91, 902–915. [Google Scholar] [CrossRef]
  65. Li, S.; Zheng, Y.; Zhu, M.; Martinez, D.M.; Jiang, X. Large-eddy simulation of flow and combustion dynamics in a lean partially premixed swirling combustor. J. Energy Inst. 2017, 90, 120–131. [Google Scholar] [CrossRef] [Green Version]
  66. Hasti, V.R.; Kundu, P.; Kumar, G.; Drennan, S.A.; Som, S.; Gore, J.P. Numerical simulation of flow distribution in a realistic gas turbine combustor. In Proceedings of the 2018 Joint Propulsion Conference, Cincinnati, OH, USA, 9–11 July 2018; p. 4956. [Google Scholar]
  67. Basso, F.O.; Franco, A.T.; Pitz, D.B. Large-eddy simulation of turbulent pipe flow of Herschel-Bulkley fluids-Assessing subgrid-scale models. Comput. Fluids 2022, 244, 105522. [Google Scholar] [CrossRef]
  68. Hassanaly, M.; Raman, V. Classification and computation of extreme events in turbulent combustion. Prog. Energy Combust. Sci. 2021, 87, 100955. [Google Scholar] [CrossRef]
  69. Oberkampf, W.L.; Trucano, T.G. Verification and validation in computational fluid dynamics. Prog. Aerosp. Sci. 2002, 38, 209–272. [Google Scholar] [CrossRef]
  70. Menon, S. Multi-scale modeling for LES of engineering designs of large-scale combustors. In Proceedings of the 42nd AIAA Aerospace Sciences Meeting and Exhibit, Reno, NV, USA, 5–8 January 2004; p. 157. [Google Scholar]
  71. Eggenspieler, G.; Menon, S. Structure of locally quenched swirl stabilized turbulent premixed flames. In Proceedings of the 42nd AIAA Aerospace Sciences Meeting and Exhibit, Reno, NV, USA, 5–8 January 2004; p. 979. [Google Scholar]
  72. Porumbel, I.; Menon, S. Large eddy simulation of bluff body stabilized premixed flame. In Proceedings of the 44th AIAA Aerospace Sciences Meeting and Exhibit, Reno, NV, USA, 9–12 January 2006; p. 152. [Google Scholar]
  73. Massey, J.C.; Chen, Z.X.; Swaminathan, N. Lean flame root dynamics in a gas turbine model combustor. Combust. Sci. Technol. 2019, 191, 1019–1042. [Google Scholar] [CrossRef] [Green Version]
  74. Poinsot, T. Prediction and control of combustion instabilities in real engines. Proc. Combust. Inst. 2017, 36, 1–28. [Google Scholar] [CrossRef] [Green Version]
  75. Han, M.; Xu, Q.; Han, X.; Lin, Y. Dynamics of stratified swirl flame near lean blow out. Propuls. Power Res. 2021, 10, 235–246. [Google Scholar] [CrossRef]
  76. Rizk, N.; Mongia, H. Gas turbine combustor design methodology. In Proceedings of the 22nd Joint Propulsion Conference, Huntsville, AL, USA, 16–18 June 1986; p. 1531. [Google Scholar]
  77. Rizk, N.K.; Mongia, H.C. Three-dimensional combustor performance validation with high-densityfuels. J. Propuls. Power 1990, 6, 660–667. [Google Scholar] [CrossRef]
  78. Hu, B.; Huang, Y.; Xu, J. A hybrid semi-empirical model for lean blow-out limit predictions of aero-engine combustors. J. Eng. Gas Turbines Power 2015, 137, 031502. [Google Scholar] [CrossRef]
  79. Hu, B.; Huang, Y.; Wang, F.; Xie, F. Lean blow-out prediction of aero-engine combustor based on cold flow field numerical simulation. Tuijin Jishu J. Propuls. Technol. 2012, 33, 232–238. [Google Scholar]
  80. Hu, B.; Zhao, Q.; Xu, J. Predicting lean blowout limit of combustors based on semi-empirical correlation and simulation. J. Propuls. Power 2016, 32, 108–120. [Google Scholar] [CrossRef]
  81. Sturgess, G.; Shouse, D. A hybrid model for calculating lean blowouts in practical combustors. In Proceedings of the 32nd Joint Propulsion Conference and Exhibit, Buena Vista, FL, USA, 1–3 July 1996. [Google Scholar] [CrossRef]
  82. Rieker, G.B.; Jeffries, J.B.; Hanson, R.K.; Mathur, T.; Gruber, M.R.; Carter, C.D. Diode laser-based detection of combustor instabilities with application to a scramjet engine. Proc. Combust. Inst. 2009, 32, 831–838. [Google Scholar] [CrossRef]
  83. Xu, H.; Fan, W.; Feng, J.; Yan, P.; Qi, S.; Zhang, R. Parameter Determination and Ion Current Improvement of the Ion Current Sensor Used for Flame Monitoring. Sensors 2021, 21, 697. [Google Scholar] [CrossRef] [PubMed]
  84. Li, F.; Xu, L.; Du, M.; Yang, L.; Cao, Z. Ion current sensing-based lean blowout detection for a pulse combustor. Combust. Flame 2017, 176, 263–271. [Google Scholar] [CrossRef]
  85. Wollgarten, J.C.; Zarzalis, N.; Turrini, F.; Peschiulli, A. Experimental investigations of ion current in liquid-fuelled gas turbine combustors. Int. J. Spray Combust. Dyn. 2017, 9, 172–185. [Google Scholar] [CrossRef] [Green Version]
  86. Chang, L.; Cao, Z.; Fu, B.; Lin, Y.; Xu, L. Lean blowout detection for bluff-body stabilized flame. Fuel 2020, 266, 117008. [Google Scholar] [CrossRef]
  87. De, S.; Bhattacharya, A.; Mondal, S.; Mukhopadhyay, A.; Sen, S. Application of recurrence quantification analysis for early detection of lean blowout in a swirl-stabilized dump combustor. Chaos 2020, 30, 043115. [Google Scholar] [CrossRef]
  88. De, S.; Bhattacharya, A.; Mondal, S.; Mukhopadhyay, A.; Sen, S. Identification and early prediction of lean blowout in premixed flames. Sādhanā 2020, 45, 222. [Google Scholar] [CrossRef]
  89. De, S.; Bhattacharya, A.; Mukhopadhyay, A.; Sen, S. Early detection of lean blowout in a combustor using symbolic analysis of colour images. Measurement 2021, 186, 110113. [Google Scholar] [CrossRef]
  90. Chaudhari, R.R.; Sahu, R.P.; Ghosh, S.; Mukhopadhyay, A.; Sen, S. Flame color as a lean blowout predictor. Int. J. Spray Combust. Dyn. 2013, 5, 49–66. [Google Scholar] [CrossRef] [Green Version]
  91. Sen, U.; Sharma, A.; Panja, S.; Mukherjee, S.; Sen, S.; Mukhopadhyay, A. Correlation of equivalence ratio with spectrometric analysis for premixed combustion. Fluid Mech. Fluid Power Contemp. Res. 2017, 1475–1483. [Google Scholar] [CrossRef]
  92. Bhattacharya, A.; Gupta, B.; Hansda, S.; Haque, Z.; Kumar, A.; Mishra, M.K.; De, S.; Mukhopadhyay, A.; Sen, S. Lean Blowout Phenomena and Prior Detection of Lean Blowout in a Premixed Model Annular Combustor. In Proceedings of the Gas Turbine India Conference. American Society of Mechanical Engineers, Online, 29 November 2021; Volume 83532, p. V002T04A009. [Google Scholar]
  93. De, S.; Biswas, A.; Bhattacharya, A.; Mukhopadhyay, A.; Sen, S. Use of Flame Color and Chemiluminescence for Early Detection of Lean Blowout in Gas Turbine Combustors at Different Levels of Fuel–Air Premixing. Combust. Sci. Technol. 2019, 192, 933–957. [Google Scholar] [CrossRef]
  94. Bhattacharya, C.; De, S.; Mukhopadhyay, A.; Sen, S.; Ray, A. Detection and classification of lean blow-out and thermoacoustic instability in turbulent combustors. Appl. Therm. Eng. 2020, 180, 115808. [Google Scholar] [CrossRef]
  95. Klusmeyer, A.; Cross, C.; Lubarsky, E.; Bibik, O.; Shcherbik, D.; Zinn, B. Prediction of blow-offs of bluff body stabilized flames utilizing close-coupled injection of liquid fuels. J. Eng. Gas Turbines Power 2013, 135, 011504. [Google Scholar] [CrossRef]
  96. Chen, Y.; Fan, Y.; Han, Q.; Shan, X.; Bi, Y.; Deng, Y. The influence of cooling air jets on the premixed flame structure and stability of air-cooled bluff-body flameholder. Fuel 2022, 310, 122239. [Google Scholar] [CrossRef]
  97. Docquier, N.; Candel, S. Combustion control and sensors: A review. Prog. Energy Combust. Sci. 2002, 28, 107–150. [Google Scholar] [CrossRef]
  98. Kirubakaran, V.; Bhatt, D. Experimental Prediction of Lean Blowout Limits for 3kW Micro Gas Turbine Combustor fuelled with LPG. Incas Bull. 2021, 13, 89–95. [Google Scholar] [CrossRef]
  99. Yan, W.; Yu, L. On accurate and reliable anomaly detection for gas turbine combustors: A deep learning approach. arXiv 2019, arXiv:1908.09238. [Google Scholar]
  100. Roman, R.C.; Precup, R.E.; Petriu, E.M.; Dragan, F. Combination of data-driven active disturbance rejection and Takagi-Sugeno fuzzy control with experimental validation on tower crane systems. Energies 2019, 12, 1548. [Google Scholar] [CrossRef] [Green Version]
  101. Hashemi, S.M.; Botez, R.M.; Grigorie, T.L. New reliability studies of data-driven aircraft trajectory prediction. Aerospace 2020, 7, 145. [Google Scholar] [CrossRef]
  102. Naderi, E.; Khorasani, K. Data-driven fault detection, isolation and estimation of aircraft gas turbine engine actuator and sensors. Mech. Syst. Signal Process. 2018, 100, 415–438. [Google Scholar] [CrossRef]
  103. Pourbabaee, B.; Meskin, N.; Khorasani, K. Robust sensor fault detection and isolation of gas turbine engines subjected to time-varying parameter uncertainties. Mech. Syst. Signal Process. 2016, 76, 136–156. [Google Scholar] [CrossRef]
  104. Navi, M.; Davoodi, M.R.; Meskin, N. Sensor fault detection and isolation of an industrial gas turbine using partial kernel PCA. IFAC-PapersOnLine 2015, 48, 1389–1396. [Google Scholar] [CrossRef]
  105. Cartocci, N.; Napolitano, M.R.; Costante, G.; Valigi, P.; Fravolini, M.L. Aircraft robust data-driven multiple sensor fault diagnosis based on optimality criteria. Mech. Syst. Signal Process. 2022, 170, 108668. [Google Scholar] [CrossRef]
  106. Tayarani-Bathaie, S.S.; Khorasani, K. Fault detection and isolation of gas turbine engines using a bank of neural networks. J. Process. Control 2015, 36, 22–41. [Google Scholar] [CrossRef]
  107. Liu, J. Gas path fault diagnosis of aircraft engine using HELM and transfer learning. Eng. Appl. Artif. Intell. 2022, 114, 105149. [Google Scholar] [CrossRef]
  108. Liu, S.; Wang, H.; Tang, J.; Zhang, X. Research on fault diagnosis of gas turbine rotor based on adversarial discriminative domain adaption transfer learning. Measurement 2022, 196, 111174. [Google Scholar] [CrossRef]
  109. Olsson, T.; Ramentol, E.; Rahman, M.; Oostveen, M.; Kyprianidis, K. A data-driven approach for predicting long-term degradation of a fleet of micro gas turbines. Energy AI 2021, 4, 100064. [Google Scholar] [CrossRef]
  110. Sanaye, S.; Hosseini, S. Prediction of blade life cycle for an industrial gas turbine at off-design conditions by applying thermodynamics, turbo-machinery and artificial neural network models. Energy Rep. 2020, 6, 1268–1285. [Google Scholar] [CrossRef]
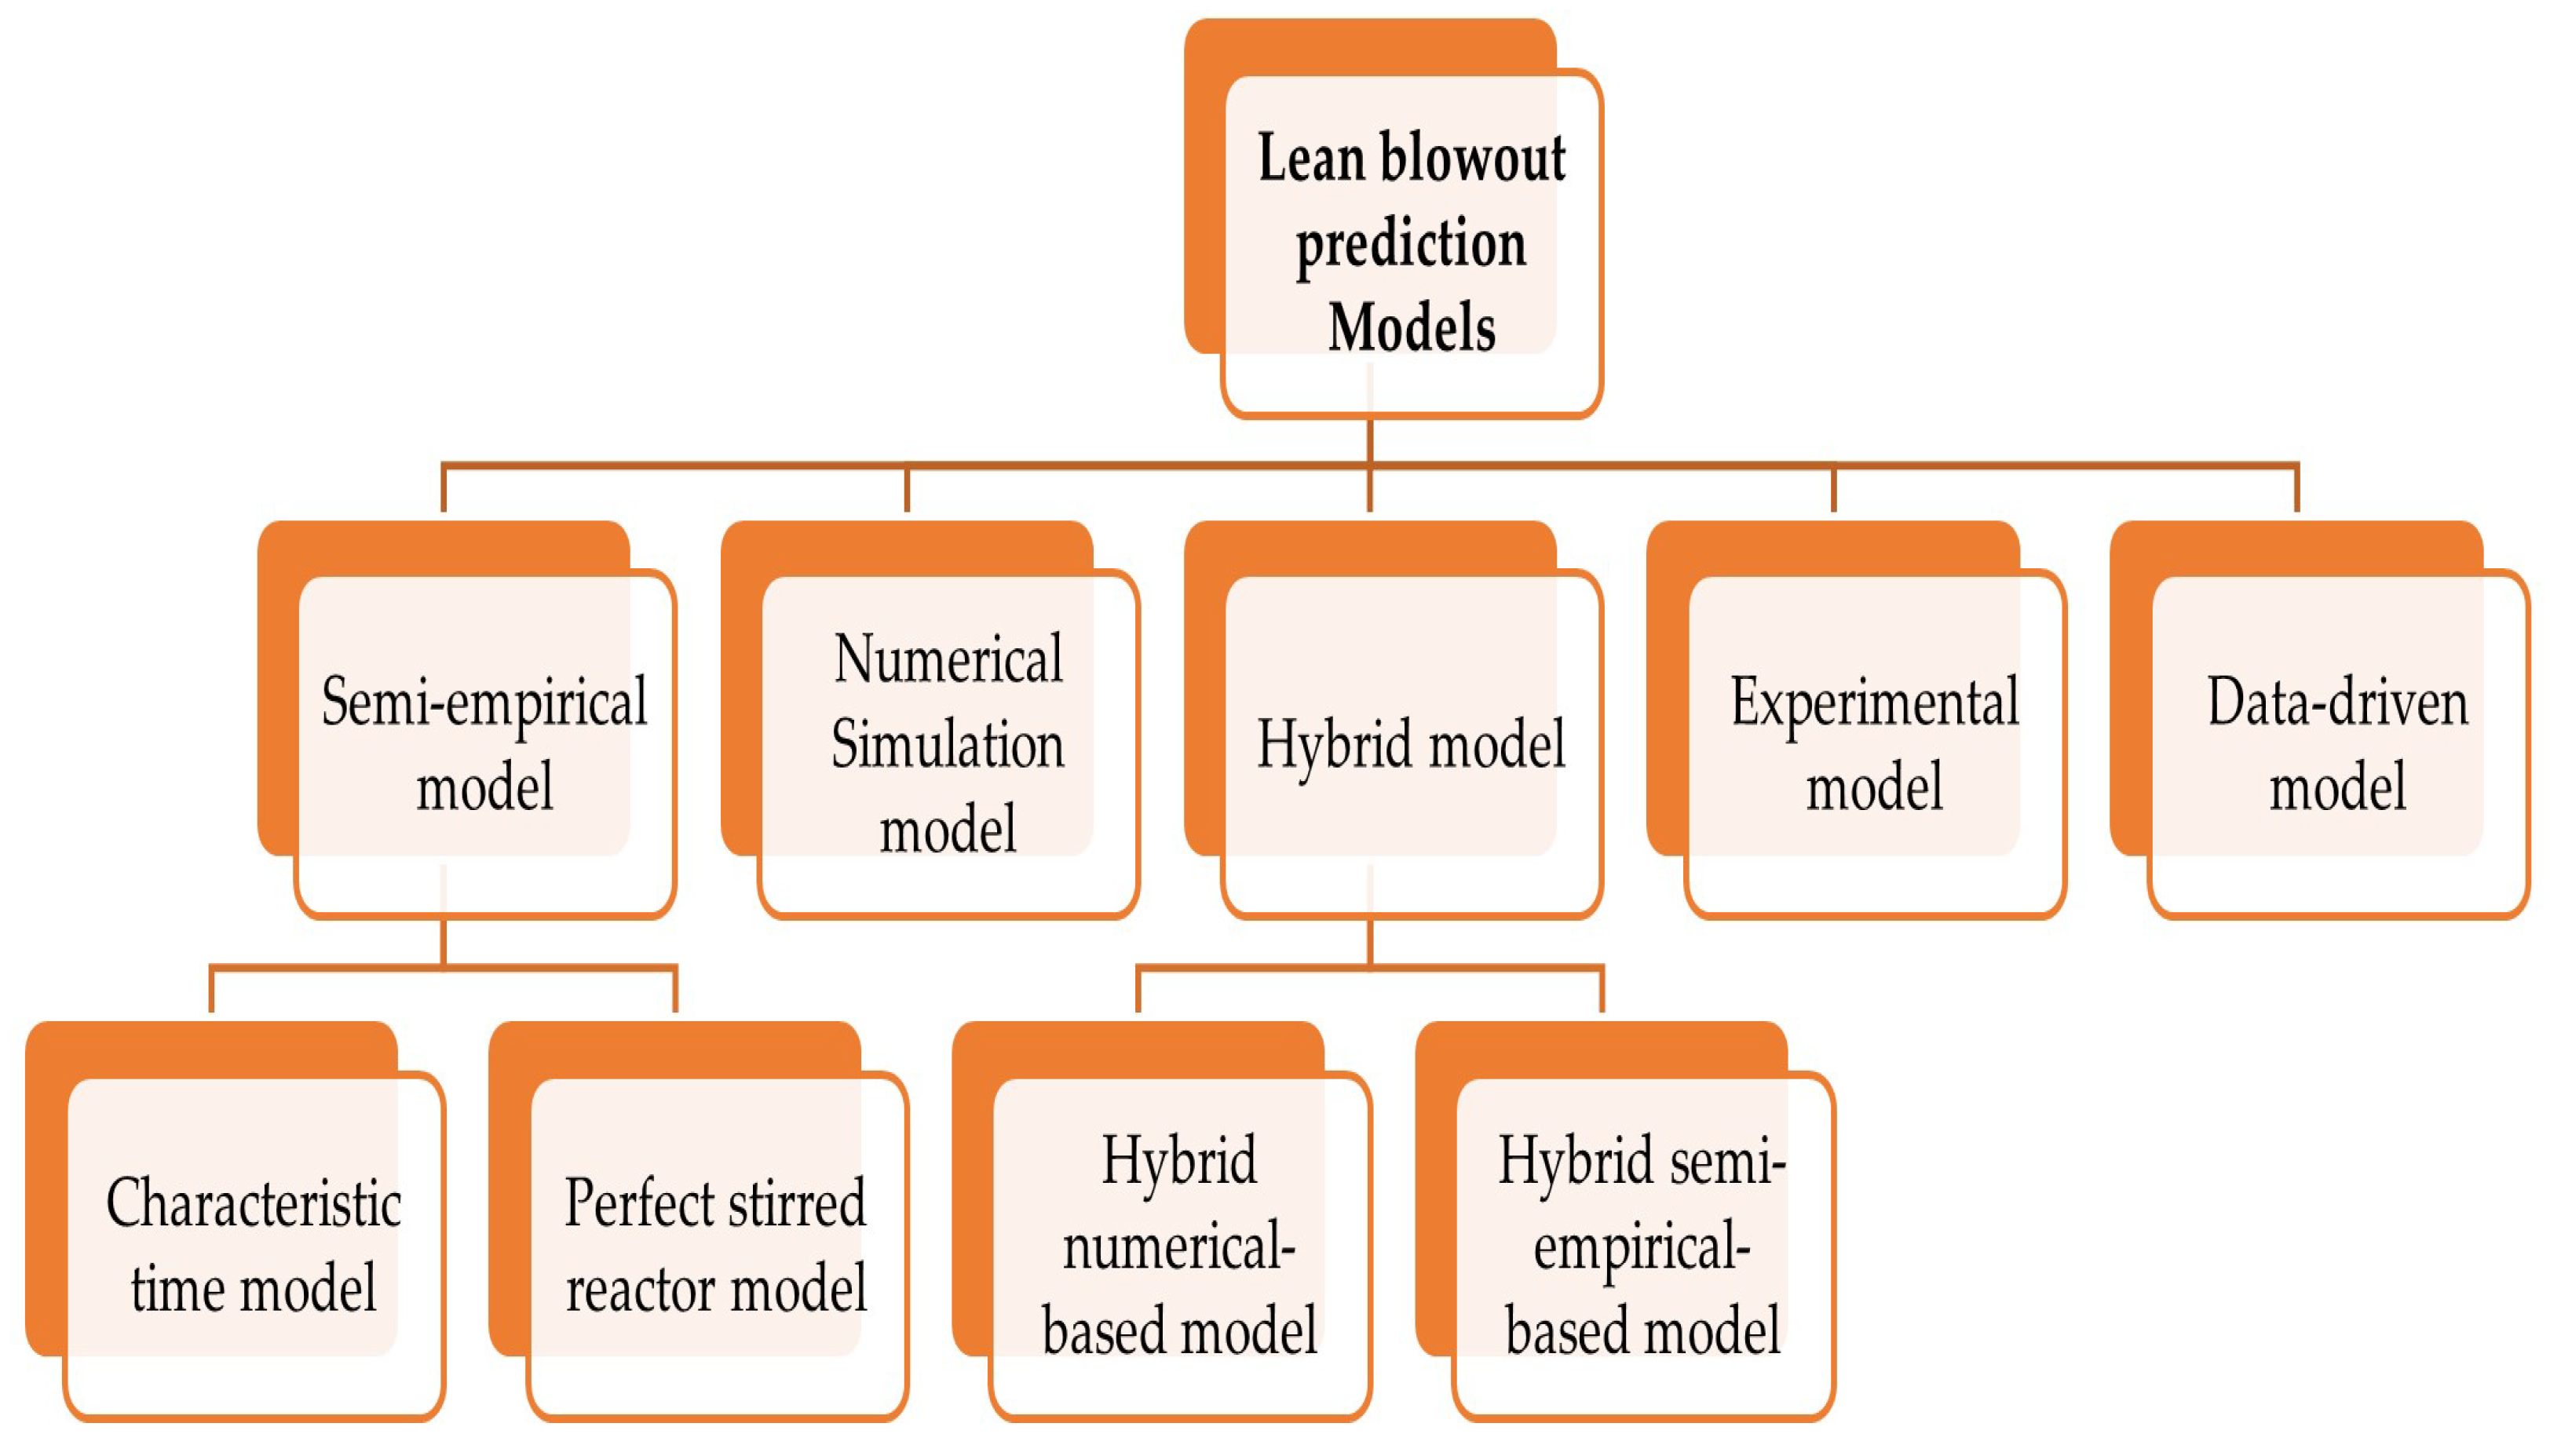
Figure 1. Diagram of the techniques used for LBO prediction.
Energies 15 08343 g001
Figure 2. The fields studied the phenomenon of LBO.
Energies 15 08343 g002
Figure 3. Top authors contributed to the LBO prediction field.
Energies 15 08343 g003
Figure 4. The physical model of Lefebvre’s LBO expression [31].
Energies 15 08343 g004
Figure 5. The physical model of FV LBO expression [31].
Energies 15 08343 g005
Figure 6. LBO MPLDI combustor flow pattern schematic [36].
Energies 15 08343 g006
Figure 7. Rowen’s simplified semi-empirical model block diagram [40].
Energies 15 08343 g007
Figure 8. Development of LBO prediction techniques.
Energies 15 08343 g008
Figure 9. The simulation of flame shape elongation near LBO with the reduction of Φ at constant inlet velocity [54].
Energies 15 08343 g009
Figure 10. The simulation of flame shape elongation near LBO with increased inlet velocity and constant Φ [54].
Energies 15 08343 g010
Figure 11. Comparison of FV simulation and experimental results [42].
Energies 15 08343 g011
Table 1. Development stages of the semi-empirical approach.
Semi-Empirical
Models
AuthorsConceptDrawback
CTZukoski and Marble [21]LBO is occurring when the ignition delay time is longer than the particle time spent in the shear layer; therefore, when both times are equal, it is the LBO indicatorHigh uncertainty for LBO limits prediction
Plee and Mellor [22,23]Adding the particle evaporation rate to Zukoski and Marble concept instead of the particle time spent in the shear layerLimited to three types of combustors
PSRLongwell et al. [27]LBO occurs when the heat loss in the recirculation zone is equal to the heat release and the pressure of the recirculation zone is proportional to the stability of blowout velocityNot capable of predicting LBO limit in swirl-stabilized combustors
Lefebvre et al.
[28,29]
Developed Longwell concept to be used in the swirl-stabilized combustors for LBO predictionHigh uncertainty of 30%
Mongia et al. [34]Improved Lefebvre mode to be used in 5 different combustors by improving the parameters of the modelLimited to specific combustors configuration
Ateshkadi et al. [31]Improved the Lefebvre equation by introducing temperature-dependent parameters instead of the constant ANot generalized for new combustors
Xie et al. [32]By using the flame volume to improve the accuracy and generalizability of the Lefebvre model by two parameters of mass fraction of the airflow in the combustor’s dome and the non-dimensional flame volumeCannot be used for the new ultra low NOx combustors
Sun et al. [36]Improving the Lefebvre and flame to be applicable in ultra-low NOx combustorsDoes not satisfy the industrial acceptable level of accuracy
Table 3. Summary of the hybrid techniques.
AuthorMethodToolsStrengthWeakness
Rizk and Mongia [77]By combining the flow field of the simulation with the semi-empirical model of fuel data3D combustor codeIt can predict LBO, emission and performanceLimited to one combustor configuration
Hu et al. [78]Estimating the parameters of FV from the simulation of non-reacting flowCPUProvide better accuracy than the semi-empirical model at 16% uncertaintyComputationally and timely expensive
Sun et al. [44]Using the threshold of flame in the simulation as the parameter of the FVCFD and FluentImproved the uncertainty to 10%Computationally expensive
Table 5. Comparison of the LBO prediction techniques.
Prediction MethodUsagesAdvantagesDisadvantagesAccuracy
Semi-empirical
  • Predict the LBO limit for combustor design.
  • Predict the LBO in heavy-duty gas turbine.
  • Economical approach.
  • Robustness and simplicity.
  • Very high uncertainty for different combustors.
  • It does not offer deep modeling of combustion.
30% to 50% uncertainties
Numerical Simulation
  • Lean blowout limit for combustion design.
  • Observe fuel flow and the flame characteristic.
  • Provide a visual understanding of LBO event.
  • Better accuracy than semi-empirical model.
  • Gives a deeper understanding of the combustion process.
  • Costly.
  • Computationally complex.
  • Insufficient to present an actual combustion.
10% to 15% uncertainty
Hybrid
  • Study the LBO using the semi-empirical input and the numerical simulation.
  • Study the flow of fuel and flame characteristics.
  • Combine the simplicity and robustness of the semi-empirical model with the accuracy of the numerical model.
  • Achieve better accuracy than both previous models.
  • Incapability to perform well with new combustors configuration.
  • Improvement is desired to achieve better accuracy.
5% to 15% uncertainty
Table 6. Comparison of the LBO prediction techniques.
Prediction MethodUsagesAdvantagesDisadvantagesAccuracy
Experimental
  • To study the flame characteristics.
  • To predict the LBO.
  • More relatable to the actual gas turbine.
  • Added more parameters that affect the LBO.
  • Very costly approach to building a laboratory combustor.
  • Weak and limited representation of the actual gas turbine.
Accuracy of 91% in predicting the lean blowout
Data-driven
  • To predict the faults in gas turbines including LBO.
  • To predict the emission in gas turbines.
  • An accurate representation of the actual gas turbine.
  • Produced significantly high prediction accuracy above 99%.
  • Have not been explored extensively for LBO prediction.
  • Historical datasets are not easily available.
Prediction accuracy above 99%
Publisher’s Note: MDPI stays neutral with regard to jurisdictional claims in published maps and institutional affiliations.