Article

High-Precision Fault Detection for Electric Vehicle Battery System Based on Bayesian Optimization SVDD

1
Key Laboratory of Advanced Perception and Intelligent Control of High-End Equipment, Anhui Polytechnic University, Wuhu 241000, China
2
Anhui Province Key Laboratory of Detection Technology and Energy Saving Devices, Anhui Polytechnic University, Wuhu 241000, China
*
Author to whom correspondence should be addressed.
Energies 2022, 15(22), 8331; https://doi.org/10.3390/en15228331
Submission received: 10 October 2022 / Revised: 1 November 2022 / Accepted: 4 November 2022 / Published: 8 November 2022
(This article belongs to the Special Issue Advanced Technologies in Electrified Vehicles)

Abstract

:
Fault detection of the electric vehicle battery system is vital for safe driving, energy economy, and lifetime extension. This paper proposes a data-driven method to achieve early and accurate battery system fault detection to realize rapid early warning. The method first adopts the support vector data description model mapping the feature of unlabeled voltage and temperature into a minimum volume hypersphere in high-dimensional space. When the feature is located outside the hypersphere, it is judged to be faulty. Then, to overcome the problem of hyperparameters selection, Bayesian optimization and a small amount of label data are used to iteratively train the model. This step can greatly improve the fault detection ability of the model, which is conducive to mining early and minor faults. Finally, the proposed model is compared with three unsupervised fault detection models, principal component analysis, kernel principal component analysis, and support vector data description to validate the performance of fault detection and robustness, respectively. The experimental results show that: 1. the proposed model has high detection accuracy in all four fault datasets, especially in the highly concealed cumulative short-circuit fault, which is substantially ahead of the other three models; and 2. The proposed model has higher and more stable accuracy than the other three models even in the case of a large range of signal-to-noise ratio.

1. Introduction

The accelerated consumption of fossil fuels has not only brought environmental pollution but has also led to an energy crisis, which has become a global challenge [1]. The large-scale development of new energy technologies is a powerful measure to solve the challenge [2]. Among them, electric vehicles (EVs) are gradually becoming the backbone of the new energy system [3]. Due to high safety, high cycle life, and high energy density, lithium-ion battery systems have become the mainstream energy supply solution [4]. To meet the power requirements of EVs, the lithium-ion system should have high voltage and high-power characteristics. Therefore, the battery system is usually composed of thousands of lithium-ion batteries connected in series and parallel [5]. However, the inconsistency of the voltage and the temperature of cells, which causes varying rates of decay of the cell life and can even lead to overcharge, over-discharge, and other faults, has a significant impact on the safety of the battery system [6]. The early and minor faults further aggravate these issues, which may grow into more serious faults and result in a thermal runaway (TR). TR occurs while driving, the fire can spread to the entire battery system in a short period and can even cause the entire vehicle to burn up [7]. Therefore, the accurate detection of early and minor faults is critical to the safe use of battery systems.

1.1. Review of the Existing Data-Driven Fault Detention Methods for the Battery System

Nowadays, research on battery system fault diagnosis is divided into four categories: physical model-based methods, knowledge model-based methods, signal processing-based methods, and data-driven methods [8]. The residual analysis in the physical model-based approach requires accurate process data, while the battery system operates in a rather harsh environment subject to many noise disturbances [9]. Therefore, such methods are not considered for practical use. The knowledge-based model approach uses the battery system knowledge to develop threshold rules to determine the occurrence of faults [10]. However, the battery system fault mechanism is complex and the faults are coupled with each other, which makes it very difficult to develop effective rules systematically. In a battery system, the amplitude-frequency and phase-frequency characteristics of the state data change somewhat when a cell fails [11]. Therefore, a spectrum analysis of the state data can be performed from the frequency domain to determine the battery system state. However, this method based on signal processing is highly susceptible to large errors due to the influence of noise.
In contrast to the three approaches mentioned above, the data-driven approach does not require the development of an accurate physical model or the systematic learning knowledge of battery systems. In addition, it can be modeled directly in the time domain to facilitate the design of noise reduction steps. Under the same conditions, the cells in a battery system usually have good consistency and their voltages follow a certain distribution, so the entropy-based method [12] and the correlation coefficient-based method [13] successfully achieve good detection results. In addition, building data-driven models for battery system fault diagnosis from the perspective of machine learning is also a hot research direction nowadays. Through machine learning techniques, the data-driven method can learn fault patterns from historical data and build black-box models to represent the relationship between data inputs and fault outputs [14]. With the development of battery management systems (BMS), growing battery condition monitoring data are being collected and utilized [15]. In addition, machine learning theories and techniques are becoming more and more mature. Therefore, data-driven fault diagnosis methods based on historical data have received a lot of attention. The existing data-driven battery system fault diagnosis methods are mainly divided into two categories: supervised methods and unsupervised methods.
The supervised approach mainly uses normal and faulty samples and their labels to train a fault classifier suitable for the battery system. From the perspective of sample size, it can be further divided into the large sample size training method and the small sample size training method [16]. Yang et al. proposed an artificial neural network-based method by extracting voltage data features, which used voltage as input and short-circuit cell current as output. The estimated current is then used in a three-dimensional electrothermal coupling model to predict the temperature distribution of the external short-circuit cell [17]. Huo et al. developed a proton exchange membrane fuel cell performance prediction model that can effectively predict I–V polarization curves by combining convolutional neural networks with random forest algorithms [18]. Both methods have good performance, but the ability of the model is based on the training of a large amount of labeled data, whether it is an artificial neural network or a convolutional neural network. However, once a battery system fails, it means scrap disposal, so the collection of fault samples and labels is very difficult. Therefore, the method of building neural networks using a large number of fault samples is difficult to implement in practice. Supervised learning methods at small sample scales can somewhat weaken the effect of insufficient fault samples. By studying the heat generation phenomenon of lithium batteries under external short circuit fault conditions, Chen et al. proposed a support vector machine-based maximum temperature rise prediction method, which can accurately predict the maximum temperature before it occurs for a specific cell [19]. Yang et al. proposed a random forest classifier-based method to detect electrolyte leakage from an externally short-circuited battery. The results of the leakage situation are obtained by using the classifier using two characteristics of the leaking battery with maximum temperature rise and minimum discharge capacity [20]. Although the small sample size training method has some effect, it still needs a large number of label samples. Accurate labeling takes time and effort, resulting in higher model development costs. Therefore, unsupervised methods have been paid more attention. Liu et al. used voltage data from cloud-based new energy vehicle batteries to jointly diagnose abnormal single cells using density-space-based clustering algorithms and angular variance methods [21]. Kim et al. designed a cloud-based big data battery system condition monitoring technology that calculates the battery charge state, internal resistance, and capacity from the data collected by the BMS, then uses clustering analysis to mine outliers, and finally sends the detection results back to the BMS [22]. Aiming at the complex and changeable abnormal phenomenon of a power battery system under the condition of big data, Zhao et al. established a multi-screening strategy based on three standard deviations to study the outlier analysis algorithm of power battery cell voltage and detected the abnormal voltage change in the battery pack [23]. It reduces the labeling cost and simplifies the model development steps, but at the same time, the lack of labeled samples also leads to the lack of prior information about the model. This can result in the inaccurate detection of early and minor faults by the model. In addition, these unsupervised methods only consider one state of data, namely, voltage. However, the battery system fault is highly coupled, and other state data may also contain fault mode information. Therefore, considering other state data at the same time will fully mine fault information.

1.2. Contributions

Although the above works (supervised methods and unsupervised methods) have made great progress in battery system fault diagnosis, there are still some problems that have not been solved well. Figure 1 illustrates the logical relationship between these tasks to be solved. Supervised learning methods require large amounts of manually labeled data, which can lead to a dramatic increase in the cost of model development. Although the unsupervised method reduces the demand for labeled samples, it still faces the problem of low detection accuracy. In addition, considering the existence of the complex distributions of multiple state data, most unsupervised methods consider using only one type of state data, i.e., voltage, to build data-driven models.
To solve the above research problems, we propose a novel semi-supervised data-driven fault detection method. A large number of unlabeled temperature and voltage data are used to train the support vector data description (SVDD) to form a base fault detection model. Although SVDD can have a better detection effect in high latitude and complex distribution data, there is still a key problem, namely, the selection of model parameters. The common method is to set the parameters based on experience, but the model built by this method usually does not have very accurate detection capability. If we keep trying different parameters, it will cause high computational costs and low training efficiency. Therefore, to address this problem, a small amount of BMS or manually labeled data is used to further find the optimal parameter by Bayesian optimization (BO) iteration, and the optimal parameters are essential to maximizing the fault detection ability. The main contributions of the proposed fault detection method are as follows:
Low modeling cost and high modeling efficiency. Automated optimization search methods save training time and training costs. In addition, the Bayesian optimization algorithm is the most effective automated machine learning method in recent years, which greatly improves the efficiency of finding optimal parameters by simulating the original model with probabilistic proxy models.
Strong applicability. Battery systems often generate complex distributed state data in actual operation, and the proposed method is highly applicable to building an effective fault detection model even under such circumstances.
Excellent fault detection capability. Early and minor faults are often difficult to detect, especially when the data is high-dimensional. The most serious safety accidents of battery systems are due to small faults that cannot be detected. The proposed method can detect these faults in time, which greatly improves the safety of the battery system.

1.3. Organization of the Paper

Section 2 introduces the hardware structure of the battery system and analyzes the state data. Section 3 presents the mathematical principle of the proposed model. The proposed fault detection framework and application are introduced in Section 4. The experimental analysis is presented in Section 5. Section 6 concludes the paper.

2. Overview of the Battery System

2.1. Battery System Hardware Structure Analysis

To improve the output power and drive voltage of the battery system, thousands of cells need to be used in series, parallel, or series-parallel. The research object of this paper is a box-type pure electric truck developed by a new energy company in China. The battery system first consists of several ternary lithium-ion batteries in parallel to form a battery pack, and then several battery packs continue to form a battery module in parallel. The battery module contains a total of 24 cells. Ultimately, 92 battery modules in series form a battery system with 2208 cells. Figure 2 displays the different scales of the battery system. The cell voltage of the battery system ranges from 2.75 to 4.2 V, and the temperature ranges from −20 to 60 °C. The battery system is equipped with three main sensors to monitor the operating status: voltage sensor, temperature sensor, and current sensor. A total of 92 battery modules are equipped with 92 voltage sensors, 20 pre-set temperature characteristic points are evenly distributed in the battery system with 20 temperature sensors, and one current sensor is equipped at the load to monitor the total current of the whole battery system. The BMS acquisition module collects the measured values of all the sensors in real-time every 30 s, transmits them to the main control module for data processing, and finally transmits them to the computer through CAN communication.
Battery system faults mainly include overcharge, over-discharge, internal short circuit (ISC), and external short circuit (ESC) [24]. These faults usually have coupling or causal relationships with each other. For example, overcharge faults can cause lithium dendrites to grow and may puncture the separator causing an ISC [25]. The pattern information of these faults is often hidden in a large amount of historical data. Establishing a reasonable data-driven model is conducive to mining the potential rules behind the data. However, considering the energy ratio and volume of the battery system, the manufacturer will not add additional sensors to collect other state data, such as adding a current sensor to each branch and a pressure sensor to each battery pack. Therefore, when establishing a data-driven model for fault detection, different state data should be considered as much as possible. In the real system, temperature and voltage data are often the only and most direct data that contain battery system state information. In this paper, a data-driven fault detection model will be established using temperature and voltage state data.

2.2. State Data Analysis

The state data generated by the battery system is usually subject to Gaussian distribution [26], which is very beneficial to the fault detection algorithm based on Gaussian assumption, such as principal component analysis (PCA), kernel principal component analysis (KPCA), etc. In addition, the voltage and temperature data generated by the battery system have a strong linear relationship in a high-dimensional space. If the state data always obeys the Gaussian distribution, the above two algorithms will produce very accurate detection results. However, when the battery system works at a high load for a long time, polarization occurs; when the battery system ages, the state data may deviate from the Gaussian distribution.
All the voltage and temperature data of the EV battery system within a month were collected, and the data of one of the voltage sensors and temperature sensors were randomly selected to draw the Quantile-Quantile(Q-Q) diagram. Figure 3 shows the distribution of 70,000 voltage data in a month. It can be seen that the blue scatter plot does not overlap with the red straight line or the trend, there is only a small overlap in the middle part. The same situation can be displayed in Figure 4; the distribution of temperature data is not completely subject to normal distribution. Therefore, the suggestion of a fault detection model cannot be considered from the perspective of normal distribution. Through a lot of research, the SVDD model does not require data to obey Gaussian distribution and has good high-dimensional data anomaly detection capability.

3. SVDD Fault Detection Model Based on Bayesian Optimization

3.1. SVDD for Fault Detection

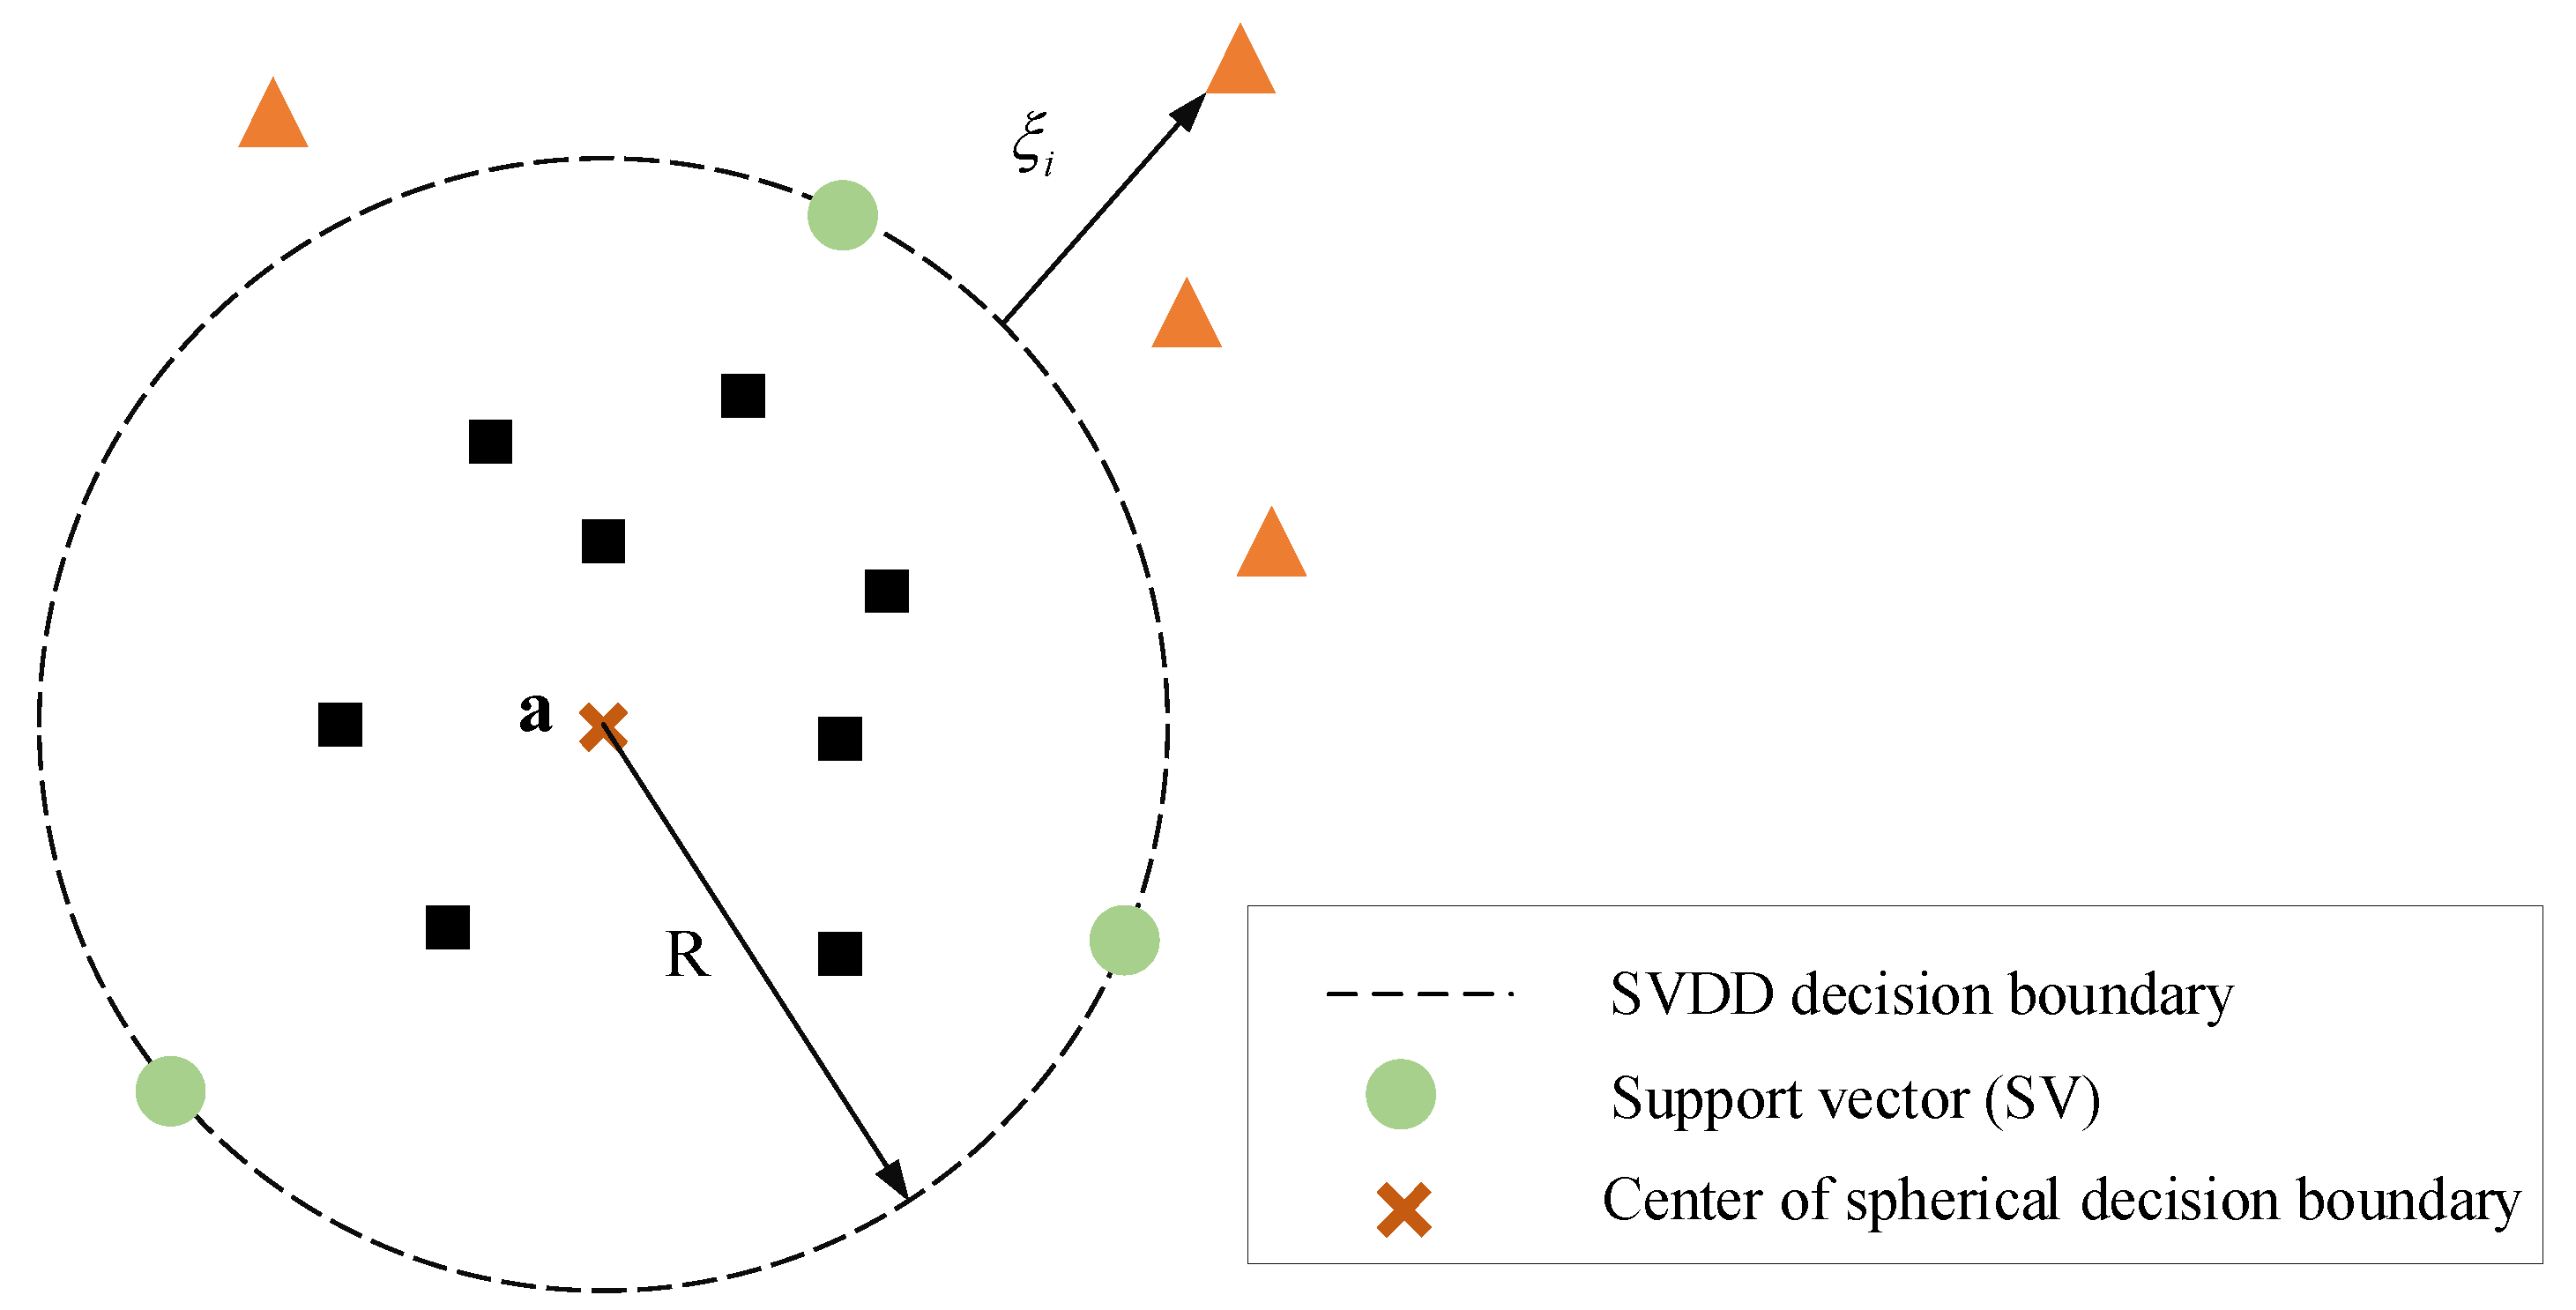
SVDD was first proposed by Tax and Duin for single classification problems [27]. It has shown powerful one-class classification capability in face recognition [28] and image retrieval [29]. It has been successfully applied in the field of fault detection, such as analog circuit fault detection, bearing performance degradation assessment, etc. [30]. The idea behind SVDD is to create a hypersphere in high-dimensional space to accomplish the description of the target data. As shown in Figure 5, during the detection process, a test sample is judged to be normal if it falls inside the hypersphere, otherwise, it is a faulty sample.
For a training dataset consisting of the battery system state voltage and temperature X = [ x 1 , x 2 , , x N ] T R N × m , where x i R m is an m-dimensional real number space. To construct a hypersphere of minimum volume with a as the center of the sphere and R as the radius, the SVDD can be converted into the following optimization problem:
min R , ξ R 2 + C i = 1 N ξ i s . t .   ( x i a ) T ( x i a ) R 2 + ξ i                 ξ i 0 ,   i = 1 , , N ,
where C i = 1 N ξ i is used to overcome the effect of outlier points in the training dataset, ξ i is the penalty coefficient, and C is the penalty factor. To solve this constrained problem, the Lagrange multiplier method is required and multipliers α i 0 and γ i are introduced:
L ( R , a , ξ i , α i , γ i ) = R 2 + C i = 1 N ξ i i = 1 N γ i ξ i i = 1 N α i { R 2 + ξ i ( x i a ) T ( x i a ) } .
The constraint problem can be transformed into its dual problem according to the KKT condition:
min a i = 1 N j = 1 N α i α j < x i , x j > i = 1 N α i < x i , x i > s . t .   i = 1 N α i = 1             0 α i C ,   i = 1 , , N .
Using the convex optimization solution method, the optimal solution α * = ( α 1 * , α 2 * , , α N * ) T is obtained. Here, only the sample corresponding to α i * 0 is the support vector (SV). Let the support vector sample set be S V , then the number of support vectors is n S V . From this, the radius of the hypersphere can be obtained as:
R = 1 n S V s S V x s a ,
where the center of the sphere is:
a = i = 1 N α i * x i .
Based on the above steps to build the detection model, the detection of the test sample x can be expressed as:
R x 2 = ( x a ) T ( x a ) = < x , x > 2 i = 1 N α i * < x , x i > + i = 1 N j = 1 N α i * α j * < x i , x j > .
If R x 2 R 2 , it is judged to be a normal class, otherwise it is a fault. However, such a detection model is not capable of detecting nonlinear data faults. Therefore, nonlinear mapping ϕ needs to be introduced to enhance the nonlinear detection capability of SVDD. Then, the above equation constraint problem is transformed into:
min a i = 1 N j = 1 N α i α j ϕ ( x i ) T ϕ ( x j ) i = 1 N α i ϕ ( x i ) T ϕ ( x i ) s . t .   i = 1 N α i = 1             0 α i C ,   i = 1 , , N                                 .
Since the nonlinear mappings in the above formula appear in the form of an inner product, the kernel function is introduced to represent the inner product form of the original data in the high-dimensional feature space to avoid finding the specific form. In this way, the center of the hypersphere after nonlinear mapping can be obtained:
a = i = 1 N α i * ϕ ( x i ) .
The radius of the hypersphere is:
R = 1 n S V s S V ϕ ( x s ) a = 1 n S V s S V K ( x s , x s ) 2 i = 1 N α i * K ( x s , x s ) + i = 1 N j = 1 N α i * α j * K ( x i , x j ) .
When a testing sample x , if it satisfies:
R x 2 = K ( x , x ) 2 i = 1 N α i * K ( x , x i ) + i = 1 N j = 1 N α i * α j * K ( x i , x j ) R 2 ,
x is determined to be normal, otherwise the fault.
In addition, the Gaussian kernel function is the most widely used in the selection of kernel functions, because in theory, it can map data to infinite dimensional space.
K ( x , y ) = exp ( x y 2 γ ) .

3.2. Bayesian Optimization for the SVDD Detection Model

When the SVDD model is constructed, the penalty factor and the Gaussian kernel width need to be set manually, according to experience. However, manually set hyperparameters often lead to the model failing to meet the requirements of accurate detection. Therefore, Bayesian optimization is used to automatically iterate to find the optimal hyperparameters to obtain the best detection performance. As a global optimization algorithm, the Bayesian optimization algorithm can quickly and accurately find the optimal solution for complex objective functions with less objective function evaluation.
The hyperparameters of the SVDD can be expressed as ρ = ( γ , C ) . Assume that Bayesian optimization finds t sets of hyperparameters ρ 1 : t = ( ρ 1 , , ρ t )   ρ 1 : t = ( ρ 1 , , ρ t ) , each hyperparameter will be calculated to an objective function value L ( ρ ) . Thus, the set of t hyperparameters can be expressed as O 1 : t = { ( ρ 1 , L ( ρ 1 ) ) , , ( ρ t , L ( ρ t ) ) } . In the optimization search process, the optimal hyperparameter combination needs to be found:
γ , C = arg ρ O min L ( ρ ) ,
where γ and C are the hyperparameters that minimize the objective function. In this paper, L represents the error rate function on the validation set. The goal of Bayesian optimization is to minimize the value of L .
The principle of Bayesian optimization is to use the prior information of the objective function with the observation set to obtain the posterior distribution of the model, and then use the posterior information to select the next sampling point until the objective function value is minimized or maximized [31]. This process requires two core components to complete, namely, the probabilistic surrogate model and the collection function [32].
The probabilistic surrogate model consists of a prior probability model and an observation model: the prior probability model, i.e., p ( L ) ; the observation model describes the mechanism by which the observed data are generated, i.e., the likelihood distribution p ( O 1 : t | L ) . Updating the probabilistic surrogate model implies obtaining a posterior probability distribution p ( L | O 1 : t ) that contains more information about the data according to the Bayesian formula. Gaussian process (GP) has a strong performance in fitting functions and is one of the most widely used and effective probabilistic proxy models in practice [33]. In this paper, GP is also used for Bayesian optimization.
The collection function is constructed based on the posterior probability distribution, and the collection function is maximized to select the next most “promising” evaluation point. Commonly used acquisition functions include the Probability of Improvement (PI), Excepted Improvement (EI), and the Gaussian Process-Upper Confidence Bound (GP-UCB) [34]. In this paper, the PI function is used to assist the GP in the Bayesian optimization process.

4. Fault Detection Framework Based on BO-SVDD Model

4.1. Data Acquisition and Data Pre-Processing

The real-time operation data of EVs mainly includes the battery system, motor drive system, and vehicle control system. The acquisition module of BMS transmits these data to the main control module, and then the data is processed to form a data table to be transmitted to the computer. The temperature and voltage data of the battery system are exported to form a data matrix, the columns of which are composed of 20-dimensional temperature data and 92-dimensional voltage data, and the rows are formed by the BMS collecting status data every 30 s.
Due to the complex vehicle driving environment, there may be outliers in the collected data, which will cause the model to learn in the wrong direction. In addition, the difference between the values of temperature and voltage is large, if left untreated, which will cause the model to be unusually sensitive to temperature and ignore abnormal voltage fluctuations. Therefore, the steps shown in Figure 6 will be designed for data pre-processing:
  • The 3σ algorithm is used for each column in the data matrix to eliminate rows whose elements are not within three standard deviations of the column mean. This step can remove the more obvious outliers.
  • First calculate the rate of change of the data, for example, the rate of change of x n at the moment t n is equal to | x n ( t n + 1 ) x n ( t n ) | . Then, calculate the mean and standard deviation of the rate of change. Finally, determine whether the rate of change of the data is within three standard deviations of the mean, if it is, determine it as normal data, otherwise remove the row. This step is to remove outliers whose values are within the normal range but have significant differences relative to neighboring points.
  • Using Z-Score standardization unifies the voltage and temperature data on a uniform scale. Because the temperature data is much larger than the voltage data, if used directly for modeling, it would result in a model that is sensitive to temperature anomalies and insensitive to voltage anomalies.

4.2. Fault Detection Framework

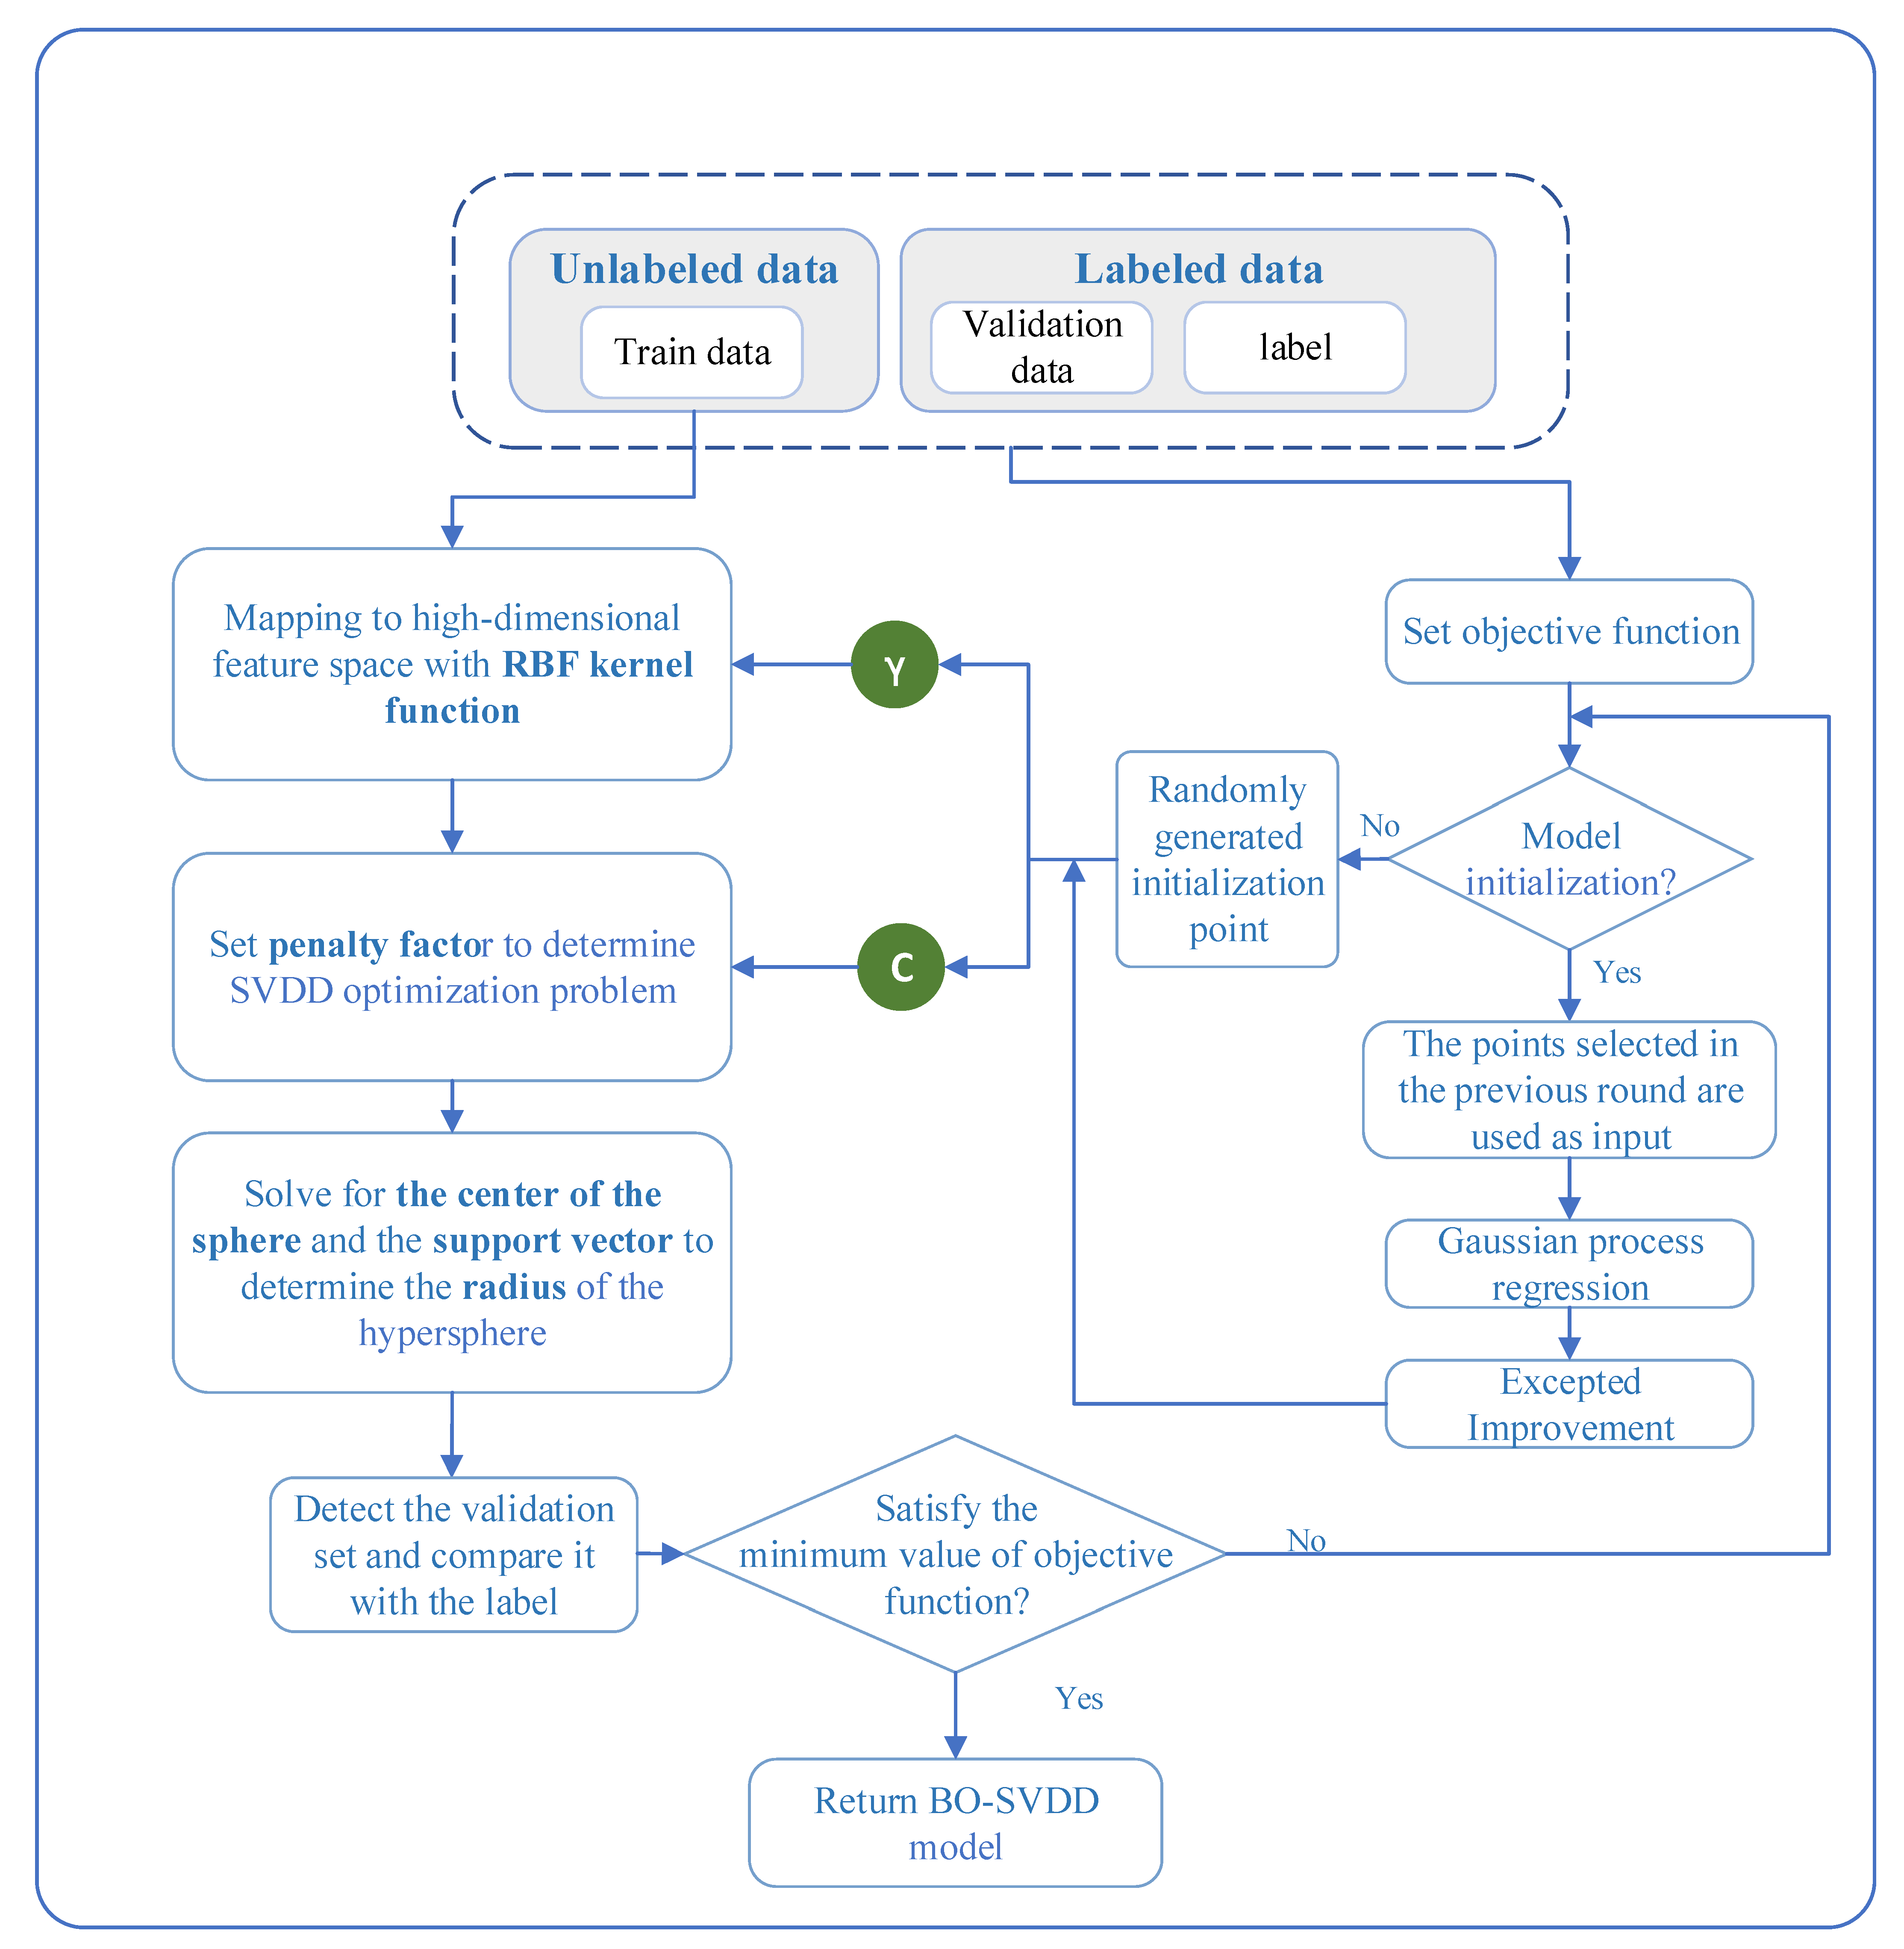
The setting of the penalty factor and Gaussian kernel width determines the detection capability of the SVDD model. The commonly used method is empirically set, however, when the amount of data is large and the number of hyperparameters is multiple, this method not only causes high computational cost but also may lead the model into an overfitting or underfitting state. Therefore, considering the computational cost and model performance, this paper uses a Bayesian optimization approach to obtain the optimal hyperparameters by iteratively training the model using a small number of labeled samples. As shown in Figure 7, the training steps of BO-SVDD are as follows:
  • A training set and a validation set are set up, where the training set consists of a large amount of unlabeled data, and the validation set consists of a small amount of labeled data.
  • The penalty factor C and Gaussian kernel width γ are set as the hyperparameters to be optimized.
  • Random initialization of C and γ is used to train the model, and the detection error rate of the validation set is used as the objective function.
  • Perform Bayesian optimization by minimizing the objective function.
  • The optimized parameters are loaded into the SVDD model and a new round of optimization is executed.

4.3. Application of the Proposed Method to Electric Vehicles

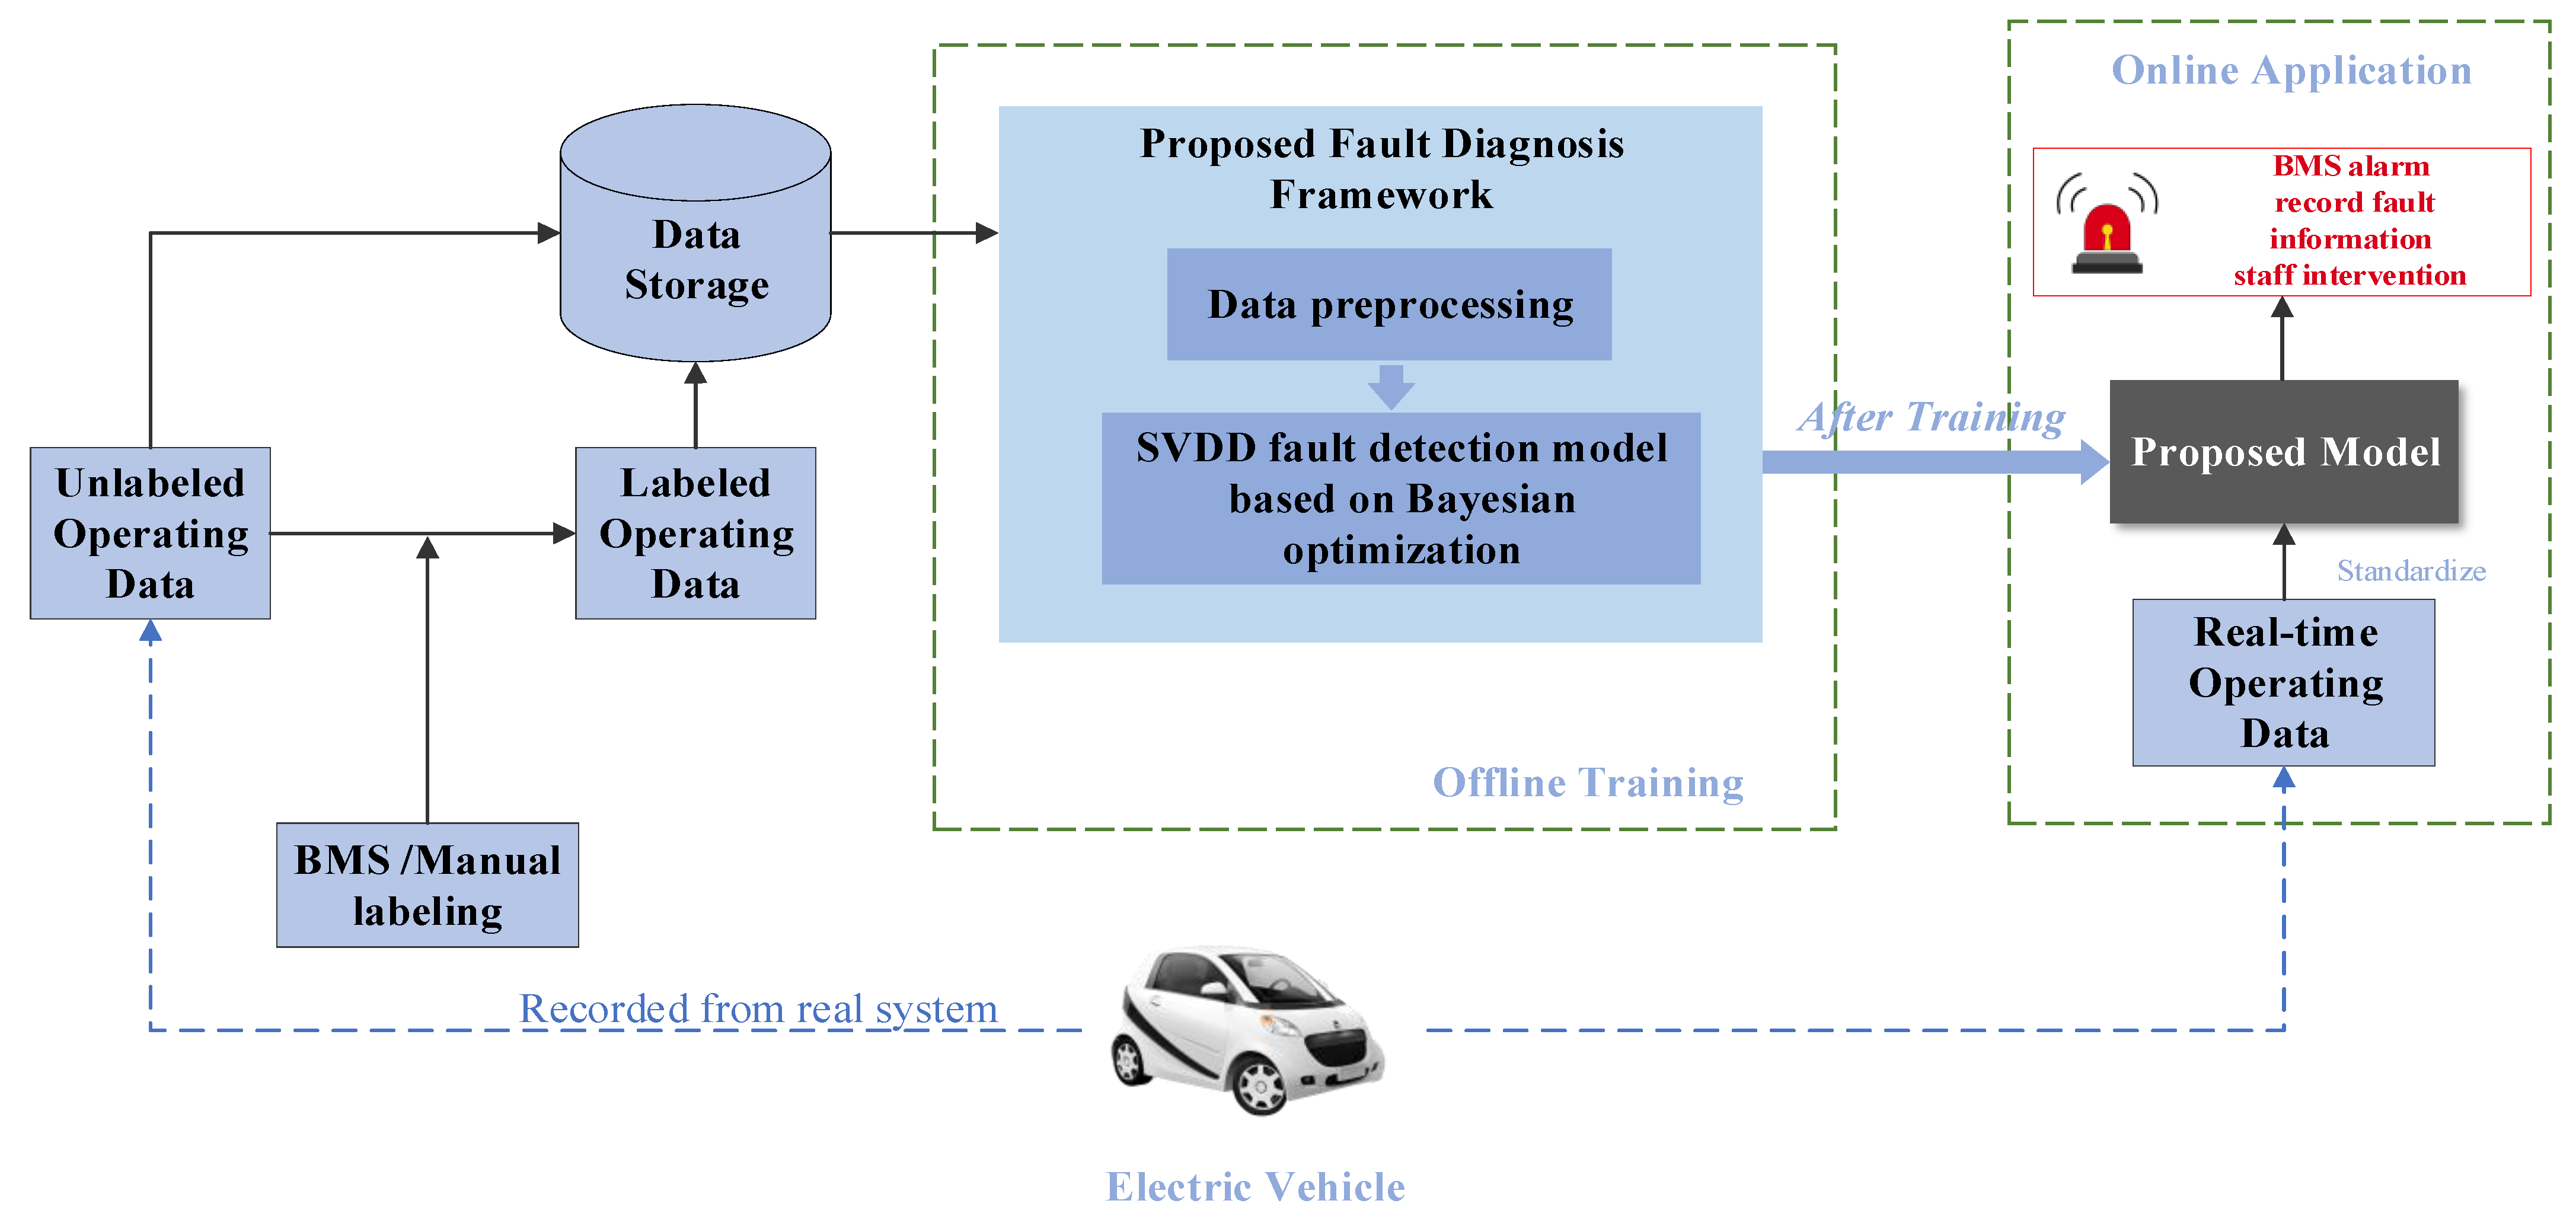
The proposed method is a data-driven approach that does not require knowledge of the battery system, nor does not require consideration of its harsh operating environment. The method identifies normal and fault modes by mining the distribution relationship of historical battery system data, and can be easily deployed into electric vehicles and even new energy storage plants. Figure 8 depicts the application of the method to a real battery system. The implementation steps of this fault detection framework are as follows:
  • A large amount of unlabeled data and a small amount of automatically labeled data from the BMS are collected in the actual operating vehicles. The labeled data can also be obtained from expert annotations so that more accurate detection models can be constructed.
  • The base SVDD model is constructed using unlabeled data, and then the B0-SVDD model is trained using a small amount of labeled data for Bayesian optimization iterations.
  • Based on the above steps, the proposed model is deployed to the BMS for online application. The method can be used in the real-world operation of the vehicle to provide real-time alerts for minor and early faults in the battery system.

5. Experiment

5.1. Building BO-SVDD Fault Detection Model

Before building the model, the training set, validation set, and testing set, need to be determined. The three types of data sets are set as follows:
  • Training set: Containing 3000 unlabeled data that have been preprocessed.
  • Validation set: Consisting of 100 normal data with labels and 100 fault data with labels.
  • Testing set: Consisting of a momentary short circuit fault (msf), cumulative short circuit fault (csf), overcharge fault (ocf), and over-discharge fault (odf) data sets, where the first 50 items of each data set are normal data and the last 150 items are fault data, as shown in Table 1.
It should be noted that short circuits are usually divided into ISC and ESC, but in the practical engineering field, according to the speed of the short circuit, they can also be divided into momentary short circuit faults and cumulative short circuit faults.
After setting up the data set, the BO-SVDD detection model is trained according to the process in Figure 7. In this study, the data preprocessing steps were carried out in Python 3.8.5 and Pandas 1.1.5. The model training and detection were conducted in Matlab 2020b. Figure 9 describes the number of iterations of Bayesian optimization. It can be seen that 50 iterations are set, but the observed target value is equal to the estimated target value at the 13th time and is the smallest in the whole process (negative exclusion). Therefore, Bayesian optimization finds the optimal hyperparameters at the 13th iteration. It can be seen that Bayesian optimization is a faster method to adjust the model to the optimum. Figure 10 shows the optimization process of Bayesian optimization in the three-dimensional hyperparameter space composed of penalty factor and Gaussian kernel width. Finally, the optimal hyperparameter is ρ * = ( γ * , C * ) = ( 0 . 38752 , 0 . 12521 ) .

5.2. Fault Detection Experiment

In this paper, three sets of comparison models are set up, namely, PCA, KPCA, SVDD, and the local outlier factor (LOF). PCA is a classical industrial process fault diagnosis algorithm and has achieved good results in battery fault detection [35]. KPCA is a nonlinear extended version of PCA and has good nonlinear feature mining ability. LOF is an excellent clustering algorithm, and it has also achieved good performance in battery pack fault detection [36]. For a fair experimental validation, all three comparison models are applied to the training set, while BO-SVDD uses 2900 data from the training set and 100 data from the validation set. The same test set was used for fault detection for all five models.
Figure 11I shows the detection results of the four models in msf faults. As can be seen from the four figures, all five models were detected at the beginning of the fault. This kind of fault is often due to problems such as wiring or immersion, resulting in a rapid short circuit of the battery pack and causing a large area of fault response. Therefore, the response amplitude of the fault is large and easy to detect.
Figure 11II displays the results of csf fault detection. Deferent from msf, csf is not easily detected because they are caused by internal micro-shorts and have a high degree of invisibility at the beginning of the fault. Therefore, the csf is the fault that best detects model performance. As shown in Figure 11II(a), BO-SVDD can stably detect the presence of the fault at the 96th sample. Figure 11II(b) shows that SVDD can stably detect the fault at the 111th sample. In contrast, Figure 11II(c,d) shows very weak detection of csf for KPCA and PCA. This is because the SVDD model is built without the Gaussian assumption, while the SPE statistics of PCA and KPCA require the data to obey a Gaussian distribution. In addition, since BO-SVDD utilizes labeled samples for iterative training to obtain hyperparameters with certain prior information, it can provide early warning before faults cause serious consequences. Figure 11II(e) also shows that LOF can consistently detect the fault at the 156th sample point, which is much better than PCA and KPCA methods, but still inferior compared to SVDD and BO-SVDD.
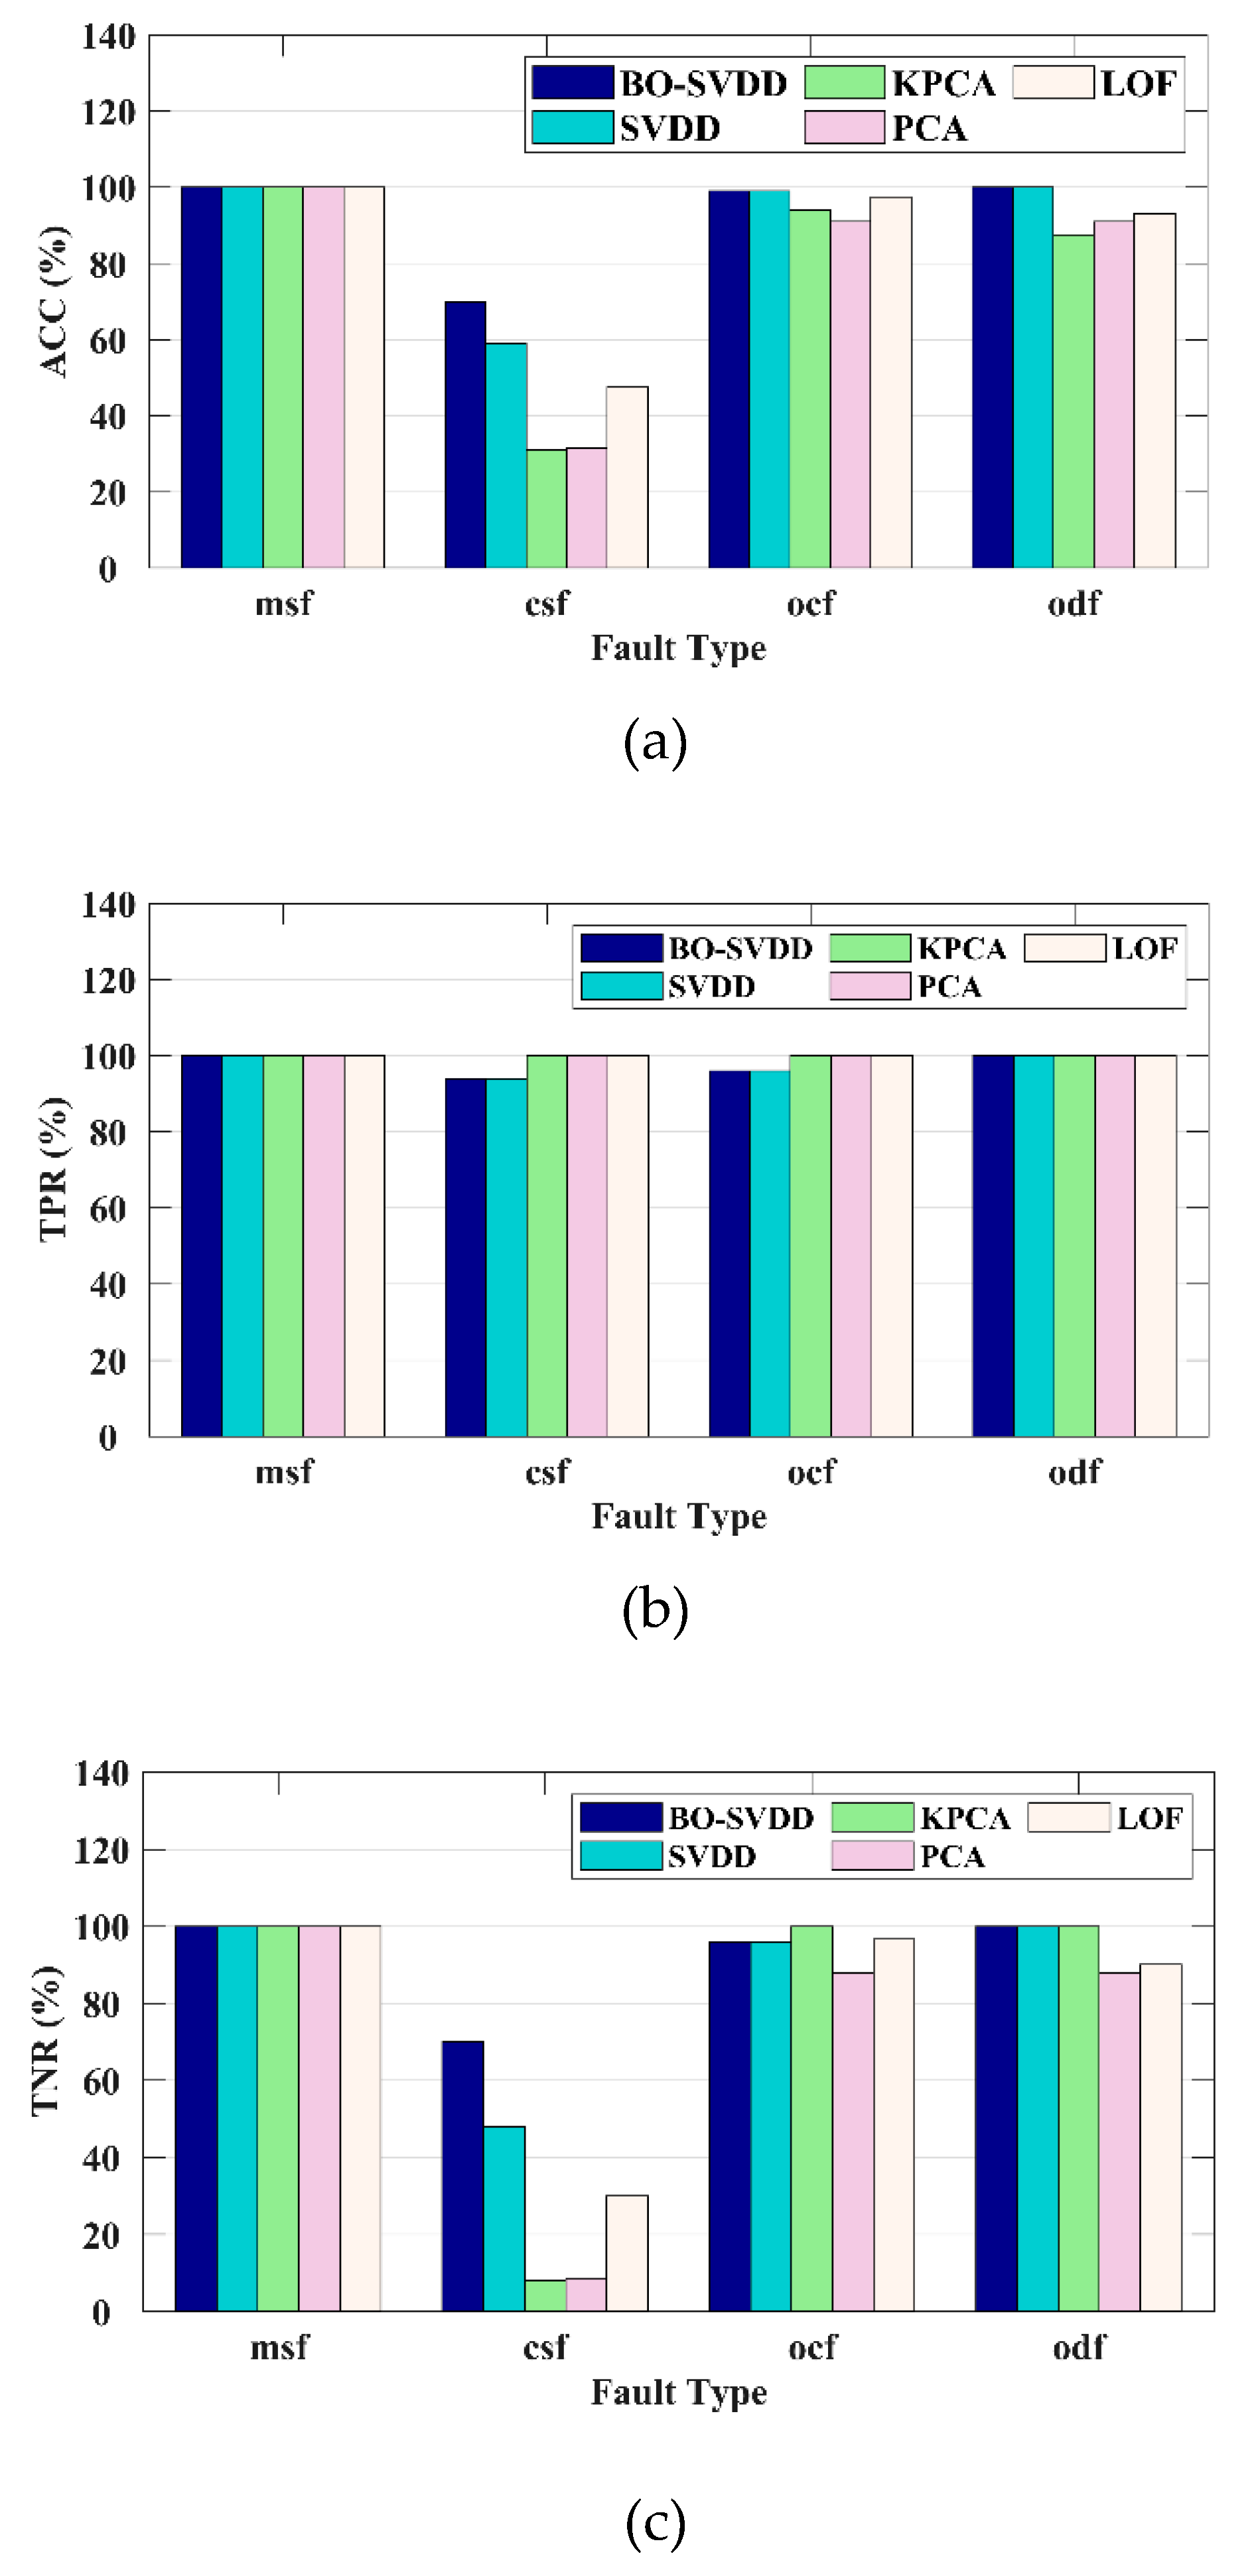
Figure 11III,IV show that all five methods perform well in the detection of ocf and odf faults. This is because these two faults are more obvious in the whole battery system, their fault amplitudes are between msf and csf, and the fault characteristics are easy to capture. The detection draw does not provide an intuitive picture of the overall detection effect. Therefore, statistical histograms of the detection results were plotted in this paper, using three metrics consisting of a confusion matrix (shown in Table 2), namely ACC (Accuracy), TPR (True Positive Rate), and TNR (True Negative Rate).
A C C = T P + T N T P + F N + T N + F P ,
T P R = T P T P + F N ,
T N R = T N T N + F P .
The ACC draw in Figure 12 shows that the accuracy of all five models reached 100% in the msf fault, which is due to the large magnitude of the msf fault and the obvious features are easier to detect. In contrast, in csf faults, the accuracy of BO-SVDD is substantially ahead of the other models, and the accuracy of SVDD is much higher than that of PCA and KPCA. The accuracy of the LOF method also has a leading edge compared to PCA and KPCA. Since PCA and KPCA not only do not obtain suitable hyperparameters in the modeling stage but also their SPE statistics values require the data to obey Gaussian distribution, their performance in csf is far behind that of SVDD and BO-SVDD. In ocf and odf faults, the accuracy of BO-SVDD, SVDD and LOF is also slightly ahead of that of PCA and KPCA. The TPR metric shows the detection ability of the model for normal class samples, and as shown in the TPR draw, the performance of the four models does not differ much from each other, and all of them can have good detection ability for normal class samples. However, the TNR metric, which reflects the fault sample detection ability of the models, greatly distinguishes the four models, and this distinction is mainly displayed in the csf faults. BO-SVDD has an absolute advantage in the fault detection of csf. To sum up, BO-SVDD has great advantages in three indicators of four test sets and can be deployed in BMS as a high-precision fault detection model

5.3. Robustness Experiments

When EVs are running, their battery systems tend to operate in a harsh environment. Crashes and bumps may cause the data collected by the BMS to contain outliers, and such outliers are removed in the data pre-processing stage of the proposed method. However, the strong magnetic environment and the weak noise caused by the BMS measurement error require strong robustness of the model to balance.
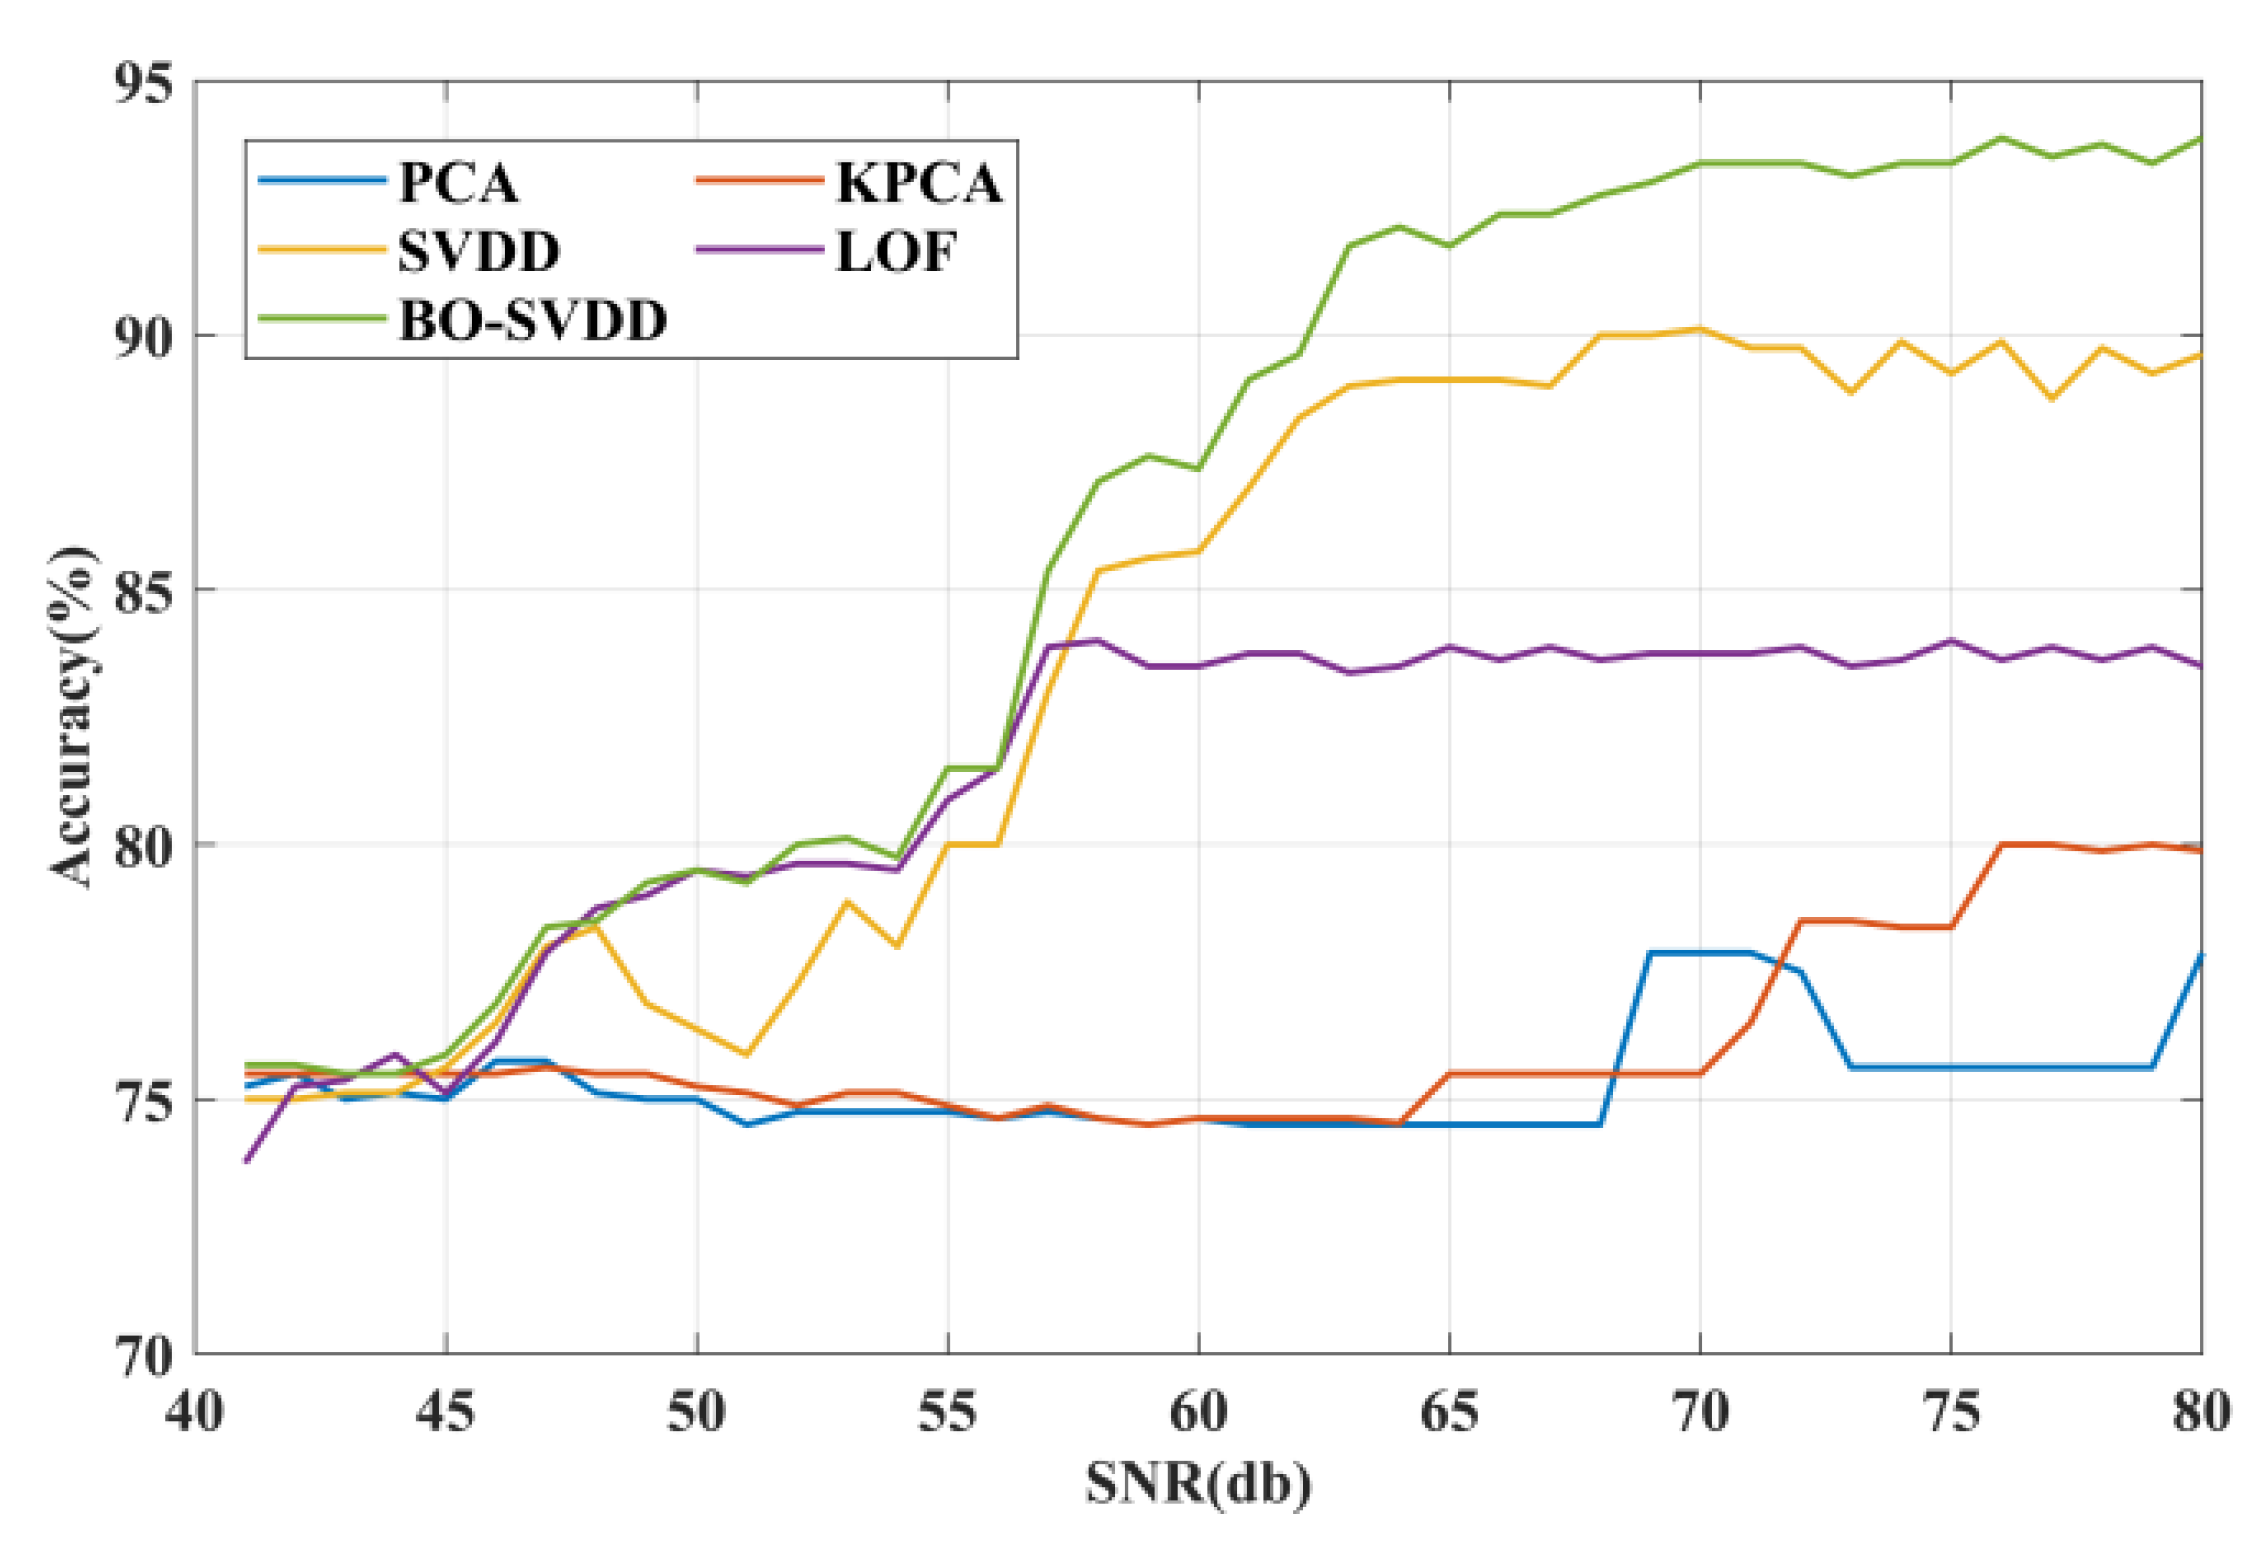
To test the robustness of the model to the limit, this paper first referred to the “Technical Conditions for Battery Management Systems for Electric Vehicles” [37], which specifies that the measurement error of the battery pack voltage should not exceed 0.05% of the full range. In addition, because the number of voltage sensors is much larger than the number of temperature sensors, the temperature change is more stable. Therefore, a noise of 40~80 db is attached to the voltage and temperature data by the standard of voltage measurement error. Then, the four test sets are merged into one data set, and 40 to 80 dB of noise is added to form a noise test set. It is worth noting that the noise test set is originally collected from the real BMS, so it carries the noise itself. In addition, according to the 0.05% measurement error, noise below 60 db is impossible to exist. However, to test the model to the limit, this paper still adds noise of higher intensity to the test set. Finally, the five models are tested separately using the noisy test set, and the strength of robustness is judged by accuracy.
As shown in Figure 13, the accuracy of the five models is similar when the noise is below 45 dB. However, above 45 dB, BO-SVDD, SVDD, and LOF start to significantly outperform PCA and KPCA. In the subsequent tests, BO-SVDD, SVDD, and LOF keep the lead, but SVDD and LOF keep lagging behind BO-SVDD, which is because it is not as effective as BO-SVDD in detecting faults with high concealment.

6. Conclusions

In this paper, a support vector description method based on Bayesian optimization is proposed, which can be used for fault detection of electric vehicle battery systems. The method has excellent detection performance in high-dimensional nonlinear and non-Gaussian distributed data, especially for early and minor faults. The method first builds a base SVDD fault detection model using preprocessed unlabeled data, and then iterates Bayesian optimization on the base model using a small amount of labeled data until the most suitable hyperparameters are iterated. Finally, the hyperparameters are loaded into the model to maximize the fault detection capability. For future work, the fault isolation function of the SVDD model will be further developed, so that the method can have a fast and accurate fault location function while obtaining excellent fault detection capability, and realizing a more intelligent battery system fault diagnosis system.

Author Contributions

Conceptualization, F.C.; methodology, F.C.; software, J.Y.; validation, J.Y. and M.D.; resources, C.H.; data curation, J.Y.; writing—original draft preparation, J.Y.; writing—review and editing, M.L.; visualization, M.L. and M.D.; supervision, F.C. and C.H.; funding acquisition, F.C. All authors have read and agreed to the published version of the manuscript.

Funding

This research was funded by the University Synergy Innovation Program of Anhui Province [GXXT-2020-070], the Synergy Innovation Program of Anhui Polytechnic University and JiuJiang District [2021CYXTA2], Open Research Fund of Anhui Key Laboratory of Detection Technology and Energy Saving Devices [DTESD2020A03, JCKJ2021B06], Open Research Fund of Energy Internet Engineering Research Center of Anhui Provincial Department of Education [2021EIRC03ZD].

Institutional Review Board Statement

Not applicable.

Informed Consent Statement

Not applicable.

Data Availability Statement

Not applicable.

Conflicts of Interest

The authors declare no conflict of interest.

References

  1. Liu, P.; Sun, Z.; Wang, Z.; Zhang, J. Entropy-based voltage fault diagnosis of battery systems for electric vehicles. Energies 2018, 11, 136. [Google Scholar] [CrossRef] [Green Version]
  2. Rallo, H.; Casals, L.C.; De La Torre, D.; Reinhardt, R.; Marchante, C.; Amante, B. Lithium-ion battery 2nd life used as a stationary energy storage system: Ageing and economic analysis in two real cases. J. Clean. Prod. 2020, 272, 122584. [Google Scholar] [CrossRef]
  3. Guo, J.; Jiang, F. A novel electric vehicle thermal management system based on cooling and heating of batteries by refrigerant. Energy Convers. Manag. 2021, 237, 114145. [Google Scholar] [CrossRef]
  4. Zhu, X.; Wang, H.; Wang, X.; Gao, Y.; Allu, S.; Cakmak, E.; Wang, Z. Internal short circuit and failure mechanisms of lithium-ion pouch cells under mechanical indentation abuse conditions: An experimental study. J. Power Sources 2020, 455, 227939. [Google Scholar] [CrossRef]
  5. Liu, Z.; He, H. Sensor fault detection and isolation for a lithium-ion battery pack in electric vehicles using adaptive extended Kalman filter. Appl. Energy 2017, 185, 2033–2044. [Google Scholar] [CrossRef]
  6. Zhang, C.; Jiang, Y.; Jiang, J.; Cheng, G.; Diao, W.; Zhang, W. Study on battery pack consistency evolutions and equilibrium diagnosis for serial-connected lithium-ion batteries. Appl. Energy 2017, 207, 510–519. [Google Scholar] [CrossRef]
  7. Gao, W.; Li, X.; Ma, M.; Fu, Y.; Jiang, J.; Mi, C. Case study of an electric vehicle battery thermal runaway and online internal short-circuit detection. IEEE Trans. Power Electron. 2020, 36, 2452–2455. [Google Scholar] [CrossRef]
  8. Xiong, R.; Sun, W.; Yu, Q.; Sun, F. Research progress, challenges and prospects of fault diagnosis on battery system of electric vehicles. Appl. Energy 2020, 279, 115855. [Google Scholar] [CrossRef]
  9. Hu, X.; Zhang, K.; Liu, K.; Lin, X.; Dey, S.; Onori, S. Advanced fault diagnosis for lithium-ion battery systems: A review of fault mechanisms, fault features, and diagnosis procedures. IEEE Ind. Electron. Mag. 2020, 14, 65–91. [Google Scholar] [CrossRef]
  10. She, C.; Zhang, Z.; Liu, P.; Sun, F. Overview of the application of big data analysis technology in new energy vehicle industry: Based on operating big data of new energy vehicle. J. Mech. Eng. 2019, 55, 3–16. [Google Scholar]
  11. Liu, Z.; Yin, X.; Zhang, Z.; Chen, D.; Chen, W. Online rotor mixed fault diagnosis way based on spectrum analysis of instantaneous power in squirrel cage induction motors. IEEE Trans. Energy Convers. 2004, 19, 485–490. [Google Scholar] [CrossRef]
  12. Wang, Z.; Hong, J.; Liu, P.; Zhang, L. Voltage fault diagnosis and prognosis of battery systems based on entropy and Z-score for electric vehicles. Appl. Energy 2017, 196, 289–302. [Google Scholar] [CrossRef]
  13. Xia, B.; Shang, Y.; Nguyen, T.; Mi, C. A correlation based fault detection method for short circuits in battery packs. J. Power Sources 2017, 337, 1–10. [Google Scholar] [CrossRef] [Green Version]
  14. Cheng, F.; Cai, W.; Zhang, X.; Liao, H.; Cui, C. Fault detection and diagnosis for Air Handling Unit based on multiscale convolutional neural networks. Energy Build. 2021, 236, 110795. [Google Scholar] [CrossRef]
  15. Li, B.; Cheng, F.; Zhang, X.; Cui, C.; Cai, W. A novel semi-supervised data-driven method for chiller fault diagnosis with unlabeled data. Appl. Energy 2021, 285, 116459. [Google Scholar] [CrossRef]
  16. Sun, Z.; Wang, Z.; Liu, P.; Zhang, Z.; Chen, Y.; Qu, C. Overview of fault diagnosis in new energy vehicle power battery system. J. Mech. Eng. 2021, 57, 87–104. [Google Scholar]
  17. Yang, R.; Xiong, R.; Ma, S.; Lin, X. Characterization of external short circuit faults in electric vehicle Li-ion battery packs and prediction using artificial neural networks. Appl. Energy 2020, 260, 114253. [Google Scholar] [CrossRef]
  18. Huo, W.; Li, W.; Zhang, Z.; Sun, C.; Zhou, F.; Gong, G. Performance prediction of proton-exchange membrane fuel cell based on convolutional neural network and random forest feature selection. Energy Convers. Manag. 2021, 243, 114367. [Google Scholar] [CrossRef]
  19. Chen, Z.; Xiong, R.; Lu, J.; Li, X. Temperature rise prediction of lithium-ion battery suffering external short circuit for all-climate electric vehicles application. Appl. Energy 2018, 213, 375–383. [Google Scholar] [CrossRef]
  20. Yang, R.; Xiong, R.; He, H.; Chen, Z. A fractional-order model-based battery external short circuit fault diagnosis approach for all-climate electric vehicles application. J. Clean. Prod. 2018, 187, 950–959. [Google Scholar] [CrossRef]
  21. Liu, P.; Wang, J.; Wang, Z.; Zhang, Z.; Wang, S.; Dorrell, D.G. High-dimensional data abnormity detection based on improved Variance-of-Angle (VOA) algorithm for electric vehicles battery. In Proceedings of the 2019 IEEE Energy Conversion Congress and Exposition (ECCE), Baltimore, MD, USA, 29 September–3 October 2019; IEEE: Piscataway, NJ, USA, 2019; pp. 5072–5077. [Google Scholar]
  22. Kim, T.; Makwana, D.; Adhikaree, A.; Vagdoda, J.S.; Lee, Y. Cloud-based battery condition monitoring and fault diagnosis platform for large-scale lithium-ion battery energy storage systems. Energies 2018, 11, 125. [Google Scholar] [CrossRef] [Green Version]
  23. Zhao, Y.; Liu, P.; Wang, Z.; Zhang, L.; Hong, J. Fault and defect diagnosis of battery for electric vehicles based on big data analysis methods. Appl. Energy 2017, 207, 354–362. [Google Scholar] [CrossRef]
  24. Chen, Z.; Xiong, R.; Sun, F. Research status and analysis for battery safety accidents in electric vehicles. J. Mech. Eng. 2019, 55, 93–104. [Google Scholar]
  25. Ren, D.; Feng, X.; Lu, L.; He, X.; Ouyang, M. Overcharge behaviors and failure mechanism of lithium-ion batteries under different test conditions. Appl. Energy 2019, 250, 323–332. [Google Scholar] [CrossRef]
  26. Tagade, P.; Hariharan, K.S.; Ramachandran, S.; Khandelwal, A.; Naha, A.; Kolake, S.M.; Han, S.H. Deep Gaussian process regression for lithium-ion battery health prognosis and degradation mode diagnosis. J. Power Sources 2020, 445, 227281. [Google Scholar] [CrossRef]
  27. Tax, D.M.; Duin, R.P. Support vector domain description. Pattern Recognit. Lett. 1999, 20, 1191–1199. [Google Scholar] [CrossRef]
  28. Seo, J.; Ko, H. Face detection using support vector domain description in color images. In Proceedings of the 2004 IEEE International Conference on Acoustics, Speech, and Signal Processing, Montreal, QC, Canada, 17–21 May 2004; IEEE: Piscataway, NJ, USA, 2004; p. V-729. [Google Scholar]
  29. Lai, C.; Tax, D.M.; Duin, R.P.; Pękalska, E.; Paclík, P. A study on combining image representations for image classification and retrieval. Int. J. Pattern Recognit. Artif. Intell. 2004, 18, 867–890. [Google Scholar] [CrossRef] [Green Version]
  30. Zhao, Y.; Wang, S.; Xiao, F. Pattern recognition-based chillers fault detection method using support vector data description (SVDD). Appl. Energy 2013, 112, 1041–1048. [Google Scholar] [CrossRef]
  31. Bergstra, J.; Bardenet, R.; Bengio, Y.; Kégl, B. Algorithms for hyper-parameter optimization. Adv. Neural Inf. Process. Syst. 2011, 24, 2546–2554. [Google Scholar]
  32. Snoek, J.; Larochelle, H.; Adams, R.P. Practical bayesian optimization of machine learning algorithms. Adv. Neural Inf. Process. Syst. 2012, 25, 2960–2968. [Google Scholar]
  33. Seeger, M. Gaussian processes for machine learning. Int. J. Neural Syst. 2004, 14, 69–106. [Google Scholar] [CrossRef] [PubMed] [Green Version]
  34. Robert, C. Machine Learning, a Probabilistic Perspective; Taylor & Francis: Oxfordshire, UK, 2014. [Google Scholar]
  35. Schmid, M.; Kneidinger, H.-G.; Endisch, C. Data-driven fault diagnosis in battery systems through cross-cell monitoring. IEEE Sens. J. 2020, 21, 1829–1837. [Google Scholar] [CrossRef]
  36. Qiu, Y.; Dong, T.; Lin, D.; Zhao, B.; Cao, W.; Jiang, F. Fault diagnosis for lithium-ion battery energy storage systems based on local outlier factor. J. Energy Storage 2022, 55, 105470. [Google Scholar] [CrossRef]
  37. Zhang, W.; Wang, F.; Huang, Y.; Lu, C.; Peng, W.; Fan, J.; Zhang, Y.; Ma, F.; Duan, Y.; Bao, W.; et al. Technical Conditions for Battery Management Systems for Electric Vehicles; China National Standardization Administration Committee: Beijing, China, 2020; Volume GB/T 38661-2020, p. 44. [Google Scholar]
Figure 1. Logical relationship diagram of supervised and unsupervised methods.
Energies 15 08331 g001
Figure 2. Application of lithium batteries on different scales.
Energies 15 08331 g002
Figure 3. Q−Q diagram of voltage data.
Energies 15 08331 g003
Figure 4. Q−Q diagram of temperature data.
Energies 15 08331 g004
Figure 5. Schematic diagram of SVDD for fault detection in two dimensions.
Energies 15 08331 g005
Figure 6. Data pre-processing process.
Energies 15 08331 g006
Figure 7. Fault detection model framework.
Energies 15 08331 g007
Figure 8. Application of the proposed model in a real electric vehicle.
Energies 15 08331 g008
Figure 9. Number of Bayesian optimization.
Energies 15 08331 g009
Figure 10. Bayesian optimization process.
Energies 15 08331 g010
Figure 11. (I) The msf fault detection results of four models: (a) BO-SVDD detection results; (b) SVDD detection results; (c) KPCA detection results; (d) PCA detection results; and (e) LOF detection results. (II) The csf fault detection results of four models: (a) BO-SVDD detection results; (b) SVDD detection results; (c) KPCA detection results; (d) PCA detection results; and (e) LOF detection results. (III) The ocf fault detection results of four models: (a) BO-SVDD detection results; (b) SVDD detection results; (c) KPCA detection results; (d) PCA detection results; and (e) LOF detection results. (IV) The odf fault detection results of four models: (a) BO-SVDD detection results; (b) SVDD detection results; (c) KPCA detection results; (d) PCA detection results; and (e) LOF detection results.
Energies 15 08331 g011aEnergies 15 08331 g011b
Figure 12. BO-SVDD, SVDD, KPCA, PCA, test results for three evaluation metrics in four test sets (csf, msf, ocf, odf): (a) ACC metric; (b) TPR metric; and (c) TNR metric.
Energies 15 08331 g012
Figure 13. BO-SVDD, SVDD, KPCA, and PCA accuracy test results for the noise test set.
Energies 15 08331 g013
Table 1. The four types of fault process data are composed of 50 normal data and 150 fault data.
Expert Labeled DataNormal Process Datamsfcsfocfodf
80050 + 50 + 50 + 50150150150150
Table 2. Confusion matrix for classification results.
Real ClassificationOutput Result
Normal ClassificationAbnormal Classification
NormalTrue Positive (TP)False Negative (FN)
AbnormalFalse Positive (FP)True Negative (TN)
Publisher’s Note: MDPI stays neutral with regard to jurisdictional claims in published maps and institutional affiliations.