Article

OpΕnergy: An Intelligent System for Monitoring EU Energy Strategy Using EU Open Data

by
Kleanthis Koupidis
1,
Charalampos Bratsas
1,2 and
Christos Vlachokostas
3,*
1
Open Knowledge Foundation Greece, 54352 Thessaloniki, Greece
2
Department of Information and Electronic Engineering, International Hellenic University, Alexander Campus, 57400 Thessaloniki, Greece
3
Faculty of Engineering, School of Mechanical Engineering, Sustainability Engineering Laboratory, Aristotle University Thessaloniki, Box 483, Aristotle University, 54124 Thessaloniki, Greece
*
Author to whom correspondence should be addressed.
Energies 2022, 15(21), 8294; https://doi.org/10.3390/en15218294
Submission received: 14 October 2022 / Revised: 2 November 2022 / Accepted: 3 November 2022 / Published: 6 November 2022

Abstract

:
In this paper, the basic structure of an ICT platform of energy indicators, Openergy, is analytically presented, leveraging energy open data to help address the energy crisis more democratically. More specifically, its applicability as a dynamic tool for the management of climate, environmental, and socioeconomic information is described, and its efficiency in helping uncover insights for optimal data-driven decisions is depicted. Openergy uses data from the official portal for European data and the Eurostat site. Its database consists of data related to six energy categories, EU 2020 energy targets, energy balance, electricity production, transport fuels, heat production, and gas emissions, and each one includes its own indicators for EU countries. The platform includes visualizations of these data as well as time series modeling and forecasting, and the results are depicted at Openergy platform. The time series modeling provides forecasts with confidence intervals of each indicator until 2020 in each energy category. Empirical validation, RMSE, and MAE values showed that in almost all cases and estimations, the predicted values are in very good agreement with the observed values.

1. Introduction

Stable, adequate, and secure energy is vital for the sustainable development of humanity. Sustainability presupposes economic development by ensuring climate change mitigation and adaptation, environmental protection, and social cohesion, e.g., [1]. Towards this direction, energy resources that are strongly related to economic development need to be sustainably managed. The 7th Sustainable Development Goal (SDG) of the 2030 Agenda for Sustainable Development supports ensuring access to modern, sustainable, reliable, and affordable energy for all [2]. The EU demonstrates global leadership by considering energy strategies and initiatives, especially under the threat of climate change. The important pillars of EU’s energy policy are briefly (i) decarbonize towards a low-carbon economy, (ii) promote clean energy technologies, (iii) improve energy efficiency, (iv) cut emissions, (v) reduce dependence on energy import, (vi) ensure the functioning of a fully integrated internal energy market, and (vii) diversify Europe’s sources of energy. All these pillars need motives, objectives, and priorities in order to succeed in a “metamorphosis” of the energy sector.
It goes without saying that energy consumption and the corresponding pressures on the environment and climate are accompanied by many unsustainable practices that humanity adopted in the past, which are still present in the energy system, e.g., [3,4,5]. Promoting and realistically developing strategies and policies that aim to achieve an integrated energy market, security of energy supply, and a sustainable energy sector is crucial and embedded in the core of the EU’s energy policy [6]. Themes such as distributed generation energy systems and energy communities are acquiring an increasingly important role, both in scientific literature and in the construction of scenarios and policies [7]. In addition, the transformation of the EU’s energy sector should include ambitious national and EU measures and alternatives for minimizing the consumption of fossil fuel related to industrial, transport, agricultural, commercial services, tourism, and other economic sectors. Penetration of renewables (hydro, solar, wind, tide), natural gas as a transition energy option, circular economy, industrial symbiosis, and Waste-to-Bioenergy [8], the cogeneration of heat and power, are included in the set of proposals in the European Green Deal [9].
Structural transformations in the energy sector require reliable information related to all the aforementioned initiatives both at the EU and national levels. The use of Information and Communication Technology (ICT) science constitutes an important tool for assessing the progress achieved toward the transformation of the EUs’ energy system and, in general, sustainable development. Measuring and reliably predicting energy indicators such as energy consumption demand, sectoral analysis of energy demand, penetration of alternative energy sources (e.g., biofuels or renewables), energy efficiency (e.g., heating and cooling efficiency), energy intensity, or eco-efficiency of the energy sector is a major challenge for energy managers and decision-makers in the EU.
Open data principles have become an important part of the data revolution and have been identified worldwide as a key engine for achieving the 17 UN Sustainable Development Goals (SDGs) [10].
Open data in the Open Definition published by the Open Knowledge Foundation is defined as: “Open data is data that can be freely used, re-used and redistributed by anyone—subject only, at most, to the requirement to attribute and share alike.” Additionally, it must be available under an open license and provided in a modifiable form that is machine-readable [11,12].
Open data result in open government, where government acts as an open system and interacts with its environment. The data should not only be published but also actively sought to learn how governance can be improved [13].
Additionally, open data support public oversight of governments and help reduce corruption by enabling greater transparency in various fields, such as health, education, climate, energy, intelligent transport systems, and smart cities. Open data give the opportunity to monitor government activities, such as tracking public budget expenditures or policy targets and impacts [14,15].
Within the European Union, more and more countries are developing policies to release their data as Open Government Data. There are open data platforms that provide access to open data from international, EU, national, regional, local, and geo data portals, such as the official European Data Portal: https://data.europa.eu/en (accessed on 22 August 2022) or the official national data portals, such as for Greece: https://www.data.gov.gr (accessed on 22 August 2022).
There are also monitoring tools that help citizens track different aspects of openness; for example, there are tools that assess the state of open data around the world, such as the Open Data Index: http://global.survey.okfn.org (accessed on 22 August 2022), the Open Data Barometer: https://opendatabarometer.org/ (accessed on 22 August 2022) and the Open Data Monitor: https://opendatamonitor.eu (accessed on 22 August 2022).
Moreover, there are tools such as Open Budgets [16,17,18], which help citizens and other stakeholders obtain an overview of public spending, or the Red Flags platform [19], which identifies red flags during the implementation process for projects of the National Strategic Reference Framework.
Additionally, in [20], some papers related to open data and energy analytics are commented on. Specifically, [21] addresses the barriers to energy data acquisition as there is a lack of open data in the energy sector. In [22,23], there is described the need for energy mapping tools to support urban planners, energy agencies, and public administrations in planning the heating and cooling supply at different scales. The first describes an approach to collect and analyze market data related to space heating and domestic hot water systems and their performance in Europe, and the latter compares country-level and municipal-level building stock data for gross floor area and energy demand for space heating and domestic hot water. In [24], the potential of data in supporting energy analyses is also shown. They focus on the use of different energy-consuming activities from social media to understand and improve the energy consumption behavior of individuals. In [25], the authors present an application to industrial energy efficiency where they apply a clustering modeling approach for the short-term forecasting of energy demand in industrial facilities.
However, openness in energy research lags behind other fields, according to [26], where there is a list of projects that tried to make data and models more transparent. They conclude that openness in energy research, sharing code and data, is the initial step to conducting research and monitoring and engaging decision-makers with models and the assumptions embedded within them.
OpEnergy is an application developed by Open Knowledge Foundation Greece (https://okfn.gr/ (accessed on 22 August 2022)) in the context of the first ‘EU Datathon’ that took place in Brussels in November 2017 to monitor and promote the re-use of energy data from the EU Open Data Portal. It was organized by the Publications Office of the European Union together with the Estonian Presidency of the Council of the European Union, and the main challenges were to create innovative applications for citizens to address specific societal issues in line with three key priorities for the European Union: jobs, growth and investment; the digital single market; and democratic change.
This work aims to (i) present the basic structure and components of an innovative methodology to develop an ICT platform of energy indicators, (ii) depict its applicability and utilization as a dynamic tool for the management of climate, environmental, social, and economic information, and (iii) depict its efficiency in order to predict important aspects towards the transformation of the EU energy sector. In this context, the rationale behind the platform’s development is presented, and some indicative results for the EU are briefly discussed.
Tackling climate change and energy crisis best practices requires sharing knowledge across geographic and economic boundaries, which is why we believe energy open data is essential. The information should be available in such a form that it facilitates decision-making by decision-makers and is also understandable by citizens.
Openergy is an application that achieves two innovative goals:
  • A good practice of open data use in the energy sector;
  • Analysis and forecast of open energy data in order to help citizens and governments track their progress in achieving their EU energy targets.

2. Materials and Methods

2.1. Data

In this study, data from two EU portals were used. The first one is the official portal that provides access to open data from international, EU, national, regional, local, and geo data portals which is accessible at https://data.europa.eu/en (accessed on 22 August 2022). From this portal, the data that were used were data related to the energy balance, EU 2020 energy target, country energy profiles, energy production, transport fuels, heat production, and gas emissions.
The second one is the portal of Eurostat (https://ec.europa.eu/eurostat) (accessed on 22 August 2022), the official statistical office of the European Union, from which the data used were data about the targets of each country, e.g., for primary or final energy consumption or for greenhouse gas emissions. All data were transformed into the JSON format to be used in our architecture, as described below.

2.2. System Architecture

The Openergy architecture shown in Figure 1 consists of five modules, the database that stored data from the two EU portals described above, a REST API, an OpenCPU API, the R libraries for time series modeling and forecasting, and the website http://openergy.okfn.gr (accessed on 26 August 2022) that visualizes the results.
The database consists of data related to six main energy categories distributed on six pages at the Openergy tool, EU 2020 energy targets, energy balance, electricity production, transport fuels, heat production, and gas emissions. Each includes its own indicators for EU and EU countries.
The REST API was developed in Laravel and was used for HTTP requests to manage the data from the database, enabling the exchange of data between two applications. This API allows access to data and interacts with the OpenCPU server, which communicates with the R libraries responsible for time series modeling and predictions (Figure 2).
Access to the six main energy categories data is provided by the REST API. For example, when the user selects the energy balance page, he will access indicators represented graphically with maps, bar or pie charts, time series/line charts that describe the production, imports, exports, energy branch consumption, and final energy consumption by fuel or sector for each EU country. There are also market indicators about natural gas, such as entities bringing gas into a selected country, the main entities of cumulative market share, the largest retailer of market share, etc., and electricity, such as producers, main producers, main retailers, etc.
The country profiles page includes 27 indicators with their corresponding time series charts and their predicted values until 2020. These indicators are related to natural gas, renewables, electricity, energy consumption, transformation/distribution losses, and combined heat and power that form the general energy profile of a selected country.
Forecasts performed for each indicator in every energy category delivered by Rest API as a product of communication by OpenCPU with the R libraries. These forecasts include the predicted values with confidence intervals of the selected indicator until 2020.

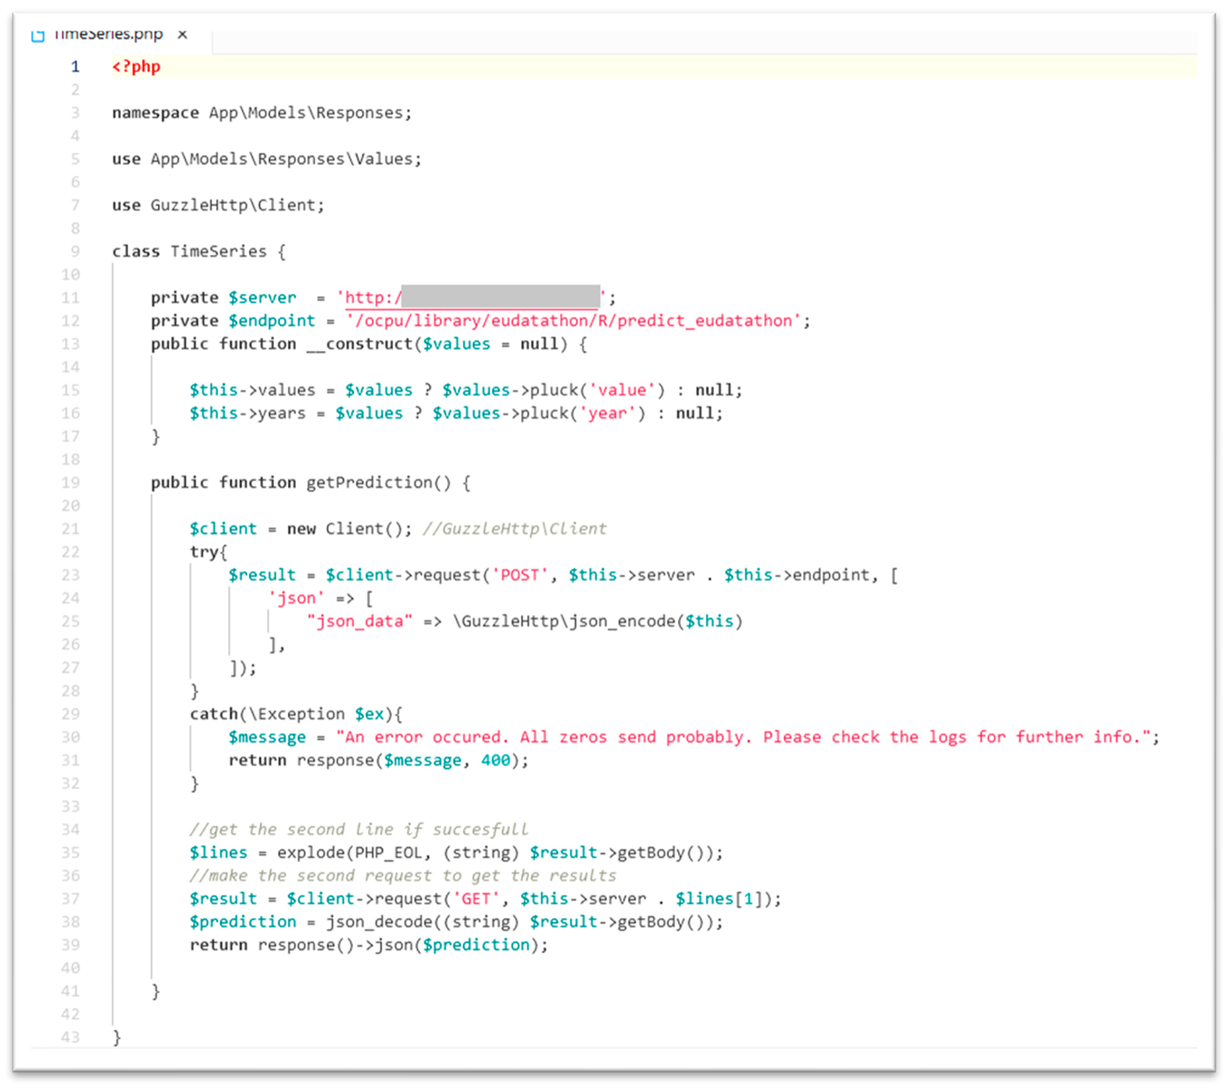
2.3. Time Series Modeling and Forecasting

Forecasts of the Openergy tool are implemented through the OpEnergyAnalytics package [27], and they are not published by the European Commission. The OpEnergyAnalytics package is mostly based on TimeSeries.OBeu package [28] for modeling and predicting time series data, which was developed in the context of the Open Budgets project (http://openbudgets.eu/) (accessed on 26 August 2022) funded from the European Union’s H2020 EU research and innovation program.
In this package, first, stationary testing is performed through statistical hypothesis tests of stationarity that are designed for determining whether differencing is required, such as Augmented Dickey-Fuller (ADF) and Kwiatkowski-Phillips-Schmidt-Shin (KPSS) tests. Stationarity is an important concept of time series analysis which practically means that the statistical properties of a time series do not change over time.
Autoregressive integrated moving average (ARIMA) models are appropriate to forecast time series data [29,30,31] and, according to [32,33,34], outperform some other methods. ARIMA model is a statistical model used for forecasting time series data based on historical data.
An ARIMA model consists of three components. The Autoregression (AR) component refers to the model that shows that the time series is regressed with its previous values, which order is denoted as p. The Integration (I) component refers to the order of differencing d of the time series raw data to become stationary. The Moving Average (MA) component indicates that the time series is regressed with the residuals of the past observations, in which order is denoted as q. If non-stationary data occur, the next step is to differencing the time series to conclude in stationary data. The equation of an ARIMA model for the predicted value of y in period t has the following form:
yt = θ0 + φ1·yt−1 + φ2·yt−2 + … + φp−yt−p + εt−θ1·εt−1−θ2·εt−2− … −θq·εt−q,
where yt and εt are the actual value and random error at time period t, respectively; φi (i = 1, 2, …, p) and θj (j = 1, 2, ..., q) are AR and MA model parameters respectively. p and q are integers and are often referred to as orders of the model. Box and Jenkins established that the MA parameters should be written with a negative sign rather than a positive sign. The general form of an ARIMA model is denoted as ARIMA (p, d, q) [35,36].

3. Results and Discussion

3.1. OpEnergy Presentation

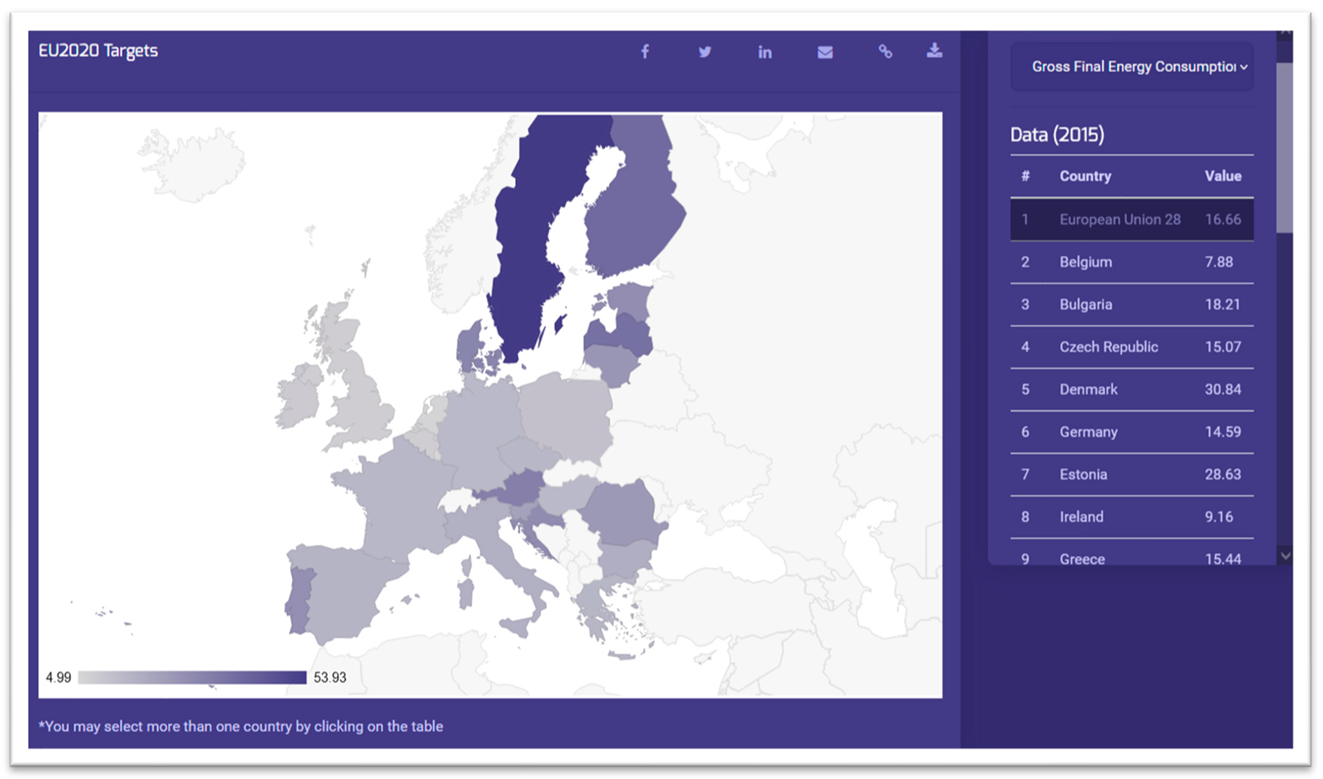
3.1.1. EU 2020 Energy Targets

On the OpEnergy tool, the monitoring process involves six energy categories: EU 2020 Energy Targets (https://www.eea.europa.eu/highlights/eu-achieves-20-20-20 (accessed on 10 October 2022)); Energy Balance (https://ec.europa.eu/eurostat/statistics-explained/index.php?title=Energy_balance_-_new_methodology (accessed on 10 October 2022)); Electricity Production (https://ec.europa.eu/eurostat/statistics-explained/index.php?title=Electricity_and_heat_statistics (accessed on 10 October 2022)); Transport Fuels (https://ec.europa.eu/eurostat/statistics-explained/index.php?title=Transport_statistics_introduced (accessed on 10 October 2022)); Heat Production and Gas Emissions (https://ec.europa.eu/eurostat/statistics-explained/index.php?title=Greenhouse_gas_emission_statistics_-_air_emissions_accounts (accessed on 10 October 2022)), along with the Country Profiles of the EU countries.
The starting page is the EU 2020 Energy Targets page, where there is information related to the targets of EU countries and the EU as a whole entity. Specifically, there are seven energy indicators, Gross Final Energy Consumption (https://ec.europa.eu/eurostat/web/products-datasets/-/t2020_rd330 (accessed on 10 October 2022)), Gross Electricity Consumption, Heating and Cooling, Transport, Final Energy Consumption (https://ec.europa.eu/eurostat/web/products-datasets/-/sdg_07_11 (accessed on 10 October 2022)), Greenhouse Gas Emissions (https://data.europa.eu/data/datasets/dat-170-en?locale=en (accessed on 10 October 2022)), and Primary Energy Consumption (https://ec.europa.eu/eurostat/web/products-datasets/-/sdg_07_10 (accessed on 10 October 2022)) that are visualized on an EU heat map, a bar chart, and a line chart. Additionally, there is a sidebar that includes the EU countries. In this way, there is the capability of performing comparisons among EU countries by selecting at least two countries to visualize. In case of multiple countries selection, the bar chart and the line chart will be adapted to the user selection.
The heat map shows the magnitude of the selected indicator for a selected country on the EU map as color and can be used for comparisons when the EU is selected from the sidebar (Figure 3).
The bar chart shows the value in 2015, the predicted value, and the target of the selected indicator for a selected EU country (Figure 4).
The line chart is a time series chart of a selected indicator for one or more EU countries. In this chart, there is the capability to show the predictions along with the confidence intervals until 2020 (Figure 5).
At the bottom of this page, there is a semi-automated constructed report, where the user can access some key points of the charts and a summary of whether a country or EU as a whole is expected to achieve its 2020 target according to the desired energy indicator (Figure 6).

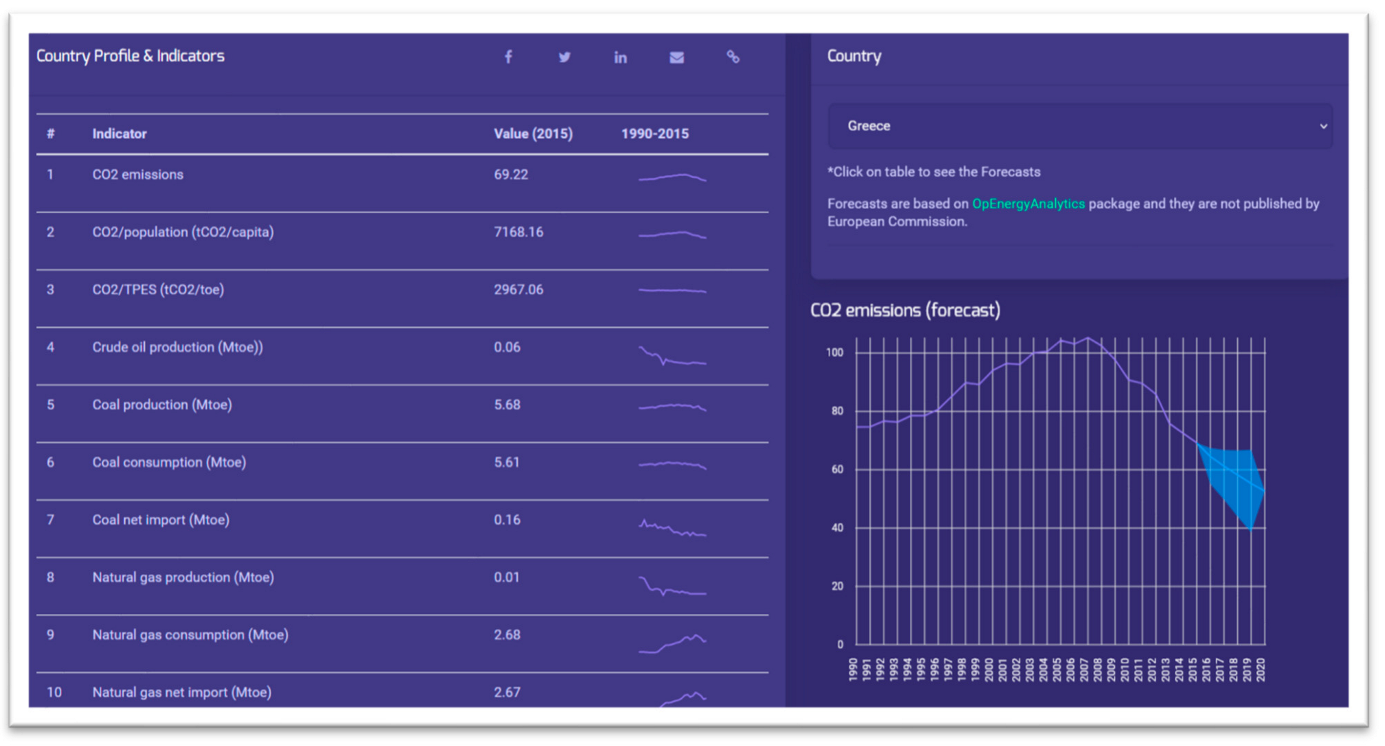
3.1.2. Country Profiles

The Country Profiles page consists of 27 indicators that altogether formulate the energy profile of an EU country. These indicators are related to natural gas, renewables, electricity, energy consumption, transformation/distribution losses, and combined heat and power that form the general energy profile of a selected country. On this page, there is a dynamic table with the indicators, their 2015 value, and the sparkline from 1990 to 2015. The sparkline shows trends for the 1990-2015 period, such as increases or decreases and maximum and minimum values of a selected indicator. By clicking on a row, a time series plot is shown with the forecast with the corresponding confidence intervals of the selected indicator until 2020. (Figure 7).

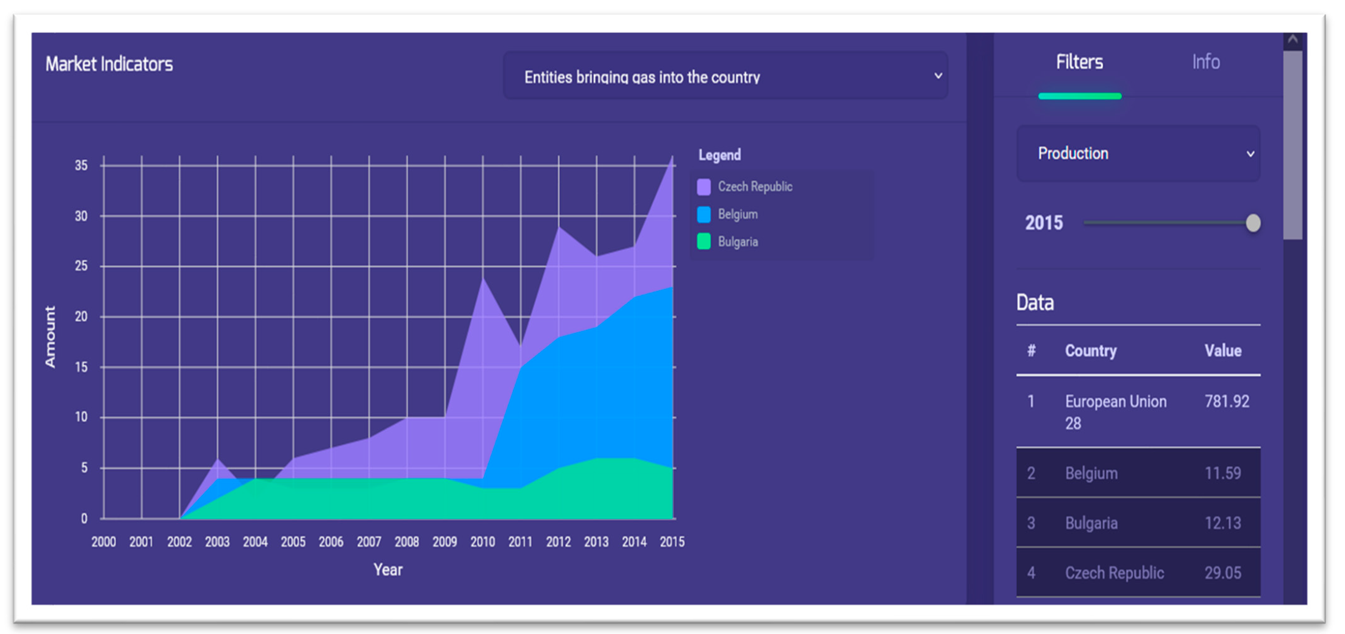
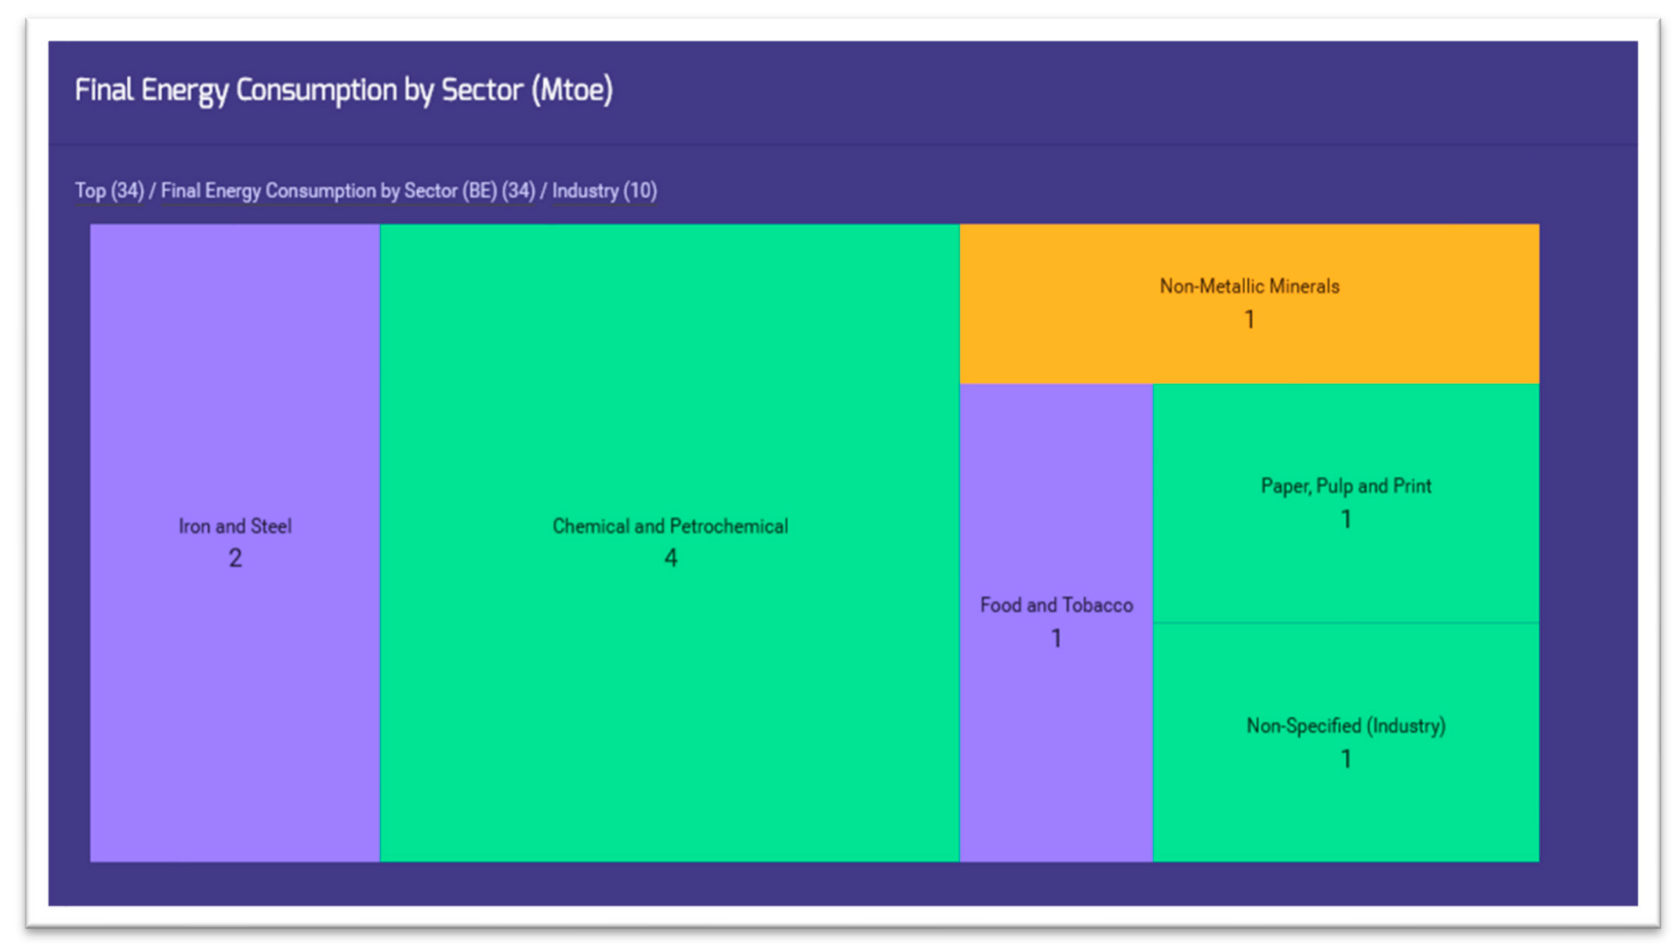
3.1.3. Energy Balance, Electricity Production, Transport Fuels, Heat Production, and Gas Emissions

The Energy Balance page allows us to see the importance of the various fuels and their contribution to the economy. Specifically, the user can select information related to the production, imports, exports, energy branch consumption, the final energy consumption by fuel/product and by sector, which are visualized on an EU heat map, bar chart or pie chart, an area chart and a tree map chart using a slide bar to select a year. The heat map is similar to the EU Energy Targets page, with the difference that there are different indicators in this category. The bar chart, which can be transformed into a pie chart, shows the percentages of subcategories of an indicator which is represented as the total (Figure 8).
The area chart shows some market indicators related to natural gas and electricity. This chart shows how a market indicator of one or more EU countries changes over time (Figure 9).
Similar to the EU Energy Targets page, there is a time series chart of a selected country for a selected indicator with the forecasts of the indicator’s values along with its confidence intervals.
The treemap is used to display data that is nested in a hierarchical structure and can capture relative sizes of indicator subcategories, showing factors that are large contributors to each category. Color can identify factors that are under- or over-performing compared to other factors from the same category (Figure 10).
The functionality of the Electricity Production, Transport Fuels, Heat Production, and Gas Emissions pages are similar to the Energy Balance, excluding the chart of the market indicator.

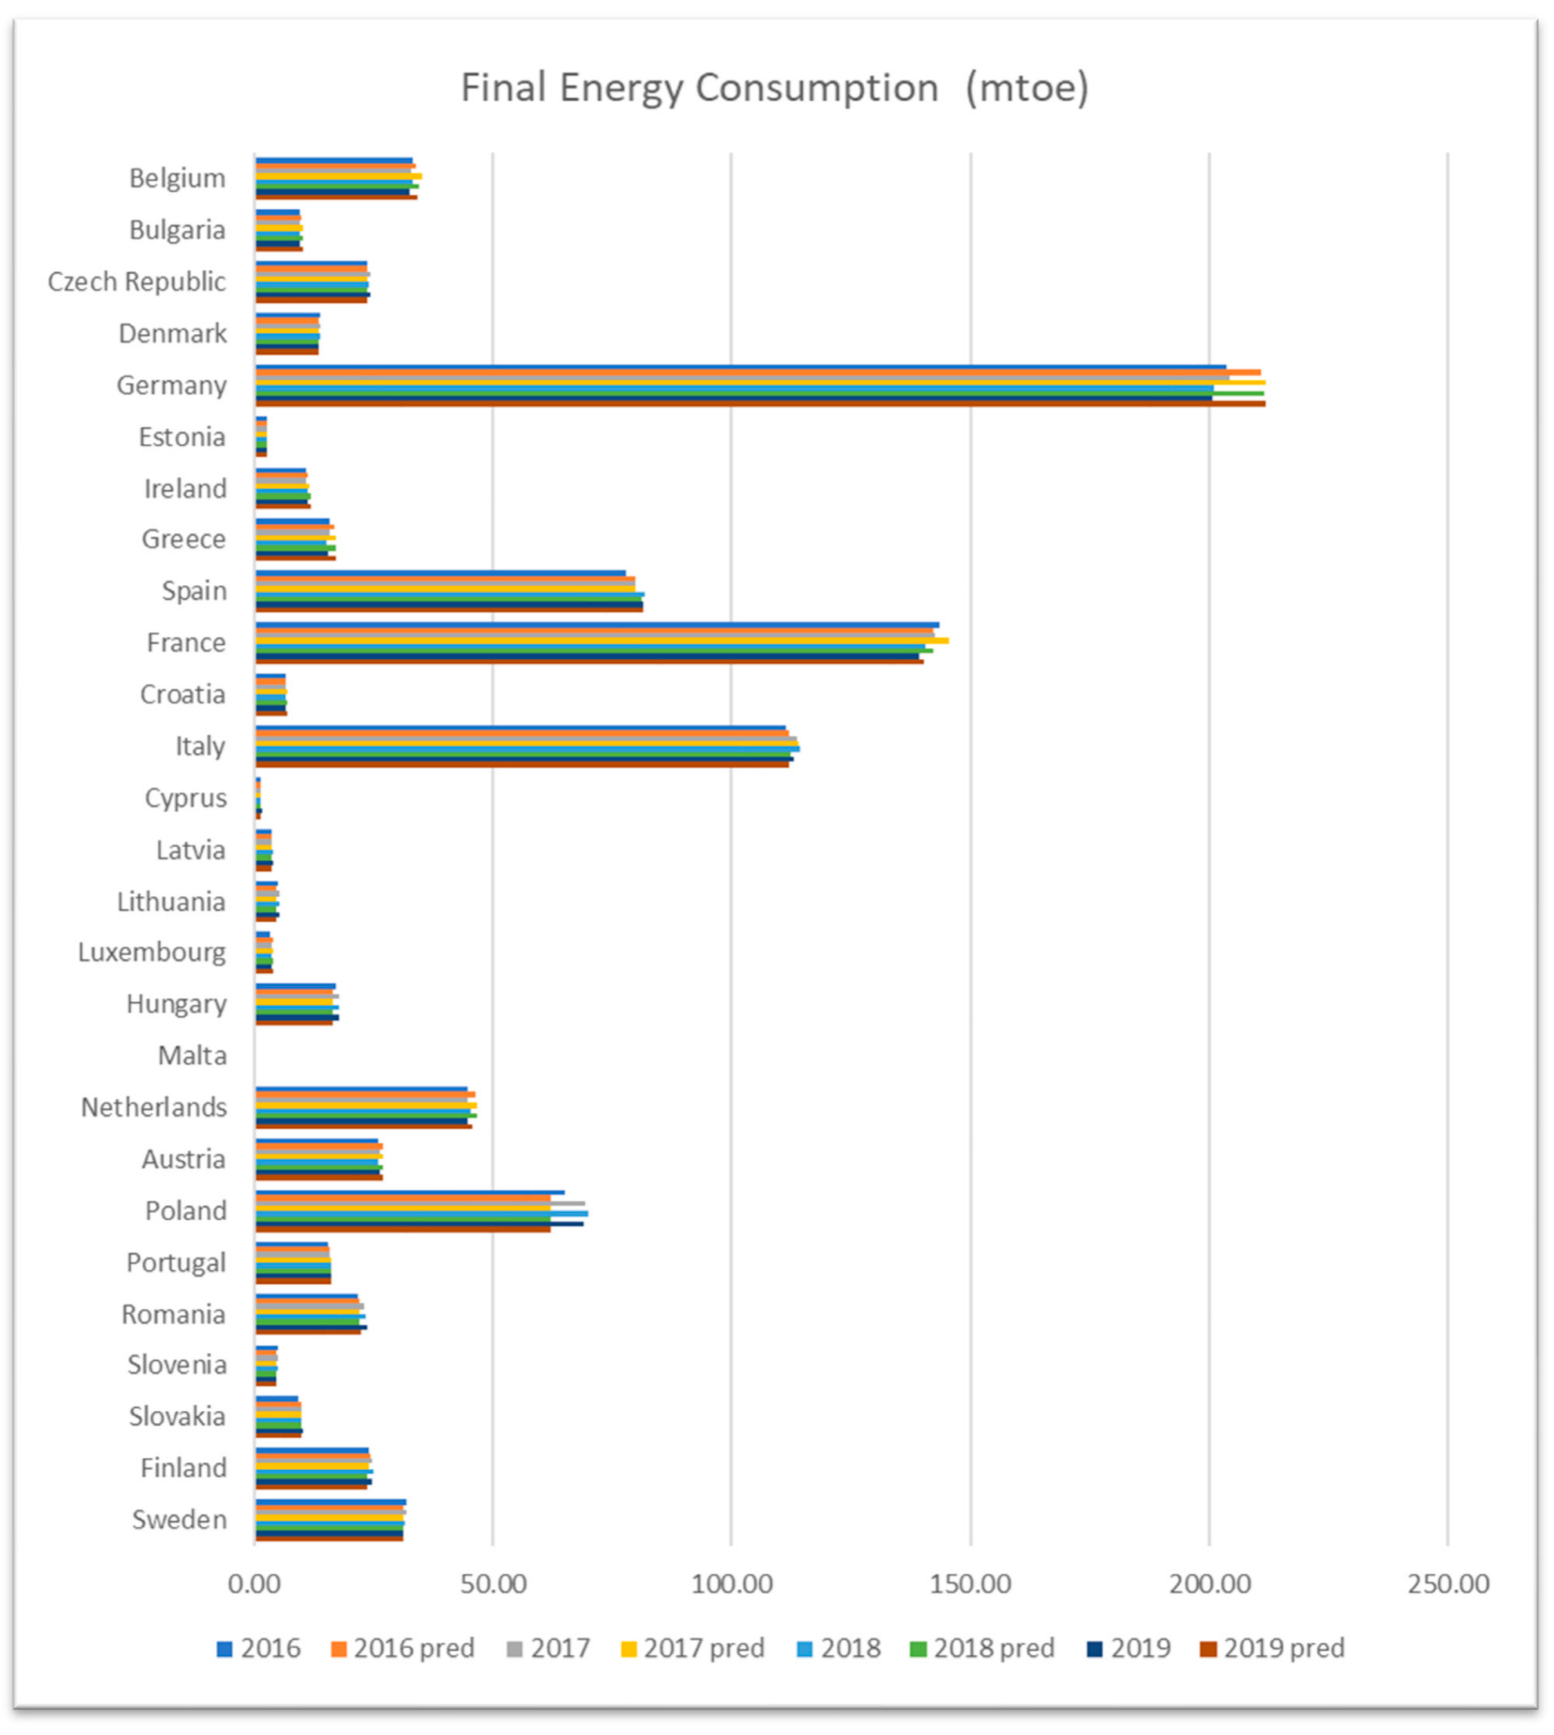
3.1.4. Empirical Validation

Empirical validation is the comparison of model predictions with observations from the real system, together with an assessment of whether the model is adequate for its purpose. Figure 11 presents the annual variation comparisons for EU-27 countries between the final energy consumption (observed) and the prediction by OpEnergy for the years 2016, 2017, 2018, and 2019. Figure 11 clearly depicts that the real-life energy consumption, in comparison to the predicted values (from the ARIMA model) for all the years under consideration, shows that the results of the model are in very good agreement with the predicted concentrations on an annual basis. Germany is by far the country with the highest final energy consumption, with an average of 202.40 Mteo for the time period 2016–2019. The corresponding average prediction for the same time period is 211.45 Mteo, which gives approximately a 4% prediction error. In general, the precision of the model predictions is more than acceptable, considering the purpose of the OpEnergy model. Germany is followed by France (observed average 2016–2019: 141.54 Mteo, predicted average 2016–2019: 142.7 Mteo, accuracy 99.18%), Italy (observed average 2016–2019: 113.15 Mteo, predicted average 2016–2019: 112,75 Mteo, accuracy 99.64%), Spain (observed average 2016–2019: 80.3 Mteo, predicted average 2016–2019: 80.72 Mteo, accuracy 99.47%), and Poland (observed average 2016–2019: 68.39 Mteo, predicted average 2016–2019:62.05 Mteo, accuracy 91%). These countries are the top-5 energy consumers and also the top-5 in GHG emissions in EU-27.
In general, the OpEnergy model is in very good agreement with the observed values for the categories under consideration, i.e., (i) Final energy consumption (mtoe), (ii) GHG emissions, (iii) Gross electricity consumption, (iv) Gross final energy consumption, (v) Heating and cooling, (vi) Primary energy consumption, and (vii) Transport. Considering the amount of data under consideration and for reasons of economies of space, Table 1 is constructed. This is clearly depicted in Table 1, where the Root Mean Square Error (RMSE) and the Mean Absolute Error (MEA) are estimated for the OpEnergy model for five significant energy-intensive categories (EU-27, 2016-2019). These measures are maybe the most frequently used to highlight the differences between values predicted by a model and the values observed in the real system. The main conclusion is that in almost all cases and estimations, real values are in very good agreement with the predicted values.

4. Conclusions

The EU, especially in this era of questioning energy sources and security, needs to demonstrate intense leadership at the global level, considering the transformation of the energy system via efficient and sustainable strategies and initiatives, especially under the threat of carbon emissions and climate change. Smart energy systems need smart tools that will support the transformation of the energy system in the main energy consumption categories [37]. As the main conclusion of this work, the Openergy platform, through its described architecture and modules, can be considered a useful tool that manages energy information and indicators via the umbrella of open data use in the energy sector. The material presented demonstrates that the platform efficiently adopts open databases, analyses them, and provides both reliable and valuable predictions in order to assist citizens and governments track their progress in achieving their EU energy targets.
The COVID-19 pandemic has shown that research data when shared and opened in times of global crisis, help both in transparency and in the search for optimal solutions to address crises that threaten the security and sustainability of society. Correspondingly, open data is also necessary for dealing with the climate and energy crisis, which is an extremely complex phenomenon and the solutions require the efforts of many sectors and actors. However, for knowledge to reach people and be effective open data needs data visualization and data analysis applications such as Openergy, which will help in climate and energy justice. Energy open data is not a future goal but a present necessity.
Based on the above presentation and analysis, Openergy is essentially a data analysis tool that collects and analyzes open data related to the energy system and can be very useful (i) in improving energy-intensive processes and sectors, (ii) help uncover insights to make optimal data-driven decisions, and (iii) optimize modeling and monitoring at the European and national levels. The Openergy application highlights a path on how open data, as a horizontal policy of the European Union, can be of crucial importance in order to create smart energy data management systems. Such online tools can be the basis for putting forward strategies and policies in the EU related to sustainable and renewable energy sources, enhancing transparency and control while improving informed government decisions.
Predicting the value of crucial energy indicators by using the ARIMA proceeds proved reliable. Apart from the accuracy that is apparent in the analysis presented, the process is characterized by simplicity as well as the flexibility it offers, adequately fulfilling the forecasting needs of the current study. This is particularly helpful because it allows handy estimation of the levels and annual trends of energy consumption (primary, final, and gross), CO2 and GHG emissions, electricity consumption, heating and cooling, and the transport sector. The model adopted in the Openergy analysis is successfully validated on an independent set of observations and real-life values. Considering the different characteristics of EU countries, the model may not be expected to perform similarly.
The Openergy platform could be used with more data and more prediction algorithms (e.g., neural networks), semantically describe the datasets, and link them with other sources following the linked open data principals (e.g., climatic data, hazard data). The expectation of the Openergy platform would be to become an application that combines data from other sources and other domains that would visualize it and provide predictions with various algorithms in a form that is understandable to the public and as a monitoring tool for decision-makers. Although generally, there are gaps and uncertainties in data analysis, the tool presented is simple, objective, and quantitative and can be useful for the user.

Author Contributions

Conceptualization, C.B. and K.K.; methodology, C.B. and K.K.; software, C.B. and K.K.; validation, C.B., K.K. and C.V.; formal analysis, C.B. and K.K.; investigation, C.B., K.K. and C.V.; resources, C.B., K.K. and C.V.; data curation, K.K.; writing—original draft preparation, C.B., K.K. and C.V.; writing—review and editing, C.B., K.K. and C.V.; visualization, C.B. and K.K.; supervision, C.B. and C.V.; All authors have read and agreed to the published version of the manuscript.

Funding

This research received no external funding.

Data Availability Statement

Data related to the energy balance, EU 2020 energy target, country energy profiles, energy production, transport fuels, heat production, and gas emissions are available at https://data.europa.eu/en (accessed on 22 August 2022). Data about the targets of each country, e.g., for primary or final energy consumption and for greenhouse gas emissions, are available at https://ec.europa.eu/eurostat (accessed on 22 August 2022). The detailed results can be found at http://openergy.okfn.gr (accessed on 22 August 2022).

Acknowledgments

We would like to thank Anastasios Ventouris, Sotirios Karampatakis, Panagiotis-Marios Filippidis, Lazaros Ioannidis Aikaterini Chatzopoulou, and Evangelos Chondrokostas for the technical support they provided during the project development.

Conflicts of Interest

The authors declare no conflict of interest.

References

  1. Vlachokostas, C. Closing the Loop Between Energy Production and Waste Management: A Conceptual Approach Towards Sustainable Development. Sustainability 2020, 12, 5995. [Google Scholar] [CrossRef]
  2. United Nations. The Sustainable Development Goals Report. 2019. Available online: https://unstats.un.org/sdgs/report/2021/The-Sustainable-Development-Goals-Report-2021.pdf (accessed on 22 February 2022).
  3. Doukas, H. On the appraisal of “Triple-A” energy efficiency investments. Energy Sources B Econ. Plan. Policy 2018, 13, 320–327. [Google Scholar] [CrossRef]
  4. Kolokotsa, D. Smart cooling systems for the urban environment. Using renewable technologies to face the urban climate change. Sol. Energy 2017, 154, 101–111. [Google Scholar] [CrossRef] [Green Version]
  5. Michailidou, A.V.; Vlachokostas, C.; Achillas, C.; Maleka, D.; Moussiopoulos, N.; Feleki, E. Green Tourism Supply Chain Management based on life Cycle Impact Assessment. Eur. J. Environ. Sci. 2016, 6, 30–36. [Google Scholar] [CrossRef] [Green Version]
  6. European Parliament. Energy Policy: General Principles. Fact Sheets on the European Union. Available online: https://www.europarl.europa.eu/factsheets/en/sheet/68/energy-policy-general-principles (accessed on 22 February 2022).
  7. Moroni, S.; Antoniucci, V.; Bisello, A. Local Energy Communities and Distributed Generation: Contrasting Perspectives, and Inevitable Policy Trade-Offs, beyond the Apparent Global Consensus. Sustainability 2019, 11, 3493. [Google Scholar] [CrossRef] [Green Version]
  8. Vlachokostas, C.; Charisios, A.; Diamantis, V.; Michailidou, A.V.; Baginetas, K.; Aidonis, D. Supporting decision making to achieve circularity via a biodegradable waste-to-bioenergy and compost facility. J. Environ. Manag. 2021, 285, 112215. [Google Scholar] [CrossRef]
  9. EC. Official Website of the European Union, A European Green Deal, 2021. Available online: https://ec.europa.eu/info/strategy/priorities-2019-2024/european-green-deal_en (accessed on 22 February 2022).
  10. Petrov, O.; Gurin, J.; Manley, L. Open Data for Sustainable Development. Connections; 2016-5; World Bank: Washington, DC, USA; Available online: https://openknowledge.worldbank.org/handle/10986/24017 (accessed on 2 August 2022).
  11. OKF. Open Definition 2.1. Open Knowledge Foundation. 2022. Available online: http://opendefinition.org/od/2.1/en/ (accessed on 11 March 2022).
  12. Poikola, A.; Villum, C.; Dietrich, D.; Gray, J.; Tait, J.; Rogers, K.; Wainwright, M. Open Data Handbook. 2010. Available online: http://opendatahandbook.org/ (accessed on 11 March 2022).
  13. Janssen, M.; Charalabidis, Y.; Zuiderwijk, A. Benefits, Adoption Barriers and Myths of Open Data and Open Government. Inf. Syst. Manag. 2012, 29, 258–268. [Google Scholar] [CrossRef] [Green Version]
  14. Neves, F.T.; de Castro Neto, M.; Aparicio, M. The impacts of open data initiatives on smart cities: A framework for evaluation and monitoring. Cities 2020, 106, 102860. [Google Scholar] [CrossRef]
  15. The World Bank. Open Government Data Toolkit-Benefits of Open Data. 2019. Available online: http://opendatatoolkit.worldbank.org/en/starting.html (accessed on 11 March 2022).
  16. Ioannidis, L.; Bratsas, C.; Karabatakis, S.; Filippidis, P.; Bamidis, P. Rudolf: An HTTP API for exposing semantically represented fiscal OLAP cubes. In Proceedings of the 11th International Workshop on Semantic and Social Media Adaptation and Personalization (SMAP), Thessaloniki, Greece, 20–21 October 2016; pp. 177–182. [Google Scholar] [CrossRef]
  17. Koupidis, K.; Bratsas, C.; Karampatakis, S.; Martzopoulou, A.; Antoniou, I. Fiscal Knowledge discovery in Municipalities of Athens and Thessaloniki via Linked Open Data. In Proceedings of the 11th International Workshop on Semantic and Social Media Adaptation and Personalization (SMAP), Thessaloniki, Greece, 20–21 October 2016; pp. 171–176. [Google Scholar] [CrossRef]
  18. Filippidis, P.M.; Karampatakis, S.; Koupidis, K.; Ioannidis, L.; Bratsas, C. The code lists case: Identifying and linking the key parts of fiscal datasets. In Proceedings of the 11th International Workshop on Semantic and Social Media Adaptation and Personalization (SMAP), Thessaloniki, Greece, 20–21 October 2016; pp. 165–170. [Google Scholar] [CrossRef]
  19. Bratsas, C.; Chondrokostas, E.; Koupidis, K.; Antoniou, I. The Use of National Strategic Reference Framework Data in Knowledge Graphs and Data Mining to Identify Red Flags. Data 2021, 6, 2. [Google Scholar] [CrossRef]
  20. Nastasi, B.; Manfren, M.; Noussan, M. Open Data and Energy Analytics. Energies 2020, 13, 2334. [Google Scholar] [CrossRef]
  21. Fremouw, M.; Bagaini, A.; De Pascali, P. Energy Potential Mapping: Open Data in Support of Urban Transition Planning. Energies 2020, 13, 1264. [Google Scholar] [CrossRef] [Green Version]
  22. Pezzutto, S.; Croce, S.; Zambotti, S.; Kranzl, L.; Novelli, A.; Zambelli, P. Assessment of the Space Heating and Domestic Hot Water Market in Europe—Open Data and Results. Energies 2019, 12, 1760. [Google Scholar] [CrossRef] [Green Version]
  23. Müller, A.; Hummel, M.; Kranzl, L.; Fallahnejad, M.; Büchele, R. Open Source Data for Gross Floor Area and Heat Demand Density on the Hectare Level for EU 28. Energies 2019, 12, 4789. [Google Scholar] [CrossRef] [Green Version]
  24. De Kok, R.; Mauri, A.; Bozzon, A. Automatic Processing of User-Generated Content for the Description of Energy-Consuming Activities at Individual and Group Level. Energies 2019, 12, 15. [Google Scholar] [CrossRef] [Green Version]
  25. Vialetto, G.; Noro, M. Enhancement of a Short-Term Forecasting Method Based on Clustering and kNN: Application to an Industrial Facility Powered by a Cogenerator. Energies 2019, 12, 4407. [Google Scholar] [CrossRef] [Green Version]
  26. Pfenninger, S.; DeCarolis, J.; Hirth, L.; Quoilin, S.; Staffell, I. The importance of open data and software: Is energy research lagging behind? Energy Policy 2017, 101, 211–215. [Google Scholar] [CrossRef]
  27. Koupidis, K.; Bratsas, C. okgreece/OpEnergyAnalytics: OpEnergyAnalytics v0.1 (Openergyanalytics). 2018. Zenodo. Available online: https://doi.org/10.5281/zenodo.6449412 (accessed on 22 August 2022).
  28. Koupidis, K.; Bratsas, C. okgreece/TimeSeries.OBeu v1.2.2 (v1.2.2). 2018. Zenodo. Available online: https://doi.org/10.5281/zenodo.1172102 (accessed on 22 August 2022).
  29. Mahla, S.K.; Parmar, K.S.; Singh, J.; Dhir, A.; Sandhu, S.S.; Chauhan, B.S. Trend and Time Series Analysis by ARIMA Model to Predict the Emissions and Performance Characteristics of Biogas Fueled Compression Ignition Engine. Energy Sources Part A Recovery Util. Environ. Eff. 2019, 1–12. [Google Scholar] [CrossRef]
  30. Newbold, P. ARIMA Model Building and the Time Series Analysis Approach to Forecasting. J. Forecast. 1983, 2, 23–35. [Google Scholar] [CrossRef]
  31. Nelson, B.K. Time Series Analysis Using Autoregressive Integrated Moving Average (ARIMA) Models. Acad. Emerg. Med. 1998, 5, 739–744. [Google Scholar] [CrossRef]
  32. Yamak, P.T.; Yujian, L.; Gadosey, P.K. A Comparison between ARIMA, LSTM, and GRU for Time Series Forecasting. In Proceedings of the 2nd International Conference on Algorithms, Computing and Artificial Intelligence, New York, NY, USA, 20–22 December 2019; pp. 49–55. [Google Scholar] [CrossRef]
  33. Ho, S.L.; Xie, M.; Goh, T.N. A Comparative Study of Neural Network and Box-Jenkins ARIMA Modeling in Time Series Prediction. Comput. Ind. Eng. 2002, 42, 371–375. [Google Scholar] [CrossRef]
  34. Nury, A.H.; Hasan, K.; Alam, M.J.B. Comparative Study of Wavelet-ARIMA and Wavelet-ANN Models for Temperature Time Series Data in Northeastern Bangladesh. J. King Saud Univ.-Sci. 2017, 29, 47–61. [Google Scholar] [CrossRef] [Green Version]
  35. Box, G.E.P.; Jenkins, G.M. Time Series Analysis: Forecasting and Control; Holden-Day: San Francisco, CA, USA, 1970. [Google Scholar]
  36. Box, G.E.P.; Jenkins, G.M.; Reinsel, G.C. Time Series Analysis, Forecasting and Control, 3rd ed.; Prentice Hall: Englewood Cliffs, NJ, USA, 1994. [Google Scholar]
  37. Vlachokostas, C. Smart buildings need smart consumers: The meet-in-the middle approach towards sustainable management of energy sources. Int. J. Sustain. Energy 2020, 39, 648–658. [Google Scholar] [CrossRef]
Figure 1. Basic structure and components of the OpΕnergy tool and related architecture.
Energies 15 08294 g001
Figure 2. HTTP request to obtain time series predictions.
Energies 15 08294 g002
Figure 3. EU heat map of Gross Final Energy Consumption.
Energies 15 08294 g003
Figure 4. Comparison bar chart of Gross Final Energy Consumption of two EU countries.
Energies 15 08294 g004
Figure 5. Comparison time series chart of Gross Final Energy Consumption of two EU countries.
Energies 15 08294 g005
Figure 6. Semi-automated constructed report for an EU country.
Energies 15 08294 g006
Figure 7. Energy Profile of an EU country along with the time series visualization on CO2 emissions until 2020.
Energies 15 08294 g007
Figure 8. Final energy consumption by sector of an EU country.
Energies 15 08294 g008
Figure 9. Comparison of market indicators—entities bringing gas into EU countries.
Energies 15 08294 g009
Figure 10. Treemap chart of final energy consumption by industry of an EU country.
Energies 15 08294 g010
Figure 11. Annual variation comparisons for EU-27 countries between the final energy consumption (observed) and the prediction by OpEnergy for the years 2016, 2017, 2018, and 2019.
Energies 15 08294 g011
Table 1. Root mean square error and mean absolute error estimated for the OpEnergy model for five significant energy-intensive categories (EU-27, 2016-2019).
Category of PredictionMeasure2016201720182019
Final Energy ConsumptionRMSE1.72.22.72.7
MAE0.91.21.31.3
Greenhouse Gas EmissionsRMSE5.47.99.08.0
MAE3.24.25.14.5
Gross Electricity ConsumptionRMSE1.12.22.94.2
MAE1.11.82.53.6
Heating and CoolingRMSE2.93.04.65.1
MAE1.82.13.13.5
TransportRMSE2.22.12.63.7
MAE1.31.41.82.4
Publisher’s Note: MDPI stays neutral with regard to jurisdictional claims in published maps and institutional affiliations.

