Article

Prioritization of Renewable Energy for Sustainable Electricity Generation and an Assessment of Floating Photovoltaic Potential in Lao PDR

by
Yevang Nhiavue
1,2,
Han Soo Lee
1,3,*,
Sylvester William Chisale
1,4 and
Jonathan Salar Cabrera
1,5
1
Transdisciplinary Science and Engineering Program, Graduate School of Advanced Science and Engineering, Hiroshima University, 1-5-1 Kagamiyama, Higashi-Hiroshima 739-8529, Japan
2
Department of Energy Policy and Planning, Ministry of Energy and Mines (MEM), Vientiane P.O. Box 4078, Laos
3
Center for the Planetary Health and Innovation Science (PHIS), The IDEC Institute, Hiroshima University, 1-5-1 Kagamiyama, Higashi-Hiroshima 739-8529, Japan
4
Department of Applied Studies, Malawi University of Science and Technology (MUST), Limbe P.O. Box 5196, Malawi
5
Institute of Computing and Engineering, Davao Oriental State University, Mati City 8200, Philippines
*
Author to whom correspondence should be addressed.
Energies 2022, 15(21), 8243; https://doi.org/10.3390/en15218243
Submission received: 22 September 2022 / Revised: 17 October 2022 / Accepted: 29 October 2022 / Published: 4 November 2022
(This article belongs to the Section A: Sustainable Energy)

Abstract

:
Lao PDR faces seasonal power supply problems due to its heavy reliance on hydropower. Thus, the aim of this paper was to prioritize renewable energy (RE) resources for sustainable electricity generation in Lao PDR using the analytic hierarchy process (AHP) method, and to further estimate the energy available for the prioritized RE to enhance the seasonal power supply. Four RE alternatives were assessed considering technological, economic, environmental, and social criteria with twelve overall sub-criteria. The results indicated that hydropower was the most highly prioritized alternative, followed by solar. The resulting weights of the RE prioritization were in agreement with the Lao energy policy and plan. In order to address the seasonal power supply problem, setting-up floating photovoltaic (FPV) units in the existing hydropower reservoirs was proposed. The FPV potential was estimated, and the results revealed that the predicted power demand by 2030, as calculated in the latest Lao national power development strategy, could be fully covered by integrating the FPV output from 10% coverage of the water surface in four existing hydropower reservoirs with the existing power supply in 2020. The proposed FPV technology would provide a solution to enhance the seasonal power supply and reduce the power import.

1. Introduction

Electricity is a critical tool for accelerating socio-economic growth. According to a statistical review of world energy in 2021 [1], global electricity generation is dominated by fossil fuels such as coal and natural gas, which provide 35.1% and 23.8% of the energy produced, respectively. Given the limitations and hazards of fossil fuel combustion, especially the greenhouse gas (GHG) and CO2 emissions they create and the impacts on climate change, global warming, and health [2], increasing the share of clean and renewable energy (RE) resources in total energy production has been emphasized around the globe [3].
The global deployment of RE has shown a crucial, increasing trend over the last two decades, mainly in industrialized and fossil fuel-based countries such as China, US, and Europe [1]. The switch to RE greatly influences short-term and long-term development goals [4,5]. Similarly, the consumption of RE leads to low-carbon green growth and enriches global sustainability [6]. However, the exploration and allocation of RE vary among different regions and countries, mainly depending on the geographical conditions [7].
With the growth in economies, the population, and environmental issues, sustainable energy planning is becoming more complex owing to numerous decision-making factors such as technical, economic, environmental, social, institutional, and political factors [8]. Thus, it is critical to incorporate these in the planning and decision-making processes. Multi-criteria decision-making (MCDM) has been used as a potential tool for dealing with multi-dimensional problems, especially in planning, selecting alternatives, allocating resources, and resolving conflict [9]. Several MCDM techniques have been used in long-term energy planning and in selecting the optimal energy site and resources for sustainable development. However, the analytic hierarchy process (AHP) has been recognized as one of the most prominent MCDM approaches due to its simple mathematical computation and ability to break complex problems into understandable hierarchy structures, including the ability to integrate its application with other tools for problem-solving [10,11].
The AHP has been successfully utilized by various researchers in selecting the most suitable renewable energy technology (RET) for long-term energy planning [12,13,14,15,16,17,18,19,20,21,22,23,24,25]. The results of these studies have clearly revealed the final ranking of the RE alternatives and criteria prioritization, mainly depending on the number of alternatives, the criteria, and stakeholders’ participation in each study. Notwithstanding, these studies only obtained the final ranking of the alternatives, and there was no further analysis after the priority alternative was identified. For instance, the estimation of the energy potential for the preferred RE alternative. Moreover, the stakeholders considered in these studies were based on the opinions and judgments of local experts and decision-makers.
Similarly, many other studies have combined the AHP with other tools to determine the optimal site for power plant installation [26,27,28]. The results from these studies has indicated that the most appropriate location for power plant installation, especially solar power plants, are areas with high energy demand and power transmission proximity, including areas with high energy potential with fewer settlements.
Several studies have also been applied the integrated AHP–MCDM techniques to identify the barriers to RE penetration and development [29,30,31,32]. The results showed that RE deployment requires a high initial investment cost, including economic and business risk factors with a long pay-back period, and policy and political barriers. Several suggestions have been made to overcome these barriers, for instance, by providing subsidies and updating the energy policy to facilitate accessibility. Apart from the energy field, the AHP has also been applied in other areas. Cabrera et al. [33,34] combined the geographical information system (GIS) model with AHP to assess flood-prone areas in the Philippines.
Among RETs (excluding hydropower), solar PV represents the largest proportion of the global RE capacity with a share of 129 GW in 2020 [1]. However, due to land constraints and the high population density in many countries, floating solar photovoltaic (FPV) systems have played an important role in increasing power generation capacity [35]. FPV is a type of solar energy technology in which the solar panels are installed on the surface of water bodies. The deployment of FPV has increased significantly around the world in the last decade from 0.5 MWp in 2008 to 1314 MWp in 2018 [35]. The implementation of FPV systems has demonstrated great benefits compared to land-based PV system, including the reduction in water evaporation, easy site preparation, improvement in water quality, land use conservation, and higher power generation [36,37,38].
The integration of FPV with a hydropower system has been used in various studies. Rauf et al. [39] analyzed the combination of FPV and a hydropower plant in Pakistan. The study showed that FPV generation could complement the daily mid-day peak load by producing 3.5% additional power when combined with the existing hydropower generation. Lee et al. [38] reviewed the benefits of hybrid FPV–hydropower system operation including the global technical potential estimation. The results revealed that the global potential for such a hybrid system could range from 3 TW to 7.6 TW. A study that assessed the FPV potential in an existing hydropower reservoir in Africa demonstrated that a total coverage of less than 1% of 146 hydropower reservoirs in the continent could generate double the energy output with 46.04 TWh annually, which would save about 743 million m3/year of water or the equivalent of about 170.64 GWh/year of energy generated from hydropower [40].
Solomin et al. [41] proved that FPV with hydropower was the most favorable and efficient technology for power generation among various hybrid technologies. Hybrid technologies are a combination of FPV and hydro systems, FPV and pumped hydro, FPV and wave energy converters, FPV and solar trees, FPV and tracking, FPV and conventional power, and FPV and hydrogen. Similarly, Agrawal et al. [42] assessed the FPV potential for 25% coverage of the Rajghat Dam in India. The results revealed that the FPV could provide a benefit of about 10,623,501 MWh and 1395 m3/MWp for power generation and evaporation reduction, respectively. A comprehensive analysis of the FPV potential for 117 hydropower reservoirs in India was also performed [43]. The results showed that the energy output could be increased by 52% with a coverage of less than 4% of the hydropower reservoirs and an additional 1566 TWh of hydropower generation from water savings of about 837 million m3/year. Additionally, several studies were performed recently to estimate the technical potential of FPV, with the purpose of decreasing non-fossil fuel utilization and increasing the share of RE consumption [44,45,46,47].
Lao PDR, hereafter referred to as Laos, is a mountainous and landlocked country in Southeast Asia. The power sector plays a very important role in accelerating its national socio-economic development. Currently, power generation is dominated by hydropower (about 80% of the total), the household electrification rate is over 95% and there are 90 power plants in operation, from which about 70% of the total power production is exported to neighboring countries [48,49]. To enhance power supply security, the government has set the energy generation mix policy at 75% hydropower, 11% coal, and 14% other non-hydro renewables [49]. Regarding energy efficiency and energy saving targets, a 30% RE share and a 10% energy reduction in the total energy consumption are set to be achieved by 2025 and 2030, respectively [50]. Even though the power sector has been growing significantly in the last several years and a large amount of the power produced has been exported, the country still faces seasonal power supply problems due to the heavy reliance on hydropower generation. High-priced imports are required during the dry season (November to May) [51], and there is also a lack of non-hydro renewable integration in the long-term plan [52].
In terms of long-term RE planning in Laos, there is very limited scientific research in the literature. Several papers have highlighted the importance and challenges, including the impact assessment, of hydropower development in the country, but these studies are out of date. Changsaveng et al. [53] emphasized the importance of social and economic perspectives on hydropower development in Laos. An evaluation of the impacts and benefits of two hydropower projects on the community’s livelihood and resettlement were evaluated in case studies on the Theun-Hinboun expansion project and Nam Mang 3 hydropower project [54,55]. Vorabout et al. [56] investigated the electrical effects of wind energy generation on the power system with an installed capacity of 75 MW in the central part of Laos by using DigSLENT power factory software. The results showed that a 40% increment in wind power generation could reduce the power import by about 77.17 MW in that area. However, the study only focused on a power load flow analysis in the power system without any consideration of multiple factors, especially the land use constraints. Moreover, this would require new power transmission infrastructures, which will be costly. A study was also conducted on hydropower cooperation for power production in the central area of Laos by combining 10 hydropower plants [57]. The results indicated that the maximum power production could be increased by about 252,732 MWh/year. Notwithstanding, the power generation output in the study did not show an increase in the seasonal power supply in the dry season and the management and operation of these hydropower plants are not feasible because they are not cascade hydropower stations operating on the same river.
Several international organizations have released reports that review the Lao power sector, including the development of a road map for sustainable development in the sector. In most cases, these reports have focused on the financial perspective related to the performance of electricity utilities and investment in power sector. The integration of non-hydro renewables was suggested as an option for long-term planning in the reports, but there was no clear suggestions on which RE resources should be prioritized for sustainable energy generation. The ADB [52] and Macroconsulting [51,58] conducted an assessment of the Lao power market structure, regulatory factors and policy, along with future action plans. Similarly, a study on the financial performance of Electricite du Laos (EDL) and Electricite du Laos Generation Public Company (EDL-gen), which are the state-owned utilities responsible for electricity businesses, was conducted by the PricewaterhouseCoopers (PwC) consultant group [59].
An overview of the Lao energy outlook and future projections to 2040 using the long-range energy alternatives planning system (LEAP) model was produced by the Ministry of Energy and Mines (MEM), supported by ERIA [60]. This report only utilized the macro-GDP growth and overall energy target for the future projection. Simultaneously, two studies were conducted to identify the power sector vulnerabilities and assess the technical potential of three types of RE (solar, wind, and small hydropower), including prioritizing the zones suitable for RE implementation [61,62]. Notwithstanding, the prioritization of RET considering multi-dimensional factors was not performed in those studies. To the best of the authors’ knowledge, the prioritization of RE resources for long-term electricity generation planning, including the assessment of the FPV energy production in the existing hydropower reservoirs has never been undertaken in Laos.
Therefore, the aim of this study was to prioritize RE resources for sustainable electricity generation in Laos using the AHP method based on a combination of high-level government decision-makers (DMs) and expert opinions from various organizations with different backgrounds and expertise, including local DMs from Laos, academic researchers, and experts from international institutions. This study further assessed the FPV potential to enhance the seasonal power supply for the country. The results of the study provide evidence that may focus public attention on the hybrid FPV-hydropower system and it provides a foundation for more comprehensive future research on this hybrid system.

2. Materials and Methods

2.1. Study Area

Laos borders China to the north, Myanmar to the northwest, Thailand to the west, Cambodia to the south, and Vietnam to the east. Figure 1 shows the map of Laos, which consists of 17 provinces and the Vientiane Capital, including the location of four existing hydropower reservoirs that were considered for FPV energy estimation in this study.

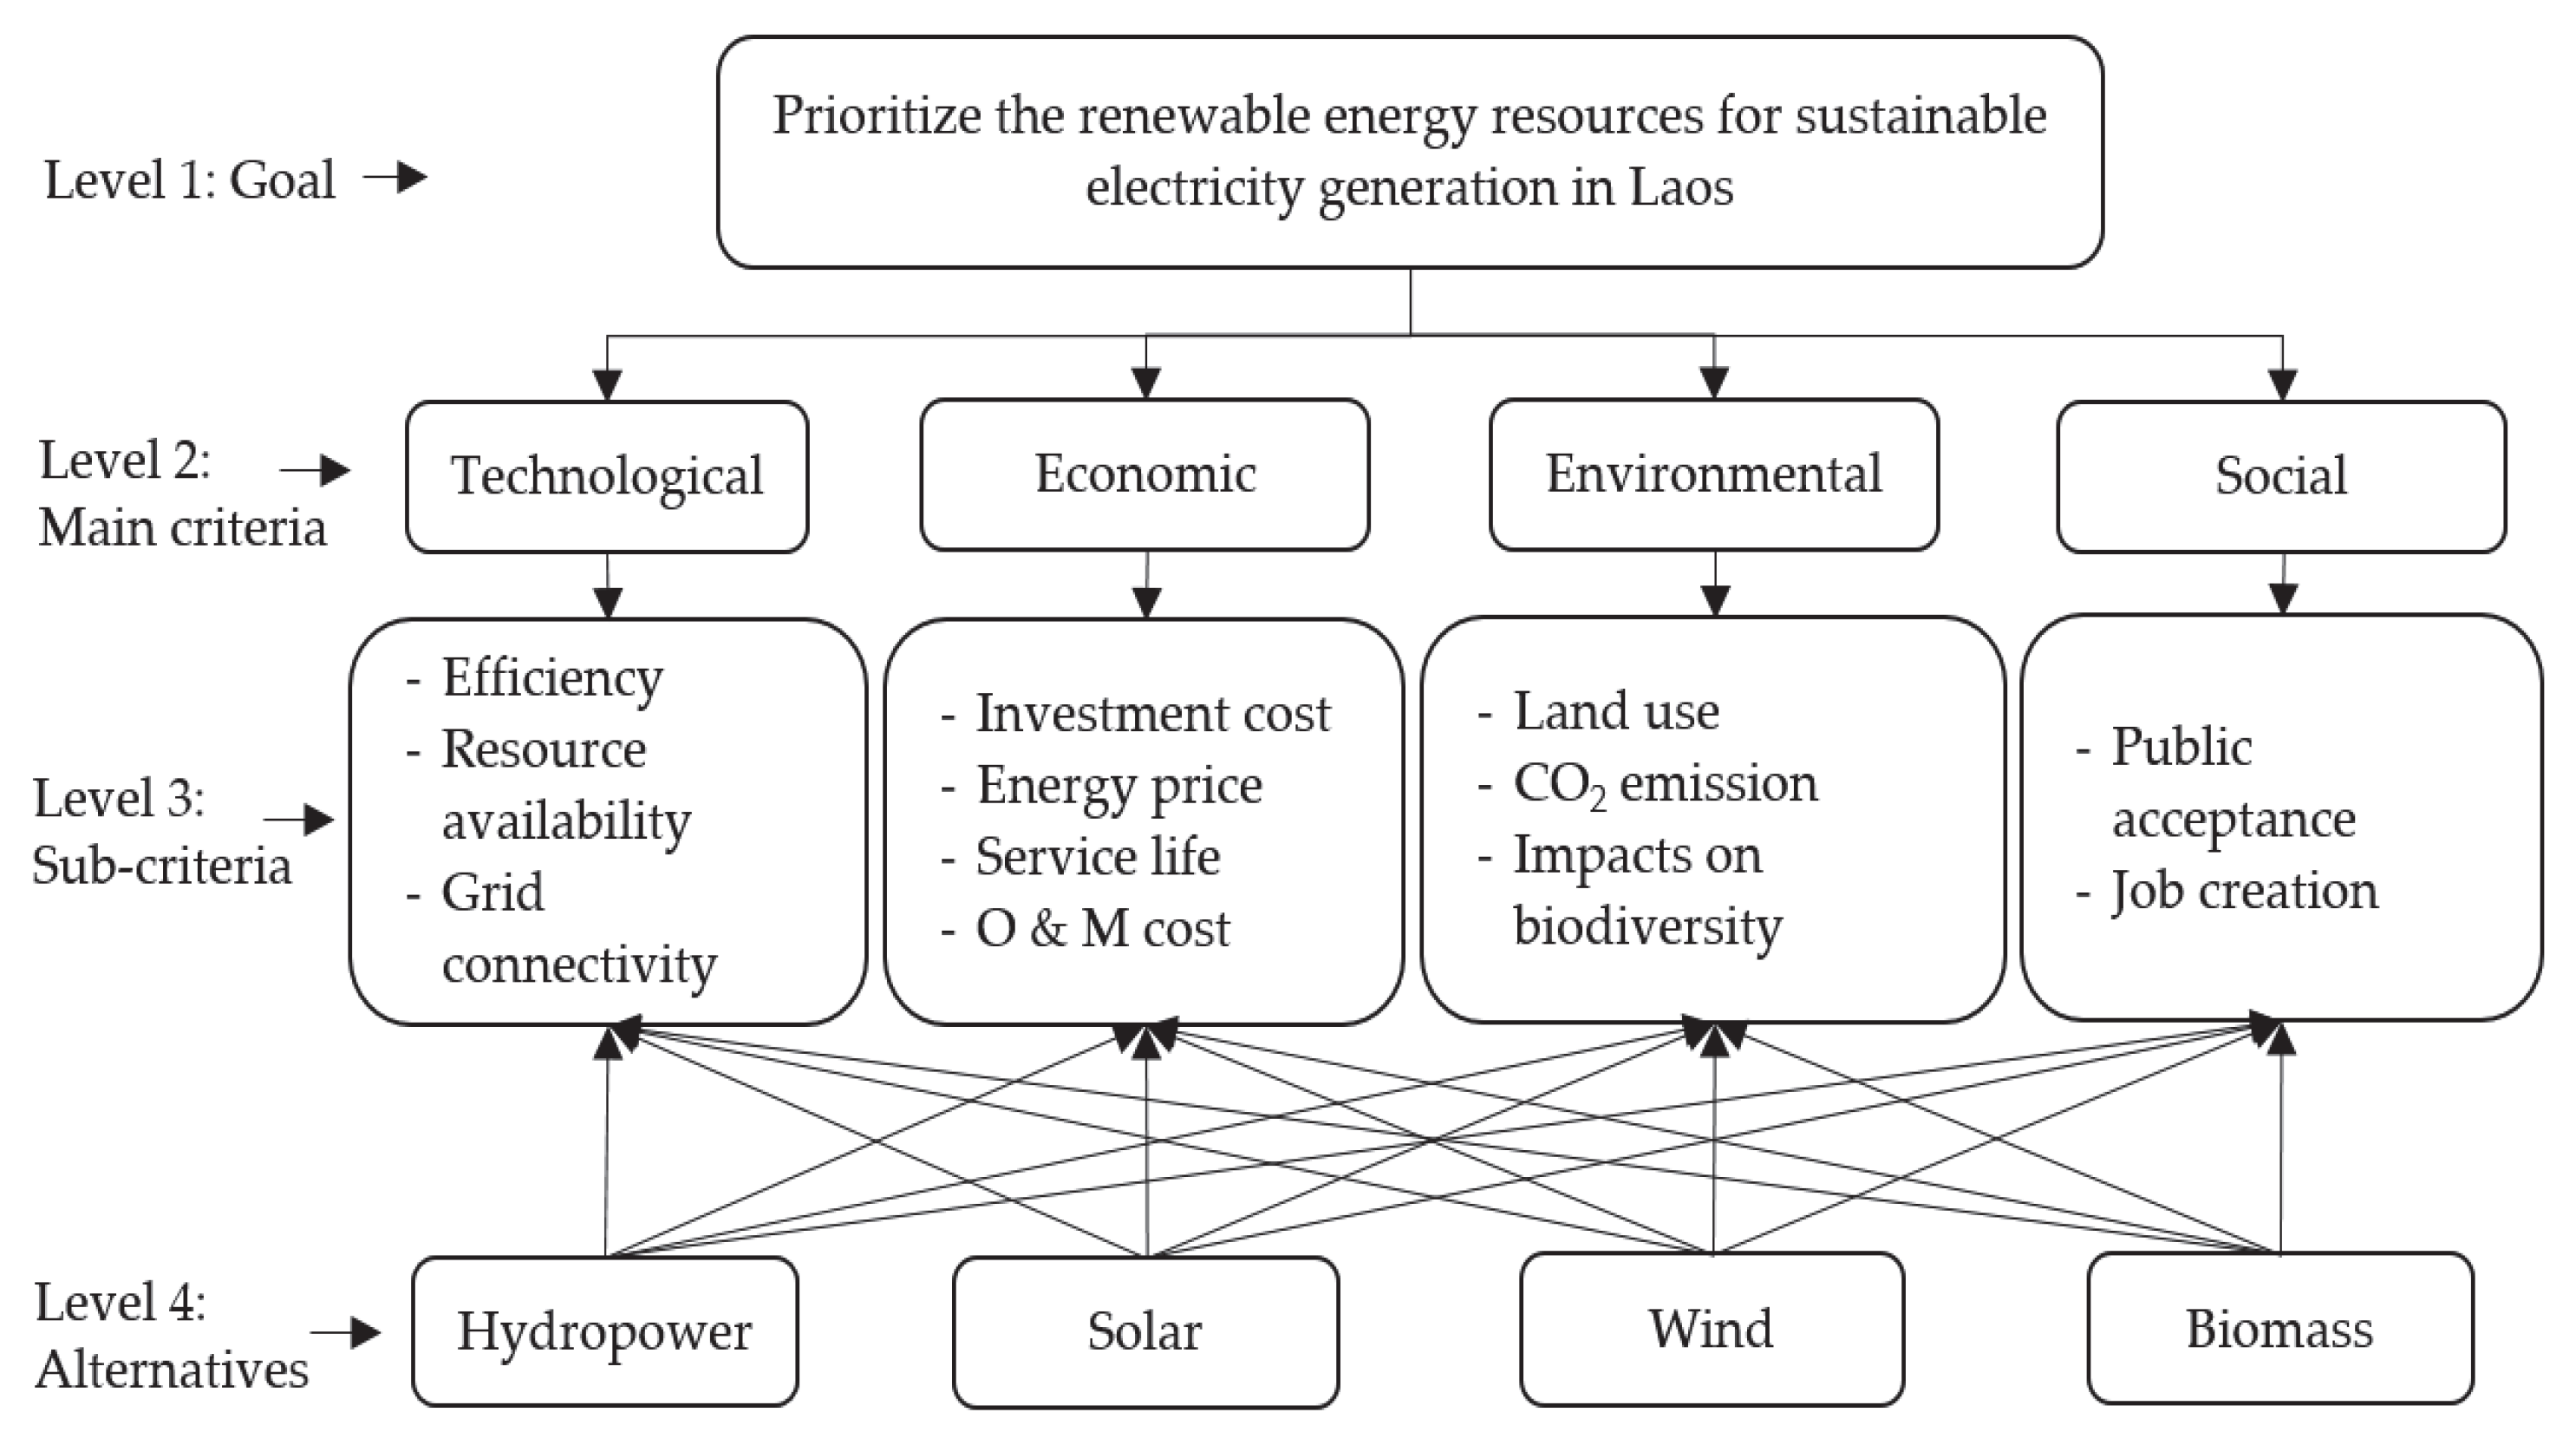
2.2. RE Prioritization

The prioritization of RE resources in this study was based on the subjective judgment of the DMs under the AHP method. Due to the COVID-19 situation, the input data was collected via an online survey from October to December 2021. The target respondents of the survey included high-level government DMs, experts, economists, and academic researchers from various local and international institutions. In this study, the four RE alternatives considered were hydropower, solar, wind, and biomass. The four main criteria for sustainable electricity generation planning included technological, economic, environmental, and social with twelve overall sub-criteria. The alternatives, main criteria, and sub-criteria were chosen from the literature [10,11,16,21,63], and the Lao energy policy [64,65] and plan [49]. A description of the main criteria, sub-criteria, and alternatives used in this study is given in Table 1.
For the data screening, the survey questionnaires were reviewed by 347 experts and the total responses received were 101. However, about 70% of the participants dropped out. This could be due to a poor internet connection. A total of 31 respondents completed the survey with an average timeframe of 25 min, indicating that the participants paid great attention to the survey of this study. The respondents or experts were then classified into three different groups.
The first group consisted of 19 respondents from Laos and it was called the “Lao group”. The second group included 8 international academic researchers from the Coastal Hazards and Energy System Science Laboratory at Hiroshima University in Japan, and it was called the “CHESS Lab”. The third group comprised of two energy consultants from Thailand, one retired consultant for the World Bank Laos from the USA, and one professor at Hiroshima University, and it was called the “International group”.
This classification was used to investigate and incorporate the opinions of various experts with different backgrounds and expertise; thus, both international and local experts could be used to improve sustainable energy planning and development (see Appendix, Table A1. Respondents’ details)

Analytic Hierarchy Process

The structure of the AHP in this study consisted of four main levels. The first level was the “goal” of the decision to be achieved. The second level is the main criteria. The sub-criteria are given in level 3 and level four is known as the alternatives. The lower level is assessed based on the above level; in this case, the RE alternatives were evaluated with respect to the main criteria and sub-criteria in level 2 and 3, respectively. The AHP structure for this study is presented in Figure 2.
Based on the AHP, the DMs were required to provide their opinions and judgments regarding the pairwise comparison of the two criteria using the scale of importance of an integer value from 1 to 9, which was introduced by Saaty [66]. The higher value indicates that one criterion is more important than the other.
According to Saaty [66], the computation procedures of the AHP could be simplified and described in the following steps: Step 1 is the determination of the goal, main criteria, sub-criteria, and alternatives, followed by the construction of the pairwise comparison matrices in Step 2. Then, the relative weights of the criteria and alternatives are calculated in Step 3. The number of pairwise comparisons is calculated using Equation (1).
P C = n ( n 1 ) 2
where PC is the number of pairwise comparisons, and n is the number of criteria.
Suppose that A is the pairwise comparison matrix, then the matrix A is represented in the following form:
A = [ 1 a 12 a 1 n a 21 1 a 2 n a n 1 a n 2 1 ]
where a 12 ,   a 1 n , a n n   are the scores given by the DMs ( i = 1 ,   2 , n ) , and 𝑛 is the number of criteria in the comparison. The value below the diagonal matrix is called a “reciprocal value”, which can be obtained using Equation (2).
a n 1 = 1 a 1 n
To calculate the criteria weights, firstly, the matrix A must be normalized by dividing the entry in each column by its column sum. Then, the criteria weight (W) can be obtained by averaging each row in the normalized matrix (Ā). The sum of the calculated relative weights must be equal to one.
Subsequently, in Step 4 the consistency ratio (CR) is checked to examine whether the judgments of the DMs are consistent. It is suggested that if the CR value is less than or equal to 0.1 or 10%, then the judgments of the DMs are consistent and acceptable.
There are several sub-steps for checking the CR value. First, the original matrix (A) is multiplied by the weights (W). Then, the lamda values (λ) are calculated by dividing the product (A*W) by the weights (W). Next, the value λmax is obtained by averaging the calculated λ values and then the consistency index (CI) is determined using Equation (3).
CI = ( λ max n ) ( n 1 ) ,
where n is the number of criteria in the particular comparison matrix.
Finally, the CR value is calculated using Equation (4).
CR = CI RI ,
where RI stands for the random consistency index and its value is given in [66].
After obtaining the relative weights of the criteria and alternatives and the CR has been checked, the final Step 5 is to aggregate the judgment of the individual DMs. The aggregation of the final weights from all DMs is performed using the geometric mean method [67], using Equation (5).
X agg = ( i = 1 n X ) 1 n = X 1 * X 2 * * X n n
where Xagg is the aggregated value from each entry in the pairwise comparison matrices of all DMs, n is the number of DMs, and X is the entry of the pairwise comparison matrices of each DM. The computation of the relative weights and checking the consistency ratio for the aggregated judgments can be conducted by following the same steps outlined above.
The summary of the AHP algorithm and computation steps is depicted in Figure 3.

2.3. FPV Potential Assessment

One of the critical parameters used to estimate the FPV potential is solar irradiation. The global horizontal irradiance (GHI) database of the Medium-Range Weather Forecasts Reanalysis 5th generation data (ERA5) was utilized for FPV potential assessment in this study. “The ERA5 dataset provides hourly estimates of a large number of atmospheric, land and oceanic climate variables covering the earth on a 30 km grid and resolve the atmospheric using 137 levels from the surface up to a height of 80 km” [68].
For this study, the monthly GHI from the ERA5 database from 2005 to 2020 was obtained from the photovoltaic geographical information system (PVGIS) online tool version 5.2 released by the European Commission and Joint Research Centre (https://re.jrc.ec.europa.eu/pvg_tools/en/: accessed on 2 July 2022). The GHI dataset was derived for the four selected hydropower reservoirs in Laos as shown in Figure 1 and the monthly mean of 16 years of GHI for each reservoir was used to calculate the FPV energy output. Figure 4 illustrates the monthly GHI from the ERA5 dataset extracted for each location of the four reservoirs, and shows that there is high solar potential in the dry season, which reaches peak potential from March to April. For more details on how to obtain the GHI from ERA5 dataset, see the online PVGIS documentation tool described in [68].
These four hydropower projects were selected for setting up FPV because they are located near big cities and economic zones with high power demands, especially the capital, Vientiane and the central to southern part of Laos, as shown in Figure 1. To date, there is still no FPV development in these reservoirs.
This study performed an assessment of the FPV energy production based on the global formula for solar PV using Equation (6) as described in [35].
E = A * r * H * PR ,
where E is the energy output (kWh), A is the total solar panel area (m2), r is the solar yield or efficiency (%), H is the annual average solar radiation on a tilted surface without shading (kWh/m2), and PR is the performance ratio, a coefficient for losses in the solar system.
The authors of [69] suggested that the performance ratio (PR) of a photovoltaic system could reach around 90%. In a study that assessed the FPV potential in Africa, the PR value was assumed to be 0.8 [40]. Furthermore, the most recent commercial solar PV panels have a PR ranging from 15% to 20% [70]. For this study, the efficiency of solar PV panels and the performance ratio were assumed to be 15% and 0.75, respectively. The value of A and H represent the area of the hydropower reservoir and the monthly mean GHI, respectively, which are described in Figure 1 and Figure 4.

3. Results

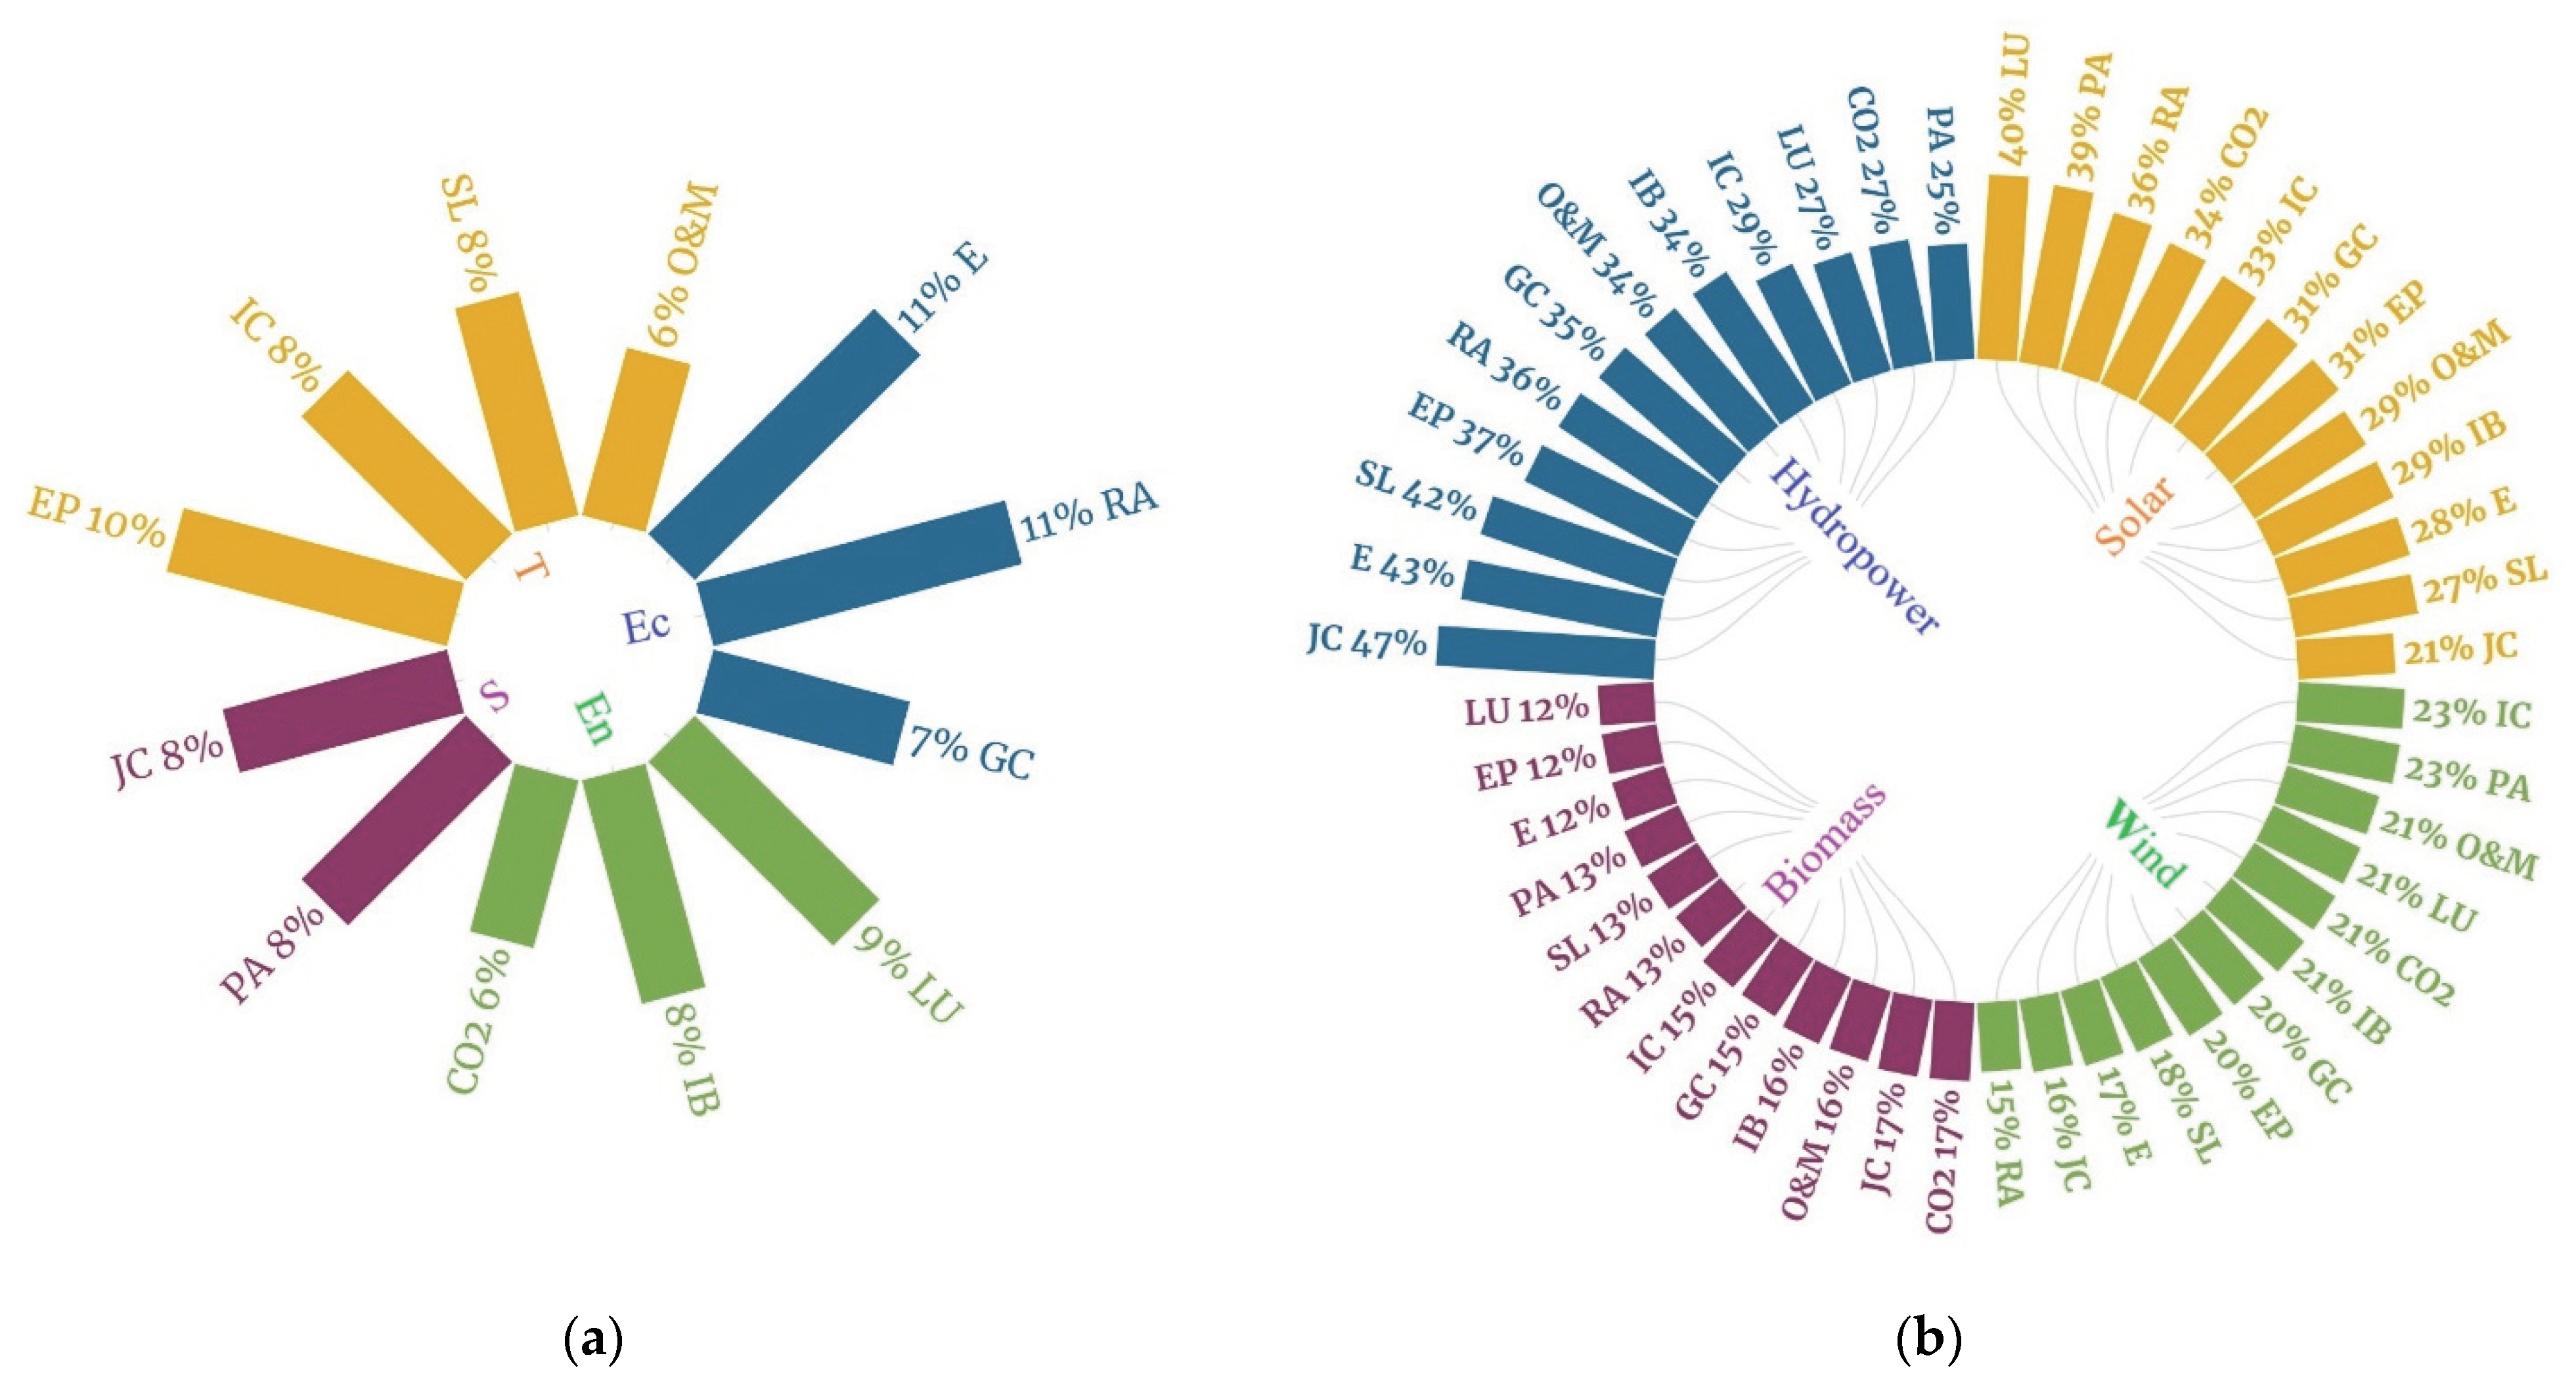
3.1. RE Prioritization

3.1.1. The Prioritization of All Respondents

Based on the judgments obtained from 31 DMs, it was revealed that the economic criterion secured the highest weightage of about 31% out of the four main criteria for determining the RE alternatives. The technological criterion was the second most important criterion (30%), followed by the environmental (23%) and social (16%) criterion. This indicated that the DMs considered the improvement of economic infrastructure was more important than the other factors. The aggregated pairwise comparison matrices of the main criteria are shown in Table 2.
The global weights of the twelve overall sub-criteria are presented in Figure 5a. The results illustrated that resource availability and efficiency were the most preferred sub-criterion with values of 11.5% and 10.7%, respectively. The operation and maintenance costs (6.1%) and CO2 emissions (6.2%) were ranked as the least weighted sub-criteria (see Appendix, Table A2. The local weights of the sub-criteria for all respondents).
Concerning the prioritization of RE alternatives with respect to the sub-criteria in Figure 5b, it was demonstrated that hydropower was the most preferred alternative in terms of job creation (47%) and efficiency (43%). Land use (40%) was the most influential criteria for solar, which indicates that setting up a solar power plant requires a very large land area. The wind alternative had more impact on the investment cost (23%) and public acceptance (23%); however, for biomass, there was not much difference among the sub-criteria weightages.
The results for the final relative weights of the alternatives demonstrated that hydropower was the most highly weighted alternative, at about 35%, out of the four RE alternatives. This means that hydropower was considered to be the most remarkable resource for electricity generation, according to the DMs’ judgments. The second most preferred alternative was solar at 32%, followed by wind (19%), and biomass (14%).
The CR value were checked for all comparison matrices of all respondents and the value was below 0.1 or less than 10%, which showed that the judgments of the DMs were acceptable.

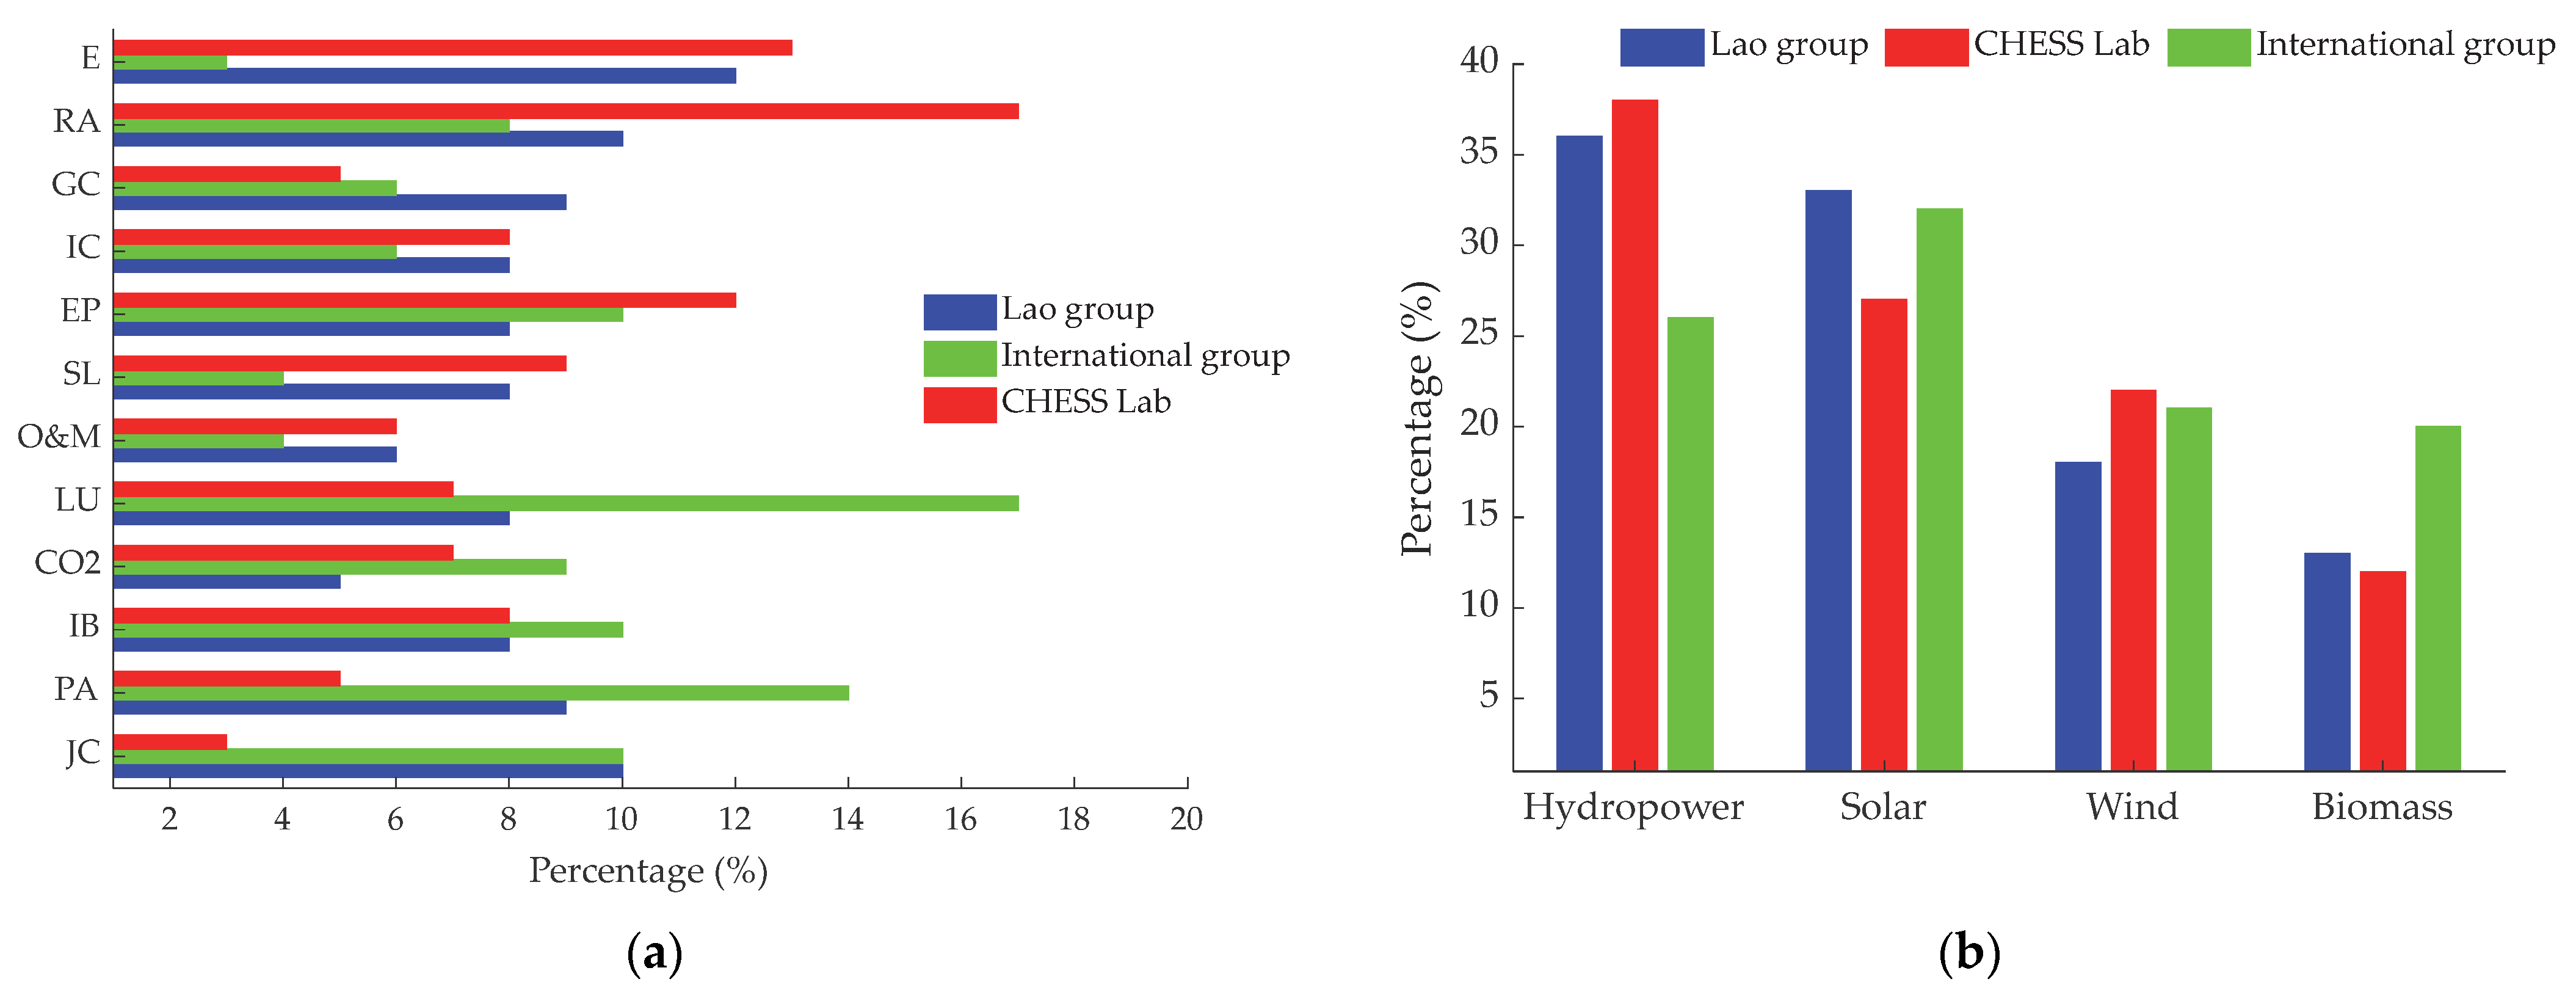
3.1.2. Prioritization of the Three Groups

Figure 6 shows the relative weights of the main criteria of the three groups. It was revealed that the international group prioritized the environmental criterion as it had the highest weightage of about 36% out of the four main criteria for long-term energy planning. The main social and economic criteria obtained homogeneous weights and the technological main criteria was the least weighted.
The preference of the international group illustrates a perspective that is typical of a developed country, as the environmental and social factors obtained higher priority. The results for the other two groups showed a similar ranking, with the economic and technological as the two highest weighted criteria. This means that the DMs’ judgments were focused more on boosting the economy and improving the power supply security.
The global weights of the twelve sub-criteria for the three groups are given in Figure 7a. The results indicated that efficiency, job creation, and resource availability were the most preferred sub-criterion for the Lao group, with values of 11.9%, 9.7%, and 9.6%, respectively. This indicates that the DMs in Laos are significantly more focused on enhancing power system stability and creating more job opportunities for the local communities. However, the results from the international group showed a commitment to the sub-criteria associated with environmental and social main criteria, of which the highest and lowest weighted sub-criterion were land use and efficiency with values of 17.01% and 2.72%, respectively. The results from the CHESS Lab group, were not very different from the Lao group in regard to the resource availability and efficiency sub-criterion. Nevertheless, the sub-criterion pertaining to social criteria, including the grid connectivity, were least favored.
The relative weights of the RE alternatives of the three groups are shown in Figure 7b. It was affirmed that the judgements of the DMs in the Lao and CHESS lab group are homogeneous, that is, hydropower was ranked as the most highly weighted alternative, with values of 36%, and 38%, respectively. However, the international group concluded that solar was the most significant alternative, with a value of 32%, out of the four RE alternatives. The second most preferred was hydropower at 26%. The relative weights of wind and biomass alternatives received the same ranking among the three groups, and were placed third and fourth out of the four alternatives, respectively.

3.1.3. Sensitivity Analysis

The concept of sensitivity analysis (SA) is used to verify the robustness of the output by varying the input data [71,72]. According to Chen et al. [72], there are two main SA techniques. The first technique is local sensitivity analysis, which is also known as “one-at-a-time” analysis. This technique is used to reassess the output by adjusting one input value at a time while other input remains unchanged. The second technique, global sensitivity analysis, is used to change all the input values simultaneously to determine if there is any difference in the output.
For this study, the RE alternatives’ weights (output) were evaluated by randomly modifying the main criteria weights (input). Both techniques of SA were applied to five different cases. Case 1 modified all the main criteria with equal weights or 25% for each criterion. For Case 2 to Case 5, each of the main criterion was individually set at 40%, while the other three main criteria weights remained equal to 20% for each case.
The results of the SA of the five cases are shown in Figure 8. It was strongly affirmed that hydropower was the most highly considered of the four alternatives in all cases. On this basis, it is believed that the AHP results are sensitive in terms of the final ranking of the RE alternatives.

3.2. Floating Photovoltaic Potential

Based on the dataset and assumptions described in Section 2.3, the FPV potential was estimated for the four selected hydropower reservoirs. In this study, the estimation of FPV energy was performed in five cases by using 2%, 5%, 10%, 20%, and 30% water surface coverage of the four above-mentioned reservoirs. The annual estimated FPV output was about 2087.9 GWh/year, 5219.7 GWh/year, 10,439.5 GWh/year, 20,878.9 GWh/year, and 31,318.4 GWh/year for each case, respectively.
Figure 9a illustrates the total monthly FPV energy production for five cases of water surface coverage of the four hydropower reservoirs. It reveals that there is high FPV potential in the dry season (November to May), and peak generation is reached during March and April as this is the extremely hot period in Laos. From this point of view, implementing the FPV option would be the most suitable and effective technology in terms of enhancing seasonal power supply security.
Based on the national power development strategy 2021-2030 (NPDS 2021-2030) released by the Ministry of Energy and Mines (MEM) of Laos [49], the seasonal power supply and demand gap will not be solved by 2030 as there is a huge power surplus during the wet season, on the contrary, there is a lack of power supply in the dry season. As a result, a large number of hydropower projects continue to be developed, that is, about 30 projects out of 39 new power projects. See Appendix A, Table A3 for a list of power projects to be developed by 2030 as indicated in the NPDS 2021-2030 of Laos.
Thus, this study proposed the implementation of FPV to address this gap between the power supply and demand. Figure 9b presents the comparison between the predicted power supply and demand by 2030 as indicated in the NPDS 2021-2030 and the energy production from the proposed FPV. By combining the existing power supply in 2020 with the FPV output from a 10% coverage of the water surface in the four reservoirs, it was demonstrated that the gap in the seasonal power supply and demand by 2030 could be fully addressed with an energy surplus of about 5100 GWh/year. This means that the proposed FPV would be much more beneficial than those 39 projects in terms of seasonal power supply security.

4. Discussion: National Power Development Strategy

The findings regarding RE prioritization in this study complied with the Lao energy policy [64], [65] and plan [49]. Based on the Lao energy policy and plans, hydropower is the top priority alternative for long-term electricity generation, which is consistent with the AHP results of this study. As indicated in the NPDS 2021-2030, the Lao government also plan to build several coal power plants. However, coal thermal power was excluded in this study because it is regarded as an exhausted and non-environmentally friendly energy source compared to renewables.
With regard to the main criteria, this study considered four criteria that are consistent with the Lao policy on sustainable hydropower development [65]. Notwithstanding, the three main criteria considered in the NPDS 2021-2030 are power supply security (which is identical to the technological criterion in this study), economic and environmental criteria. Social criteria are not highlighted in the NPDS 2021-2030, especially the public acceptance aspect. Overall, seven sub-criteria are discussed in the NPDS 2021-2030, including energy price, grid connectivity, efficiency, investment cost, resource availability, land use, and job creation.
Table 3 illustrates the comparison between the results of this study and the NDPS 2021-2030.
To the best of the authors’ knowledge, the RE alternatives and associated criteria were not specifically prioritized during the planning process in the Lao energy policy and plan. As described in Figure 9b, the gap between the power supply and demand forecast by 2030 is not addressable because hydropower development will continue to be on-going. Additionally, it is crucial to consider other factors for long-term energy planning, especially environmental and social factors. Several power projects have failed and caused significant damage to the environment and the livelihoods of the local communities, even though the project itself has undertaken social and environmental impact assessments. For instance, the failure of the Saddle Dam of the Xepien-Xenamnoy hydropower project in the southern part of Laos in 2018 [73]. Therefore, this could be a major reason that social and environmental factors acquired the highest weights in the international group.
Furthermore, the results of the AHP were also checked using the fuzzy AHP method, which is an extension of the AHP to deal with uncertainties in the judgments of the DMs. The scale of importance uses triangular fuzzy numbers instead a of crisp value [74]. The results from the fuzzy AHP were similar to those of AHP regarding the ranking of alternatives, main criteria, and sub-criteria. This indicated that the results of this study are robust using the AHP method. The final relative weights of the alternatives of the fuzzy AHP and AHP are presented in Table 4. To compare the relative weights of the fuzzy AHP and AHP, it is necessary to convert the fuzzy weights to crisp values. The center of area is the most common method used to defuzzify the fuzzy weights [75].

5. Conclusions

This study provided a significant insight into prioritizing RE resources for long-term electricity generation planning and enhancing seasonal power supply, on the basis of heavy reliance on hydropower, as is the case in Laos. In this study, four RE alternatives were prioritized with regard to four main criteria and twelve overall sub-criteria for sustainable electricity generation planning in Laos under the AHP approach. The thirty-one respondents who participated in the survey included high-level government decision-makers, economists, energy experts, and academic researchers from various local and international organizations.
Hydropower was endorsed as the best alternative in terms of efficiency and energy price, while land use received the highest weight for solar. However, investment costs and CO2 emissions were the most influential sub-criteria for wind and biomass alternatives, respectively.
The results of this study are in agreement with Lao energy policy and planning. Moreover, this study proposed the use of hybrid FPV and hydropower systems for enhancing seasonal power supplies. Furthermore, this study proved that the FPV energy produced from only 2% coverage of the four hydropower reservoirs could cover about two-thirds of the total power imported (1489 GWh) in 2020. In addition, the electricity demand forecast in the BAU scenario by 2030, as indicated in the power development plan, could be fully covered with an additional energy surplus of about 5100 GWh/year by combining the power supply in 2020 with the FPV energy production from 10% coverage of the above-mentioned reservoirs.
This study examines the prioritization of RE resources for sustainable electricity generation planning in Laos by considering multiple dimensions. In terms of the decision-making and energy planning processes, the method applied in this study could be a crucial tool to be incorporated for long-term energy planning. In addition, the results of this study could provide an essential reference for the government to move forward and invest in an FPV–hydropower hybrid power generation system to enhance seasonal power supply security as well as to meet the sustainable development goals of the country.
This study serves as a significant foundation for relevant future studies. For instance, the cost and benefits analysis of the FPV–hydropower system, including the social and environmental impact assessment of such a hybrid system.

Author Contributions

Conceptualization, Y.N.; writing—original draft preparation, Y.N.; validation, H.S.L.; writing—reviewing and editing, H.S.L., S.W.C. and J.S.C. All authors have read and agreed to the published version of the manuscript.

Funding

This research received no external funding.

Data Availability Statement

The data presented in this study are available on request from the corresponding author.

Acknowledgments

The first author is supported by the Project for Human Resource Development Scholarship (JDS), Japan. The authors thank all the respondents for filling out the questionnaires in this study.

Conflicts of Interest

The authors declare no conflict of interest.

Appendix A. Survey Information

Table A1. Details of the survey respondents.
OrganizationPositionWorking Experience (Average Year)Number of
Respondents
Ministry of
Energy and Mines
Department of Energy Policy and PlanningDeputy director general145
Head of division
Deputy dead of division
Department of LawDirector general202
Deputy director general
Department of Energy ManagementDeputy director general221
Department of Energy and Mines Vientiane CapitalHead of Office91
Ministry of
Natural Resource and Environment
Department of LandDeputy director general111
Department of Planning and CooperationHead of division91
Ministry of Public Work and TransportationDepartment of Cooperation and PlanningTechnical Officer51
National University of Laos, Faculty of Economic and AdministrationChief of Public Economic Unit151
Department of Education and Sports
Vientiane Capital
Deputy director general211
Party’s Commission for Propaganda and Training of Vientiane CapitalHead of Committee381
Electricite du Laos Generation Public CompanyDepartment of Power GenerationDeputy Manager92
Department of Business DevelopmentTechnical Officer
Lao Energy Security ProjectConsultant131
Academic ResearcherIndependent researcher131
USAID and Australia Mekong SafeguardsConsultant on Energy Planning122
World Bank LaosRetired consultant501
Hiroshima UniversityAssociate professor201
CHESS Lab, Hiroshima UniversityAcademic researchers (doctoral & Master) 8
Table A2. Local weights of the sub-criteria of total respondents.
Sub-CriteriaWeights
Efficiency0.360
Resource availability0.388
Grid connectivity0.253
Investment cost0.246
Energy price0.311
Service life0.247
Operation and maintenance cost0.196
Land use0.381
CO2 emission0.265
Impacts on biodiversity0.354
Public acceptance0.527
Job creation0.473
Table A3. List of power projects to be developed by 2030 indicated in the NPDS 2021-2030.
No.Project NameLocation (Province)Installed Capacity (MW)
Hydropower
1Nam Sim Huaphan8.4
2Nam Ao Xiengkhouang15
3Nam Hinboun downstream Khammouan15
4Nam Ngum 1 extension Unit 6 Vientiane40
5Nam Tha Bokeo15
6Nam Ngiep 2A Xaisomboun12.6
7Nam Talan Luangnamtha5
8Nam Ou 3 Luangprabang210
9Nam Ou 4 Phonsaly132
10Nam Ou 7 Phongsaly210
11HouayLamphan downstream Xekong15
12Nam Theun 1 Bolikhamxay130
13Nam Hinboun Khammouan30
14Nam Hong 1 Xaiyabury15
15Nam Ngao Bokeo15
16Nam Hao Huaphan15
17Houaynyoi-Houaykhot Champasak15
18Nam Mon 1 Huaphan10
19Houay Kapeur Saravan5
20Nam Pounglo Bokeo5
21Nam Phoun Xaiyabury45
22Nam Samoi Vientiane5
23Houay Palai Champasak30
24Nam Tang Bolikhamxay12.8
25Houaysai Mekong Bolikhamxay13.6
26Nam Chae Xaisomboun7.5
27Pak Ngum Vientiane capital80
28Xebangfai 1 Savannakhet110
29Luangprabang Mekong Luangprabang60
30Houay Ho (retirement) Attapue150
Solar Photovoltaic
1Solar farm Bolikhamxay30
2Floating Solar Xaisomboun300
3Solar farm Vientiane capital68
4Solar farm Khammouan50
5Solar farm Savannakhet50
Coal Thermal
1Coal thermal Namphan Xiengkhouang170
2Coal thermal (Bualapha) Khammouan200
3Coal thermal Savannakhet75
4Coal thermal Sekong100
Total2436

References

  1. BP Energy. Statistical Review of World Energy globally consistent data on world energy markets and authoritative publications in the field of energy. BP Energy Outlook 2021, 70, 8–20. [Google Scholar]
  2. Alizadeh, R.; Soltanisehat, L.; Lund, P.D.; Zamanisabzi, H. Improving renewable energy policy planning and decision-making through a hybrid MCDM method. Energy Policy 2020, 137, 111174. [Google Scholar] [CrossRef]
  3. Kolagar, M.; Hosseini, S.M.H.; Felegari, R.; Fattahi, P. Policy-making for renewable energy sources in search of sustainable development: A hybrid DEA-FBWM approach. Environ. Syst. Decis. 2020, 40, 485–509. [Google Scholar] [CrossRef]
  4. Ali, T.; Aghaloo, K.; Chiu, Y.R.; Ahmad, M. Lessons learned from the COVID-19 pandemic in planning the future energy systems of developing countries using an integrated MCDM approach in the off-grid areas of Bangladesh. Renew. Energy 2022, 189, 25–38. [Google Scholar] [CrossRef] [PubMed]
  5. Shahzadi, I.; Yaseen, M.R.; Iqbal Khan, M.T.; Amjad Makhdum, M.S.; Ali, Q. The nexus between research and development, renewable energy and environmental quality: Evidence from developed and developing countries. Renew. Energy 2021, 190, 1089–1099. [Google Scholar] [CrossRef]
  6. Sueyoshi, T.; Mo, F.; Wang, D.D. Sustainable development of countries all over the world and the impact of renewable energy. Renew. Energy 2022, 184, 320–331. [Google Scholar] [CrossRef]
  7. Østergaard, P.A.; Duic, N.; Noorollahi, Y.; Mikulcic, H.; Kalogirou, S. Sustainable development using renewable energy technology. Renew. Energy 2020, 146, 2430–2437. [Google Scholar] [CrossRef]
  8. Solangi, Y.A.; Longsheng, C.; Shah, S.A.A. Assessing and overcoming the renewable energy barriers for sustainable development in Pakistan: An integrated AHP and fuzzy TOPSIS approach. Renew. Energy 2021, 173, 209–222. [Google Scholar] [CrossRef]
  9. Munier, N.; Hontoria, E.; Jiménez-Sáez, F. Strategic Approach in Multi-Criteria Decision Making; Springer: Cham, Switzerland, 2019; Volume 275. [Google Scholar]
  10. Shao, M.; Han, Z.; Sun, J.; Xiao, C.; Zhang, S.; Zhao, Y. A review of multi-criteria decision making applications for renewable energy site selection. Renew. Energy 2020, 157, 377–403. [Google Scholar] [CrossRef]
  11. Kumar, A.; Sah, B.; Singh, A.R.; Deng, Y.; He, X.; Kumar, P.; Bansal, R.C. A review of multi criteria decision making (MCDM) towards sustainable renewable energy development. Renew. Sustain. Energy Rev. 2017, 69, 596–609. [Google Scholar] [CrossRef]
  12. Chiu, W.H.; Lin, W.C.; Chen, C.N.; Chen, N.P. Using an analytical hierarchy process to analyze the development of the green energy industry. Energies 2021, 14, 4452. [Google Scholar] [CrossRef]
  13. Chanchawee, R.; Usapein, P. Ranking of renewable energy for the national electricity plan in Thailand Using an Analytical Hierarchy Process (AHP). Int. J. Renew. Energy Res. 2018, 8, 1553–1562. [Google Scholar]
  14. Ahmad, S.; Tahar, R.M. Selection of renewable energy sources for sustainable development of electricity generation system using analytic hierarchy process: A case of Malaysia. Renew. Energy 2014, 63, 458–466. [Google Scholar] [CrossRef]
  15. Al Garni, H.; Kassem, A.; Awasthi, A.; Komljenovic, D.; Al-Haddad, K. A multicriteria decision making approach for evaluating renewable power generation sources in Saudi Arabia. Sustain. Energy Technol. Assess. 2016, 16, 137–150. [Google Scholar] [CrossRef]
  16. Mirjat, N.H.; Uqaili, M.A.; Harijan, K.; Mustafa, M.W.; Rahman, M.M.; Khan, M.W.A. Multi-criteria analysis of electricity generation scenarios for sustainable energy planning in Pakistan. Energies 2018, 11, 757. [Google Scholar] [CrossRef] [Green Version]
  17. Ahmad, S.; Nadeem, A.; Akhanova, G.; Houghton, T.; Muhammad-Sukki, F. Multi-criteria evaluation of renewable and nuclear resources for electricity generation in Kazakhstan. Energy 2017, 141, 1880–1891. [Google Scholar] [CrossRef]
  18. Abdul, D.; Jiang, W.; Tanveer, A. Prioritization of renewable energy source for electricity generation through AHP-VIKOR integrated methodology. Renew. Energy 2022, 184, 1018–1032. [Google Scholar] [CrossRef]
  19. Dinmohammadi, A.; Shafiee, M. Determination of the most suitable technology transfer strategy for wind turbines using an integrated AHP-TOPSIS decision model. Energies 2017, 10, 5. [Google Scholar] [CrossRef] [Green Version]
  20. Ayik, A.; Ijumba, N.; Kabiri, C.; Goffin, P. Selection of Off-Grid Renewable Energy Systems Using Analytic Hierarchy Process: Case of South Sudan. In Proceedings of the 2020 IEEE PES/IAS PowerAfrica, Nairobi, Kenya, 25–28 August 2020. [Google Scholar] [CrossRef]
  21. Demirtas, O. Evaluating the best renewable energy technology for sustainable energy planning. Int. J. Energy Econ. Policy 2013, 3, 23–33. [Google Scholar]
  22. Ervural, B.C.; Evren, R.; Delen, D. A multi-objective decision-making approach for sustainable energy investment planning. Renew. Energy 2018, 126, 387–402. [Google Scholar] [CrossRef]
  23. Zaidi, M.F.A.; Shafie, S.M.; Rahim, M.K.I.A. AHP model for selection of sustainable energy: A focus on power generation and supplying for end-users. Int. J. Supply Chain Manag. 2020, 9, 227–233. [Google Scholar]
  24. Shatnawi, N.; Abu-Qdais, H.; Qdais, F.A. Selecting renewable energy options: An application of multi-criteria decision making for Jordan. Sustain. Sci. Pract. Policy 2021, 17, 210–220. [Google Scholar] [CrossRef]
  25. Ahp, H.P. Selecting Renewable Energy Sources for Small Islands Using Analytical Selecting Renewable Energy Sources for Small Islands Using Analytical Hierarchy Process (AHP) Fırat E mir Submitted to the Institute of Graduate Studies and Research in Partial Fulfil. Ph.D. Thesis, Eastern Mediterranean University, Gazimağusa, Cyprus, 2013. [Google Scholar] [CrossRef]
  26. Tuy, S.; Soo, H.; Chreng, K. Integrated assessment of offshore wind power potential using Weather Research and Forecast (WRF) downscaling with Sentinel-1 satellite imagery, optimal sites, annual energy production and equivalent CO2 reduction. Renew. Sustain. Energy Rev. 2022, 163, 112501. [Google Scholar] [CrossRef]
  27. Colak, H.E.; Memisoglu, T.; Gercek, Y. Optimal site selection for solar photovoltaic (PV) power plants using GIS and AHP: A case study of Malatya Province, Turkey. Renew. Energy 2020, 149, 565–576. [Google Scholar] [CrossRef]
  28. Ali, Y.; Butt, M.; Sabir, M.; Mumtaz, U.; Salman, A. Selection of suitable site in Pakistan for wind power plant installation using analytic hierarchy process (AHP). J. Control Decis. 2018, 5, 117–128. [Google Scholar] [CrossRef]
  29. Oryani, B.; Koo, Y.; Rezania, S.; Shafiee, A. Barriers to renewable energy technologies penetration: Perspective in Iran. Renew. Energy 2021, 174, 971–983. [Google Scholar] [CrossRef]
  30. Pathak, S.K.; Sharma, V.; Chougule, S.S.; Goel, V. Prioritization of barriers to the development of renewable energy technologies in India using integrated Modified Delphi and AHP method. Sustain. Energy Technol. Assess. 2022, 50, 101818. [Google Scholar] [CrossRef]
  31. Zhou, S.; Yang, P. Risk management in distributed wind energy implementing Analytic Hierarchy Process. Renew. Energy 2020, 150, 616–623. [Google Scholar] [CrossRef]
  32. Kul, C.; Zhang, L.; Solangi, Y.A. Assessing the renewable energy investment risk factors for sustainable development in Turkey. J. Clean. Prod. 2020, 276, 124164. [Google Scholar] [CrossRef]
  33. Cabrera, J.S.; Lee, H.S. Flood-prone area assessment using GIS-based multi-criteria analysis: A case study in Davao Oriental, Philippines. Water 2019, 11, 2203. [Google Scholar] [CrossRef] [Green Version]
  34. Cabrera, J.S.; Lee, H.S. Flood risk assessment for Davao Oriental in the Philippines using geographic information system-based multi-criteria analysis and the maximum entropy model. J. Flood Risk Manag. 2020, 13, e12607. [Google Scholar] [CrossRef] [Green Version]
  35. Worldbank. Where Sun Meets Water. Where Sun Meets Water 2019, 9. [Google Scholar] [CrossRef]
  36. Sahu, A.; Yadav, N.; Sudhakar, K. Floating photovoltaic power plant: A review. Renew. Sustain. Energy Rev. 2016, 66, 815–824. [Google Scholar] [CrossRef]
  37. Patil, S.S.; Wagh, M.M.; Shinde, N.N. A review on floating solar photovoltaic power plants. Int. J. Sci. Eng. Res. 2017, 8, 789–794. [Google Scholar]
  38. Lee, N.; Grunwald, U.; Rosenlieb, E.; Mirletz, H.; Aznar, A.; Spencer, R.; Cox, S. Hybrid floating solar photovoltaics-hydropower systems: Benefits and global assessment of technical potential. Renew. Energy 2020, 162, 1415–1427. [Google Scholar] [CrossRef]
  39. Rauf, H.; Gull, M.S.; Arshad, N. Integrating floating solar PV with hydroelectric power plant: Analysis of Ghazi barotha reservoir in Pakistan. Energy Procedia 2019, 158, 816–821. [Google Scholar] [CrossRef]
  40. Gonzalez Sanchez, R.; Kougias, I.; Moner-Girona, M.; Fahl, F.; Jäger-Waldau, A. Assessment of floating solar photovoltaics potential in existing hydropower reservoirs in Africa. Renew. Energy 2021, 169, 687–699. [Google Scholar] [CrossRef]
  41. Solomin, E.; Sirotkin, E.; Cuce, E.; Selvanathan, S.P.; Kumarasamy, S. Hybrid floating solar plant designs: A review. Energies 2021, 14, 2751. [Google Scholar] [CrossRef]
  42. Agrawal, K.K.; Jha, S.K.; Mittal, R.K.; Vashishtha, S. Assessment of floating solar PV (FSPV) potential and water conservation: Case study on Rajghat Dam in Uttar Pradesh, India. Energy Sustain. Dev. 2022, 66, 287–295. [Google Scholar] [CrossRef]
  43. Mamatha, G.; Kulkarni, P.S. Assessment of floating solar photovoltaic potential in India’s existing hydropower reservoirs. Energy Sustain. Dev. 2022, 69, 64–76. [Google Scholar] [CrossRef]
  44. Hafeez, H.; Kashif Janjua, A.; Nisar, H.; Shakir, S.; Shahzad, N.; Waqas, A. Techno-economic perspective of a floating solar PV deployment over urban lakes: A case study of NUST lake Islamabad. Sol. Energy 2022, 231, 355–364. [Google Scholar] [CrossRef]
  45. Padilha Campos Lopes, M.; Nogueira, T.; Santos, A.J.L.; Castelo Branco, D.; Pouran, H. Technical potential of floating photovoltaic systems on artificial water bodies in Brazil. Renew. Energy 2022, 181, 1023–1033. [Google Scholar] [CrossRef]
  46. Kakoulaki, G.; Gonzalez-Sanchez, R.; Gracia Amillo, A.; Szabó, S.; De Felice, M.; Farinosi, F.; De Felice, L.; Bisselink, B.; Seliger, R.; Kougias, I.; et al. Benefits of Pairing Floating Solar Photovoltaic with Hydropower Reservoirs in Europe (National and Regional Level). SSRN Electron. J. 2022. [Google Scholar] [CrossRef]
  47. López, M.; Soto, F.; Hernández, Z.A. Assessment of the potential of floating solar photovoltaic panels in bodies of water in mainland Spain. J. Clean. Prod. 2022, 340, 130752. [Google Scholar] [CrossRef]
  48. MEM. “Energy and Mines Statistics,” Vientiane Capital. 2022; Unpublished report. [Google Scholar]
  49. MEM. “National Power Development Strategy 2021–2030,” Vientiane Capital. 2021. Available online: https://www.mem.gov.la/?page_id=195. (accessed on 25 July 2022).
  50. MEM. “Renewable energy development strategy in Lao PDR,” Vientiane Capital. 2011. Available online: https://data.laos.opendevelopmentmekong.net/en/dataset/renewable-energy-development-strategy-in-lao-pdr (accessed on 25 July 2022).
  51. Macronconsulting. Lao PDR Power Sector Reform Development Strategy. 2016. Task 1. Vientiane Capital. Unpublished report.
  52. ADB. Lao People’s Democratic Republic: Energy Sector Assessment, Strategy, and Road Map; 2019. [Google Scholar] [CrossRef] [Green Version]
  53. Changsaveng, B.; Daovong, P. Economic rent from hydropower development in the case of Lao PDR. Gmsarn sarn Int. J. 2013, 7, 42. [Google Scholar]
  54. Sayatham, M.; Suhardiman, D. Hydropower resettlement and livelihood adaptation: The Nam Mang 3 project in Laos. Water Resour. Rural Dev. 2015, 5, 17–30. [Google Scholar] [CrossRef]
  55. Sparkes, S. Sustainable hydropower development: Theun-Hinboun expansion project case study, Laos. Water Resour. Rural Dev. 2014, 4, 54–66. [Google Scholar] [CrossRef]
  56. Vorabout, K.; Surawanitkun, C.; Kaewrawang, A. Electrical Effects of Wind Energy Generation on Power System in Area of the Central II Part, Lao People’s Democratic Republic. KKU Res. J. 2019, 19, 35–48. [Google Scholar]
  57. Sayaxang, L.; Premrudeepreechacharn, S.; Ngamsanroaj, K. Hydropower Cooperation for Firm Power Production of Hydropower Plants System in Central 1 Region of Laos People’s Democratic Republic. GMSARN Int. J. 2021, 15, 82–88. [Google Scholar]
  58. Macronconsulting. Lao PDR Power Sector Reform Development Strategy. 2017. Task 2. Vientiane Capital. Unpublished report.
  59. PwC. Enhancing Financial Sustainability of the Power Sector in Lao PDR and Developing a Suitable Power Tariff Regime. 2017. Vientiane Capital. Unpublished report.
  60. MEM. “Lao PDR Energy Outlook 2020,” Econ. Res. Inst. ASEAN East Asia, no. 19, 2020. Available online: eria.org/uploads/media/Research-Project-Report/Lao-Energy-Outlook-2020/Lao-PDR-Energy-Outlook-2020.pdf (accessed on 25 July 2022).
  61. Binnington, T. Renewable Energy Zones in Lao PDR: Updated Results of Study Area Analysis REZ Process Steps: Reminder. 2019. Available online: https://usaidcleanpowerasia.aseanenergy.org/resource/renewable-energy-zones-in-lao-pdr-updated-results-of-study-area-analysis/ (accessed on 24 May 2022).
  62. Stout, S.; Lee, N.; Vogel, J.; Giangola, L. Power Sector Resilience Action Plan for Lao PDR. 2019. Available online: http://usaidcleanpowerasia.aseanenergy.org/resource/power-sector-resilience-action-plan-for-lao-pdr/ (accessed on 24 May 2022).
  63. Campos-guzmán, V.; García-cáscales, M.S.; Espinosa, N.; Urbina, A. Life Cycle Analysis with Multi-Criteria Decision Making: A review of approaches for the sustainability evaluation of renewable energy technologies. Renew. Sustain. Energy Rev. 2019, 104, 343–366. [Google Scholar] [CrossRef]
  64. MEM. “Energy Policy of Lao PDR,” Vientiane Capital. 2020; Unpublished. [Google Scholar]
  65. MEM. Policy Guidelines for the Implementation of Policy on Sustainable Hydropower Development in Lao PDR. Vientiane Capital. 2015. Available online: https://policy.asiapacificenergy.org/sites/default/files/PSHDguidelines.pdf (accessed on 20 June 2022).
  66. Saaty, R.W. The analytic hierarchy process-what it is and how it is used. Math. Model. 1987, 9, 161–176. [Google Scholar] [CrossRef] [Green Version]
  67. Forman, E.; Peniwati, K. Aggregating individual judgments and priorities with the Analytic Hierarchy Process. Eur. J. Oper. Res. 1998, 108, 165–169. [Google Scholar] [CrossRef]
  68. PVGIS. Photovoltaic Geographical Information System. Commission European, Joint Research Centre. 2022. Available online: https://re.jrc.ec.europa.eu/pvg_tools/en/ (accessed on 18 July 2022).
  69. Reich1, N.H.; Mueller, B.; Armbruster, A.; van Sark, W.G.J.H.M.; Kiefer, K.; Reise, C. Performance ratio revisited: Is PR > 90% realistic? Prog. Photovolt. Res. Appl. 2012, 20, 6–11. [Google Scholar] [CrossRef]
  70. Center for Sustainable Systems. “Photovoltaic Energy Factsheet,” Sustainable Factsheet, Publication No. CSS07-08. 2021. Available online: https://css.umich.edu/publications/factsheets/energy/photovoltaic-energy-factsheet (accessed on 18 July 2022).
  71. Erkut, E.; Tarimcilar, M. On Sensitivity Analysis in the Analytic Hierarchy Process. IMA J. Manag. Math. 1991, 3, 61–83. [Google Scholar] [CrossRef]
  72. Chen, R.; Tsay, Y.S. An integrated sensitivity analysis method for energy and comfort performance of an office building along the chinese coastline. Buildings 2021, 11, 371. [Google Scholar] [CrossRef]
  73. Latrubesse, E.M.; Park, E.; Sieh, K.; Dang, T.; Lin, Y.N.; Yun, S.H. Dam failure and a catastrophic flood in the Mekong basin (Bolaven Plateau), southern Laos, 2018. Geomorphology 2020, 362, 107221. [Google Scholar] [CrossRef]
  74. Buckley, J.J. Fuzzy hierarchical analysis. Fuzzy Sets Syst. 1985, 17, 233–247. [Google Scholar] [CrossRef]
  75. Liu, Y.; Eckert, C.M.; Earl, C. A review of fuzzy AHP methods for decision-making with subjective judgements. Expert Syst. Appl. 2020, 161, 113738. [Google Scholar] [CrossRef]
Figure 1. Map of Laos highlighting the provincial boundaries and the location of the four existing hydropower reservoirs considered for FPV potential estimation.
Energies 15 08243 g001
Figure 2. The structure of the AHP, adapted from [16].
Energies 15 08243 g002
Figure 3. Summary of the AHP algorithm and computation steps.
Energies 15 08243 g003
Figure 4. Monthly mean global horizontal irradiance from 2005 to 2020 of the four existing hydropower reservoirs in Laos.
Energies 15 08243 g004
Figure 5. (a) Global weights of the sub-criteria; (b) RE alternatives priorities with respect to the sub-criteria.
Energies 15 08243 g005
Figure 6. Relative weights of the main criteria of the three groups.
Energies 15 08243 g006
Figure 7. (a) Global weights of the sub-criteria of the three groups; (b) Relative weights of the RE alternatives of the three groups.
Energies 15 08243 g007
Figure 8. Results of the sensitivity analysis in five cases.
Energies 15 08243 g008
Figure 9. Results of estimated FPV potential. (a) Monthly sum FPV energy output for five cases of water surface coverage from four hydropower reservoirs; (b) comparison between the predicted power supply and demand by 2030 indicated in the NPDS 2021-2030 and the energy production of the proposed FPV output from 10% water surface coverage in four hydropower reservoirs.
Energies 15 08243 g009
Table 1. Description of the main criteria, sub-criteria, and RE alternatives.
AlternativesDescription
HydropowerThe electricity generated from the hydropower plant
Solar The electricity generated from the solar power plant
Wind The electricity generated from the wind power plant
BiomassThe electricity generated from biomass power plant, such as agricultural crops
Main criteriaDescription
Technological (T)Refers to the substantial energy resources and the capability to generate and supply electricity
Economic (Ec)Refers to the cost effectiveness and robustness of the power project
Environmental (En)Refers to the environmental impacts of the power project
Social (S)Refers to the community impacts of the power project
Sub-criteriaDescription
Efficiency (E) Refers to the effectiveness and capacity of the energy output from the power project
Resource availability (RA) Refers to the accessibility to energy resources for electricity production
Grid connectivity (GC)Refers to capability to connect to the power system
Investment cost (IC)Refers to the total cost of the power project
Energy price (EP)Refers to the price of electricity generated from the power project
Service life (SL)Refers to the robustness or durability of the power project
Operation and maintenance cost (O&M)Refers to the expenses for operating and maintenance of the power plant after being constructed
Land use (LU)Refers to the land area required for the power project
CO2 emission (CO2)Refers to the pollutants released from the power project that contaminate the atmosphere
Impacts on biodiversity (IB)Refers to the effects or consequences caused by the power project, for instance, the destruction of forests, wildlife, fish, etc.
Public acceptance (PA)Refers to the willingness and collaboration of the local community on the power project
Job creation (JC)Refers to the employment opportunities that the local communities could gain from the power project
Table 2. Aggregated pairwise comparison matrices of the main criteria for all respondents.
TEcEnSWeightsCR
Technological (T)11.121.091.880.2970.016
Economic (Ec)0.8911.781.700.311
Environmental (En)0.920.5611.660.234
Social (S)0.530.590.6010.158
Table 3. Comparison between the criteria and alternatives of energy resources in the NPDS 2021-2030 and this study.
NPDS 2021-2030This study
Main criteriaPower supply securityTechnological
EconomicEconomic
EnvironmentalEnvironmental
Social
Sub-criteriaEnergy price, grid connectivity,
efficiency, investment cost, resource availability, land use, job creation
Resource availability, efficiency, energy price, land use, public acceptance, impacts on biodiversity, service life, investment cost, job creation, grid connectivity, CO2 emission, operation and maintenance cost
AlternativesHydropowerHydropower
CoalSolar
SolarWind
BiomassBiomass
Wind
Table 4. Comparison between alternative weights of AHP and fuzzy AHP.
AlternativesFuzzy AHP WeightsAHP Weights
Hydropower0.1550.3500.7940.35
Solar0.1380.3160.7150.32
Wind0.0860.1950.4480.19
Biomass0.0610.1390.3240.14
Publisher’s Note: MDPI stays neutral with regard to jurisdictional claims in published maps and institutional affiliations.

