2. Cosmic Evolution
The cosmology of cosmic evolution explores Nature broadly yet deeply, striving to place humanity into a framework of understanding spanning the early Universe to the present Earth. It helps explain the rise of complexity among ordered systems throughout the nearly 14-billion-year-old cosmos—mainly galaxies, stars, planets, life, and society. It describes key evolutionary events that have produced intelligent beings and human culture. It is currently the most accurate, scientific, evidence-based narrative of who we are, whence we came and how we fit into the larger scheme of things. It may well be the best story ever told.
Cosmic evolution is a grand synthesis of many varied developmental and generational changes in the assembly and interplay of energy, matter, and life throughout the history of the Universe. At issue at the frontier of this interdisciplinary science are the details of how complex systems emerged and evolved physically, biologically, and culturally from the physics of subatomic particles prevalent long ago to the astronomy of galaxies and stars later in time, then onward to the biology of sentient beings on at least one planet as well as the culture that our forebears organized socially and the things we build technologically [
2].
Cosmic evolution extends the basic idea of evolution—ascent with modification, adaptation, and selection—to include all complex systems, alive or not. By merging physical, biological, and cultural evolution into a single, inclusive scenario based on everlasting change, cosmic evolution evokes a philosophical ideal that what’s seen as a diverse and varied world of natural phenomena masks a deeper reality of underlying, unchanging principles. As such. the most familiar kind of evolution—biological evolution, or neo-Darwinism—is just one, albeit important, subset of broader evolution that has produced much more than mere life on Earth. What Darwinian change does for plants and animals, cosmic evolution aspires to do for all things on and beyond Earth. And since Darwinism dispels anthropocentric beliefs by showing that the matter within human beings hardly differs from that of other life-forms, then cosmic evolution extends the simple, yet powerful, idea that stars and galaxies, as well as people and society, can be treated in much the same way as bodies and brains. Cosmic evolution is a subject like no other, even broader than traditional cosmologies and spanning many disciplinary boundaries.
The concept of an “arrow of time” best captures the full panoply of cosmic evolution—a temporal outline of major milestones along a rambling, winding evolutionary process that eventually made everything around us and including us in the Universe. Extending across all time, from big bang to humankind, it depicts a chronology of events that produced, in turn, our Milky Way galaxy, our star the Sun, our planet Earth, as well as ourselves and human society. As for any good story, the general sequence of events is often more important than specific dates of each one—a sequence of changes that connects systems across the full span of history from simple to complex, from inorganic to organic, from chaos in the earliest of times to order more recently [
3,
4,
5,
6].
That sequence, as determined by a large data base of observational and experimental findings collected since the Renaissance yet mostly during only the past few decades, accords well with the grand idea of a continuous, consecutive thread of change:
Energy yields elementary particles of matter;
Particles combine to make atoms;
Atoms form galaxies and stars;
Stars fuse heavy elements;
Elements group into molecules and planets;
Molecules spawn life on Earth;
Life breeds intelligence, humanity, civilization;
Society builds cities, nations, economies, machines.
None of this means “lower”, primitive life-forms biologically change directly into “higher”, advanced organisms, any more than galaxies physically change into stars, or stars into planets. Rather, over the course of time environments ripened for galactic formation, and now those conditions are more conducive to stellar and planetary birth. Likewise and more recently, environments suitable to beget simple life eventually changed into those favoring more complex species. Conditions for physical change and biological change have themselves changed as the Universe has also changed with its continued expansion. And now, cultural change most affects us humans on Earth as its changing environment fosters the robust complexity we share socially and struggle to control technologically.
Despite the march of time and the growth of complexity, no “directionality” is observed among the many varied complex systems that have emerged throughout history. No strong drive to ensure systems complexify, no steady aim toward ideal systems, no preferred evolution in time. Evolution does seem to be an erratic, aimless activity that is unceasing, uncaring, and unpredictable. Many more systems have succumbed than survived, the losers becoming less complex, simpler, even extinct.
The only directional trend in Nature seems its inherent amassing of disorder, or entropy, in wider environments beyond extant systems such as galaxies, stars, planets, and life. That is the 2nd law of thermodynamics at work, taking its toll in the expanding Universe globally even as small and amazing pockets of order arise and flourish as winning complex systems locally. Humans among all known systems throughout all known history are merely recent actors in an extremely long, intertwined story of rising complexity, from the start of the Universe to now on Earth and continuing.
Of relevance here, ordered, organized systems that successfully sustain themselves, notably while taking advantage of available energy, have generally enhanced their diversity and complexity across time—life-forms more than non-life, animals more than plants, human society most of all (so far). This paper quantifies some of these changes and trends, especially those pertaining to some of the most complex systems known, including those currently worrying us most—nations and their cities.
2.1. Energy Rate Density
The interdiscipline of cosmic evolution is governed mainly by thermodynamics, however that does not guarantee events and outcomes are well determined or can be precisely described. Thermodynamics relates what can happen, not what will happen. It perhaps best explains the process of change, albeit change that is shaped by both chance and necessity—random actions as well as those ruled by physical laws. Although thermodynamics literally means “movement of heat”, a more insightful, wider interpretation regards change generally, as in “change of energy.”
Flows of energy naturally originated in the expanding Universe and seem as central to the structure and function of all complex systems as anything yet found in Nature. Systems’ optimized use of energy might well act as a motor of cosmic evolution on the largest scale, thereby facilitating physical, biological, and cultural evolution on smaller scales [
3,
7,
8]. Energy’s foremost merit, unlike entropy, information or other terms used in more specialized work, is that it is well defined, directly measurable, and has clearly understandable units [
9].
Energy is a powerful unifying quantity like no other in science, a shared feature linking the ways and means of so very many material objects in our remarkable world. Its key role in all types of complex systems, from stars to starfish and petunias to power plants, helps provide a cogent account of a huge array of systems widely found in Nature. Energy, perhaps unlike any other term in science, also helps explain how complex systems naturally sustain their existence during single durations as well as across many generations. Wise use of energy could help solve our most pressing crises on Earth, guiding humanity and our troubled society toward a future worth living.
Modern science suggests that energy plays a key role in the emergence and assembly of complex systems and much of it is backed by data and tests. Many researchers have studied energy’s organizing tendencies in different ways and limited contexts, e.g., [
10,
11,
12,
13]. This paper’s research agenda employs energy consistently, uniformly and in much wider ways to explore many more systems generally. However, no new science is proposed here while extending previous pioneering work to wider domains with deeper insights by applying it to social systems important today such as developing nations and growing cities where most people live.
Energy helps build and operate—that is, structure and function—all complex systems. It also enables their principal activity over time—their origin, evolution, and destiny. Energy usage is arguably a central organizing factor not only for biological systems such as plants and animals but also for physical systems such as stars and galaxies. Furthermore, energy is vital for cultural systems like human society and many of the products we make and use.
Not much of anything in Nature works without energy. If stars had no heat within them, they would implode. If plants did not absorb sunlight, they would wilt. If humans stopped eating, we too would die. Cities, nations, economies, and machines, among many systems society builds, all need energy to remain structured and functioning. Cities and nations are indeed complex systems too.
Complex, ordered systems—whether alive or not—are open, organized, dissipative and out of equilibrium. They capture, consume, and release energy. They are “open” when allowing both matter and energy into their material selves. They are “organized” when usefully maintaining order within their innards. They are “dissipative” when expelling degraded energy and useless waste. They are also “non-equilibrated, which is why complex systems are often called dynamic steady-states [
14]. Unlike objects that are fixed and stable, successful systems manage to avoid passive equilibrium—their most likely, default state if left alone. They do it by means of energy actively coursing through them. That is a central theme of cosmic evolution: Energy flows here and now, as well as there, then and yet to occur, tend to change systems, evolve them, sometimes complexify them.
Energy itself and energy flows are quantities of import, but neither adequately describes system complexity. A luminous star, for example, is far more energetic than a stalk of sugarcane (among the most efficient plants); a distant galaxy has much more energy moving through it than a great blue whale (the largest of all known animals). Yet, animated, living systems are more complicated than anything inanimate. Every species of life on Earth is more complex than any star or galaxy in space, yet most nebulae in the sky engage vastly more total energy than anything alive in our backyards.
Total energies are not as telling as relative values, which depend on a system’s size, scale, and makeup. To describe system complexity as objectively as possible, “energy rate density” has been offered as a complexity metric (or at least a proxy for it) [
2,
7]. This term normalizes energy flows through complex systems by their bulk matter, or intrinsic mass, allowing for fair, consistent comparison of a wide array of complex systems. Symbolized by Φ
m, energy rate density equals the
rate at which
energy transits complex systems having
mass. It is an empirical quantity whose meaning and measure are well understood and whose definition is clear and concise:
Energy rate density is the amount of energy passing through a system per unit time and per unit mass.
Energy rate density is not a new term, but other researchers often name it something else, each geared to their own specialty. Astronomers call it the luminosity-to-mass ratio, physicists the power density, geologists the radiant flux, biologists the specific metabolic rate, engineers the horsepower-to-weight ratio. and economists the energy use per capita. Ecologists call it nothing in particular, although they were among the first to study the changing rates of energy flowing in and out of living ecosystems [
15]. Different names for the same term cause confusion, which is why this article calls it exactly what it is—the rate of energy flowing through any system’s bulk mass.
Consider, for example, a physical system such as Vega, the brightest star in the constellation Lyra vivid in the summer sky of the northern hemisphere. Stars convert mass into energy as infalling matter heats their cores, forges heavier nuclei arrayed in ordered internal layers and enhances their complexity over time, though slightly and slowly. Vega’s measured luminosity is ~1.5 × 1028 watts (W), which is an energy rate some forty times that of our Sun. Its measured mass is nearly 5 × 1030 kilograms (kg), or about twice our Sun’s bulk. So Vega’s computed Φm equals 0.003 W/kg; for the Sun it is 0.0002. More massive stars usually have greater brightness, smaller stars are usually dimmer; most normal stars have Φm values within an order of magnitude of one another.
Next assess a biological system such as ourselves. Humans consume matter chemically, converting some of it to energy, though far less than a star. Adults eat food at a rate equivalent to 130 W, which equals the more familiar unit of 2700 Calories per day. Note that a physicist’s calorie with a small “c” equals a thousand times less than a dietician’s Calorie with a big “C”, so 1 Calorie equals about 4200 joules or 1 kilocalorie of energy, which when used daily equals nearly 0.05 W of power. So a typical adult human having a body mass of 65 kg has a Φm of 2 W/kg. Food junkies eat more and get bigger, malnourished poor eat less so are smaller; Φm is roughly the same for everyone yet much higher than for stars.
Lastly, appraise as a cultural system a technical icon of today’s society—the automobile. A mid-sized sedan with a curb weight of 1.5 tons runs on 130,000 W (or 175 horsepower), but is only about 20 percent efficient. Converting all three quantities—mass, energy, and time—to the same units used above yields a computed Φm of ~20 W/kg. Bigger vehicles like SUVs have more powerful engines and smaller vehicles have less, so their power-to-mass ratios show approximately the same Φm for most autos. Trailer trucks get a few factors less, jet aircraft can have hundreds of times more. Most built things running on energy show Φm somewhat higher than life-forms and much higher than stars.
Although total energies of astronomical systems like the Sun greatly exceed those of our human selves, Φm for people individually and the products we make are thousands to millions of times greater. Ten thousand times more energy flows through each kilogram of our human body while respiring, and ten times even more than that energizes each kilogram of gray matter in our brains while thinking.
Furthermore, human society collectively and on average is greater still, implying the whole of society is greater than the sum of its parts—an outstanding hallmark of complexity science (see
Section 4.4). The totality of humanity comprising an open, ordered, complex society in today’s technological world has a Φ
m of ~50 W/kg—a couple dozen times as much as a single person consumes as food and about double the energy each of us individually uses in brain power. This is so since about 8 billion people now use some 20 TW to keep all of human society and its remarkable infrastructure functioning globally, assuming each person averages 50 kg to account for children under the age of 18 who weigh less than adults and comprise about 25 percent of the population.
The computed trend is clear and compelling for a vast array of complexity observed in Nature: Φm generally increases from physical to biological to cultural systems. Compared to lively biological systems, inanimate physical systems have Φm at least hundreds of times less; built social systems up to hundreds of times more. This, then, is this article’s philosophy of approach and working hypothesis in cosmic evolution: Mass-normalized energy flow—energy rate density—is a core feature of a universal process engaged in forming and sustaining systems, evolving structures and functions, as well as perhaps creating evermore complexity throughout the Universe.
Neither new science nor appeals to non-science are needed to explain the ranked hierarchy of complex systems spanning the cosmic-evolutionary narrative, from glowing objects in the nighttime sky to awesome life-forms on planet Earth to handy gadgets of modern civilization. These empirical findings provide an objective, scientific way to study options and opportunities for humanity going forward minus all the noise and emotion engulfing human society today.
2.2. Complexity Quantified
Cosmic evolutionists are now both broadening and deepening our knowledge of evolution. We strive to expand the envelope of understanding beyond mere words and beyond traditional biology. And we try to discover how evolution has apparently caused increasing amounts of system complexity over the course of history. Before quantifying complexity in greater detail—and applying it to cities, states, and nations—one more clarification seems useful. This is one way to define “complexity”, even if the complexity-science community seems unable to reach a consensus: Complexity is a state of intricacy, complication, variety or involvement among the networked, interacting parts of a system’s structure and function—operationally, the rate of energy flowing through a system of given mass.
Here is one more useful chronology granting perspective for the main topic of this article—energy use in complex systems that are nations and their cities. Throughout big history, from the early Universe to civilization on Earth the principal unifiers so prominent in the big-bang-to-humankind story—evolution and complexity—parallel each other, much as they likely have all along the arrow of time [
6,
16]. Furthermore, all three quantities comprising the essence of this research—evolution, complexity, and energy rate density—seem integrally connected to one another, each roughly in sync and feeding back on the other. The result is increasing complexification across much of history to date, with nations and their cities embedded in the penultimate bullet:
Mature galaxies are more complex than their dwarf precursors;
Old red-giant stars are more complex than younger, normal stars;
Planets are more complex than their host stars;
Plants are more complex than nucleated cells;
Animals are more complex than plants;
Mammals are more complex than reptiles;
Brains are more complex than bodies;
Societies are more complex than individual humans;
Machines are more complex than anything else to date.
This
general trend of rising complexity over time can be made more substantive by employing the same Φ
m metric for each of the three major phases of cosmic evolution. The following numerical values as well as those in
Figure 1 derive from several previous studies published in peer-reviewed journals and books over the past quarter-century [
2,
17,
18], here updated to include recent data. Estimates of when some well-known systems emerged in natural history are also given in parentheses.
Figure 1.
Energy rate densities, Φ
m, for a wide array of complex systems that emerged at various times in natural history display a clear trend, implying rising complexity from the big bang at left bottom to human society at top right. The bold blue curve extends vertically and logarithmically over nearly a billion factors of energy, and horizontally and linearly over nearly a quintillion seconds of time. Based on recent research and better data, the shape of the bold curve is slightly different than similar ones published several years ago, e.g., [
2,
9].
Physical Systems: Galaxies have some of the lowest values of Φm, not surprisingly since they are among the earliest systems formed in the Universe and most display some of the least ordered structures. From dwarf galaxies to active galaxies, they have values in the range 10−6–10−3 W/kg. Our own galaxy, the Milky Way, for example, now has 10−5 W/kg, having increased roughly an order of magnitude while changing from primordial blobs to dwarf galaxies (~12 Gya), eventually achieving a merged, mature status (~10 Gya) and its normal state today.
Stars range in Φm from a tenth to a millionth of a W/kg for giants to dwarfs, most of them ~10−3 W/kg. As they evolve, their values change while undergoing nuclear fusion that enhances interior thermal and chemical gradients, forging ordered layers of heavy elements. The Sun, for example, changes its Φm from 10−4 to 10−2 W/kg while evolving from a young protostar (~5 Gya) to an aged red giant star (~5 Gy in the future). Its current value, as computed above, is 2 × 10⁻⁴ W/kg, and in the far future when its fusion ends, its remains will attain equilibrium as a black cinder with 0 W/kg.
Smaller in complexity yet longer in duration, galaxies are nearly as metabolic and adaptive as any life-form, minus any genes, reproduction or inherited traits. They provide chances for energy usage by forming new stars and shredding old stars, all the while adjusting their lowly order in response to changing galactic environments. Stars, too, have much in common with life; their inward energies and outward wastes undergo slow and steady change, albeit more simply than life. However, no one thinks stars are alive. Most researchers agree stars at least develop and perhaps physically evolve over many (hundreds of stellar) generations—as implied by rising Φm abridged in the two prior paragraphs.
Biological Systems: Plants and animals show a range of larger values of Φm from 0.1 to 10 W/kg. Plants have values well higher than those of galaxies and stars, perhaps best exemplified by photosynthesis, the most widespread process in Earth’s biosphere. During the past few hundred million years for which data are available, microscopic protists (single-celled organisms ~470 Mya), followed by gymnosperms (plain, non-flowering plants ~350 Mya), then angiosperms (more complex and flowering ~125 Mya), and eventually most highly efficient C4 plants (~30 Mya) display increases in Φm by about an order of magnitude, nearing 1 W/kg.
Animals respire as they evolve and complexify, raising their Φm from 0.5 to 10 W/kg while changing from fish to amphibians (370–500 Mya) to cold-blooded reptiles (~320 Mya), then to warm-blooded mammals (~200 Mya) and birds in flight (~125 Mya). As computed above, humans are comparable to most mammals at 2 W/kg, and not highest among them. Our brains, unsurprisingly, do have the highest Φm for any individual, macroscopic life-form, ~20 W/kg, or about an order of magnitude greater than for our bodies housing them. Overlaps in Φm and dates occur throughout, yet most of it accords broadly with Darwinian evolution.
System functionality beyond mere system structure enhances complexity among animate systems that are living compared to inanimate systems that are not. Energy acts as a fuel for change, partly and optimally selecting for survival those winning systems able to utilize higher Φm while leaving others to failure and extinction. The rise of Φm among plants and animals, and the demise of it also for those that are selected out and lose, generally parallels major evolutionary advances during life’s history. Values of Φm along biological lineages are tentative as numbers in the two prior paragraphs are only approximate, subject to further research and better data.
Cultural Systems: Human society’s Φm today, ~50 W/kg as computed above, is well more than we consume while eating (2 W/kg) and even more than we use while thinking (20 W/kg). That is because we engage in daily social activities that need more energy to sustain their structure and function—to maintain and execute them. Cultural evolution of our ancestral forebears—from hunter-gatherers (200,000 ya) to early agriculturists (10,000 ya) to pioneering industrialists (2 centuries ago) to modern technologists—can be traced from 5 to 200 W/kg. Nations and cities, the central topic here, have Φm scattered within this range since some are more developed than others.
The highest values of Φm characterize things we build, especially engines, computers, electronics and the like that are integral parts of today’s global economy. Steep upward trends are noticeable as Lamarckian evolution accumulates and passes along traits at rapidly accelerating pace. From crude machines of the industrial revolution (~200 ya) to early automobiles (a century ago) to recent computers (past few decades) to the newest jet aircraft (currently), Φm now nears and sometimes exceeds 1000 W/kg. Machines functioning in three dimensions, unlike we humans living in two dimensions on a planetary surface, creates a whole new realm of energy rate density.
Human society and its built machines comprise the most energy-rich systems known. Numerically in terms of Φm, they are also the most complex systems yet found anywhere in the Universe. Much as for stars, galaxies, and life itself, the rambling, winding road to our technological civilization seems to have been paved with increased use of energy. Rising Φm noted in the prior two paragraphs—whether slow and ancestral like controlled fire and tilled land in early agricultural times, or fast and modern as for powered engines and programmed computers in today’s vigorous economy—evoke evolutionary events in which energy flow and customer selection played intentional, decisive roles. The cultural evolution of remarkable technical gadgets vital to a healthy economy can be traced by means of their increased energy budgets, as can the entire global economic system spread among nations and driven largely by cities.
Figure 1 summarizes much research on this huge subject in a single graph. It depicts a multitude of changes from homogeneous, primordial matter at lower left to extremely intricate systems at upper right. This graph has long been a primary, unifying goal: To find a single factor common to all complex systems, from big bang to humankind—and to display it on the same page.
The graph suggests Φ
m is a viable candidate for a universal process linking physical, biological, and cultural systems, showing Φ
m rising vertically and logarithmically over more than 12 billion years of linearly plotted time. Historical dates and Φ
m values are estimates for the general category to which each system belongs. They result from many years of collecting, measuring, computing, and modeling a vast array of relevant numbers [
2,
19].
Figure 1 not only depicts the physical, biological, and cultural evolution of simple, unorganized matter into complex, ordered systems. It also implies how cosmic evolution—a synthesis of those three phases of evolution—occurs ever faster. The rapidly rising, bold, blue curve looks exponential but is likely even steeper since on semi-log graphs an exponential curve plots as a straight diagonal line rising up and to the right. More and better data are needed to specify this curve’s actual shape.
Physical evolution has the smallest slope at lower left, morphing into biological evolution with moderate slope in the curve’s middle, followed by cultural evolution having the steepest slope at upper right. Hence, the rise of Φ
m seems to be accelerating. That is the factor—the rate at which increasingly complex systems exploit energy—that bolsters the idea that ”something” is ramping up the frenetic pace of our daily lives.
Figure 1 suggests that accelerant in recent years might be caused by human society’s greater use of energy (per unit mass).
Closer inspection of
Figure 1 reveals more insight. The area shaded beneath the bold curve includes a huge array of evolutionary paths of countless complex systems that changed their values of Φ
m while emerging, maturing, and enduring. Only a half-dozen representative paths are shown plotted as smaller dotted lines to keep the figure uncluttered. They sketch some prominent evolutionary paths that led specifically to humankind—namely, those of the Milky Way, Sun, Earth, plants, animals, and society. Some of those dotted lines show Φ
m rising only for limited periods of time, after which they taper off. They likely follow an S-shaped curve, rising slowly for a long time, then rapidly for a short time, after which they rise again slowly or eventually plateau. The main, bold, blue curve spread across all of evolutionary history in
Figure 1 is likely the sum of very many S-curves tracing the origin and evolution of countless complex systems [
20,
21].
Caution is urged not to overinterpret the trend displayed in
Figure 1, nor the huge database behind it. Based on available, relevant data, successful complex systems display no decrease in their Φ
m, rather merely lessened growth as those systems mature. Winning systems seem to optimally manage their energy budgets and rapidly adapt to changing environments. However, only a small minority of all systems are winners and
Figure 1 graphs some of the more notable ones that led to us.
By contrast, most stars that once shone brightly are now gone and almost all biological species once alive are now extinct, as well as several civilizations once thriving have collapsed and disappeared. Each likely suffered falling Φ
m and aborted. They likely failed to optimize their energy usage or to adapt fast enough and were naturally selected out of existence. Losers, which are among the great majority of all complex systems, are not shown in
Figure 1.
Nor do all known complex systems fit precisely along the bold curve or in the shaded area graphed in
Figure 1. Nor should we expect them to. Exceptions, outliers or other deviant data outside the norm are occasionally evident. Nature overall is a mess owing to thermodynamics’ 2nd law, so why should all evolving, complex systems obey tight patterns, their values of Φ
m clinging closely to the bold curve in
Figure 1? Some variations are natural, inevitable and useful. They can provide important evolutionary opportunities for survival as well as insights for understanding.
Irregular galaxies disrupt their shapes when interacting with nearby galaxies, boosting their star formation and enhancing their Φ
m yet only briefly; transient events that flash briefly in peculiar galaxies are not indicative of galaxies on average. Likewise, the most massive stars terminate by exploding as supernovae, raising their Φ
m spectacularly for 1000 s or so, but they do not belong in
Figure 1; they are acts of destruction far beyond energy flows that are optimum, no less than bombs that cause destruction, which is quite the opposite of rising complexity.
Not all jellyfish, flowering shrubs or naked mole-rats fit exactly onto the main, bold curve in
Figure 1. As if all 4800 different species of jellyfish should . . . many of them alien-like, eyeless, bloodless, spineless, and brainless; jellyfish are indeed an enigma, often combining plantlike simplicity, animal-like mobility and an almost bacterial ability to reproduce rapidly, so we cannot expect all their species to fit onto some neat and tidy graph. Hummingbirds, too, display high values of Φ
m as indeed they should given their spectacular flying ability; most complex systems that function in three-dimensions—flying insects among invertebrates, birds among vertebrates, and aircraft among culturally built systems—all have an order-of-magnitude boost in Φ
m.
Likewise, black bears feeding insatiably during fall while gulping ~20,000 kcal for 20 h each day spike their Φm by an order of magnitude after which it plummets during hibernation. Microbes, too, when rarely gorging, resemble racing horses or erratic stars, with Φm values sometimes off the chart, even as high as several hundred W/kg, but try zapping a kilogram of bugs in a kitchen microwave (typically 800 watts) for more than a few minutes without getting a charred cinder. At other times, microalgae, suggestive of early life-forms on Earth, are known to be poor photosynthesizers and have much smaller energy budgets enabling them to survive on spacecraft for long periods and perhaps on exoplanets near red dwarf stars having very low light levels, so typically have small values of Φm.
Wreaking viruses, crashing markets, failed nations, bankrupt cities, among other ruinous affairs are missing entirely in
Figure 1. And for good reason. They do not belong on that graph since their values of Φ
m are far outside, both more and less, what is optimal; viruses are too energetic, depressed markets and depressing nations much less so. They are not constructive systems engaged in complexifying events, rather inherently destructive and not progressing toward greater organization.
Figure 1 is a summary plot of rising complexity in the Universe, not of transient events that went awry destructively while eroding and simplifying.
Variations are more than just passing interest, not the norm for successfully evolved systems yet vital for those still evolving. Perfect members of any species do not exist in biology, nor do perfect examples of physical or cultural systems outside biology—there is no perfect hydrangea, nebula, car or jaguar. Variations help explain why roughly 30 percent of swans are black and 15 percent of black bears are white; and maybe even how zebras got their stripes and turtles their shells. However, and humbling, today’s studies of energy flows in living systems are far from yielding the details needed for full understanding.
Nature, with its realistic messiness, is far from ideal, nor is our ability to measure Nature as good as could be. Variance is an essential feature of evolution, for all systems on all scales at all times. Absent any variations, adaptation, adjustment, and selection would not work. From those variations likely arose the great diversity among complex, evolving systems everywhere—and without them novelty and creativity in the Universe might be absent.
Any simple, unifying précis of a messy, imperfect Universe—especially one like cosmic evolution that ambitiously aspires to address all of Nature—will display variations. Precise values of very many plotted Φ
m values are not as telling as much as the overall upward trend with the march of time that is so clearly evident in
Figure 1. Its graph is most appealing in displaying how galaxies, stars, planets, life, and society really are interrelated. And it does it in a numerical, evidenced-based way greatly bolstering the narrative of cosmic evolution. This cosmology is not inspired faith or purist logic about who we are and whence we came. It is tested science with a ton of data to back it up. Such a single, unifying graph does imply that a general law, principle or process might well create, organize, maintain or destroy complex systems everywhere and everywhen, from the early Universe to now and beyond.
More than any other factor in science and society, energy plays a central role in our lives and our world. Energy may well be an underlying, universal driver (or at least facilitator) like no other in the evolution of all things, serving as a common currency for much of what is actually observed throughout the Universe—a veritable motor of evolution perhaps. If correct, energy itself is a mechanism of change—a key feature of evolution writ large. And energy rate density is an objective measure of energy flows on many scales for many systems, enabling us to assess all complex systems in like manner—as well as to gauge how over the course of natural history some systems evolved to command energy and survive, while others apparently could not and did not.
Better metrics than Φm might describe each of the many types of complex systems formed and then changed by physical, biological, and cultural evolution, yet no other single measure seems able to uniformly describe them all and altogether. The significance of plotting a single factor on a single graph for such an extraordinarily wide range of systems should not be overlooked. No other quantity chronicles as extensively and consistently so many types of complex systems spanning more than 20 orders of magnitude in size and nearly as many in time—namely, an octillion (1027) meters from cells to galaxies in a Universe nearly a quintillion (1018) seconds old.
Take another look at
Figure 1 that frames the remaining two figures to come. This iconic plot acts as graphical scaffolding to illustrate how highbrow cosmology might have practical relevance to some worldly issues now confronting humankind on Earth. The goal here is to target this graph’s upper right part—the human condition and the human enterprise, aiming to explore how cosmic evolution might aid in practical ways the wellbeing of intelligent life in our technological society.
3. Nations
The cosmic-evolutionary scenario sketched above highlights energy’s foremost role for a wide range of structured, functioning systems across the Universe. Energy coursing through our complex selves as well as through our even more energetic and more complex society is at the heart of who we are and what we do. However, the energy used today will not be enough tomorrow. Not only is more energy essential as human society evolves culturally, but also large improvements in technical infrastructure are likely needed to acquire and use more energy safely. That is the potential existential crisis facing humanity today. Solving climate change affecting us all is important, but a basic energy problem underlies it.
Cultural systems are sustainable if they increase or flatten their Φm while evolving toward greater complexity. It seems a myth that our complex social system will use less energy anytime soon, if ever. Just as it is wrong to think global temperatures and greenhouse gases have stabilized. Both are currently rising as change continues, the pace of life quickens and dirty energy budgets mount. Clean, safe, abundant energy can help society endure but only if we embrace the Sun—shining light, blowing wind, flowing water, and warming air are all readily available solar energies found on Earth daily.
Usage is up in all global energy sectors, including transportation, electricity, heating, and cooling in cities, states, and nations. Not that huge energy increases, now or later, are likely needed for society’s survival. Most evolutionary changes are gradual, incremental, and occasional, at least when viewed broadly. What will surely be big in the years ahead are the changes in technology needed to achieve even a modest rise in safe, clean energy to power civilization.
Nations are indeed very complex systems—thermodynamic systems. Much like galaxies, stars, planets, and life, yet more complex, every nation contains ordered structures and working functions, with flows of energy and resources in, followed by waste and products out. Energy budgets can help provide quantitative assessments of the status of nations now and how they might be changing. Fortunately, Φ
m is a useful metric for tracking the evolution of society toward greater complexity. Most of their numerical values lie near the top of
Figure 1 and they contain a message.
3.1. Winners and Losers
Earth’s nations mainly divide into two groups. Some 38 countries comprising the Organization for Economic Cooperation and Development have robust economies, large energy budgets and without exception high Φm. This minority of mostly industrial nations enjoyed much cultural growth during the 20th century—they developed. Many more, about 160 non-OECD countries evolved less as implied by their distinctly lower Φm. These newly emerging nations are only now developing in the 21st century largely owing to their rising energy usage.
Table 1 lists Φ
m for a sampling of nations typifying each group. Quantities are given with units of W/kg as done above and also kilowatts/person (kW/per) in per-capita terms. These and other energy data are accurate as of 2020 before the COVID-19 pandemic struck when energy usage dipped worldwide, yet is now rising again as the pandemic eases. Most of the values in
Table 1 and throughout this article are computed from databases of the International Energy Agency in Paris [
22], the Energy Information Administration in Washington [
23], the United Nations in New York [
24], the Martin School at Oxford [
25] and a few other sources noted in the text.
Numbers in both columns of
Table 1 are not fixed. Most increase with time, especially those in the right-hand column of developing countries. Notably, China, which is now at the top of that column, will soon shift to near the bottom of the left column while continuing to develop its society and likely doubling its Φ
m by 2030. Its current rate of
total energy used roughly equals that of the US—about 3.5 TW—but its Φ
m is three times less since its population is triple that of the US. Within a few decades, China will likely match the US per-capita energy usage and surpass its total energy budget.
A clear rift divides the two types of nations listed in this table. Developed countries are energy-rich—not just the US and a few small, wealthy nations of Asia and the Mideast, but also most industrial nations of Europe, as well as Canada and Australia. Many more developing countries are not yet so energy-rich, nor yet so energy-hungry, but they are becoming so. India and some African nations are destined to switch from the right column to the left, probably within a generation or two and almost surely during the 21st century.
Another striking fact separates the short list of a few dozen developed countries from the much longer list of more than a hundred developing countries. In 2022, the population of the developing nations together amount to more than 80 percent of all humanity worldwide. By contrast, only twenty developed countries emitted more than 80 percent of all new carbon dioxide into the atmosphere. Fifty developing countries in sub-Saharan Africa emitted less than 1 percent of that greenhouse gas.
Analysis of Φ
m in
Table 1 as well as for more than a hundred other countries not listed shows per-capita energy usage now globally averages 2.5 kW/per (or 50 W/kg as computed earlier). That worldly per-capita value varies regionally from 0.5 kW/per for 56 African nations, 1.5 kW/per for 47 Asian nations, 1.8 kW/per for 45 Central and South American nations, 4.5 kW/per for 27 nations of the European Union, and 7.5 kW/per for 3 North American nations.
Many nations’ values of Φm are rising, especially in developing countries. And it is definitely rising for the world as a whole. If Φm is a valid metric for complexity, then most nation-states as well as all of them together globally are continuing to complexify. That should not surprise anyone attuned to current affairs in today’s fast-paced and heavily networked society. Now we have a tenable way to quantify the quickened step of our daily lives, helping us realize why everything around us seems complicating and accelerating.
Examples of progress are easy to cite among the developing countries. Just noted, Chinese citizens who now use only about a third of the energy of an American are closing the gap as they, too, become more energy extravagant. Residents of India hardly use a tenth of the energy of those in the US, a fraction that is sure to surge soon. Energy use in both China and India grew at rates exceeding 6 percent for each of the past several years, save 2021, with greater growth expected in the years ahead, perhaps as much as 8 percent annually [
22]. Both rates are close to a doubling time of 1 decade.
Throughout the developing world, per-capita uses of many commodities are on the rise, some of it steeply. Demand for energy, water, and food are all growing faster than their populations as people escape poverty and pursue comfort. And as they get richer they consume more meat, which is twice more energy demanding as fruits and vegetables and quadruple more than grains. World population is still rising as well, so food production alone will likely need to double within the next few decades and with it the energy and water that make it happen.
Prime examples are Nigeria and Indonesia. As Africa’s richest country, Nigeria is on its way to becoming the world’s third most populated nation, where more than half its people today lack access to any energy source, hence have no electricity. When that changes before mid-century, all its citizens will become not just energy users but also per-capita users nearly on par with the West. And that will send the world’s total energy usage soaring. Likewise for Indonesia, now the most populous country in Southeast Asia and fourth most populous in the world. Both its population and energy usage are rising and with them its Φ
m in
Table 1 as its quality of life improves. And it has every right and intent to do so.
Many of the developed, already well-energized nations have total energy and per-capita energy budgets that are also still rising, though usually at slower rates. In Australia, for example, most models show continued increase in energy use as lifestyles change in the decades ahead, implying a doubling of its Φ
m by end of century [
26]. Even in the oil-rich kingdom of Saudi Arabia, whose Φ
m is currently comparable to that of the US, the Saudis’ domestic energy use has been rising some 7 percent annually, which is nearly triple the rate of their population growth. They burn about a quarter of their own vast oil production each year and that is not sustainable, which is why they are smartly and heavily investing in solar energies.
A contrasting case is the US, whose Φ
m has been nearly flat for the past few decades. Its steady growth in per-capita energy use since the industrial revolution leveled off around 1980. After a long, slow rise over more than a century, its Φ
m increased substantially from 150 to 200 W/kg (i.e., from 7.5 to 10 kW/per) between 1950 and 1975 caused by a growth spurt after World War II. Since then it has fluctuated up and down weakly, yet now might be rising again slightly post-pandemic [
23,
25].
Figure 2 shows how per-capita energy use grew both in the US alone and in the entire world over the past two centuries. Since this period is a “micro-percent” of cosmic history, these curves are actually extremely steep, rising by nearly an order of magnitude, which is much faster than for most other complex systems observed in Nature. That is because this figure depicts culture in action technologically—the quest to control energy by advancing nations of the modern era.
The top plot in this figure labelled “US only” shows how recent US values of Φ
m are nearly flat. Variations from year to year are miniscule on such a big-picture graph. This plateauing is likely following a typical S-shaped evolutionary trend, as noted earlier by the several dotted curves in
Figure 1. Many complex systems’ Φ
m values display S-shaped growth curves and nations are no different. Their energy budgets increase slowly for long periods of time, then ramp up rapidly over shorter times, and finally plateau—at least for a while. However, decreasing rates of growth do not necessarily mean total energy use is falling. Slower energy growth of the US energy budget implies merely a “bending over” of energy usage, much as expected eventually for world population.
Most nations, including dozens of developed countries and more than a hundred now developing, show their Φ
m still on the rise. That is the curve in
Figure 2 labelled “all nations, averaged.” Since developing countries together house four-fifths of all people on Earth, total energy used by society globally is now poised to rapidly increase in the 21st century while each evolves toward more developed nation status. The uptick at right of that curve clearly shows world energy rising recently.
Figure 2.
High energy usage for human society is a hallmark of our modern technological civilization. This semi-log graph plots Φm values at left and equivalent per-capita energy usage at right over the past two centuries for the US only and for all nations of the world (including the US). These data suggest Φm is flattening for the US, yet is still rising for all nations combined.
Neither lifestyle changes nor environmental ethics will likely cause per-capita energy demand to fall below current levels in the developed countries. And there is little chance of it abating in the developing countries, except for a few ruined places like Syria, Venezuela, and North Korea noted below. Those who think energy budgets among viable nations will eventually decrease locally, regionally or globally are misguided. If world energy budgets ever do fall dramatically, humanity may not end well.
Whether the flattening of Φm for the US is stable or fleeting is hard to know. Its slackening in energy usage might explain the declining growth of US productivity since the 1980s. By contrast, its recent uptick prior to the pandemic correlates with a booming US economy, both of which then fell during that plague, yet both now seem on their way up again. Or the near-flattening of US energy growth might reveal a maturing economy that is using energy more efficiently or even a stagnating economy that uses less energy—not a nation slumping or failing but not growing either and not as dominant as it once was.
Without risking overinterpreting the data, US per-capita energy use did show the effects of the Great Recession in 2008. Energy use fell noticeably as markets sagged, much as did many economic indicators, including retirement accounts and university endowments. People were burned by investment banks as both their savings accounts and their energy use shrank. From 2007 to 2009, US per-capita energy use fell sharply from nearly 11 to 9.5 kW/per, a decline of some 15 percent.
Both the corrupt money lenders and national energy budgets have slowly recovered during the past decade, the former now as greedy as ever, the latter as heady as before. Energy usage in the US has now climbed back to nearly 10 kW/per. In 2018, US energy consumption reached its highest ever, driving a very healthy US economy. Unfortunately, the extra energy boosting that surging economy was the wrong kind of energy. It mostly derived from fossil fuels, which is why US carbon-dioxide emissions reversed their slow decline over the past decade and began rising again owing to a glut of cheap oil and fracked gas.
By the start of 2020 when the pandemic struck, US and world energy budgets were strongly trending upward—the highest in history. Though they then slumped somewhat (in the US down to 9.3 kW/per), they have now returned to near peak values and are moving beyond . . . rising as ever as many nations’ economy rebounds. Coronavirus, it seems, was but a brief speed bump and now that society has mostly recovered it is business as usual.
Energy and the economy do seem correlated—energetic utility and economic vitality. As the economy falters, energy use plummets. Conversely, when energy is costly or unavailable, the economy suffers. Tangled feedback likely connects the two, but which is the cause and which the effect is not always clear. One thing seems certain: If Φm starts markedly decreasing for any complex system, that is likely problematic. In the evolutionary joust of winners and losers, economies and their energy budgets that are falling are likely failing. Winning complex systems utilize energy boldly while developing, even if less so once developed.
It is important not to judge the world through American eyes. The US houses only a few percent of the world’s population and has some of the world’s most advanced, energy-using technologies. Challenges lie ahead for society globally if all nations emulate US policies, practices, and energy usage, yet that is where many of them seem headed. By contrast, it is important to watch closely the US energy budget since any lessening of energy use could well imply a declining US nation, its influence receding as a democratic ideal of freedom, equality and opportunity for all. If its Φm is not just flat but also starting to permanently trend downward, this proposed barometer of order and complexity might explain the backsliding of US society that now seems chaotic and disordered. Historically, collapsing societies lost complexity as their people lived shorter, more brutish, unhealthy lives.
Several world-leading nations faltered in nearly periodic ways since the modern concept of a nation-state first emerged several hundred years ago during the Renaissance. For example, Spain, France and then Britain ruled the western world, each in turn for about 150 years. Their Φm must have been aplenty during their reigns since, although quantitative data are lacking to prove it, their spirit of exploration and the sprouting of technology as well as the warfare that often drove it would have likely required high energy expenditures. As each nation toppled as a dominant world leader, its Φm just as likely fell, though apparently not enough to fully collapse those great nations since they still prevail on the world stage today, albeit less vibrant as they once were.
If the US superpower status has largely policed the world since the end of World War I, and if the typical duration of any great nation is roughly a century and a half, then we might expect it to falter in by mid-century. Not necessarily collapse any more than Spain, France or Britain did earlier, just burdened politically, economically, perhaps militarily. More effort, that is more energy, seems needed for any nation to sustain its global leadership and not all of them can manage. That is a common expectation among many geopolitical experts, namely that the US would give way to China sometime during the second half of the 21st century.
Numerical trends of Φm bolster the idea, and testably so, that top nations eventually falter and maybe even utterly fail. The Soviet Union did collapse, structurally and functionally, largely because its economy and its military could not sustain energy budgets on par with the West. America and its allies outspent it and overpowered it without firing a shot. In turn, those trends imply other great nations, such as India, Brazil or a regional consortium of nations, might eclipse China during the following century—that is, as long as the concept of nation-state survives, which is not assured.
Trouble seems likely if any nation trends steadily downward in per-capita energy use, owing perhaps to partisan politics that derail the economy, ignore climate change or mismanage energy policy. Data for the US and its mostly flat Φ
m over several past decades do suggest small swings up and down as the economy trended bullish and bearish or the weather warmed unseasonably high and low. Symptoms of overreach have also clearly emerged in recent years as democracy has teetered in many nations. And none of it was helped by incompetent leaders and an invisible virus, both of which sapped citizens’ personal energy in ways surprising and frightening [
27].
It is especially worrisome if electricity use also falls, which it has, slightly, about 1 percent each year for much of the past decade in the US. Despite efficiency gains, which are helpful, per-capita electricity use better be rising since society needs to convert from dirty energy to more, not less, clean electricity. Electrical usage is falling even more so in some comparable nations like the UK that has recently undergone social and economic upheaval. Brexit has taken a toll regardless of one’s politics. Electricity’s decrease is nothing to celebrate, even if it is used more efficiently.
Electricity use needs to increase while swapping gasoline-powered vehicles for electric ones as well as heating and cooling homes and businesses with more electricity made with clean energy. That is why the news was welcome in 2018 when US electricity rose 4 percent as its economy thrived—the biggest electrical demand in US history. Even better, clean renewable energy provided nearly 20 percent of the nation’s electricity, also a US record and double that produced a decade ago. In 2019, US electricity use fell slightly, partly owing to a milder summer and warmer winter, but also because anti-environment policies were enacted. In 2020, it dipped again owing to the pandemic, after which it has now recovered and is rising again, a good sign [
28]. The future of humanity is closely tied to electricity but it must be “green” electricity, produced by clean, safe means.
Electricity demand is soaring in most developing countries, more than doubling over the past 20 years. For all nations combined, global electricity use rose 50 percent during that time, in fact faster than world population, which means its per-capita use is also up. That might seem promising, but the real world is complicated. Most of that extra electricity is currently made by power plants burning coal or natural gas. Although electricity delivered to our homes can seem green, its source is often not. Much the same pertains to most electric cars usually charged with fossil-fuel energy, often coal, which can make driving an electric car dirtier than driving one powered by gasoline. Energy trends need to be closely examined, the reasons behind those trends even more so. Society wants and needs more energy but it must be clean energy, lest it continue to soil and heat Earth’s surface [
29].
If any nation’s Φm slumps markedly, that could be a problem—for its people, its society, maybe its governance. Falling energy budgets or electricity usage, which currently amounts to only 15–20 percent of total energy used, could well signal failing complex systems, including any nation, state, city or household. Limits to growth worldwide might even warn of a crumbling of civilization. Neither democracy locally nor civilization globally are guaranteed on a planet and in a Universe ruled by thermodynamics.
Consider Venezuela, a place with ample energy resources and a promising democracy until a decade ago when it began sliding toward authoritarian rule as its politics descended into chaos. Its once oil-rich economy has greatly shrunk and most Venezuelans now lack food and medicine as this “country” hovers near collapse. After rising steadily since 1980, both its total energy and per-capita energy budgets nearly halved over the past decade, dropping steadily from about 80 to 50 W/kg (4 to 2.5 kW/per) from 2012 to 2019. Its electricity usage fell even greater and faster. According to the UN, it was electricity-production problems, beginning around 2010 and perhaps worsened by El Nino warming that helped trigger its economic recession and government crisis that continues there today.
Much the same happened to Greece, a proud country (and democracy’s birthplace) that has been harmed by economic woes over the past decade. Its energy budget reveals its plight as its Φm has fallen nearly a third from 90 to 65 W/kg (4.5 to 3.3 kW/per) from 2007 to 2019. Its electricity usage also decreased during that period, a bad sign. Though it has few energy sources of its own, it does have abundant sunshine for which it is well known yet its solar production lags behind the European Union, which has kept Greece afloat as a viable nation largely with financial bailouts.
And North Korea, too, is a failing nation mostly because its Φ
m has been sinking for decades, now far down the right column of
Table 1 with 0.5 kW/per. That compares badly with South Korea (7.6 kW/per) whose energy usage has increased impressively in the left column. Even Japan, an economic powerhouse in the 1980s and 90s, has slipped over the past 20 years, lowering its total and per-capita energy usage about 20 percent. Its electricity has also fallen at a time when it should be rising. Other troubled nations, much like failing cities discussed in the next section, show lean energy budgets, some of them plunging.
Two striking cases of a failing nation adjacent to a successful one are Haiti, which borders the Dominican Republic on the Caribbean island of Hispaniola, and the Palestine territories neighboring Israel in the Mideast. Political corruption and environmental destruction have long harmed Haiti whose paltry Φm of 0.3 kW/per is dwarfed by the Dominican’s rising 1.2 kW/per, both of them developing countries, side-by-side and with similar populations. And Palestine (0.5 kW/per) continues to be a victim of dominant Israel (3.5 kW/per) and its apartheid policies.
Each of those energetically weak nations—North Korea, Haiti, and Palestine—are nearly pitch black at night. Satellites looking down from orbit clearly show how stark the contrast is, and how sharp the boundaries are between these distressed nations and their successful neighbors. Each of these poor nations suffers from lack of water, sanitation, healthcare and basic amenities. They have little access to electricity, which is an increasingly important part of any country’s energy budget in the 21st century.
War-torn countries are clearly down on their luck, or their smarts, and as failed states also down in their Φm values. Afghanistan, Syria, Lebanon and Iraq, for example, confirm that: 0.1, 0.8, 1.6 and 1.9 kW/per, respectively, low and mostly falling. War itself is a high-energy event, but its aftermath a low-energy outcome for the losers, which sometimes include both parties. All the sadder given that each of these nations has plenty of raw energy all around them in the sunny Middle East—both in-ground fossil fuels, which would not be wise to use, and above-ground solar energies, which would.
Russia’s invasion of Ukraine in 2022 showed, in thermodynamic terms, that Φm can help explain how this senseless war has hurt both nations and how both can recover. After slowly lifting its economy and standard of living from less than 5 kW/per as the Soviet Union collapsed in 1991 to 7 kW/per prior to the pandemic, Russia is now ailing again as its brutish military and mediocre industry as well as economic sanctions by the West sent its Φm reeling. Ukraine’s people and infrastructure were faced with a huge energy flow as tanks, planes, and bombs explosively destroyed many cities and towns, causing its Φm (3 kW/per before the war and now much less) to spike well higher than optimum at the height of hostilities. Within less than a year of the war’s outbreak, Russia’s oil-based economy has retrenched by at least 10 percent and Ukraine’s up to 50 percent. The result has been chaos, disorder, and devolution from complexity to simplicity for both nations, and when post-war data are tallied their Φm values are likely to confirm a deep recession causing lengthy stagnation.
That is not politicizing the science. Rather, it is one way to practice real political science. It is a numerical analysis of energy expended during a dreadful war when less energy was expended in Russia and far too much in Ukraine, both signs of losing complex systems. Russia’s incursion into Ukraine was as foolish and costly as America’s into Iraq in 2003, with grave consequences for Europe’s economic wellbeing likely caused at least partly by rapid declines in both nations’ Φm—as well as perhaps in some European nations caught in the energy-economic crossfire. Nations can gain energy security and independence by adopting solar energies, not by wielding dirty energy as instruments of conflict. The choice between war and peace is as clear as that between guns and butter.
By contrast, Φ
m trends are substantial for some winning countries, such as Norway, Ireland, and Switzerland—7.2, 4.3, and 4.2 kW/per, respectively, all these values increasing, yet slowly, especially in electricity usage, a good sign. These nations also lead the rankings on the UN’s “human development index” for living standards, which gauges health, wealth, and education as well as safety, human rights and other progressive factors. Energy rate densities are changing yet objective, the UN’s human index ratings are much more subjective [
30].
Above caveats in mind about US energy use perhaps sputtering, both its total energy and per-capita energy use nonetheless remain today among the highest for all nations near the top of the heap as listed in
Table 1 and shown in
Figure 2. The US in 2018 used several percent more energy in that one year alone. And since its population rose then only about 1 percent, its Φ
m seems on the upswing yet again, including now post-COVID. Virtually all US energy indicators are up, rising, growing, though at slowing rates than in years long past. However, again, it is mostly the wrong kind of energy.
Some experts with agendas disagree and some media headlines distort. They prefer to glance at US energy budgets in depth and over short durations, typically yearly and without a larger perspective of decades or more. So they are quick to note falling values for some years when in fact longer trends hardly confirm that. Reports of carbon emissions and energy use in the US being lower today than decades ago are factually incorrect. Carbon emissions were just as high in 2019 as they were in 1990, at 5 billion tons (or now 15 tons annually for each US citizen, which is 3 times the worldly average). Likewise, energy use is up 20 percent since 1990, now equaling the highest in US history, at 3.5 TW, or ~10 kW/per, which is 4 times the worldly average.
The big picture does imply the US might be nearing a dynamic energy budget that is optimal for its size, scale and social demeanor. Some regard this as a kind of technological maturity, even as others see America regressing socially and politically. Such a technical coming-of-age might also be happening for a few older, developed nations of Europe, such as Spain, Germany, and Austria. Their energy budgets, after rising steeply for decades, rose more slowly, if at all, in recent years.
Many nations seem headed toward responsible adulthood—but not likely before reaching a level of development attained by those nations already developed. Why would they settle for less? Most of their citizens aspire to achieve Western benefits and living conditions even if they despise Western politics and values. Besides China, whose economy and energy use have surged in recent years, India, Vietnam, Indonesia, and Turkiye have all enjoyed big lifestyle gains by using more energy. These and a few other developing countries are the cause of the recent uptick in global energy use shown in
Figure 2.
3.2. More Energy, Not Less
Caveats aside,
Figure 2′s take-home message is this: Worldly use of energy will likely rise steadily in the 21st century as almost all developing countries achieve more developed status. It is unreasonable to think that other nations will not strive to attain a quality (and equality) of life—including health, wealth, and security—typical of most advanced nations. Some developed countries, like those in the left column of
Table 1, stand to increase their per-capita energy usage somewhat. Many more developing countries, including those in the right column, are poised to increase their current values of Φ
m as much as an order of magnitude.
Nations on Earth are changing by evolving culturally at least partly by using energy—selecting it, adapting to it, optimizing it—much as have so many other complex systems throughout cosmic evolution. Nations faring best are not fixed in their ways, rather are open to change as indeed dynamic steady states, which is a hallmark of successful, winning systems.
Global energy usage in the 21st century can be estimated as follows: The 330 million people in the US currently use a total of 3.5 TW. Even if energy budgets double for each European citizen (750 million people approximately, well more than half in the EU) thereby attaining the US standard of living, all those nations together will add roughly another few terawatts—and if they do not it will hardly matter. The really big increase in energy usage is yet to come as the developing countries achieve developed status. And if their Φm values approach those of the US by century’s end—a good bet at ~10 kW/per—power needs of global society would near 70 TW within only a few generations. This is several times the rate of energy used by all of human society currently, about 20 TW.
That estimate, however, does not account for growth in world population, which continues despite those who wish it would stop. Although US and European birth rates have recently fallen—in the US the 2020 census showing that population grew at the slowest pace since the 1930s—that is not so for most of the rest of the world. Countries where women have equal access to education, such as Sweden, Denmark, Iceland, Greece, Italy, and the UK, all have fewer children nowadays, but these nations together house only a small fraction of the world’s population, in fact less than 2 percent. Their falling fertility rates are not typical of the world today.
The latest UN census forecasts world population almost surely reaching 10 billion people by mid-century. By 2100, it projects perhaps as many as 12 billion, which is half again as large as today’s 8 billion [
31]. The World Health Organization, the World Bank and several other non-governmental agencies also regularly revise upward their population forecasts; humanity often seems to multiply faster than their projections. Disagreements are greatest with analysts who assume falling fertility rates in a handful of nations means world population will also soon be falling. That is very different than once predicted decades ago when scaremongers preached a population explosion, which never happened [
32]. Global population is rising, but not nearly so dramatically.
By contrast, some recent computer modelers imply world population might be less by end of the 21st century than it is now [
33]. However, they are among the same public-health community who underestimated the numbers of people likely to be infected by the COVID-19 virus during the recent pandemic. Their models were not wrong but their assumptions were, the result being their projections of infected people were lowballed. They assumed national leaders would use evidence-based reasoning to combat the virus and most citizens would take social distancing and mask-wearing seriously. None of that was true, especially in the three countries hardest hit with the highest infection rates and per-capita deaths—namely the US, UK, and Brazil, each led at the time by strong men having disdain for science. Population outcomes likely lie somewhere between extreme predictions, whether high or low, that often garner publicity.
Half the world’s population growth during this century is likely to occur in just eight countries: India, Nigeria, Pakistan, the Congo, Ethiopia, Tanzania, Indonesia, and Uganda. Reasons for the upward projections include high fertility rates in these developing countries and longer life expectancy throughout the world. India with 1.4 billion people now might surpass China by 2040 as the world’s most populous nation and Nigeria will likely eclipse the US by 2050 as third most populated. Rapid growth in the poorest countries will ensure greater demand for increased energy as these countries yearn for, and hopefully for them achieve, higher quality of life—reducing poverty and inequality as well as combating hunger and malnutrition.
Overpopulation surely is a—and perhaps the—root cause of many of the world’s woes. More people needing food, more farmland needing clearing, more air and water needing cleaning, and more energy needed to help address these and other issues . . . poverty, pollution, and resource depletion.
Education can help, especially to realize some subtleties, such as: Rising carbon-dioxide emissions follow economic growth more than population growth. In China over the past 50 years, emissions grew more than ten times yet the population hardly doubled. That is not a plea to curb the economy as much as to halt the kind of dirty energy widely used to drive it. Neither more clean energy nor a strong economy are evil, but carbon pollution surely is.
Electricity can also help and more quickly too. Poor communities around the world often suffer from high fertility and lack of electricity. Population and electricity seem anti-correlated. So if electricity could be made more widely available, population growth might be reduced since a byproduct of electricity is lighting, which gives folks something else to do at night other than procreating.
As with energy increase gradually plateauing, declining population growth still means growth, just slower . . . neither fewer people nor even stabilized numbers. And much population seems ready to swell in those very same developing countries where Φm is also about to escalate. For example, China’s rule of one child per family that prevented some half-billion births over the past 40 years has now ended largely because an aging Chinese nation needs a younger workforce to keep its economy strong and its military stronger. As of 2021, each couple can now have three children in a major policy shift with real-world implications. Even Japan, a developed country with a strained economy and a falling birth rate, now pays its citizens to have babies, fearing without youth its economy will sink, its older folks lose their pensions and its quality of life slump with falling Φm.
Anyone thinking these recent policy changes will not make much difference in world population and energy usage needs reminding that additional babies born within the current decade will be the bulk of the workforce as young adults by mid-century, let alone many more so by end of this century. These two Asian countries alone amount to a fifth of all the world’s peoples. Nations’ demographics are strongly tied to their economics and economies are heavily dependent on energy.
More so, the developing Asian giants, China and India, together house a third of all people alive today, many of them facing poverty, needing water and lacking lighting. Both their population and especially their energy use are on the rise. China’s middle class has grown from 30 million people to 400 million in the past two decades and India will add 500 million to its middle class in the next decade.
Another 20 percent of Earth’s inhabitants in the emergent continents of Africa and South America know well the primacy of energy to better their citizens’ quality of life. They, too, mostly and rightly so, desire air-conditioning, a family car and a meat-rich diet as long as developed countries refuse to curb theirs in the West. Every developing city, state, nation and region is now on the path to increased energy budgets as society continues advancing—and upwards of 2 billion more people join the middle class globally over the next two decades. Demands, supplies, and uses of energy are climbing all over the world.
One barometer to watch is the South Asian nations (including India but not China) that already comprise nearly a quarter of humanity and those in Africa that will soon make up another quarter. What happens to them during this century stands to have global repercussions on everything from conflict and migration to peace and wellbeing. For Africa alone, its energy demands by 2040 are set to grow twice as fast as the global average, its total energy budget by 2050 will nearly quadruple, and 12 of the world’s 20 most populous cities are likely to be on the African continent by 2100. The oncoming boon or peril of air conditioning for all those people in all those cities and all those nations is sure to raise the world’s energy budget, not just incrementally rather several-fold.
A single energy sector illustrates society’s burgeoning energy needs. Electricity alone is now non-existent for more than a billion people across Asia and Africa, half of them never having used a telephone. Some three billion still cook with solid, polluting fuels like wood, dung, and charcoal—nearly half of humanity currently has minimal energy access. However, electrification is surely coming to them and soon. Electrical demands in and around mushrooming cities will require huge new energy supplies, each new metropolitan area easily consuming billions of watts. By 2100, electricity to power air conditioning alone in a warmer world will surge tens of times more than now used globally.
When all this is said and summed for total energy, not just electricity, human society’s power needs by century’s end could approach 100 TW. That is the 70 TW estimated earlier plus a supplement for added population growth through 2100. If that seems high, it is actually lower than what the UN projects. The UN foresees the global economy expanding as much as 500 percent larger (i.e., ~3 percent annually) by 2100 than it is today, which would require a big boost in energy use worldwide [
30]. Economies, after all, run less on money or greed and more on energy mainly.
The math is easy, given two assumptions: If in 2100 about 10 billion people inhabit Earth and if each uses ~10 kW/per averaged among adults and children alike, then the total energy rate used among all nations sums to ~100 TW. Much as predictions of population so often are, energy usage of even 100 TW could be an underestimate. Both often trend higher than usually expected, a little like government spending or middle-class taxes that always increase regardless of efforts to tame them. This estimate also assumes that highly developed, profligate nations like the US, Canada, and Australia, as well as some Arab countries will not use more energy than they currently do now (already 10 kW/per or higher), yet maybe they will.
Appeals to higher energy efficiencies, cutbacks and savings, or perhaps some sort of ethics to greatly curb energy usage in the top-tier, energy-rich nations will not likely help much. There is little sign much of that is happening now and historically no evidence that human society has ever used less energy while progressing. Some efforts to conserve energy or use it more efficiently might even backfire, resulting in more energy used, not less [
34,
35].
Examples of this “rebound effect” include fuel-efficient cars, which cost less to run yet often get driven more, so net savings in energy and expense largely go unrealized. Extra cars, extra driving, extra idling, extra speed, extra conditioning, and extra dashboard widgets all require extra energy. Just about everything about vehicles is up, including costs to buy, run, insure, and garage them. Even if incremental efficiency improvements are realized, it resembles putting a bandaide on a tumor. That is why the added energy used while driving more could offset or minimize gains in efficiency—much as cooling inside places warms the outside world, even if air conditioners do improve, since the number of new units worldwide (billions more in coming decades) will surely outstrip any gains.
Likewise, handheld devices continually improve in efficiency yet our monthly bills often show extra electricity used as our data usage rises since we own more of them and use them more—smartphones, laptops, tablets, cameras, digital amenities, in all now nearly 50 billion gadgets in the so-called Internet of Things. Also, newer computers are several times more efficient yet several times faster, too, now using energy often just as much if not more than older models. Most appliances today are built more efficiently than those of yesteryear, but they also have more functions, tend to be bigger, and are tested under ideal conditions, so often use nearly the same and sometimes more energy than older, smaller, inefficient models running realistically. Despite light-bulb improvements, lighting is widely growing worldwide as many more bulbs get installed and used, in fact illuminating places no one bothered to light before and making the night sky brighter, not darker, to the dismay of astronomers everywhere [
36].
Conservation and efficiency are noble goals in principle, but are often only marginally achieved in practice. Conserving energy and using it efficiently are positive and promising, but they do not save as much energy as many people think or experts claim. They might make us feel good, but small solutions do not often solve big problems. Some of these odd and sundry revelations are further discussed in
Section 5.
As for hoping that ethics will bail us out someday, society cannot count on it. Practical realpolitik will surely affect humanity more than leaning on philosophy or pleading for morality; les monde problematique require sensible, pragmatic solutions that can be implemented today. Energy use in some Western nations like the US is slowing, which might owe to efficiently using and conserving energy, but it is not much, not falling and not wise to rely on either.
Cosmic evolutionists feel uneasy when total energy use and especially Φm markedly decrease for any complex system. That would imply less complexity and more simplicity, which despite a longing by some people for an easier, simpler life does not seem to be the way Nature favors winning systems. Today’s data trends suggest developing countries will increase their energy usage while rising to meet that of developed countries, not that developed countries will lower their current energy budgets to match those struggling to develop. Most leading indicators show energy use on the rise, which is as it ought to be for our complex human society to continue evolving, advancing, surviving.
Future casting broadly is another way to anticipate humanity’s expanding energy needs on a finite planet. The US rode the world’s first modern spurt of energy growth during the 19th century, the result of a resource-abundant nation reaping the early fruits of the industrial revolution. That is why its Φ
m is now among the highest in the world. The next spurt will be China’s mainly, peaking around mid-21st century, its recent uptick also noticeable in
Figure 2. After that will come India, energizing boldly in the second half of this century if not sooner. And then Africa, perhaps riding the biggest energy upswing of all while joining the global community of energy-centered nations toward the end of this century.
All the more reason to judge 100 TW not an unreasonable estimate by the year 2100. In 1900, global energy use was 1.5 TW, a century later in the year 2000 about 12 TW. That is the trend—an energy spurt of an order of magnitude over three doublings during the 20th century. That is an annual growth rate of about 2 percent and a doubling time of 35 years. If it continues with another three doublings in the 21st century—and it is on track to do so with 20 TW now used globally—the world’s total energy needs around 2100 would approximate 100 TW.
That is a welcome development from a cosmic evolutionist’s viewpoint. Rising energy helps to facilitate the evolution of complex systems by aiding their robust advancement and complexification, likewise for nations and their sustainable economic progress provided it is clean, safe energy. If even a fraction of 100 TW were still produced by dirty fossil fuels by century’s end, it would be an unmitigated disaster for our human species as well as for many other life-forms on Earth.
Many known unknowns plague nation-states today. Might North America and the European Union, which are now the bulk of developed countries worldwide, seriously restrain energy use in the years ahead? Might China and India waive western standards of living? Might Africa forego electrifying its countless villages and growing cities? Might an emerging middle class in the developing world abandon a lifestyle demanding more energy? Frankly, none of these options seems realistic. Or proper, if all peoples of the world are to gain equality with the West, as right they should.
4. Cities
Nation-states prosper economically when their urban social systems are vibrant, including strong energy flows. Energy use correlates with economic size, growth, and vitality, although not everyone agrees urbanization underpins world economic progress [
37]. However, there is no denying cities are where most energy is used worldwide by civilization today since that is where most people live now and increasingly so. History’s greatest human migration is currently underway as at least two million people per week flock to cities, whose economic engines will soon use a great majority of all energy powering human society on Earth. Networked cities are the lifeblood of the global economy.
In developing countries, each day several hundred thousand people now move from remote rural areas where per-capita energy use is low to urban areas where it is higher. Most of the world’s fastest growing cities are in Africa and Asia, and between now and mid-century Africa’s urban population is expected to triple and that of Asia to swell by not quite double. These migrants are mainly poor folks living in distant places well beyond suburbs since many of their nations’ cities have no suburbs. They are following energy availability and their Φ
m is rising. They are selecting more energy and adapting to it as life grows more complex for them and their families, which is partly what is meant by development—new choices, new chances, new ways to better their prospects for survival [
38].
In developed countries, that great migration is much less now since it mostly happened decades ago. In the US, for example, half the population today already lives in cities proper, another 35 percent in surrounding suburbs and only about 15 percent in rural farmlands. As some of us “reverse migrate” from the cities to the suburbs, our Φm increases still more, though slightly. It is easier and simpler to live in a small apartment and walk to work than to bother owning cars and upkeeping property. Suburban lifestyles should be a bit more energetic (and complex) and data support that.
4.1. Cities as Economic Engines
Nowhere is today’s economy more germane than within and among metropolitan areas. As the building blocks of nations, cities are sources of innovation and centers of trade fostering a vibrant society and its economic development. All across our planet, the undisputed engines of any nation’s economy are its cities, considered here to be networked social life focusing political power and actual power in cultural communities of at least 50,000 residents. Some experts regard the word “economy”—including efficient, conserving schemes—to infer a decline of cities’ energy needs. However, data suggest cities are instead more likely to show their wholes exceed their parts and so raise both their total energy budget and often their per-capita energy use (Φm), albeit slowly.
Urban systems are populous and dense, their structure and function organizationally intricate. Almost everything about most cities seems to be changing, growing, complexifying. Cities expand and proliferate as people not only multiply globally but also migrate from rural to urban locales. Although cities occupy hardly 2 percent of Earth’s land area, they now house about 55 percent of humanity and account for nearly 75 percent of all global energy used. By mid-century, the UN projects at least two-thirds of all people will reside in cities while using 85 percent of the world’s energy as total population nears 10 billion [
39].
By contrast, in 1800 only a few percent of humanity lived in cities. By 1900 it was ~12 percent and about a dozen cities sheltered more than a million residents [
40]. Today, more than 400 cities each house that many people and a few dozen megacities have more than 10 million each. Most of the colossal ones are in Asia, which has 7 of the world’s 10 largest cities. Shanghai is currently the world’s biggest city proper with a single government (27 million) and is likely to be soon superseded by some other Asian city. Greater-Tokyo alone (38 million) has more residents than Canada and an annual economic output comparable to Australia.
By 2100, this growth trend will have likely shifted to Africa, which will then house at least half of the largest urban areas on the planet. Lagos, Nigeria, now the largest city on that continent, is already among the megacities—housing 7 million people two decades ago, more than double that now, and within a decade or two at least 20 million, topping that of New York and London combined. The center of world geography is shifting [
41].
This massive movement of people toward cities—mostly to big ones in developing countries, not so much in already developed ones—is happening at the astounding rate of roughly a hundred million newcomers each year. By sheer numbers that makes it one of the most notable cultural changes of the 21st century. They are heading to cities, notably in China, India, and sub-Saharan Africa, mainly for economic opportunity since that is where jobs and energy abound. They are also coming because climate change is driving refugees away from some of the poorest and hottest parts of the world, forcing them to seek cleaner air and fresher water. Warfare, too, enhances the trend as city-bound people seek safety for themselves and their families.
Cities are complex, dynamical systems that enable healthcare, education, employment, and welfare, which make them among the best places in the world to improve one’s lot in life [
42]. Studies show the greener cities are, the happier their residents are, largely because sustainable cities give some urban space back to Nature when parks expand, rivers are restored and literally greener pedestrian pathways made safer for all [
43]. Cities need energy to function much like all complex, evolving systems, increasingly so from stars to plants, animals, and the human race. Many city energy budgets are trending upward, not downward, as cities grow when migrants adapt to new surroundings, select favorable options, tend to use more energy and evolve culturally. However, not all cities are succeeding; too many are failing. At issue, again, is energy—not enough of it and not the right kind.
Just as realistic efficiency or conservation tactics are unlikely to deter the growing energy needs of nations, energy budgets of vibrant cities are on the rise as well. Critics demur, especially the economists who, after all, are inclined to be economical. They often urge savings, for example advising as energy gets more expensive people will conserve it, reserve it or maybe use it more efficiently. However, energy is not becoming more expensive save nuclear energy that is declining precisely because it is so costly. Energy, especially solar energies, are becoming cheaper—and soon will cost even less than pumped oil and fracked gas that keep subsidized fossil-fuel prices artificially low and their companies afloat.
Urbanization as an example of human change now underway is profound, yet much as expected given the accelerating nature of cultural evolution. Cities have existed for thousands of years, yet city dwellers began outnumbering rural folks worldwide for the first time only a decade or so ago. Even in the expansive US where a third of its population lived on farms a century ago, hardly 1 percent does today. Human migration is a defining factor of this century, not just negatively owing to civil strife, bitter politics or climate change, but also positively since chances for personal advancement are better than ever in metropolitan areas, including cities per se as well as their surrounding suburbs.
Urban critics sometimes fuss over today’s heavy influx into the cities, some even calling for its end. Mitigate the migrators is what they urge. As many cities strive to make things work, their swelling populace outstrips their urban infrastructure—upward in bigger buildings, outward in sprawling suburbs. Some growing cities are among the most congested places on Earth, such as Delhi in India, Karachi in Pakistan, and Dhaka in Bangladesh. Throngs of people in some megacities are now choking on hazardous levels of air pollution. Others just arriving are thrust directly into harm’s way, rattled by heat-island effects or rising seas. The good news is that the oncoming solar revolution will enable cities to energize greatly without creating bad air, waste heat or increased trash, all desirable since cities are already the biggest producers of entropy on the planet [
44].
Nowhere than in Earth’s most troubled cities is it clearer that humanity needs to abandon burning fossils and embrace the Sun. It is time to stop kidding ourselves or delaying yet again; one is the problem, the other the solution. Fortunately, some cities are not waiting for backward states or paralyzed nations to identify what can be realistically done now. In the US, at least half of all cities have strategic energy plans—retrofitting city-owned buildings and street lights, providing free energy audits for homes and businesses, revising building energy codes. Unfortunately, many of the action items in such plans are voluntary, encouraged by mayors who seldom require them [
45].
Relocation is a common feature of biocultural adaptation and natural selection as evolution continues apace. Human migration under social (including socially induced climatic) pressure hardly differs from species migration now occurring throughout the plant and animal world. The former is a quick, Lamarckian accumulation of traits within a single generation; the latter a gradual, Darwinian passage of inherited traits over many generations. All life-forms, including ourselves, have renewed chances for better lives should they change their environs and access cleaner, safer, optimal energy.
None of these cultural developments is surprising when cities are surveyed “cosmologically” from afar. People quitting rural farmlands for city living are adapting to cultural change by selecting better lots in life. There is nothing wrong with that, however inconvenient changes might be in the short term—like now. Cities, built with energy and running on energy as much as anything, could be strained, their services stressed, their budgets stretched, as complex social systems for much of the 21st century. Those cities managing to acquire more quality energy will likely do well, and those that do not might well fail entirely. Still others might find the needed changes a hassle, worsening before improving, “muddling along” to use a frequently heard UN term. It is all part of evolution writ large.
Cities are as much a product of cosmic evolution as stars or galaxies, plants or animals. Among humanity’s greatest creations to date, cities comprise “organic organized complexity” according to the noted urban critic Jane Jacobs who likened cities to ecosystems, or “life at its most complex and intense” [
46]. City structure is largely its built infrastructure and its function is mainly its economic activity. Cities naturally emerge as people cluster for social contacts, job opportunities, higher wages, good education, and quality healthcare, as well as because that is where much of the energy is intentionally focused to help make it all go-round [
47].
Historically, much of human progress has been closely linked to the origin and evolution of cities. Places like Uruk, Athens, Rome, Paris, among so many other famous settings, have often been at the forefront of humankind’s social and intellectual progress. Most enduring cities today are still evolving while hundreds of new ones are only now emerging, all of them trying by means of energy use, cultural adaptation, and natural selection—change and choice, adjustment and preference—to achieve productive and sustainable communities within Earth’s human ecology [
48].
Like other complex systems, the form and function of cities, much as the larger states and even bigger nations housing them, can be analyzed in thermodynamic terms. Cities themselves are energy-centered, out of equilibrium, and dynamically stable [
49]. They acquire and consume resources as well as make and discard wastes while providing useful benefits: utilities, housing, transportation, communications, education, healthcare, and entertainment, among many maintenance and service tasks. Although built socially and not grown biologically, urban systems display a hustle and bustle resembling metabolisms with energy flows dependent on city size, location, culture, and history [
50,
51].
Cities are voracious users of energy, both to feed their many residents and to provide valued amenities offered by active city living. Compared to nearly everything else in Nature, Φ
m values are high for people living in urban areas. For all citizens within all cities of all nations today, their Φ
m averages 3.4 kW/per, or equivalently in proper metric units ~70 W/kg. That roughly matches UN and World Health Organization estimates that megacities typically use each year almost 10
18 joules for transportation, electricity, heating, and cooling [
22]. Some cities in developed countries (notably in extravagant North America) have nearly double that city average Φ
m, a per-capita power that many residents of developing cities might achieve later this century.
As a reminder, each adult human consumes as food only 2 W/kg or about 130 W/per. That is nearly the minimum energy needed to continue living—to barely sustain our bodily structure and function. So the just computed value of Φm means the average adult in an average city today uses a few dozen times more energy than the basic minimum. The extra energy used by each of us above and beyond what we actually eat provides many pleasantries of city living, including comfortable housing, bright lighting, convenient transport, and playful entertainment. Some 0.13 kW/per satisfies basic biology; 3.4 kW/per enables much value-added culture.
Several thousand watts for each city dweller surpass by 30 percent the average for anyone living anywhere across the globe today, in cities or not (i.e., 2.5 kW/per, see
Table 1). That is because heavily populated cities and their urban infrastructure use more than their share of global energy expended and a good deal more than those living in rural areas. In other words, the net energy budget of an entire city exceeds the summed energy expected by grouping its many residents—perhaps another example of the whole exceeding the sum of its parts typical of many complex systems throughout Nature. This seems confirmed for US cities since each of its households use total energy that averages ~3.3 kW, so the amount used by each person in each household is somewhat less since many households are populated by more than a single person [
52].
That most city folks use more energy than those living beyond—in general, on average, globally—is affirmed as follows: Since 55 percent of the world’s population now living in cities uses 75 percent of all energy expended and since the total population of 8 billion people uses 20 TW, then some 3.6 billion people living in rural places use about 5 TW, which equals a per-capita energy usage of roughly 1.4 kW/per. That is well less than those living in cities who average 3.4 kW/per, as tallied above. And that is why, as people move from the remote countryside to the cities, each of them ups their energy game, roughly doubling it. These are global averages not typical of the US.
Extrapolating only a quarter century to 2050, when world population will be close to 10 billion people and world energy budgets totaling as much as 40 TW, the equivalent numbers work out to be, for the 65 percent of everyone then living in cities while using 85 percent of all the world’s energy, a Φm of 5.2 kW/per, compared to those in rural areas of 1.8 kW/per. So both residents of cities and those beyond increase their energy use per capita, though city dwellers do so more than rural folk. Many benefits accrue to those living in cities, but they cost energy and therefore money.
More urban insights can be gleaned from existing data. Energy budgets for mature, developed cities are large, their Φ
m near the top of
Figure 1’s graph for a wide array of complex systems. Less advanced cities still developing have smaller budgets and per-capita values, but both are rising, much as for their host nations as compiled in
Section 3 and
Table 1. These energy trends help clarify that urbanization is a complexifying process, numerically backing the growing diversity within cities comprising varied neighborhoods, homes, businesses, services and not least people [
53].
Appeals to efficiency to stem the swelling tide of energy will not likely help much. Long-held assumptions often allege larger, well-organized US cities enable greater efficiencies owing to shared infrastructure in big buildings in dense residential areas [
54,
55]. Common walls and split piping, for example, allow “economy of scale” to reduce resources. Opposing designs use modular construction where smaller, compact buildings can be cheaper and more efficient, so it is unclear which strategy economizes best. Either way and contrary to wishful thinking, hard facts imply city energy savings are not often realized—at least not much in big cities in developing countries where most people live [
56].
Some energy used in crowded urban centers might well be reduced if public transport reduces vehicle traffic or if people opt to live in small digs in high-rise buildings. With increasing numbers of people living in cities, buses and ubers would necessarily be selected and personal vehicles rejected. Since transportation leads all other energy sectors, energy savings could be real and substantial. However, greater urbanization also tends to raise productivity and income, which in turn builds up energy demand since it is more affordable and needed for other energy sectors, like heating, cooling, and lighting to support growing businesses. Rising numbers of middle-class households with discretionary money are often quick to take advantage of energy-intensive goods and services that also tend to increase, not decrease, energy use.
Big energy savings and carbon emission reductions in modern cities burning fossil fuels may well be urban myths. Cities built skyward and dense could abate some of their energy use compared to those built sprawling beyond—but not always. New York City, for instance, has more than a million buildings responsible for at least two-thirds of its carbon emissions and skyscrapers are the dirtiest of them all. Delivering heating and cooling, as well as people too, up and down tall, skinny buildings usually requires more energy per person than in smaller buildings.
Urban experts might have it wrong when claiming both energy use and carbon emissions are much less in cities than their suburbs. Data reported by several US cities suggest most urban systems are not notably energy efficient or much cleaner either, so not so economical besides [
57]. And the bigger cities get, the more energy they proportionately need, always totally and often per-capita. Carbon-dioxide levels are indeed rising in many cities, implying the snags of driving are rising even if vehicles are idling. Heating and cooling are also more in demand as new commercial buildings often grow in size. Cities packed with people and the things they do resemble networks of machines that might save energy individually, such as the Internet of Things connecting smart digital devices nationally and internationally, but they often use more energy per machine collectively.
A case in point is the dis-economic trends in electricity use in bigger cities. Urban living and its electrical needs go together and grow together. That has long been known for some cities, but it was masked by warped media reports that most cities usually benefit from higher efficiencies and economic scaling. Cities surely economize for some shared utilities like cabling, piping, and roadways, just not so much for pollution, disease, and violent crime—or for citizens’ energy needs, especially electricity [
58,
59].
As cities double in population, they typically use
more than twice the energy of their smaller selves. Not only does total energy usage increase with city size—after all, more people live in bigger cities—but also per-capita usage (i.e., Φ
m) remains high and often increases as well. Residents of bigger cities use more energy than those living in smaller cities and they use it at a rate equal to or faster than their cities’ growth [
60]. For example, electricity use derived from utility bills sent to customers in several European, Asian, and American cities imply Φ
m is neither level as cities grow nor dwindling as cities mature. That is only electricity, but since it often scales with total energy used it implies most energy budgets might well continue rising disproportionately as cities evolve, if only slightly and slowly. This should not surprise us since efficiency gains can hardly keep pace with energy demands for many cities reaping the benefits of booming economies [
61].
Not all these urban trends pertain to all cities, however. Some developed cities in the US, for example, seem quite unlike newer ones only now developing elsewhere, not because we are special or our cities better, rather because the US is not a typical nation. The US houses hardly 4 percent of all people globally and nearly 85 percent of Americans already live in metropolitan areas, roughly triple that of a century ago [
62].
New York City is a prominent example of a highly evolved, technologically savvy city, perhaps as atypical of world cities as the US is among nations. It might be at the vanguard of cities worldwide or merely an outlier, but it is telling us something since its per-capita energy usage has been roughly steady for decades and maybe even slowly declining in recent years. New York’s public transit system of trains, buses, and taxis works well—fast, frequent and reliable, the best in the US—keeping countless cars off its city streets. And its dense array of vertical buildings help limit the city’s total energy budget. Does a high yet nearly flat Φm mean America’s biggest city is beginning to fail, as its detractors flout? Or merely maturing while becoming more efficient, as supporters tout? Hard to know without better data; maybe a bit of both given the hustle and bustle amid its concrete canyons.
4.2. Measuring Cities
Theory is one thing, data quite another—a vital other. As people culturally gather into cities and society much like atoms physically cluster into stars and galaxies or cells biologically group into bodies and brains, all these complex systems are governed by the same general principles of thermodynamics guiding energy, adaptation, and selection. Unfortunately, reliable, consistent energy data are not well gathered by the municipalities where most people live. Accurate energy data for individual cities are hard to find in published reports or to compute from piecemeal statistics. Many cities tally their data differently or not at all, some counting energy used for electrical service mainly, others for transportation or buildings only. Some collect data for cities proper minus suburbs, others for metro areas of cities plus suburbs. Urban officials keep few records of their most vital diagnostic, total energy used, which is better compiled for nations and states whose boundaries are clearly drawn [
63,
64].
Figure 3 graphs Φ
m for a small sample of cities during the past half-century—not just electricity, but also energy used for heating, cooling, transport, as well as any commercial and industrial use within city limits [
65,
66,
67]. The graph is tentative pending better data from city governments, yet the cities plotted are not cherrypicked. They are selected for pedagogical insight. Rather than cluttering the graph with spotty values of many cities’ energy budgets over varied timespans, only a half-dozen prominent cities’ data are displayed for a range of places where people cluster internationally—some technologically young and only now developing, others older and more mature.
City Φ
m values are shown rising or plateauing over time for Washington, Toronto, and Sydney in the developed countries of the US, Canada, and Australia, which are among the highest per-capita energy users among all nations—see
Table 1. These contrast with a rising then slowing curve for Hong Kong and a rapidly rising curve for Shanghai within the major developing country of China. Note that Shanghai’s data are plotted as a straight line on this graph’s semi-log scale, so its Φ
m is rising exponentially on a linear scale, which is not surprisingly given the industrial might that impressive city has recently achieved in modern China.
Figure 3.
This graph shows energy usage rising (for adolescent cities) and then flattening (for mature cities) with Φm values plotted at left and equivalent per-capita energy use at right for a sampling of major cities around the world during the past half-century.
Figure 3.
This graph shows energy usage rising (for adolescent cities) and then flattening (for mature cities) with Φm values plotted at left and equivalent per-capita energy use at right for a sampling of major cities around the world during the past half-century.
Each curve in
Figure 3 suggests ways that Φ
m changes as urban areas evolve. During the past half-century graphed, Toronto proper has not grown much in size, scale or population (now about 3 million people); it is basically steady as is Washington though much smaller (about 700,000). Hong Kong (7.5 million today) and Sydney (5 million) are moderately growing cities, not quite doubling their population over the past 50 years. Shanghai has quadrupled to some 27 million people today. Their computed and plotted values of Φ
m, ranging from currently about 2.5 kW/per (50 W/kg) for Hong Kong and triple that for Washington, used the summed mass of all their residents living within city limits, not beyond in their greater metro areas that are not so steady and are still growing in size and scale.
Figure 3 is much as expected for any evolving complex system in the larger context of cosmic evolution. Energy used by urban residents generally rises as their cities evolve toward greater complexity and the plotted trends in Φ
m reflect those five cities’ ongoing development—Washington and Toronto not much, Sydney moderately, Hong Kong more so and Shanghai stunningly.
Washington has among the highest Φm for any city—nearly flat, maybe falling, and averaging 150 W/kg (7.5 kW/per). Think of all those government buildings, with high ceilings, huge volumes, and vast electrical needs to keep the lights on, the hot air controlled and the bureaucratic staffs pushing around bits and bytes, much of it inefficient and wasteful as for any publicly funded authority. Most nations’ capitals likely have thriftless energy budgets.
Limited data at hand for other developed North American cities show much the same trend, though more economical. In addition to Toronto’s plotted 120 W/kg, Boston, San Diego and Denver, for example, use 85, 90 and 110 W/kg, respectively, and all have remained roughly constant (level on the graph) over the past few decades. New York City, noted earlier as either an efficient trendsetter among big cities or perhaps one starting to slide, also displays a nearly constant value of about 80 W/kg, and even if slightly falling would hardly be noticeable on the scale of this figure.
Toronto has a moderately high Φ
m owing to its cold winters, warm summers, and heavy reliance on fossil fuels—slightly higher than most US cities and almost twice as high as most European cities. Its rapid rise in energy use, as for a few other Canadian and many US cities, occurred shortly after World War II, which is outside the timeframe of
Figure 3. Their per-capita energy budgets then leveled off (or nearly so), which is why Toronto’s change during the time plotted in the graph is nil, its curve flat.
Sydney is a modern city though still complexifying, so has a steadily rising Φ
m on its way perhaps to resembling Toronto eventually, owing to its serious cooling needs in summer. It is a city of developed Australia, but not yet as energy hungry as Toronto. However, Sydney’s plotted values of Φ
m are still heading upward, with its citizens not yet easing up much on their per-capita energy demands [
68].
Hong Kong is still an industrializing city (though light industries like finance and services) likely typical of thousands of cities throughout the developing world now showing a quick rise followed by a tendency to turn over yet still upping its Φm as each of its citizens uses more energy. Its energy needs grew rapidly under British rule until end of the 20th century, less so since rejoining China, though overall Hong Kong’s energy usage is still trending upward.
Shanghai, an historically old city yet one now rapidly modernizing, roughly doubled during just the past quarter-century both in population and Φ
m, now nearing 30 million people and 100 W/kg [
69]. Among thousands of older revitalized and newer big cities of mostly Asian nations, Shanghai is widely considered the most western city in still-developing China and likely the most energy intensive megacity in the world. With names like Guangzhou (formerly Canton), Chongqing, Surat, and Chennai, energy budgets for hundreds of giant cities will likely balloon in the next decade.
Data plotted in
Figure 3 help test a central idea inspired by cosmic-evolutionary cosmology as applied here to cities and their social organization: The up-and-to-the-right trend, in fact for all three figures of this article, supports the notion that growth and complexification of ordered systems usually have rising Φ
m. Stars, for example, increase their Φ
m while physically evolving, [
17] as do bodies and brains while biologically evolving, [
18] much as the data plotted here also show for cities culturally evolving. Numerically, however, city values exceed those for stars by orders of magnitude and even those for life-forms. Cities expend of order 100 W/kg (5 kW/per), which is roughly a million times more than for stars and even more than their individual residents, confirming intuition that cultured systems and their built products are among the most complex entities found anywhere.
That central idea also implies that as cities advance, especially adolescent ones vibrantly evolving, they not only complexify by quickly using more energy. They also might naturally slow their increased use of energy while changing in ways that depend on their size and scale, after which their input-output flows of energy, resources, products, and wastes reach an optimum—not an equilibrium, rather a dynamic steady state well adapted to that size and scale. These are among the more mature, established cities comfortably functioning within the range of energy optimality for leading social systems, much as have many advanced nations whose Φ
m values bent over atop S-shaped curves, like those discussed in
Section 3. Mature cities also seem, more or less, to have relatively constant populations, that is, fairly sustained structure as well. They hardly complexify much more, and so it is reasonable that they have nearly level Φ
m. (Those labels are not meant to be insulting; mature cities are to developed countries as adolescent cities are to developing countries regardless of their age. For better or worse, the difference is all about how, how well, and how timely cities use energy.)
Alas, not all cities’ Φm values are on the rise and some of them are not even flat, so are no longer complexifying. These are the cities that are failing, usually as their Φm values decline. Only an injection of renewed energy can help them, lest they collapse as viable places for humans to cluster and enjoy a life worth living.
4.3. Winning Cities, Losing Cities
Winners and losers populate the spectrum of complex systems across the Universe. Vibrant starburst galaxies among red-and-dead ellipticals. Blue stars ablaze among red giants and white dwarfs nearing death. Life aplenty all around us on Earth despite 99 percent of it once coping is now extinct. Organized society benefits humanity yet humanity is now so deeply threatened. Cities and economies, too, experience gains and loses while each provides both goods and bads throughout our lives.
Researchers have long noticed that big cities resemble massive stars, one attracting people and the other atoms, both seen brightly while evolving slightly. Useful lessons might lurk for cities despite their greater complexity and much higher Φm than for stars, if only because the thermodynamics guiding both is much the same. We do know that the biggest stars “live” fast and “die” young, usually imploding at “death.” What we do not know is whether big cities grow and densify at their own peril and if they too might someday collapse under their own weight.
Cities as well as nations and society itself are products of culture, each of them partly a progressive attempt to control energy. Each of these complex systems—and many do look and feel subjectively very complex even without numbers objectively confirming it—thrive when human actions accept favorable factors and decidedly reject the rest. As metropolitan areas culturally evolve, they change, adapt and often directly select their built infrastructure, consumer lifestyle and human behavior. Chance is somewhat eclipsed while necessity often prevails and intentionality ventures forth.
Cultural evolution differs from biological evolution in that culture is Lamarckian, biology Darwinian. Perhaps uniquely among life-forms on Earth, we humans can work to make change happen while actively striving to endure. Cultural adjustment and selection are mostly intentional, planned. In the ubiquitous mix of chance and necessity shaping every changeable outcome, determined actions (the necessary part) count more than random events (the chancy part). We are mostly in charge, so there are no excuses. The future is largely ours to make of it what we will. It is up to us to decide if and how cities’ success depends on thrifty economies and higher efficiencies reducing the energies that make them run, or on vigorous use of abundant energy driving cities forward without much limit provided it is clean and safe. Conserving energy and using it efficiently are always welcome since without them we would likely pay more for energy. However, frequent assertions that energy savings confer competitive advantages seem dubious and might even be dangerous.
Cities can profit economically in the 21st century when their residents take full advantage of richly available solar energies not only to power society copiously but also to better solve environmental impacts inevitably caused by any system’s evolution. Cities need not be places where more residents chase fewer resources. With the Sun, our prime resource is so plentiful—as well as cleaner and safer than any energy ever used by humanity—untold numbers of people could comfortably exist in cities and nations nearly anywhere on Earth.
Thermodynamics’ laws demand adherence. Cities able to manage their energy budgets optimally are most likely sustainable in the long run—or at least improve their odds of surviving with careful work and resolve. Other cities using too much or too little energy—beyond an optimal range of Φm, much like all complex systems—are naturally and non-randomly selected to abort. They fail, lose or otherwise terminate, for the underlying laws of Nature, unlike the systems obeying them, are unchanging and non-negotiable.
Cities, as for the nation-states housing them, rise or fall based on their energy budgets. War is too burly and famine too slight, both dreadful ways for cities to fail. Yet, urban collapse can also be subtle; cities can scrimp on energy while starving their economies or use too much energy while outrunning their infrastructure and overheating themselves with waste heat. Optimal energy, clean and safe too, is just right to sustain smart, successful cities.
Despite meager, if any, energy savings as most cities grow and develop, how economically cities are structured or how efficiently they function can sometimes relax per-capita use of energy as cities mature. That might be why for the whole US nation, where four out of five citizens already live in greater-city, metropolitan areas, the rise of Φ
m has slowed (and maybe even stalled) in recent decades [
70]. That much is clear from
Figure 2, where centuries of data show Φ
m for the US now nearly flat. What’s unclear is whether that is a sign of a robust nation having matured or perhaps one in decline. These data are not inconsistent with a general impression among many people that America’s days as a leading democratic nation are numbered. The past two decades have resembled the so-called Long Depression following the US Civil War in the mid-19th century. Economic downturns during the “dot-com crash” of 2001, the Great Recession of 2008, and the pandemic-induced and Russian-provoked deep dive of 2020–22 have sapped us. Most Americans have not fared well during this spell, with salaries stagnant, net worth falling, young people unable to afford homes, public education funds cut to the bone, while the national debt tops
$32 trillion.
Reasonable outcomes for evolving cities generally expect their rising Φ
m to gradually turn over atop an S-shaped curve, much as for several developed countries now and presumably many more developing countries later. This trend was noted earlier for many complex systems’ progression from origin to growth to maturity—rising slowly, then rapidly, followed by gentle headway again. That is also what is likely happening for some energy-intense North American cities, such as Washington and Toronto plotted in
Figure 3.
However, total energy budgets for viable cities will not necessarily or perhaps ever decline for long. If they did it might be a bad sign, losing exactly what most keeps them going. That seems to be a common misconception among urban analysts and city planners who seek to manage cities by statically stabilizing them, equilibrating them. By contrast, non-equilibrium thermodynamics implies at least as much and maybe more energy can best dynamically sustain our cities, our economy, our society, indeed all of civilization for as long as these complex social systems endure.
Most cities noted earlier and including those plotted in
Figure 3 are doing fine. Whether increasing or flattening their Φ
m, they are winning cities, or at least ones able to bear their built structures and work their many functions for the good of their residents. In fact, the majority of cities worldwide seem to be doing okay, despite the energy and climate crises confronting them. However, not all are; some major cities are hurting.
Failing US cities such as Detroit, Buffalo, and New Orleans, among dozens of others officially or effectively gone bankrupt worldwide such as Damascus, Karachi, Pyongyang, and Port-au-Prince are not immune to thermodynamic consequences. Inability to optimize their energy budgets is one likely reason why these cities are good examples of bad outcomes, the main ones being living costs and job losses. Their economies are crashing, if not yet burning, though they might still recover with shrewd application of renewed energy.
Detroit is the epitome of a city having serious economic issues with, near the start of the 21st century, little industry, huge debt, social mismanagement, 20 percent unemployment, and less than half its population of nearly 2 million people a half-century ago. Today it is a naturally collapsing city on the brink of operational ruin, its demise understandable energetically. The Motor City’s S-shaped curve of Φm is neither rising nor flattening. After reaching a peak in the mid-20th century, its energy budget fell as the city devolved. At its lowest point about a decade ago, half of its street lights and a third of its public buses were not working and more than a million residents had fled the city.
Detroit is not the only economically challenged city, nor the only clearly troubled place where population has fallen for decades. Grand Rapids, also in Michigan, is largely boarded up among many cities in and around America’s Rust Belt. Buffalo began shrinking with a sinking energy budget starting a century ago. New Orleans is failing because it is literally sinking below rising seas, tanking financially and dying energetically. Baltimore, Philadelphia, Mexico City, Moscow among several once proud cities all seem tired, broken, lethargic—their sidewalks crumbling, lampposts leaning, roadways potholed, their people glum. Those cities’ values of Φm, to the extent data can be found to reliably compute that metric, are low, typically less than 60 W/kg and sagging.
New York City, noted earlier, might also be slightly declining in Φ
m and it is unclear if that results from more efficient use of energy or is a harbinger of economic distress. Its data are sparse, poorly reported and extend over only the past decade. Washington, too, as shown in
Figure 3, seems to have reached a peak in its Φ
m near the year 2000 and is now falling, maybe. Its data are also limited, so it is unknown if a downward slide is real for either city. Some things are clear if conflicting: New Yorkers are rightfully proud of their well-run transit system, which implies optimal energy use, and Washingtonians work mostly for the federal government, which is increasingly dysfunctional.
All is not lost and aid is coming to many depressed cities. A few years ago, for example, downtown Detroit began what might be a turnaround, led by new home construction that raised its energy expended. JPMorgan Bank, which had reaped grand profits from a century of bankrolling the world’s leading automotive industry, poured money back into the community to help rescue old buildings for those folks willing to return. Abandoned Victorian mansions were offered for $1 to city workers able to repair them; rock-bottom rents allowed people to repopulate livable apartments; thousands of foreclosed homes were bought for a few hundred dollars each on credit cards.
Resurrecting any city creates jobs and needs supplies to fix up whole city blocks and deserted neighborhoods, which in turn requires energy. For Detroit, livening vacant buildings where little or no energy had been plied for decades is sure to raise its per-capita energy use. This once dying city has emerged from bankruptcy and restored basic services like streetlighting and road maintenance, giving it a chance to recover anew. Only time will tell if it can sustain this economic upturn even as builders complain about material and labor shortages—a demand for more energy in a city perhaps still unable to supply it. All the more reason for cities on the mend to look up and around at the golden solar energies raining down upon them and then act innovatively to grasp it.
Many cities around the world are struggling to lift themselves up by their own bootstraps or expecting handouts from others to bail them out besides those already mentioned: Baghdad, Juarez, Kinshasa, Barcelona, Genoa, Leipzig . . . . Ironically, some of them were once well run in developed countries, providing ample public services for their residents, yet are now mired in poverty, substance abuse and homelessness. Much the same also pertains to some post-industrial cities and towns of the US heartland in addition to those noted above: Cleveland, Memphis, Pittsburgh . . . . That said, help is on the way because with a solar revolution more energy is on the way.
Without government intervention, mostly as money handouts for energy-related tasks, cities with decreasing Φm could well abort. Unable or unwilling to adapt, they would likely be culturally deleted as viable urban entities. Nature would naturally select them out of existence. At best, the most troubled cities might be urban-renewed as smaller, less complex social systems. Razing, repurposing, revitalizing, rebuilding, much of it with sweat and tears (a kind of energy), yet none of it without applying real energy that can make a difference. Money alone cannot guarantee economic recovery; throwing dollars at any problem without a plan or purpose seldom works. Only energy influx (probably bought by money) has a chance—and only a chance if clean and safe—to rejuvenate failed cities.
Cities can indeed collapse, even great ones. Many have previously fallen, including Sumer’s Uruk and Ur, Egypt’s Memphis and Mohenjo-Daro, Persia’s Babylon, ancient Rome, Troy, Angkor, Teotihuacan, among others that came and went throughout recorded history. Most vanished via conquest, disease, or environmental disruption, forcing their urban energy metabolisms beyond the bounds of optimality. Warfare uses too much energy, famine too little, and sometimes not even economic revival can prevent failure [
71,
72]. Modern world regions larger than cities yet hardly qualifying as nations can also fail and have. As megacities and city-states grow some of them will rival whole nations in size, scale, and energy budget. From those regions malfunctioning today we can learn how growing cities might avoid similar fates. Here are a few examples:
Puerto Rico was the first US territory (neither a state nor its own nation) to file for bankruptcy protection in 2017. This Caribbean island of 3 million people owes some
$130 billion in public debt, dwarfing the nearly
$20 billion bankruptcy filed by Detroit. Faced with an economic recession over decades, a “brain drain” to mainland US and several damaging hurricanes that destroyed much of its energy infrastructure, Puerto Rico has suffered a steady decline in Φ
m that has nearly caused its basic public services to collapse. Its energy use per capita (now about 65 W/kg and comparable to China’s) is half what it was decades ago and hardly a third that of the 50 US states averaged, dropping it to “developing” rather than “developed” status (see
Table 1). The US government is now trying to prop up its energy flow by rebuilding its electricity grid—a smart move, especially if fed by the abundant sunshine and blustery winds for which most Caribbean islands are well known.
Venezuela, mentioned earlier and now hardly more than its capital of Caracas whose population is falling, is in full economic retreat despite its rich oil reserves. Not only have millions of people fled this once proud region in recent years, its falling Φm (now about 50 W/kg) has also devolved it out of developed status. Reason is, at least partly, Venezuela’s leaders cannot agree how to manage its energy budget optimally. The result is a humanitarian crisis with widespread hunger, malnutrition, armed groups roaming the countryside and a crumbling infrastructure. It has been teetering on the edge of failure for years, yet its revival is all around it. Its own energy supplies could bail itself out, dirty as oil is, then buy its way with the profits to build renewable solar technologies that could lead South America toward an auspicious future. Of course, local Marxist politics and crippling US sanctions are not much help.
Syria is a region in default and all but destroyed save its capital of Damascus, an excellent case of an insane state of modern affairs. More than a city, yet hardly a nation any more, it is a dysfunctional complex system whose energy budget has hit rock bottom. Its Φm (roughly 15 W/kg and diving, comparable to North Korea) is far too low and its economy broken, except during its ongoing civil war when its energy use is much too high. Either way, Syria is a failed nation-state, as is Somalia, Afghanistan and a few other countries having energy flows usually much less (during peacetime) and occasionally much more (during wartime) than optimal. A logical solution is for Syrians to leave their homeland, as they are already doing in droves. A better solution would be for Syria to use its vast, open lands (the size of Oklahoma) to build huge solar farms in its sunny interior and wind farms along its blustery Mediterranean coast to produce electricity for itself and its neighbors—creating jobs, regaining a quality of life and becoming a centerpiece for Middle East security.
All three of these weakened regions had been on the rise for many decades, their total energy consumed, per-capita energy usage and their economic wellbeing steadily strengthened—complex systems evolving nicely for the good of their citizens [
73,
74]. Now, each is trending downward in people served and in Φ
m. Instead of complexifying, they are simplifying, which is usually an adverse evolutionary trend. All three have recently lost some 20 percent of their population, swelling emigration from Puerto Rico and Venezuela toward the US and Latin America as well migrant caravans from Syria and other Mideast nations into Europe. Energy use gone bad can disrupt the world.
Even as some cities, nations and regions fail or flourish, others work to remake themselves. In an interesting development with great promise, some leading geopolitical centers seem to be evolving into huge and vibrant city-states. Regional clusters of cities not just surviving but also thriving could be among the biggest winners of the next great evolutionary advance—complex systems bigger than megacities that might someday replace nation-states. Fact is, no one knows how long our traditional cities might endure while culturally evolving or even what they become when they really grow up.
Emerging city-states might be opportune systems to actively tackle the energy crisis and its biggest victim, climate change. Some cities are already well ahead of nations in combating environmental pollution and global warming [
75]. When the US rashly pulled out of the Paris Accord in 2017, mayors of more than 400 cities formally pledged to remain and honor its goals. Now that the US is regaining good standing with much of the world, many more cities are doubling down and working together to forge ahead sensibly while ignoring those places crippled by climate conspiracies. Some US states, too, have joined in common cause, especially coastal regions like New England plus New York state along the eastern seaboard and California, Oregon plus Washington state along the west coast.
An example is the cities of Boston and nearby Cambridge where citizens have adopted a “fossil fuel free” standard to be achieved by 2050 and they fully expect companies, residences, universities and institutions to abide by it [
76]. Kudos to these progressive cities for even having a plan—bottom-up local actions that often trump top-down federal inertia—but nobody should hold their breath. Over the past two decades, hundreds of US cities have pledged to use clean energy to reduce carbon emissions by some future date yet a respected Brookings Institute report recently showed most of them struggling to meet their ambitions [
77]. Such a fine fossil-free goal, at least for electricity, might be doable for forward-looking cities and some nations, but not for the whole world, not in a single generation. Most nations are only beginning to develop technologically.
A leading example of a city-state is Singapore, which may provide as much as any place on Earth a glimpse of the future. A small island nation as well as a large megacity independent of Malaysia, Singapore is simultaneously a prosperous seaport in Southeast Asia and a smart metropolis stressing science and technology talent to elevate the quality of life for its residents—all 6 million of them housed in an area half the size of London. With strong schools feeding a highly skilled workforce guided by systems thinking and data-rich problem solving, it is unsurprising that Singapore’s Φm is among the highest of any nation—nearly 400 W/kg (20 kW/per), which is an order of magnitude larger than the three failed semi-nations just noted and double that of even the well-off US. Singaporeans use that great energy flow to innovate everything from housing, transportation, and healthcare to networked infrastructure and commercial development. The result is a model Asian society leading the way in promoting research, development, and entrepreneurism as well as active citizen engagement to better living standards for all. Its wise embrace of all things energy has allowed this undersized country to become an oversized player on the world stage.
Hong Kong, noted earlier and plotted in
Figure 3, is also a city-state, as are Monaco and Vatican City. Or at least Hong Kong was under British rule until 1999, yet now its status as an independent city-state is not as clear as China tightens its grip. If China is smart it will hold high this vibrant city as a shining example of how to manage energy flows on behalf of many people in big cities. And if it also emulates Hong Kong with its other giant cities, China could well be on its way to ruling much of the world while evolving further into the 21st century, democratically or not.
City-states are not new, not even those of medieval times, such as Venice, Milan, Florence, Rome, and Naples, all now united into the nation of Italy. They date back at least millennia to the powerful Aegean islands before merging into modern Greece. City-states dot historical maps, many of them eventual failures. The rise and fall of Maya society throughout central America, notably in Mexico, Guatemala and Belize, offer a fascinating case study. Especially so since the Maya were such a highly organized society centuries ago, with impressive cities linked by flat, linear walkways cutting through rough jungle terrain. They had a calendar more accurate and an agriculture more productive than the Spaniards who conquered them. Their success was likely, at least in part, a result of astute management of their energy resources . . . until it was not [
78].
Most nations and their cities naturally strive to win and thus survive, to create successful, pleasant places for their residents. However, failure is just as natural and seemingly a frequent occurrence throughout cosmic evolution for all complex systems, alive or not, and urban locales are likely no exception. It is too early to know how long cities endure as ordered entities, quite impossible to predict where the curves of
Figure 3 are headed. Cities are among the youngest creations of cultural evolution on Earth and it is unclear how dynamically stable or randomly susceptible they are against internal and external forces. They could be among the biggest losers, hardly more than fleeting systems in the larger scheme of all things complex. Physical, biological, and social influences might fundamentally remake (by adaptation), or even eliminate (by selection), cities all across the globe.
Jane Jacobs was right comparing cities to ecosystems and “… because of their complex interdependencies of components, both kinds of systems are vulnerable and fragile, easily disrupted or destroyed.” However, she foresaw dark days ahead as technologically challenged cities crumble and never recover, their decaying culture and degrading ecology simply unsustainable. She might have alluded to, as we now suspect scientifically, only few cities, like few species, long endure, but in her final master work she painted a much gloomier, Cassandra-like picture for cities on Earth [
79].
Most of us do not want to accept a negative outcome, urging instead a chance Jacobs was wrong and history need not repeat—but only a chance on which we must act now. The likelihood of our cities, our society, and ourselves being winners might seem slim, yet a positive road forward also seems clear. Our future is surprisingly in our hands, with necessity and intentionality playing key roles. Cities that are rich in energy and optimally managed can be anything but dark, in fact quite bright in health, wealth, security, and social wellbeing.
The upshot of much of this unorthodox city analysis, however quickly urban experts might dismiss it, is this: As cities evolve, some efficiencies are naturally realized owing to city structures, but sizable savings from energy-driven functions are not likely among them. Total energy budgets rise for growing cities and so does per-capita energy usage (Φm) for many urban residents. Generally, the larger the city the hungrier it is in nearly every energy sector, transportation perhaps excepted if pedestrians eventually prevail. Successful cities, if nothing else, are growing—upward, outward, economically, and energetically, as well as in number and diversity of people.
To survive, cities of the future will not necessarily need to become more energy efficient, though it would be good if they do. Advancing cities procure (or produce) and use (or store) more energy—not only more total energy for their vibrant urban economies but also likely more per-capita energy for use by their individual residents. As advised, only the Sun and its renewable sources of shining light, blowing wind, falling water, and warming air can possibly provide humanity with the clean, safe, and abundant energy needed to endure without risking destroying our planetary home, which for most people in the foreseeable future will be cities. It is indeed time to stop digging up stuff on Earth and making a mess to boot, and time to start looking up at the solution staring us right in the face.
4.4. Whole Greater than Its Summed Parts
As trends trend and growth grows for complex systems, it is natural that their early rapid rise in Φ
m later slackens with time. Many of Nature’s complex systems that are well adjusted and optimally energized display Φ
m roughly plateauing or at least slowing their complexification. Some of these, such as our Milky Way Galaxy historically, the Sun over eons and many of Earth’s life-forms that have evaded termination for millions (if not billions) of years, show nearly constant Φ
m, sketched as dotted lines in
Figure 1. Apparently, input energy (supply) eventually is not enough to satisfy what is needed (demand) to continue complexifying some systems indefinitely. Could Nature’s remarkable evolution of system complexity ultimately reach a pinnacle or culmination—the bold, blue curve in
Figure 1 hitting a limit some very distant day?
Without overinterpreting the data displayed in
Figure 2 and
Figure 3, the national and municipal trends plotted do support an outstanding hallmark of complex systems—that wholes exceed their many summed parts. That is, as systems complexify, new features sometimes emerge over and above those expected by summing less complex systems. This hallmark was noted previously when finding in
Section 2.1 the value of Φ
m for the whole of human society is currently more than an order of magnitude greater than that for the average per-capita energy consumed by all individual humans on Earth today; and later in
Section 4.1, where Φ
m data for whole cities, cursory though they are, seem to exceed the total energy expended per person by its many residents. This tendency holds also for states, or provinces, which are larger than cities but smaller than nations, and whose Φ
m falls between those for cities and nations. Most US states’ per-capita energy stats show much the same trend: significant rises in mid-20th century, then more slowly over the past few decades, much as for the US nation as a whole [
73].
Generally, the complexity of nations does exceed that for states, and states that for cities, and cities that for households.
This hallmark of wholes exceeding the sum of parts is not really a case of “more being different” [
80] as much as more being literally more [
6]. There is no need to invoke magical qualities infusing the notion of emergence, for which many complexity scientists appeal to self-organizing, self-assembling or self-sustaining (none of which actually happens without energy involved) or any other mysterious ways and means for complex systems to gain new features all by themselves. In reality, it is more likely that added energy helps systems to facilitate greater ordering of new structures and new functions in accord with non-equilibrium thermodynamics and thus evolve from simplicity to complexity without any magic or mystery at all.
Anthropological evidence does imply simpler systems evolved into more complex ones as our forebears abandoned hunter-gatherer lifestyles and began cultivating the land. They first clustered into rural villages as long ago as 10,000 years, grouped into cities as agriculture grew, then into larger regions and eventually nations, even clusters of nations, or empires. Historically, cities led bottom-up, followed by states and nations, each using surely more total energy and likely more per-capita energy (Φ
m) as each type of social system hierarchically complexified [
17].
That today’s Φm values for states are greater than those for cities provides another example of wholes exceeding their summed parts. The city of Boston, for example, whose Φm noted earlier is ~85 W/kg (4.2 kW/per) is the capital of the state of Massachusetts, which has a higher value of 140 W/kg (7 kW/per). This inequality holds for many cities and states, at least in the US where data exist to make the comparison. A state is arguably more complex than cities within it, much as any state governor would admit when dealing with many varied city and town mayors. Ditto for New York City and Denver that reside in the states of New York and Colorado, whose Φm of 135 and 185 W/kg are each higher than their city values of 80 and 110 W/kg, respectively.
Most US cities for which data are available have Φ
m between 70 and 120 W/kg [
66], whereas most US states in which they are located have values somewhat higher, ranging from 130 to 200 W/kg (and even higher for some outlier mining and drilling states having few cities like Wyoming, Alaska and the Dakotas since to produce energy requires energy) [
73]. In turn, when states are analyzed as networked together within the entire US nation, uniting all 50 states into the United States, we find an even higher Φ
m, currently some 200 W/kg for the whole country, as computed for
Table 1.
In other words, major US cities average ~100 W/kg (5 kW/per) or about half that of the entire US nation. That is because not everyone lives in cities, not all cities fail to economize and not all energy used nationwide involves cities. Planes, trains, buses, and trucks crisscrossing the nation are not included in cities’ energy budgets. Nor do cities usually house food farms, power plants or shopping malls found in the countryside where energy production and consumption can be locally high.
An example is the huge amount of jet fuel used in 2019 to power US commercial airliners flying nationally and internationally—at a rate of 130 GW, which is a few percent of all energy used that year in the US—and none of it charged to the energy budgets of cities or states. Another example is the network of roads on which so much of America’s commerce depends. Energy is needed to build and maintain state highways that cities are not responsible for. Likewise, interstate highways get charged, both money and energy, against neither cities nor states, rather the whole US nation.
State and federal governments provide more structures and functions that benefit cities and added energy is needed to wed their many parts wholly to make it happen. That likely does make states more complex than cities and nations more complex than states, much as the Φm numbers imply. They also suggest cities are at the base of this social hierarchy, which again is not surprising.
The federal government does indeed consume huge amounts of energy across the US that is excluded from city or state energy accounts. Not just for post offices, court houses, and national parks, but also its many departments and agencies (State, Treasury, Defense, Justice, Commerce, NASA, etc.), each with bureaucracies and facilities using energy and costing money. The Defense Department is the biggest employer in the nation and the US government is the nation’s (indeed the world’s) largest single collection of workers, buildings, vehicles, ships, and aircraft, all of which consume energy paid for by faceless taxpayers—roughly 40 GW in 2019, which is another percent or so of the nation’s total energy budget (~3.5 TW) not counted by cities and states. Even during peacetime, the US military uses energy at the great rate of some 25 GW, equivalent to two dozen major nuclear reactors running full tilt, full time.
Many find it hard to believe that government could add so much to a nation’s energy budget above and beyond what is normally used by its citizens going about their daily routines. However, it is not a belief and two factual examples suffice. The US Postal Service, while headed in 2022 by a right-wing political appointee, ordered a whole new fleet of some 150,000 mail delivery trucks, hardly any of them electrically powered, almost all of them running on gasoline-fired internal combustion engines. At $11 billion for the total purchase, each vehicle cost nearly $75,000 and gets 30 L per 100 km (8 miles per gallon). Also, the US Army, always conservative while stressing reliability so using more expensive yet less explosive diesel fuel, has some 8000 battle tanks, each costing about $9 million and each using some 4 L per kilometer (0.5 mile per gallon).
So, nations likely have larger Φm values than municipalities comprising them, suggestive of wholes exceeding their summed parts. Likewise, states within nations often have Φm larger than the cities comprising them. In turn, cities have somewhat larger Φm than individuals or families housed in them. None of this should be unexpected since cities, too, have added energy needs above those of its single citizens or households, such as city government, public education, police and fire service, bus and subway transportation, among other urban infrastructure that makes cities attractive to many people.
Each level of increased complexity seems characterized, at least partially, by more energy used in total as well as, especially, more energy per capita., with people the essence of cities, which are the basic building blocks of nation-states everywhere. It will be important to check these trends and insights as cities, states, and nations develop, mature, and succeed or fail.
Though the US nation is not representative of the world on average, it is likely these trends (even if not the specific values quoted since all are changing with continued advancement) are much the same beyond the US, where new cities are sprouting, population is growing and energy use increasing. We cannot be sure that complexity rises for all cities, states, and nations until better data are in hand. However, of this we can be reasonably assured:
A big idea repeats in Nature and is worth repeating in words as well, which is good and useful if we are to gain a valid understanding, or at least a close approximation, of reality. At the heart of Earth’s global economy, many world cities grow and complexify, hungering for more, not less, energy—always totally and often per-capita. Energy rate density, Φm, generally holds as metric, or at least a proxy, for national and urban complexity, much as it does for so many other complex systems having emerged throughout cosmic history, from big bang to humankind. Like stars, galaxies, plants, and animals whose impressive wholes outperform their component parts, cities and the nations in which we live are also vibrantly and functionally more than the sum of our individual selves.
If the pace of life nowadays feels energetic, it is probably so. Nations and their cities are products of cultural evolution near its apex to date, differing much in degree yet little in kind of complexity from other physical, biological, and cultural creations of cosmic evolution. They use stunning amounts of energy controlled by us and do it in ways remarkably similar to so many other complex systems known anywhere in the Universe. Earth’s cities, in particular, perhaps our greatest cultural invention, and soon to be where three-quarters of all people live, are integral parts of Nature.
5. Commentary: Energy, Efficiency, Conservation, Economy . . . the Sun
In this final section, I offer less formally, as commentaries often are, a relaxed discussion of issues aired in this paper, peppered with some personal bias alongside facts and figures. I maintain an open mind and a willingness to change while exploring solutions to problems desperate for change. Without change society cannot endure; with change we have at least a chance to survive and prosper, yet only if we deliberately choose to change—that is, only if we grasp necessity more than chance. To my mind, solutions to existential crises on the horizon are all about energy and all about timing—intentionally selecting solar energies and doing it quickly without leaving anything to chance.
During my lifetime, I have experienced three major economic crises sparked by energy demands outstripping supplies. In 1973, a global energy shortage caused by an oil embargo and political unrest in the Middle East caused widespread panic as the price of energy doubled overnight and people spent hours in long lines at US gas stations (often with their engines idling) seeking to fill their vehicles or hoard whatever gasoline they could find. Energy use fell worldwide and so did society’s Φ
m. The short supplies were real, the frenzied demands were daft and energy prices rose higher as people feared they could not get enough of the one thing in life they needed most. Much of society spiraled out of control, deep recession set in and it took decades to recover. If it has . . . the most recent plateau in Φ
m for both the US and other nations began around 1980, as seen in
Figure 2.
Two other global economic upheavals were basically energy crises caused by declines in energy use—in one case no one could afford it, in the other it could not be bought at any price. The Great Recession of 2008 followed the crash of a sizzling global economy, caused largely by mismanagement of peoples’ money and housing mortgages by big banks, which meant demands for fossil fuels exceeded supplies, threw people out of work, sparked rampant debt and damaged the economy. And in 2022, energy scrambles following western nations sanctioning Russia for its barbaric invasion of Ukraine caused energy prices to spike in the midst of a serious worldwide pandemic that was triggered by an invisible virus and handled poorly by political leaders of technological nations. The global economy then faltered owing to energy shortages when Russia retaliated by shutting off their natural gas pipelines to European nations that relied on energy from an enemy. Energy use again stalled worldwide and so did society’s per-capita use of it. As often occurs when energy supplies slacken, the price of oil and gas soared and fossil-fuel companies made a windfall, some of the biggest firms tripling their profits from a few billion dollars to nearly $10 billion in a single quarter.
At least these recent downturns were not as serious as many people of the previous generation lived through during the Great Depression of the 1930s, which was also an energy crisis. Many economists prefer other causes, including government policies, bank failures and pure panic. Yet, the per-capita energy use for the US nation flattened for a quarter-century starting in the mid-1920s, which can also be noticed in
Figure 2—the history of Φ
m for the US. Since the decline in energy usage began a decade prior to the depression’s peak, energy (or lack of it) might have been the main reason for the greatest economic calamity of the 20th century [
81].
However, reality is more complicated, not surprisingly since humans and their society are among the most complex systems known. Since energy and economy are also coupled as noted earlier, each likely fed back upon the other. As energy use fell, the economy sagged, which then caused even less energy used, driving down the economy even more and so on . . . until energy use once again grew fast (and furiously, dangerously) during World War II and then greatly (yet slowly, safely, optimally) with surging economic activity in a few decades that followed.
Hence, a good reason to keep nations’ energy budgets rising and optimal or at least stable and secure. In each of these world-changing episodes, some internationally shaking event caused the global economy to falter when society’s supply and demand could not be matched, notably when energy shortages became prevalent at home and abroad. And that, more than anything else—namely, the real or imagined lack of the one commodity that society so desperately wants—is what periodically causes good, honest people to become distrustful of government. Pocketbook issues do dominate among all else.
In contrast to these periods of depression that often define economies historically—the curves for Φm do get graphically depressed during economic depressions—the idea that cities run metabolically like life itself allows us to view today’s global economy more confidently despite its current unease. Urban energy metabolism is an upbeat way for people living in metropolitan areas to appreciate how cities can continue evolving their form and function without overly degrading their surrounding environments. As always, physical inputs of energy, water, and materials are accompanied by outputs of products, services, and still some waste. Yet, material trash and thermal waste can be minimized while the Sun liberally bathes cities in green energy and frees their residents from using fossil fuels. That is the kind of positive economy—an open, dynamic, non-equilibrated, solar economy—we should create going forward, locally, regionally, and globally.
Some urban experts accept the idea of metabolism as a constructive economic process, yet persist with mainstream equilibrium economics while urging cities become more efficient by reducing energy [
82,
83]. This seems only marginally helpful since we are unlikely to benefit much by either underusing or better using existing energy in today’s energy-centered society. Parsimony is not a virtue for realistic, robust economies—not when it comes to the energy demand that drives them. Most successful cities show their trends in Φ
m rising or nearly level, but surely not falling. And those that are falling are invariably so troubled we best not go there.
Do city energy-usage curves (
Figure 3) eventually flatten because of efficiency gains or simply the way cities are built? Maybe their residents purposely use less energy per capita while living smarter lives. Or maybe they just naturally economize in densely built urban areas without even realizing it. City dwellers own fewer cars when public transport works well, their tight-knit neighborhoods have common services that might reduce energy use, and their compact vertical buildings have shared walls that do lessen heating or cooling of apartments and businesses.
City living is unlikely more efficient because of active steps taken by residents to conserve energy as much as benefits naturally gained from living in heavily built environments . . . though it could be some of both, yet limited. It is also natural and not due to residents’ scrimping that heat-island effects lower heating needs somewhat in winter when energy demands peak. Furthermore, shorter commutes across town naturally lower transport needs for those working in town. It could also, however, be just as natural that the most vibrant cities are those that continue raising their energy budgets indefinitely, albeit slowly. And with a solar-based society, such endless growth would be safe and sustainable in a world where solar energies are cheap and abundant.
Some economists and architects urge the design and building of larger, denser, higher-rise cities for the sole purpose of making them efficient, low-energy systems [
84]. Some of these urban experts envision an ideal planet dotted with vast megacities having upwards of hundreds of millions of people living in extremely tall structures in highly compressed settings. They imagine vertical sprawl as conducive to energy savings in a world where energy savings are vital so long as dirty energy dominates from burning fossil fuels. Far from the future, this trend is now catching on. Shenzhen, for example, just across the water from Hong Kong, has gone all-in for skyscrapers at least 200 m tall (60 stories). About 150 of them in 2020 dot the skyline of this one city, often called China’s Silicon Valley, which is more than for all US cities combined. In crowded Hong Kong, which has “only” half as many skyscrapers that tall, they had to build up. In Shenzhen, with plenty of surrounding land, they chose to, and as with other towering Chinese cities they are now wondering why since many of them are vacant.
China is not the only nation building its cities upward rather than outward. In New York City, some buildings towering still higher often creak like a ship’s galley while swaying naturally in the wind, as does Boston’s tallest, Hancock Building. Maybe that is why residents there feud with the managers, snipe at each other and fly into a rage when the elevators malfunction. Engineers can get heating, cooling, and lighting to the upper floors but it remains an energy challenge, not least pumping water up and pushing trash down. Few people want to live like that, riding into the clouds and back while overcrowded and scraping by at every turn—surely not those raised in wide-open rural areas yet flocking to cities in droves worldwide.
Other urban planners favor pedestrian friendly streets and restricted building heights. They even see horizontal sprawl as okay—not Houston-like with its wanton construction within wetlands and flood zones, rather moderately dense, easily mingling, residential and commercial zones spread upon dry land. What is not to like about extending cities beyond a downtown hub, blending some greenery and making more oxygen, building homes and businesses in low-slung cityscapes with many rooftops for solar panels and wind turbines to abate heat-island effects while smartly providing our most vital need in life? In a word, transportation, some say, and indeed public transport does need improvement just about everywhere on Earth. Yet, with clean, solar-driven electricity running machines and gaining traction, we can be confident movement in and around cities will soon be bettered if only because electrical energy should be a quick win rather easily achieved. Society has a decision to make: Should our commutes be along the ground on swift trackways amidst green-lined corridors or up and down in streamlined lifts inside tall, glassy towers?
Let us opt for cities to resemble suburbs—habitats for living, working, and playing close to the ground for maximum interaction among people, not up in the air where most hide behind metal doors of small apartments in huge buildings resembling US housing projects or Soviet tenement blocks of the 1950s. Society has been there, done that and it does not work. By contrast, something between sparsely populated exurbs and closely packed city cores, spread horizontally more than vertically, thereby coaxing social dealing at street level and shunning neighborhoods stacked well up into the clouds one atop another.
Low-level Mumbai as opposed to high-peaked Dubai; height-limited Paris more than sky-scraping Chicago. Relatively flat cities would not work for those people intent on looking down from tall perches even while using fewer fossil fuels, but might be just fine for others eager to use plentiful solar energies captured on every roof aimed up. The taller the buildings, the less roof space is available for panels or turbines, and conversely.
Jane Jacobs was also right in judging cities by its people, not by its steel and concrete buildings. Cities are not just fixed structures; as complex systems they also have functions. Architecture is not architectural science, it is subjective, emotional, and devoid of much testing to decide which style is “right.” Human beings are intensely social creatures and their diverse functions when aided by city functions can be highly beneficial. Cities and the people living within them, not companies and industry that employ them, are what make most innovation possible—what will likely drive future economic activity locally and globally [
46].
Are cities efficient? Some surely are. Do they save energy and money? Again, yes, both welcome and wise. Can those energy reductions make a real difference globally? Not nearly, not likely by any means. Some big buildings can save energy, but with plenty of cheap sunshine captured in the years ahead there is no need to be so economical. With solar energies we need not skimp here, reduce there or live in cubbyhole apartments. Sky-high, super-dense cities might be a decent way to live if fossil-fuel energy was the only way forward, but in a solar-based world little of that will likely be tolerated. With the Sun’s energy so inexpensive, savings of energy or money will not be foremost in life’s daily routine nor need everyone be shoehorned into megacities.
All the more reason to beak the habit of burning fossils and grasp the Sun for all our energy needs. With Old Sol beaming down upon us, we can behold its splendor while utilizing it too. Panels to collect sunlight, turbines to capture wind, hydropower plants to process water, pumps to suck heat from the air. Concrete cities can be claimed to be greener than their leafy suburbs only as long as they both burn fossil fuels. Once we have created a solar system on Earth, that will not be so anymore. And until we do, urban heat islands are a growing threat to public health [
85].
That is because another reason high urban density is unappealing is more objectively technical, going beyond subjective feelings about tall buildings, overcrowding or scant socializing. This reason stems from the cold, hard science of waste heat. Thermodynamics’ 2nd law inevitably creates waste especially in dense cities, including anthropogenic waste heat caused solely by the use of energy that adds to the heat-island effect already roasting some cities. The denser the city population, the greater this useless heat, regardless of how efficient a city might be—unless solar energies are used and then waste heat largely vanishes [
86,
87].
Cities can be larger without being denser. Just spread them out into extended metropolitan areas that resemble suburbs minus the sprawl. Call it regionalism like that surrounding Los Angeles and Athens, much like Greater-Boston, which is nearly ten times larger than Boston proper, or Charlotte, which is rapidly growing outward more than upward. Adjoining small cities and smaller towns mix the benefits of urban life and suburban living. If that means greater energy use, then that is a problem again only as long as fossil fuels are burned, yet will not be so with the Sun’s full bounty. And if that also means higher values of Φm, so greater complexity, then it also implies progress toward better health, less waste, more security, and likely greater wealth.
Rising complexity can generally be regarded as beneficial; falling complexity potentially troublesome. That is why no one should be worried that those people living in suburbs do often use a little more energy than city dwellers, which again will not be an issue once society cleans up its act and goes solar. Those in the suburbs usually have larger homes to heat or cool and tend to drive more often, as well as use more energy to maintain more property, including land that is almost always larger than owned by those living in cities. Suburbanites do have higher values of Φm, typically a few tens of percent more.
Larger yet thinner cities of the future will not need to bring suburbanites into city centers for jobs since most people will likely work from home. And if they must travel, commutes in electric vehicles charged with solar energies will emit no carbon dioxide and add no waste heat either. High-speed rail would be even better—cleaner, safer, and cheaper—provided it also runs on solar-made electricity. And if that does not yet exist in the US, then that is America’s problem. Many developed countries, such as Japan, France, and Germany—ironically ones the US bailed out after WWII—have fast-rail service that works impressively. Perhaps it is time for America to stop admiring its past and get on with its future.
Why criticize better energy efficiency, especially if it might cost less? Alas, even that is doubtful if society continues burning dirty fuels. Saving energy or using it more effectively will not likely reduce much energy use in a fossil-fuel-driven economy where, everyone agrees, less energy used is essential. The big fear is that by stressing energy efficiency and energy conservation, society will continue using those fossil fuels, thinking that reducing their damage is okay or good enough. Efficiency and conservation must not be considered a license to burn.
Emphasizing efficiently using or conserving current energies is a misplaced priority. The foremost emphasis for cities, nations, indeed the world, should be the creation of a solar system on Earth since the Sun maximizes available energy while minimizing inevitable waste. Energy savings are not needed, though might still be welcome, in a solar-driven economy where abundant energies are readily acquired and already cheaper as well. Minor energy reductions owing to efficiency gains up to a few percent pale in comparison with the large energy increases expected globally in the 21st century.
Heavily using the Sun’s astronomical output is not wasteful; it is the best way to sustain our lives and our way of life cleanly and safely. Limitless solar rays provide more energy and produce less waste than using fewer fossil fuels at any efficiency. And it is plentiful solar energies not meager fossil fuels that can best grow the global economy practically forever. If our descendants awake in 2100 to realize they are still burning dirty fuels, albeit very efficiently, they will be in more trouble than we are now since the total energy used by society then will be much more than used now.
In assessing energy, efficiency, and economics, we need to move the debate away from idealism and more toward pragmatism. We need to identify practical priorities while addressing today’s pressing problems like climate change, the energy crisis, and economic wellbeing. What comes to mind are computer programmers of the previous generation who stressed efficiency when machine language was hard to write and their big computers were slow and clunky; they needed to cut back and cut corners lest the machines run all night and overheat while crunching numbers. Now computers are smaller and agile, we know how to write code better and if answers are needed faster we just increase the machine’s power.
Today, we should not be overly worried about saving energy around the margins because it hardly matters. Higher efficiencies, while a noble idea and even when achieved, do not often amount to much in the real world. When emphasizing abundant solar energies, neither efficiency nor conservation are vital, only economical. Nations and their cities need not go on an energy diet. For example, if typical citizens in developing countries better their energy efficiency by even as much as 10 percent, so lower their energy used by a factor of 0.1, yet the amount of total energy they actually use grows as expected by nearly a factor of 10 in the years ahead, their energy savings are largely neutralized if not made moot. That efficiency gain is overly high, whereas realistically efficiency gains are hardly 2 percent per year over the past decade and in recent years even less than that.
For the past decade, advances in energy efficiency have been declining [
88]. Apparently, the low-hanging fruit has mostly been plucked, the biggest gains in efficiency likely already made. Global energy efficiency for each of the five years prior to the pandemic improved by about 1 percent since 2016, the weakest rate in decades and less than half the efficiency gains of the previous decade. Nations expecting less energy use in buildings, appliances, and vehicles to rescue our ailing planet seem destined to be sorely dismayed.
Consider a realistic case of African farmers or Asian millworkers seeking to better their lot, each using energy at a rate of ~1 kW, or 20 W/kg, as listed in
Table 1. While nearing equality with those in well developed countries who typically use 10 kW/per (200 W/kg), they might someday enjoy an order of magnitude rise in their per-capita energy usage. Yet, even if their overall efficiency of energy use improved by a generous 20 percent, each would save roughly 2 kW, so their Φ
m would equal ~8 kW/per, not the expected 10 kW/per. Higher efficiency does save some money as well as somewhat cleans the air and mitigates climate change when some people insist on burning fossil fuels, but only incrementally.
Consider another case stated differently yet with much the same result, this one China whose booming economy is growing faster than nearly anyplace else on Earth. As Chinese citizens seek to triple their per-capita energy usage (now 3.4 kW/per, again see
Table 1) to match that of the US (now 10 kW/per), and manage to do so realistically with a 2 percent annual efficiency improvement yet ~6 percent annual economic growth, they would still reach their American objective, albeit with about a decade delay. And that is their goal; parity with the West. They will still boost their energy use to high levels even with savings gained from using energy efficiently, and if they do it while still burning fossil fuels then everyone suffers.
Consider one more case, this one relevant to a developed country like the US. A 10 percent reduction in energy use of an appliance needing $100 worth of electricity to run it annually translates as saving $10. It would be nice to have that extra money in our pockets each year, but it is unclear if a 10 percent gain in efficiency can guaranteed saving any money at all. When buying a new appliance, the hundreds of dollars required to purchase the machine need to be weighed against the savings realized and the warranty offered. No one is saying greater energy efficiency should not result in some savings sometimes, but often those savings are not as much as expected. Efficiency can be gauze on a cancer—like a red herring. Let us abandon dirty fuels altogether rather than fooling ourselves that efficiently using them is okay or even will ensure much relief.
None of this commentary is meant detract from efforts to improve energy efficiency. Just that net efficiency gains are often smaller than ardent conservationists admit or foresee. As these words are written in the fall of 2022 prior to the UN’s next climate-change confab, reports from around the world say China has boosted its coal production by a huge 10 percent this year alone, India has upped its coal mining to meet energy demands caused by record-breaking heatwaves, Germany is hastily building new natural gas terminals since Russia shut off its supply of energy, and the UK is mulling reclassifying nuclear energy as renewable and natural gas as green. Sea level, greenhouse gas and ocean heat all hit new highs this year. With the pandemic, a war, economic woes, global warming and the energy crisis all marching onward, realistic strides toward making existing technology work more effectively is not making much progress.
What is needed most is a fair assessment of efficiency’s pros and cons in a world where climate change remains a chronic danger and total energy budgets are about to soar as more than 150 developing countries come of age while pursuing equality with the developed world. Everyone would enjoy better car mileage, lower electric bills or a quieter dishwasher. Such technical progress betters our daily life throughout our lives. Yet, minor energy upgrades help little when total energy budgets on all scales and all fronts—locally and globally, individually and collectively, for all people in nearly every nation—are naturally, sizably, and inevitably rising, especially when population is also still climbing by billions more by 2100.
Ironically, even with more efficient machines and better ways of using them, society sometimes uses more, not less, energy, as cautioned earlier. Claimed energy savings often actually go unrealized, resulting in just as high and even higher consumption. Many people tend to use more when more is available, and even sometimes use more when thinking they are using less while being efficient. We may not naturally be an economical species. Perhaps no successful species is. Perhaps there is a reason why Φ
m illustrated in
Figure 1 rises so dramatically.
“Jevons’ paradox” holds that as any product’s supplies rise, market pressures usually lower its price and so increase demand for it [
89]. Proposed by political economist William Jevons to explain higher demand for coal in 19th-century England despite improved machines used to supply it, his paradox also relates to the “rebound effect” whereby cheaper cars with good fuel ratings often get driven more and the latest, more efficient digital devices are often surfed more. In fact, families wedded to cars and enthused by gadgets typically own more of both. Ultimately just as much and sometimes more total energy is used despite higher efficiencies.
The difficulty of turning energy efficiency into energy savings also suggests why modern humans use so much more per-capita energy than our ancient forebears even though modern machines need only a fraction of antiquity’s “horsepower” for any given task [
34]. If energy supplies are abundant, they surely get used and often likely more so regardless of how efficiently the machines actually function. To illustrate: Several decades of engine-efficiency upgrades have been nearly eclipsed by customer preference for ever-larger automobiles tens of times heavier than the passengers they carry. And most of us drive a good deal more today than a half-century ago. With engine performance expressed in the peculiar US units of miles per gallon, cars and light trucks averaged 9000 miles at 13 miles per gallon in 1950, for a total of 690 gallons of gasoline used. In 2010 average drivers traveled 11,000 miles at an improved 17 miles per gallon, using 650 gallons. And in 2020, those numbers are 13,000 miles, 21 miles per gallon and 620 gallons. Despite mileage increasing ~60 percent in three-quarters of a century, the energy used fell by hardly 10 percent, a modest improvement. Higher efficiency and energy savings are often not proportional. Just as much and sometimes more net energy is consumed per passenger riding in many automobiles today [
90].
Furthermore, higher vehicle efficiencies and lower gasoline prices routinely shift buying choices—that is, customer selection—toward larger cars and trucks that often use yet more energy. In 2020, two-thirds of all passenger vehicles sold in the US were classed as “light trucks”, an all-time high. They include fuel-hungry Sports Utility Vehicles that have become so big they hardly fit anymore into home garages. Three-quarters of SUVs sold in the UK during the past few years are registered to city buyers despite being designed for off-road use. They are often advertised as cars with added safety to protect the family, yet their huge mass is a danger to anyone else near them.
Even in famously thrifty Geneva, the evolution is obvious over the past few decades of ever-bigger SUVs where compact vehicles had once ruled the road. Much the same is noticeable in recent years in London, Moscow, Santiago and many US cities as well as in many suburban towns too small to be called a city. Even in Paris, mini-cars now cruise the streets as ornaments; they are cute and arresting, yet rare and passé. Consumers seem to be shunning medium-sized sedans, no doubt encouraged by automakers’ apathy for selling unprofitable cars.
With SUVs, people are buying more car that consumes more gasoline partly because efficiency improvements allow them to assuage their guilt for driving bigger and driving more. Electric car sales are up nearly everywhere, but so are expensive SUVs, cancelling any decline in carbon emissions. And even when SUVs are electrified, they are still big, tall, and unsafe to others, with headlights at eye level of oncoming drivers. Gladly, SUVs should not last long in the cultural scheme of things since they have low and falling Φm.
Homes and their energy upgrades are not much different, even when newer homes abide by building codes mandating higher efficiency. Many homes today are equipped with an array of digital gadgets and technical amenities having net energy appetites hardly achieving much savings in total energy usage [
91]. Glance around the kitchen, family room, basement or garage; devices, appliances, tools, and vehicles needing energy are ubiquitous and multiplying. The number of homes in the US, for instance, having a second refrigerator doubled in the past 20 years to now a third of all 120 million US households. Even the size of fridges grew (probably since we eat too much) [
52].
Not only does the number of energy-gulping machines within homes often increase in size and use. Homes themselves are getting bigger even as family size declines. The average area of a new single-family American home topped 230 square meters (2500 square feet) in 2016. Half a century ago, houses averaged two-thirds that size [
92]. Despite higher efficiencies of many household items, the bigger the house the more energy is usually needed to heat, cool, and electrify it. All of which means greater per-capita energy use, or higher Φ
m, for those living a modern life in a big house. Falling carbon emissions from the use of energy-efficient appliances are again often cancelled since there are more of them, especially wider use of air conditioning of larger buildings, that together use hardly less total energy [
93].
Not that homes should not be comfortable. We spend two-thirds of our lives at home (even without pandemics) and half of that in our bedrooms. Some of the energy rise for big suburban homes is offset in cities where many people opt to rent small apartments (less than 100 square meters or 1100 square feet) where per-capita energy use is often less as noted earlier. The net result is again often a wash since the US average energy used per city home slightly decreased even as the total energy used in all homes nationwide increased since homes overall grew in size and number, somewhat offsetting efficiency gains in the inner cities [
94].
Supersizing is not just an American tendency to overeat and live large. House size is also bulging in developing countries as people demand higher energy budgets and greater global equality. Homes built since 1990 worldwide have increased an average of 25 percent in area; office space is also getting larger and more numerous. Their owners want to eat, drive, work, play and on the whole live like those in developed countries—a goal as reasonable as it is troubling. Energy usage in almost all developing countries is rising, some steeply, as people around the world pursue upward mobility and a household to call their own. Insatiable thirst for any kind of energy and improved social status is among the reasons the main, bold graph in
Figure 1 will likely continue trending upward.
Conserving energy and efficiently using it resemble drinking from a glass a quarter full. There is some good in it, just not as much as we would like. Fervent conservation and better efficiency have kept energy usage in check by helping manage it around the edges but they are inadequate now and soon more so. The goals are well-intentioned, but like the unattainable target to keep global surface temperature below 1.5 °C, they are unlikely to make a real difference in a world where energy is rising in all sectors, in all cities, in all nations.
Conservation shortfalls are not confined to the US and may well be worse elsewhere. Cities in other nations are catching up, padding their energy budgets posthaste. It is only natural and it is only fair, yet some worthy efforts to outdo the West have backfired. India’s capital, New Delhi, perhaps the world’s most polluted city with smoke and smog often hovering near lethal levels, has tried banning automobile driving on alternate days. Tests a few years ago showed traffic actually increased, apparently because many drivers took the ban as a dare to drive more on days they could. Conserving energy is ideally positive, but often neutral in today’s real world.
Delhi is not the only city from which stars often cannot be seen at night. Mexico City, a place rich in history yet poor in air quality, did much the same while trying to curb its infamous smog by limiting use of every car to half the days of each week. Paris has similar restraints to save on energy and clean its air, allowing even- and odd-numbered license plates within city limits only every other day. The result was that many people in both cities bought second cars, usually older, cheaper, and fouler, to use on those days when their better car was banned. The upshot was worse. The nasty rebound effect strikes where sometimes promising schemes come back to hurt, as here aiming to reduce energy yet hardly helping.
Los Angelenos in recent years tend to do much the same—buy a new high-mileage car, followed by a bigger, environmentally unfriendly second one. They apparently feel by doing one good deed for society, they then have license to commit a self-centered act. It is part of a well-studied human response, including those who purchase organic food being less likely to help others and those who suffer anxiety being more willing to share. Moral psychology aside, what is clear here is more pragmatic: Reducing our dependency on single-occupancy vehicles would help us most in all our cities and nations beyond.
Even electric cars do not yet help much—not combating climate change and not halting global warming. As long as their batteries are charged with electricity produced by fossil-fuel power plants—and that is mainly how it is done today despite claims to the contrary—then little is gained by driving an EV. Not nothing, just little. Furthermore, assembling the frames, batteries, nuts and bolts of EVs often uses fossil-fuel energy, so the birth-to-death life cycle of EVs hardly lowers carbon footprints—unless their production and operation derives their energy directly from the Sun [
95].
That is not a pitch to avoid EVs. Just that it will not much matter—in fact, not at all—if within a few decades everyone is driving EVs, yet their electricity continues sourcing from fossil fuels. That is why top priority in adopting a solar-based economy needs to stress the building of equipment to capture and deliver solar energies, lest we raise our efficiencies and conserve our fuels yet still be using dirty energy for decades to come. Not to despair, that is a pitch for each of us to socially pressure—with political actions, consumer boycotts or reasoned planning—cities, states, and nations to abandon their dirty energy portfolios. Electrifying transport is definitely the way to go but only if it is courtesy of the Sun.
My message is that we are likely fooling ourselves by thinking energy conservation and energy efficiency can much mitigate current energy budgets to dampen climate change. Marginal gains in efficiency and conservation should not be an excuse to prolong the burning of fossil fuels. Even if today’s energy was substantially conserved or efficiently used, its total use would continue rising while greater numbers of people on Earth use greater amounts of energy both individually and collectively. All the more reason, since neither cutting energy nor using it wisely are making much headway today, we should aim straight toward fully using solar energies that are ready today to deliver tomorrow and practically forevermore.
6. Conclusions
Much of today’s energy policymaking is misguided, our priorities often misaligned with practicality. Words and deeds aimed to conserve energy while struggling to use it efficiently mean well. Efforts at either gain traction in green circles, make some of us feel good and often help in small ways. However, devoting a majority of our time, money, and actions to reduce energy usage are unlikely to advance complex social systems when most trends imply the need for more, not less, energy locally, regionally, and globally.
Less energy used might even be a mistake, harming human society and life itself, much as the far majority of complex systems have failed all across the history of the Universe. Those that have prevailed have invariably embraced energy as a most vital necessity, and those that have not have often perished. Cosmic evolution . . . adaptation . . . selection. The evidence-based reasoning behind
Figure 1 suggests a cosmological imperative from big bang to humankind for which neither total energy used nor energy rate density in our rapidly changing, globally networked planet will likely stop rising any time soon. Probably not in the lifetime of anyone now living. Possibly not for as long as humankind endures. Perhaps not ever if our built machines overtake us or more likely merge with us.
Some certainties we do have in hand. Human energy use is a known known. It is one of few essentials everyone shares in the world, though unevenly. And it is a quantity that is understood smartly when tallied rightly. Regardless of nationality, race, creed or genes, healthy humans need a certain amount of Φm biologically. Without optimal energy, we would die. Less certain is our active, productive society culturally. Civilization also runs on energy perhaps more than any other quantity, but specifically where society’s Φm is headed we cannot be sure. And although how much Φm is optimum for nations and their cities is also unknown, this much is known: With less than minimal or more than maximal energy in the years ahead, human society, too, would likely end—cities will decay, nations will quarrel and our descendants will die.
Really deep cuts in energy usage would entail draconian social changes that few people are willing to accept. The recent COVID-19 pandemic showed roughly what is needed to seriously reduce our love affair with energy. As the deadly virus spread, schools closed, business ceased, and global energy use fell ~7 percent, which well exceeds the typical, annual 1–2 percent gains in efficiency across the world. Energy was not the trigger—an invisible virus was—but less of it surely did cause a global economic downturn. Many people stopped driving as much industry idled, while planes, trains, buses, and trucking ran on limited schedules. Even without strict measures like social distancing and working from home, large changes in lifestyle would be needed even for moderate reductions in energy usage.
Less energy used could also send our complex economic system in a wrong direction, if not a tailspin. Retrenchment would likely force the economy and jobs to grow weakly, if at all. Economic vitality, which most experts assume means growth, is a centerpiece of technological democracy. A recent sampling of consequences illustrate a clear and present danger as well as how to recover: In little more than a decade, society has been racked with three serious hits to the world economy and to peoples’ psyche. The grinding recovery from the Great Recession was followed by a dreadful pandemic and then Russia’s invasion of Ukraine, each of them nearly paralyzing the global economy and together damaging human society. Yet, despite the world’s recent ordeal and its dips in energy use, society is back to where we were before this triple threat began. Energy use is up again nearly all across the planet. Reductions in energy did not seem to help much, in fact they hurt, even as it is obvious that society is also doomed if we continue using more energy without deep cuts in fossil-fuels.
Enough about dirty fuels. Their use needs to end for the sake of our lives, our society, our species. No more gas-guzzling vehicles on the road, no more coal or oil used to heat or electrify our homes and no more carbon-dioxide emissions to foul the atmosphere. And enough about piecemeal efforts to better our lot by cutting a little here or there, in the end our way of life perhaps suffering death by a thousand cuts. What is needed now is a global economy up and running, and quickly too, based almost solely on society’s use of clean, safe, and abundant solar energies. Boosting the global economy indefinitely and equitably for the good of all people is where our priorities should now be. All else pales in comparison.
The beauty of solar energies is that we need not cut back on any of them. We can capture whatever amount of the Sun’s bounty as our equipment permits. Efficiency gains would still be prudent since fewer solar panels and turbine towers would then be needed. And since solar technology is younger than fossil-fuel equipment, big strides are expected with strategically focused research and development, implying smaller panels and turbine farms spread across less land area, another good thing. But—and this is a very big but—we need to deliver cheap solar power to physically force fossil fuels out of the marketplace and do it fast. Our fate really is all about energy and all about timing.
With a veritable solar system built on Earth, we can admire Old Sol and consume it too. We have before us all the energy society would ever likely want virtually forever . . . to drive economic growth, to ensure cleaner environments, to approach social fairness and to take an astronomical leap forward toward achieving planetary sustainability. Devoting our time and treasure mainly and urgently to construct massive solar capacity will not grant instant gratification since overhauling today’s global energy system will require decades of focused action. Even if only fully deployed for descendants unborn, we would be better off now and future generations will thank us for it.
Based on what science knows now, not on some fictional narrative or promise of magical energies yet to come, only the Sun can provide the large amount of additional energy to keep modern society structured and functioning, indeed energies that are clean, safe, and equally available to all cities and all nations. It is time to robustly use the many good solar energies available on Earth—shining light, blowing wind, falling water, and warming air—to power civilization moving forward. It is time to return to deeming the Sun as not only the source of our origin but also of our continued existence on Earth.
To clarify my stance since I am often misquoted: Environmentalists stress the need for energy efficiency and energy conservation, and right they are while we continue burning fossil fuels. Thus the need to reduce dirty energy today, lest we become toast tomorrow. However, once the good deed is done and we make the switch to again worship the Sun, as did our forebears, there is likely little need to scrimp on energy. We will save money, guaranteed, since the cost of solar energies will drop to nearly nothing. All together, nations, cities and our personal wellbeing will benefit from a growing economic system no longer at war with Nature’s surroundings. What a glorious new world that will be!


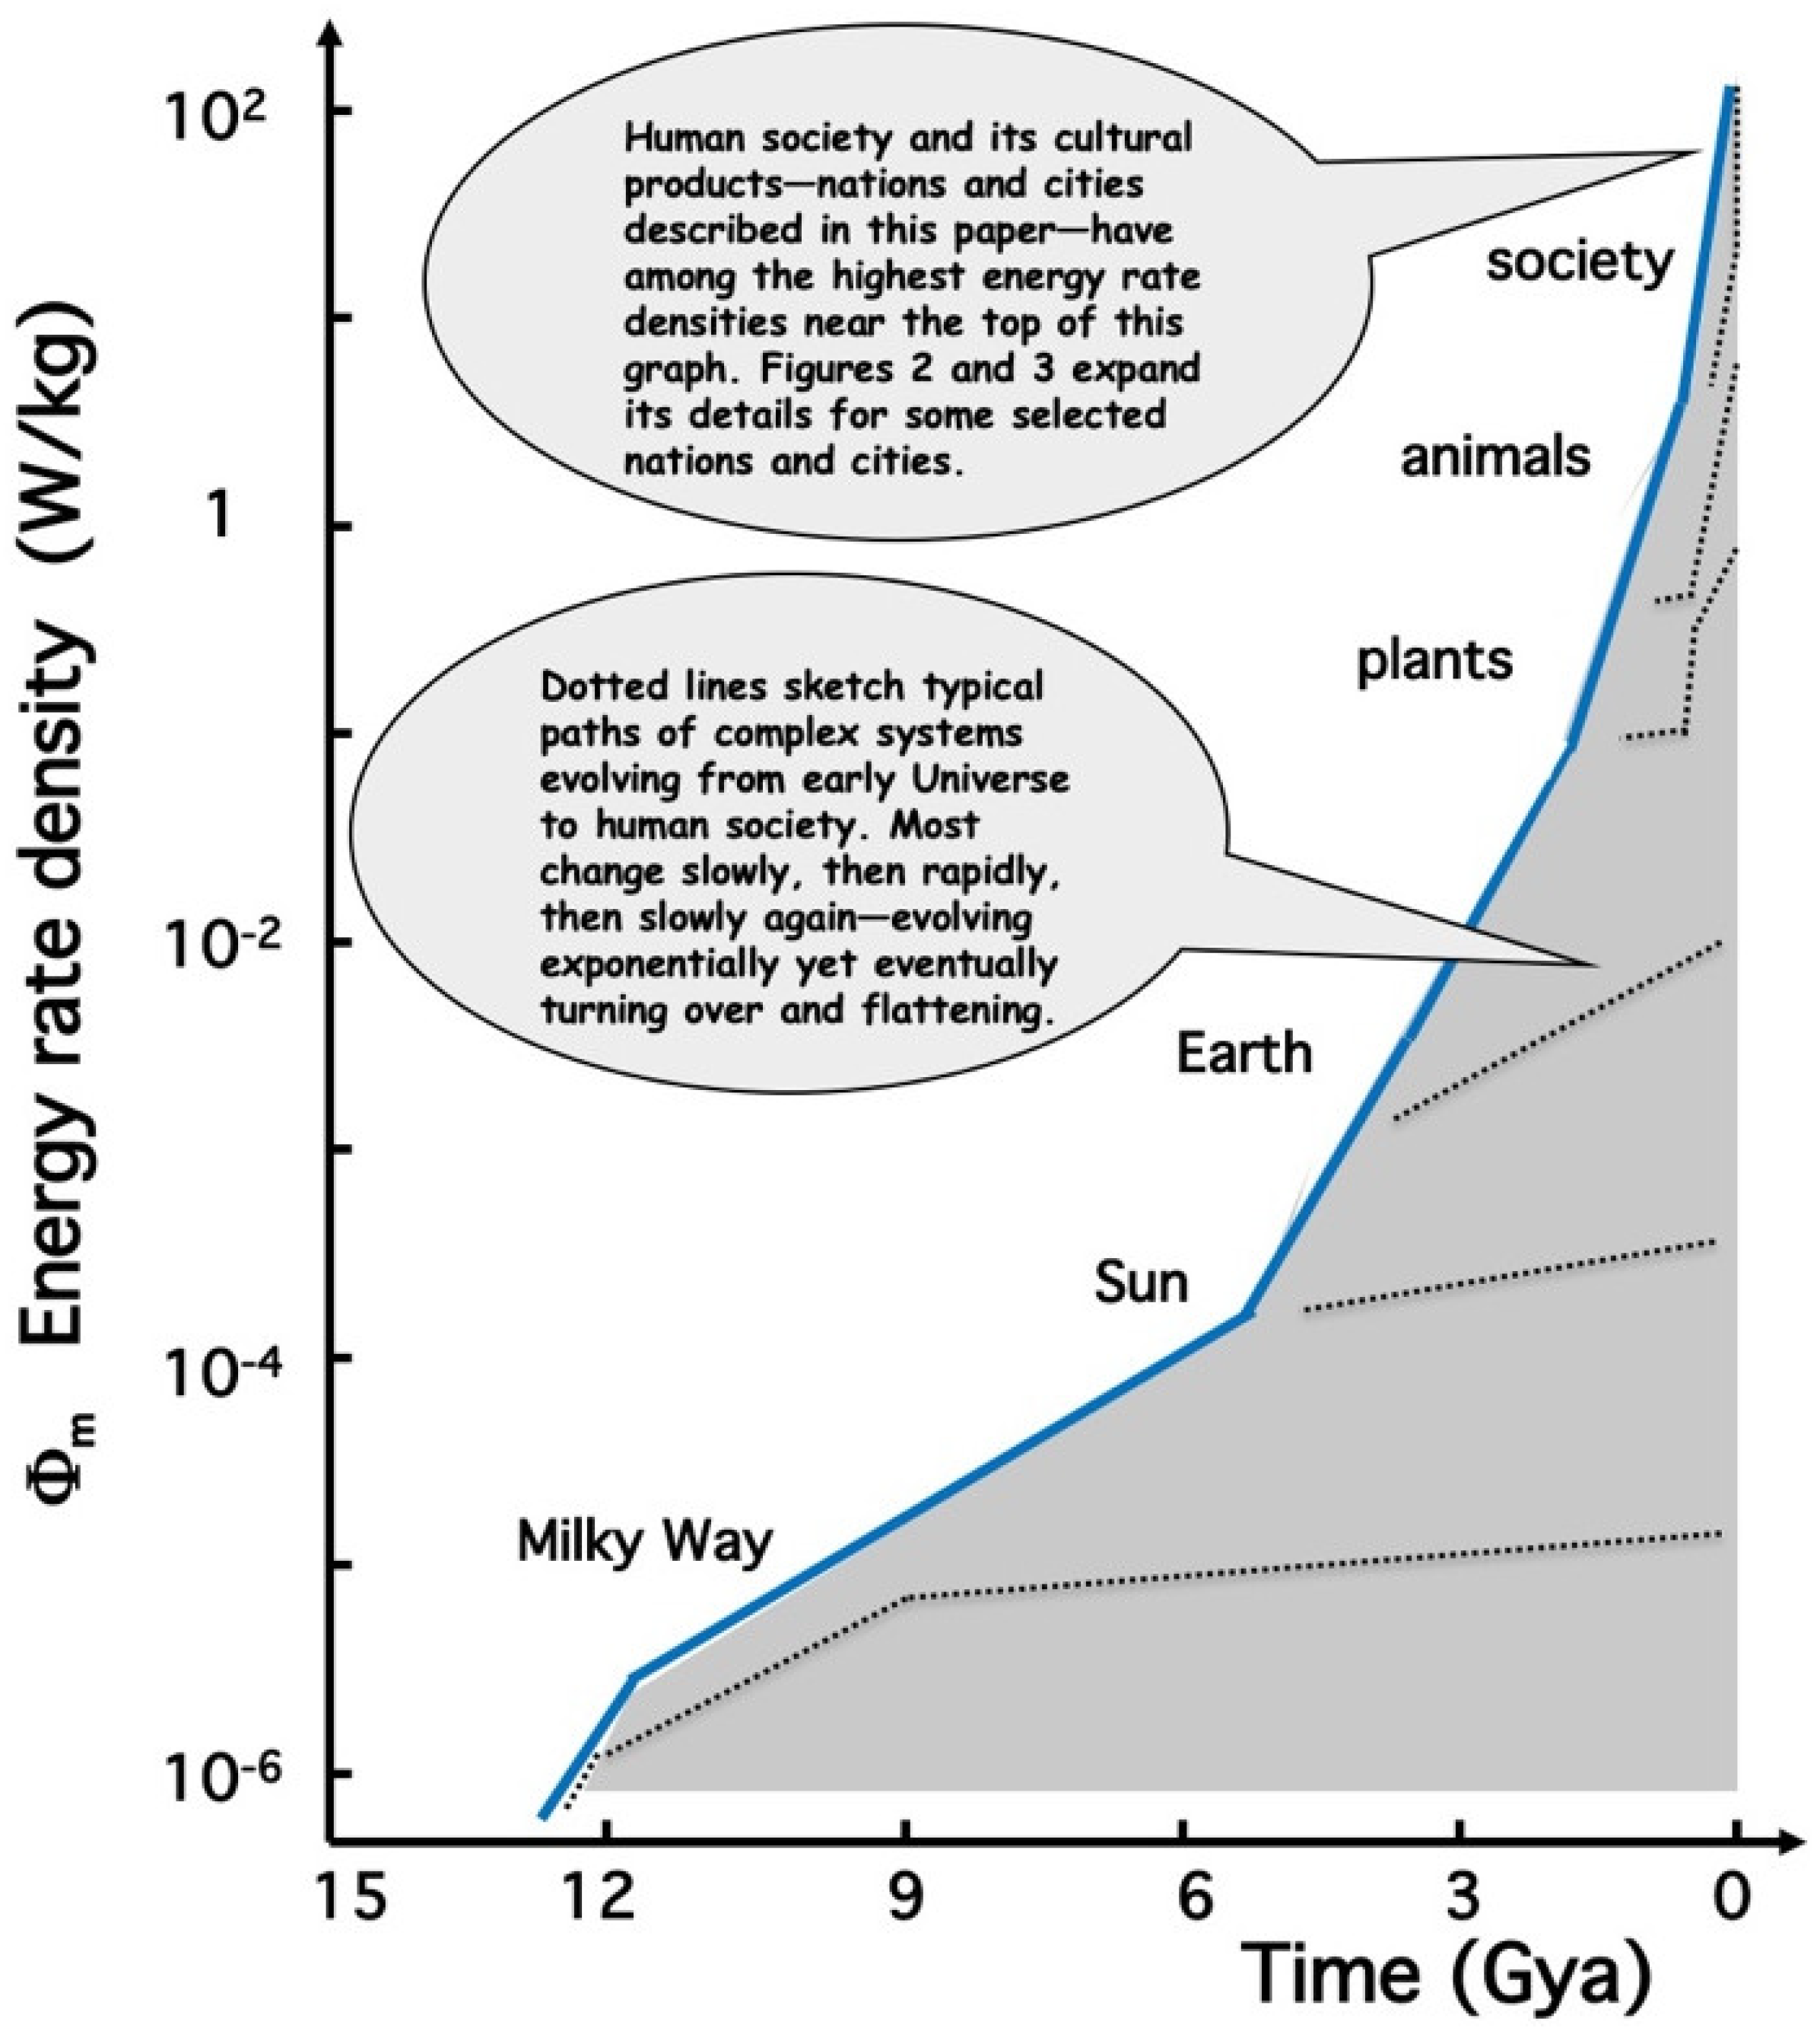
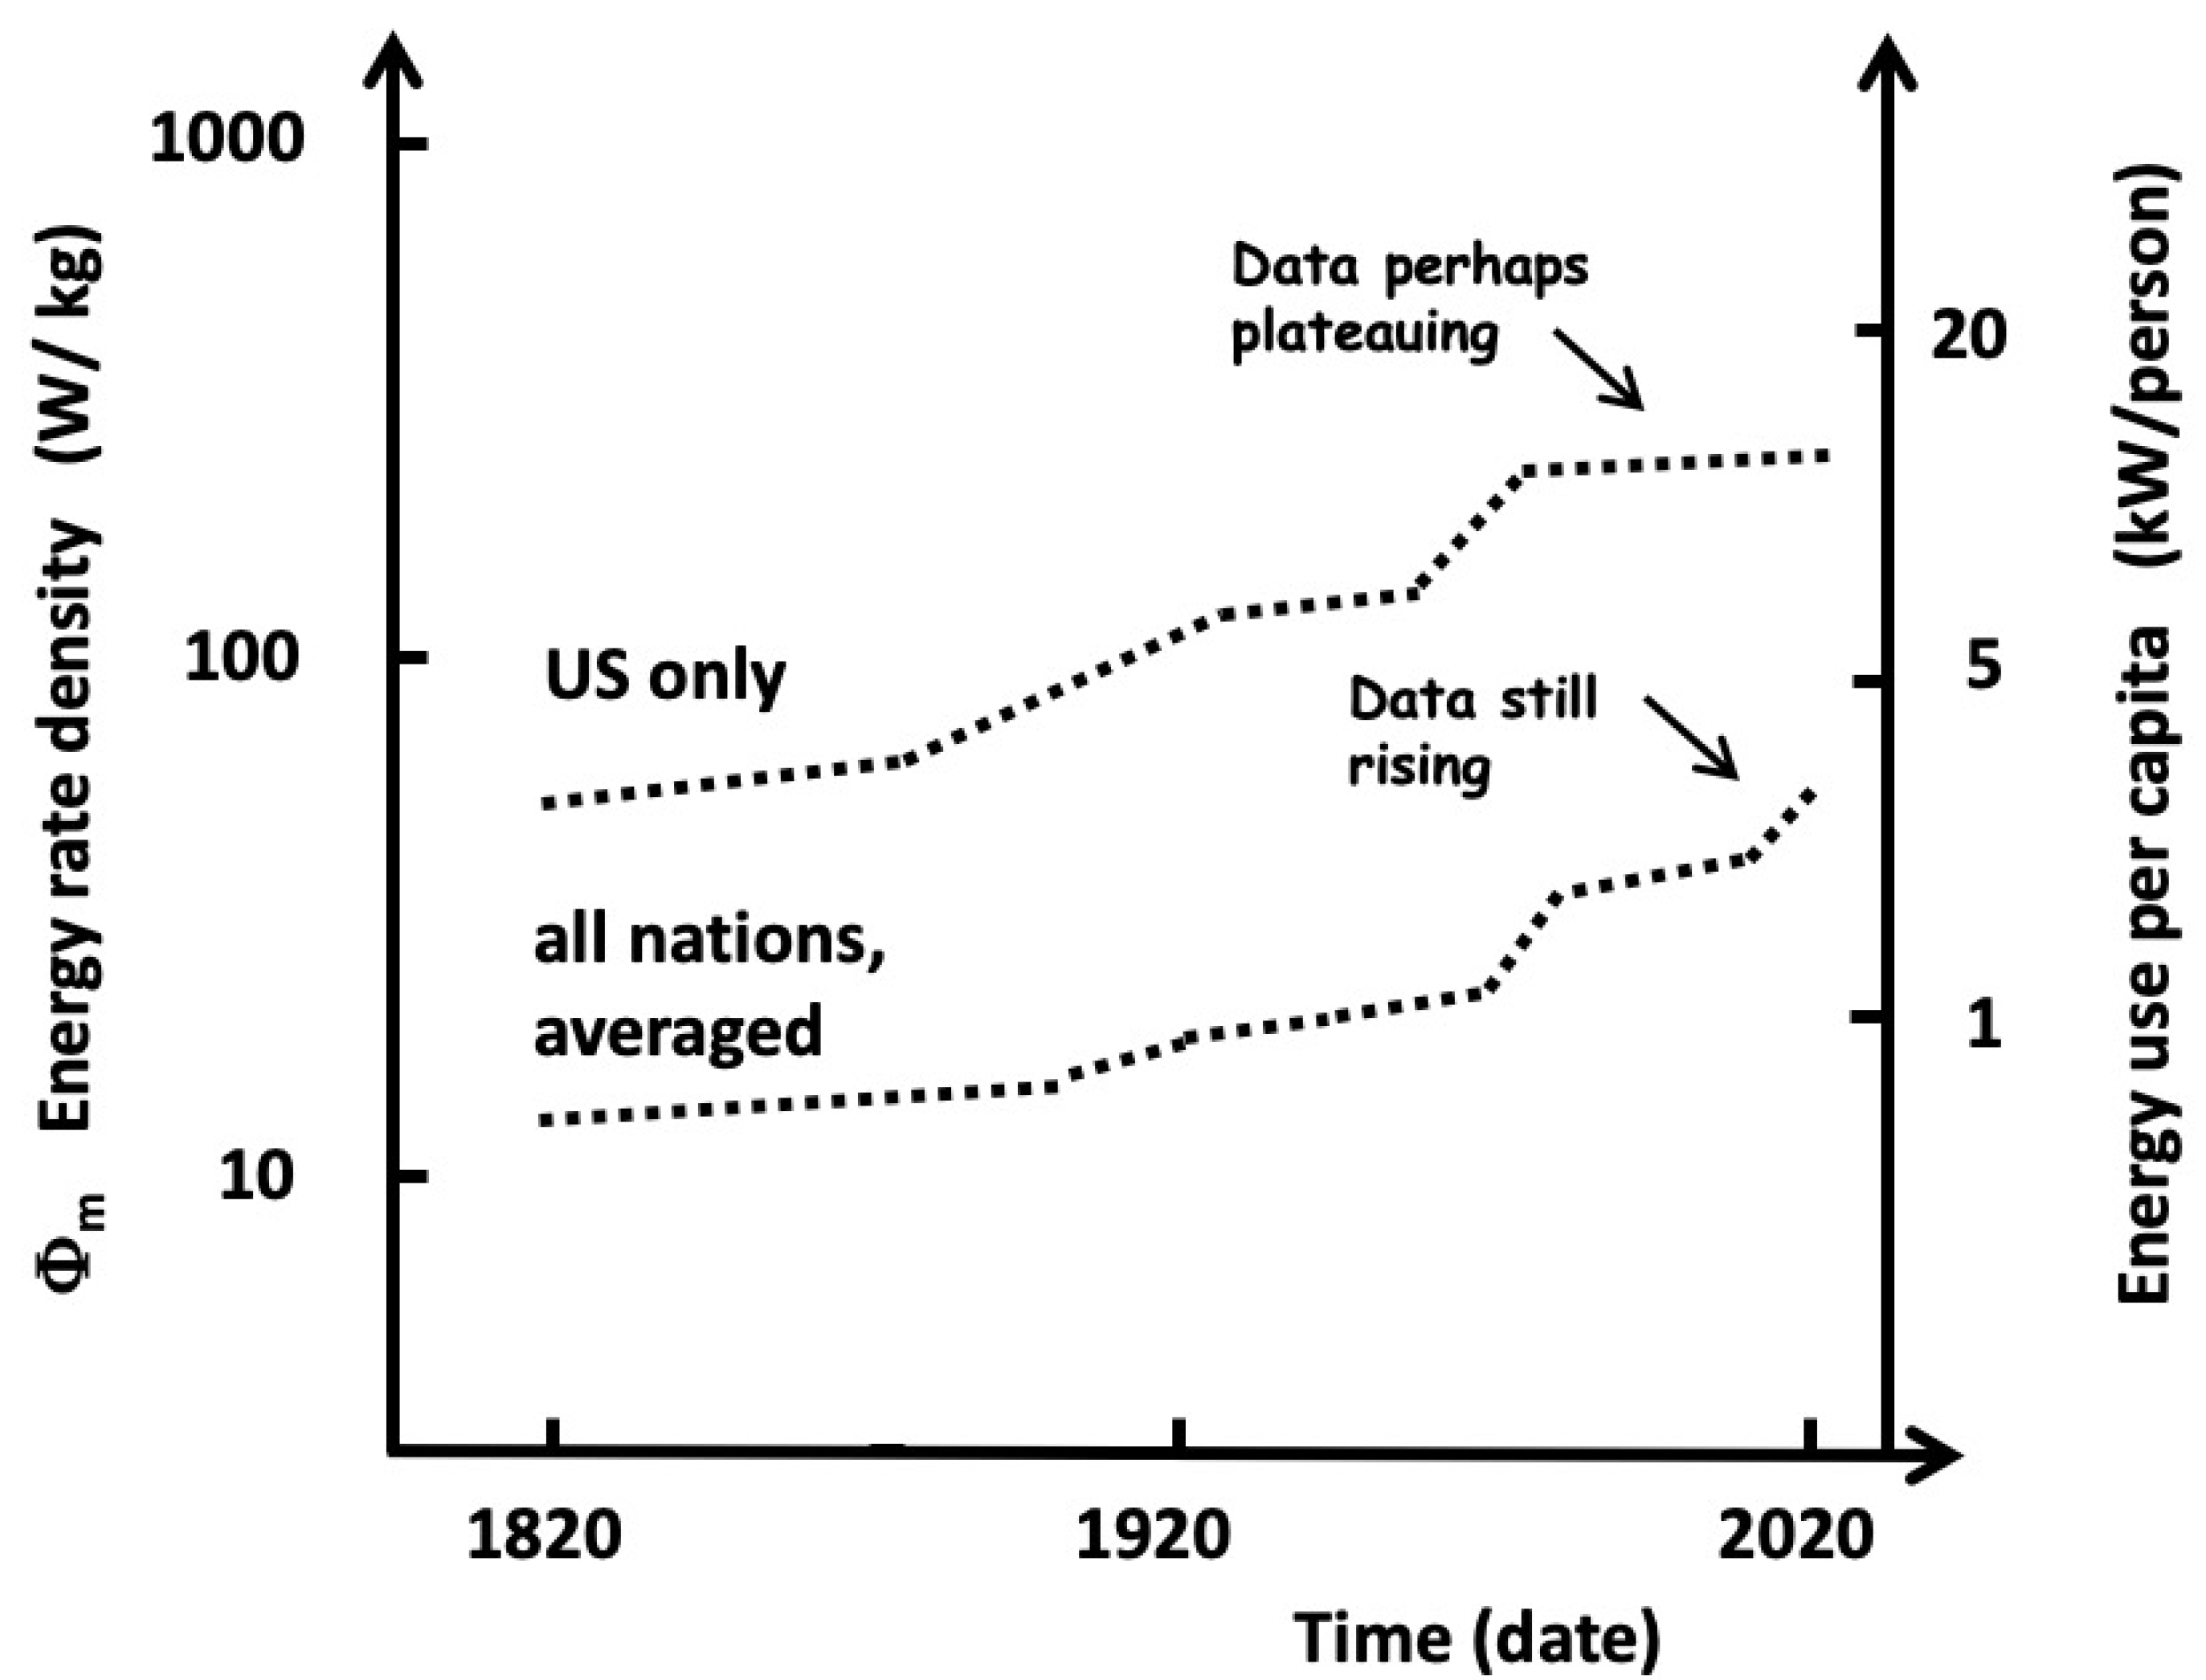
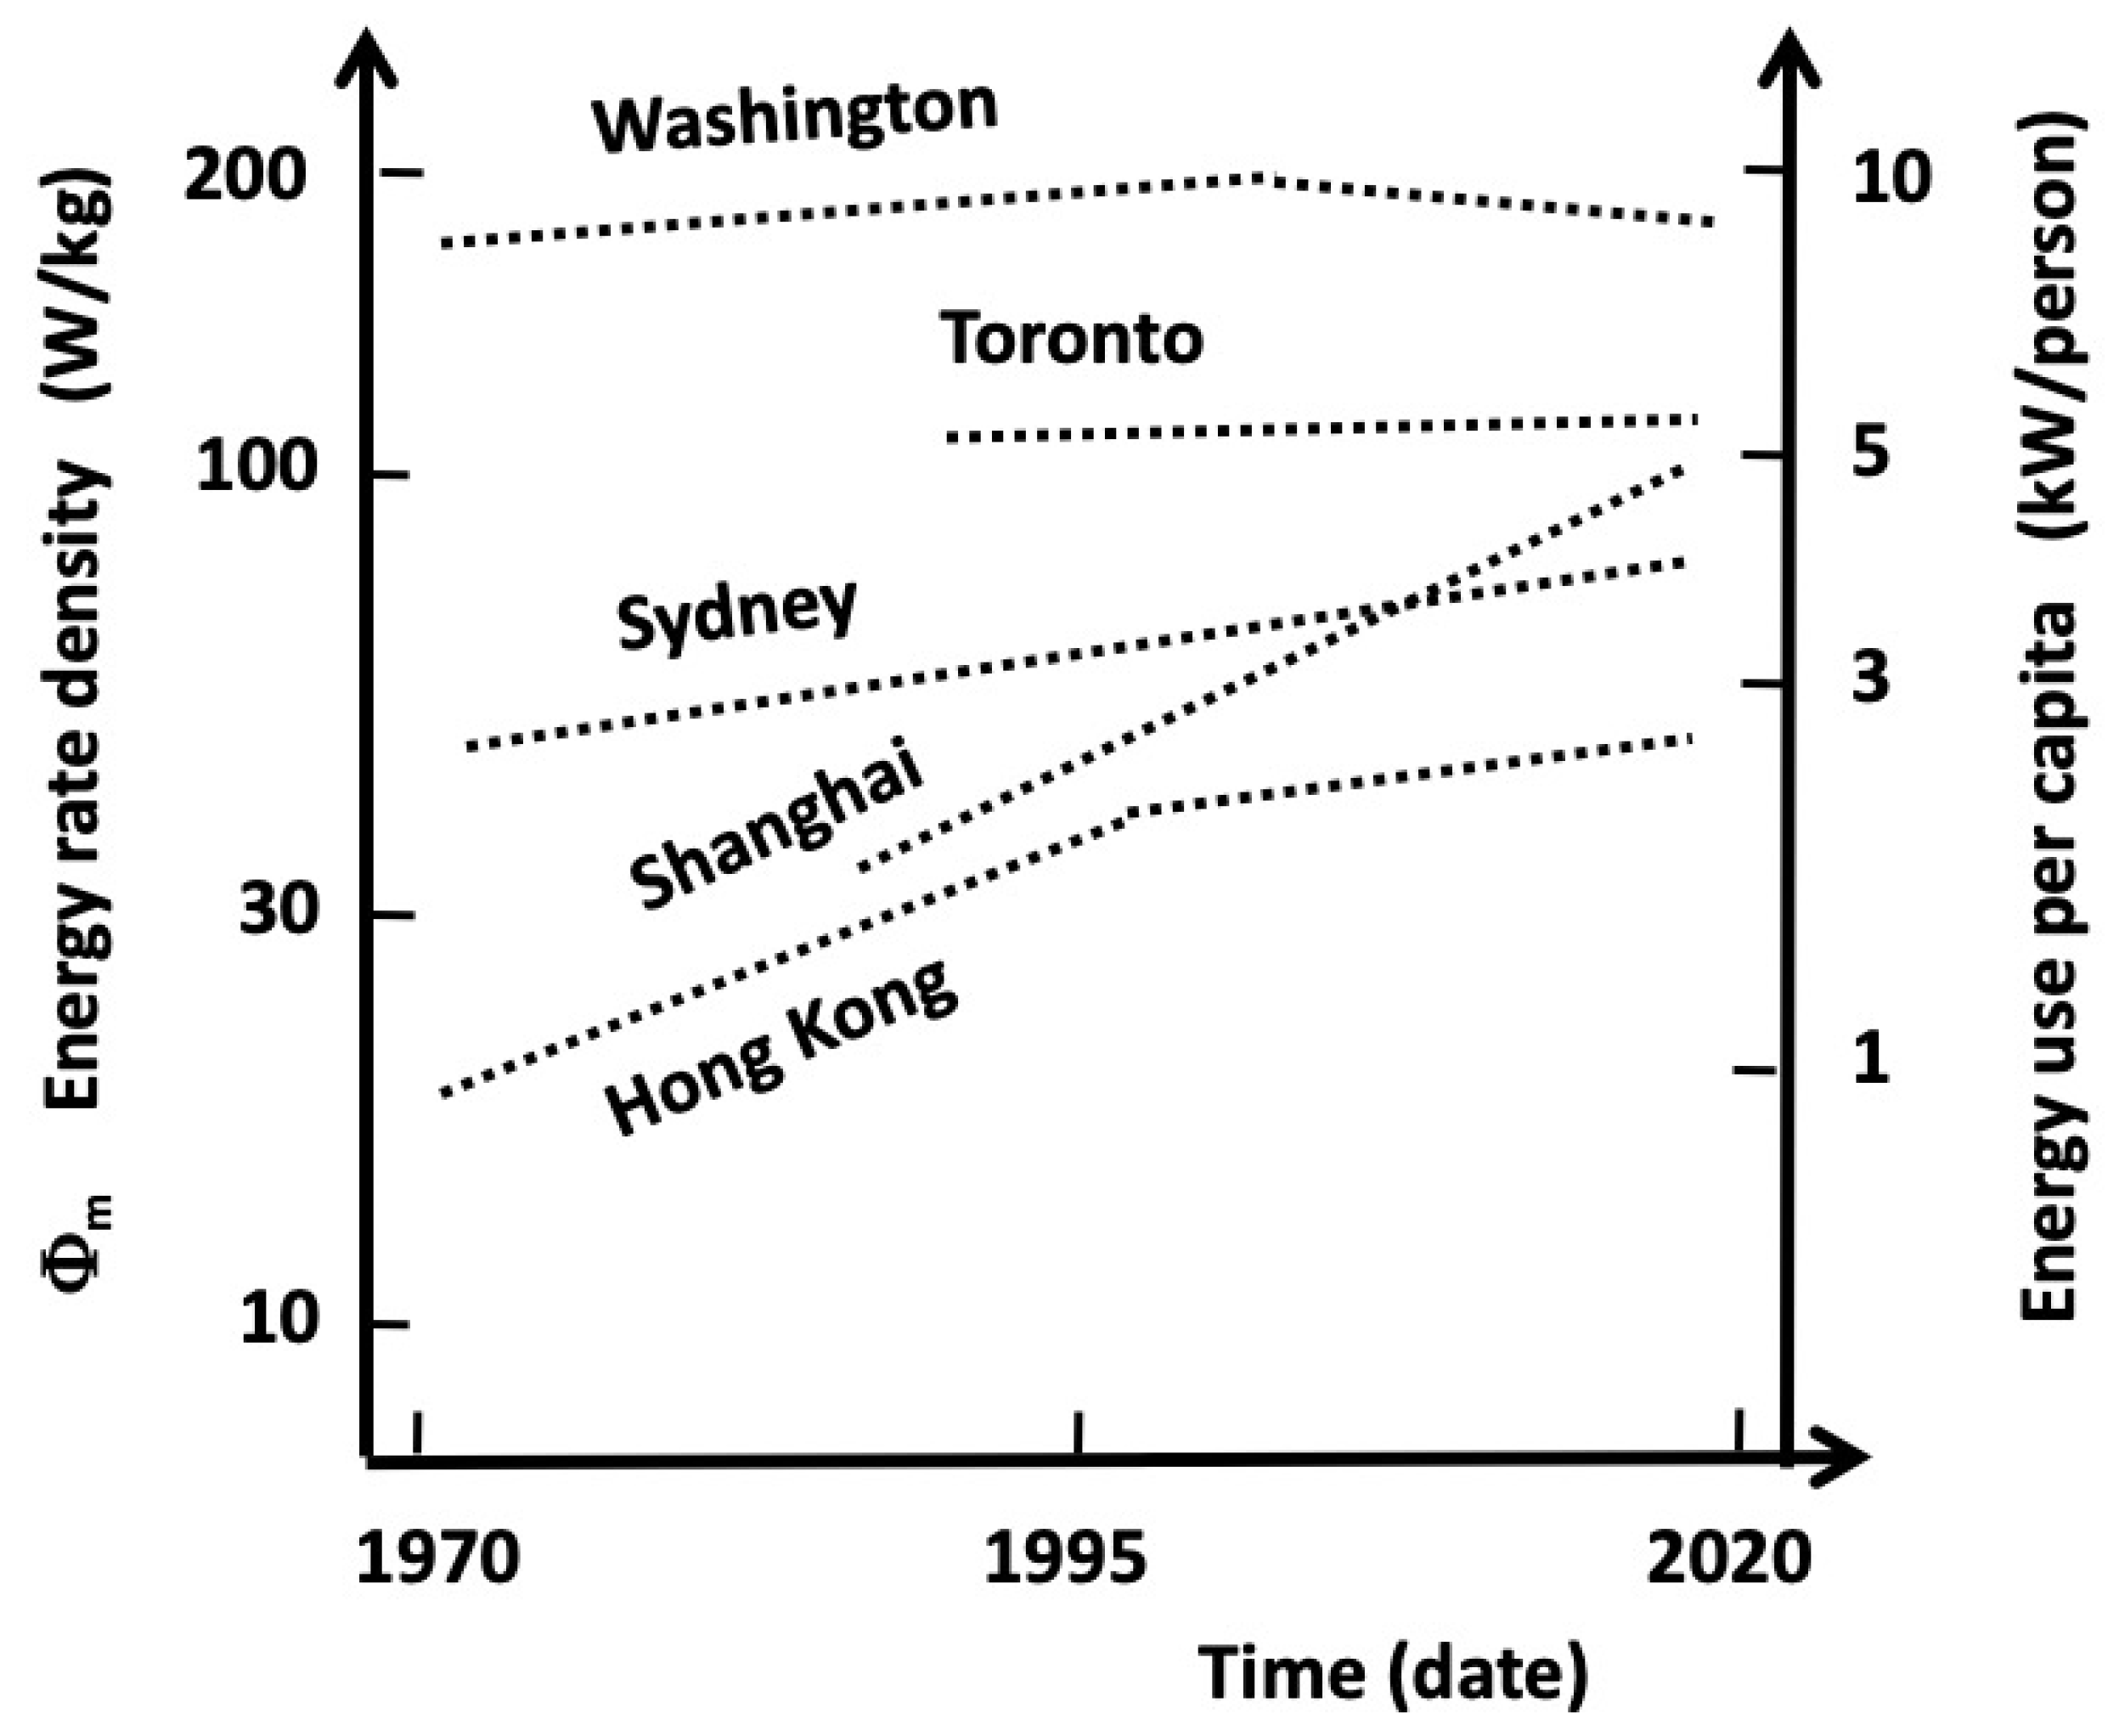