Abstract
The article presents a comparison of exhaust emission test results from a passenger car with a spark-ignition engine examined with the WLTC (Worldwide Harmonized Light-Duty Vehicles Test Cycle) test, which was carried out on a chassis dynamometer, and examined with a RDE (Real Driving Emissions) test, which was conducted in real vehicle operating conditions. The exhaust emissions and the emitted particle number in the individual phases of both tests were determined. Large disparities were found in the results of the two tests. The cold start-up had a particularly significant impact on the test results in the case of the WLTC test. This impact is much greater than in the RDE test, mainly due to the fact that the RDE test is much longer than the WLTC test. Moreover, the engine load in the RDE test was greater than in the WLTC test. As a result of the conducted analyses, it was postulated that the research should be continued in stochastic conditions for the vehicle speed function, e.g., in the implementation of the speed function determined for the real conditions of the vehicle operation.
1. Introduction
In order to study the properties of test objects and enable them to be assessed, such as through comparisons, empirical studies should be carried out that meet two assumptions:
- The conditions in which the tests are performed should resemble the real conditions of the vehicle operation as closely as possible. It also means that the test conditions should correspond to various conditions of the object’s use and a certain range of randomness of these conditions.
- Repeatability of the test conditions is necessary while ensuring detailed requirements in relation to the test apparatus.
These two assumptions in relation to the vehicle test conditions used in order to learn their operational properties are largely contradictory as, in particular, testing the object under the conditions of real use makes it practically impossible to ensure the repeatability of these conditions.
One solution is to treat the conditions of each study as the implementation of a certain stochastic process, characterizing—in accordance with the adopted criteria—certain limitations of the actual use of the object. Such limitations may be, with a road vehicle as an example, the requirements to be met by the road itself on which the vehicle will travel. Obviously, treating the test results in real conditions as the implementation of a stochastic process requires multiple tests. Treating the research process in this way makes it possible to obtain certain characteristics of the entire set of research results, e.g., probability density, mean value or variance.
From the above considerations, it becomes necessary to conduct research on the properties of test objects both in conditions of full laboratory repeatability as well as in conditions of real operation. Such an approach to research on the properties of test objects also enables the assessment of the sensitivity of these properties to the conditions of operation.
The exhaust emissions from road vehicles with internal combustion engines are very sensitive to the conditions of vehicle operation. This is due to the fact that the road-vehicle operating conditions determine the engine’s operating states. These operating states of internal combustion engines that determine the exhaust emissions are: engine rotational speed and its load, which may be represented by a measure of the engine torque. Additionally, in the engine’s warm-up phase to its temperature of stable operation, the factor determining the exhaust emissions is the engine thermal state [1], which can be characterized by the temperature of the engine components and their operating factors, especially the temperature of the coolant and engine oil. Due to the impact on exhaust emissions, it is important to know whether the engine operating states are static or dynamic processes. In the real conditions of road-vehicle operation, there is a clear predominance of the dynamic engine operation states. Therefore, it is necessary to ensure that the test conditions represent such properties of the dynamic operating states, which—according to the adopted criteria—correspond to the properties of the real operation of vehicles. Such properties may be the frequency characteristics of the engine operating states.
The procedure for testing road-vehicle exhaust emissions in real operating conditions is called RDE (Real Driving Emissions) [2,3,4]. The idea of testing exhaust emissions from motor vehicles, both in laboratory conditions and in real operating conditions, is currently being partially implemented, e.g., by the authors of [5,6]. The first limitation is related to the test objects. The tests conducted in real operating conditions apply to the following vehicle categories: passenger cars and light trucks. The second limitation concerns the size of the criteria of exhaust emissions—these are road emissions of carbon monoxide, road emissions of nitrogen oxides and the number of solid particles.
2. Exhaust Emission Tests—State of Knowledge
The subject of comparing exhaust emissions through various tests is not commonly approached in the literature. In [7], the results of the exhaust emission sensitivity tests to the operating conditions of the engine from a vehicle with a compression-ignition engine were analyzed. These results were determined in the driving tests: the NEDC (New European Driving Cycle) test, the RDE (Real Driving Emissions) test and the Malta test, developed at the Poznan University of Technology.
In [8], the research results on the impact of the RDE test’s dynamic parameters on the exhaust emissions were analyzed. Two passenger cars of a similar curb weight, equipped with spark-ignition engines that are Euro 6c class, were selected for tests in real operating conditions. The research was carried out on the same research route, covering urban, rural and motorway driving conditions. The correlation between the dynamic parameters of the test and the exhaust emissions was assessed based on the obtained test results.
Article [9] analyzes the results of a passenger car driving through RDE tests. Using the obtained results, the coefficients of road emission compliance from the RDE tests and from the conditions of approval tests performed on a chassis dynamometer were developed.
Article [10] compares the exhaust emission test results obtained from the RDE and WLTC (Worldwide Harmonized Light-Duty Vehicles Test Cycle) tests. The research was carried out for eight passenger cars with spark-ignition engines. The greatest differences in road emissions were found for carbon monoxide and nitrogen oxides, whereas the smallest differences were observed for carbon dioxide; in all cases, the results of the road exhaust emissions were lower for the WLTC test.
The authors of [11] found the influence that the initial state of battery charge had on the exhaust emission values of toxic components, not only in the type approval test, but also in road tests. In addition, fuel consumption was closely correlated with the initial state of the charge of the battery.
In [12], the impact of an engine cold-start in the RDE test on the exhaust emissions of nitrogen oxides was analyzed. The research was carried out on many routes in various European countries. As a result of the research, it was found that, in many cases, the impact that an engine cold-start had on the exhaust emissions of nitrogen oxides in the RDE tests may not reflect the influence in the real operating conditions of the test vehicle.
In [13], the authors stated that for motor vehicles after a combustion-engine cold-start, the characteristic feature is the increased concentration of the number of particles with a diameter of about 100 nm. The tests carried out in real driving conditions confirmed that the exhaust emissions of particles with diameters smaller than 23 nm were significant in conventional vehicles, regardless of the engine type (petrol or diesel).
The research presented in the article of [14] confirms the increased emissions of exhaust gases in older vehicles (Euro 4), and at the same time, indicates a much higher emission of nitrogen oxides when the fuel system switches from supplying petrol to liquefied petroleum gas. The test results provided by the authors show a more than 3-fold increase in nitrogen oxide emissions in the RDE test when fueled with liquefied petroleum gas. The road emissions of the remaining exhaust gas components were similar for both petrol and liquefied petroleum gas.
The authors of article [15] draw attention to the fact that new cars meet the emission requirements in the RDE tests; however, under conditions not much different from those required in the tests, their exhaust emissions may be much greater. This is especially true for cold engine starts at low ambient temperatures, especially in urban driving conditions. Lowering the outside temperature in the short RDE test results in a 50% increase in nitrogen oxide emissions, a 2-fold increase in carbon monoxide emission, and a 10-fold increase in non-methane hydrocarbon emissions.
A similar topic of research was presented in [16], where a hybrid drive vehicle was tested at various ambient temperatures using the RDE and WLTC tests. It was found that the road emissions of carbon monoxide at the ambient temperature of −7 °C are 2 or even 3 times higher for the WLTC test when compared to results obtained at the temperature of 23 °C. At low ambient temperatures, the exhaust emissions of nitrogen oxides were doubled, and the exhaust emissions of the particle number were about four times higher. The results described refer to a vehicle beginning the test with 100% SOC, whereas the results were comparable for 0% SOC (they differed 5-fold only in the case of carbon monoxide emissions). The authors indirectly formed conclusions about the changes in the exhaust emissions in the RDE tests, as they adopted the principle of comparison between the WLTC tests and assumed the similarity of changes between the RDE and WLTC tests, but the RDE tests were performed only for the ambient temperature of 23 °C.
In article [17], the authors used the RDE test procedure to analyze the emissions of unregulated exhaust components. The tests were carried out on vehicles powered by gasoline, diesel and compressed natural gas. Increased exhaust emissions of NH3 were found (average), especially from vehicles with compressed natural gas (64 mg/km) and gasoline (35 mg/km) engines; for a diesel engine, the value was 10 mg/km. Nitrogen dioxide emissions were observed only in diesel vehicles and amounted to 17 mg/km.
Summarizing the literature review, it can be stated that there is no comprehensive comparison of exhaust emissions in the WLTC and RDE tests for all exhaust components relative to a common parameter, such as vehicle speed. The presented research eliminates this deficiency, which is a new contribution of the authors’ to this scientific discipline.
3. Subject of the Paper
This paper presents the results of empirical tests of a passenger car from the WLTC (Worldwide Harmonized Light-Duty Vehicles Test Cycle) and RDE tests. A car powered by a gasoline engine with a displacement volume of 1.5 dm3 was selected as the test object, which is representative of the most frequently used vehicles in Poland. The technical characteristics of the vehicle drive are shown in Table 1.

Table 1.
Technical parameters of the tested vehicles.
The WLTC [4] test is used in the Worldwide Harmonized Light-Duty Vehicles Test Procedure (WLTP), published as UNECE Global Technical Regulation No. 15. The WLTP procedure replaces the European Light Vehicle Type Approval Procedure based on the NEDC test (New European Driving Cycle). The WLTP procedure was introduced by the European Union on 1 November 2017.
The RDE test procedure was developed in the EU (European Union) for European vehicles (Annex IIIA of regulation 692/2008) [18]. RDE testing requirements based on the EU procedure have also been adopted by other countries such as China. The RDE procedure was introduced in four different packages from March 2016 to November 2018 for Euro 6 vehicles.
4. Empirical Research Results for WLTP and RDE Tests
The vehicle tests as part of the WLTC and RDE test procedures were performed to a greater extent than the formal requirements of type approval tests dictate. The exhaust emission tests included: carbon monoxide; hydrocarbons; non-methane hydrocarbons; methane; nitrogen oxides reduced to nitrogen oxide; nitrogen oxide; nitrogen dioxide; carbon dioxide; and the number of particles.
Figure 1 shows the vehicle speed curves recorded in the WLTC and RDE tests.
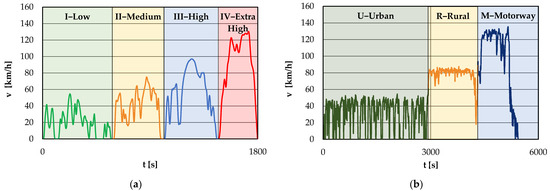
Figure 1.
Vehicle speed curve (v) from the: (a) WLTC test; (b) RDE test.
There was clearly a significant difference in the vehicle speed curve in both tests. The RDE test has a much longer duration than the WLTC test, as well as for the average and maximum speed values. Consequently, the distance traveled by the vehicle in the RDE test was significantly greater than in the WLTC test. Moreover, the tests differ in the proportion of the dynamic states of the vehicle speed process.
Table 2 and Table 3 show the exhaust emission results from the WLTC and RDE tests, from individual test phases and from the entire tests. The share of dynamic states is clearly greater in the RDE test.
Table 2.
Mean road emissions, mean road number of emitted particles and average vehicle speed from the individual test phases and from the entire WLTC test.
Table 3.
Mean road emissions, mean road number of emitted particles and average vehicle speed from the individual test phases and from the entire RDE test.
Phases: I, II, III and IV, respectively, in the WLTC test last between:
- 0 s–472 s;
- 472 s–1000 s;
- 1000 s–1466 s;
- 1466 s–1800 s.
Phases: U (urban driving phase), R (rural driving phase) and M (motorway driving phase), respectively, in the RDE test last between:
- 0 s–2850 s;
- 2850 s–4264 s;
- 4264 s–5595 s.
5. Discussion
Figure 2 shows the average road emissions of exhaust components from individual test phases and from the entire WLTC test. The figure also shows the average number of emitted particles from the individual phases and from the entire WLTC test.
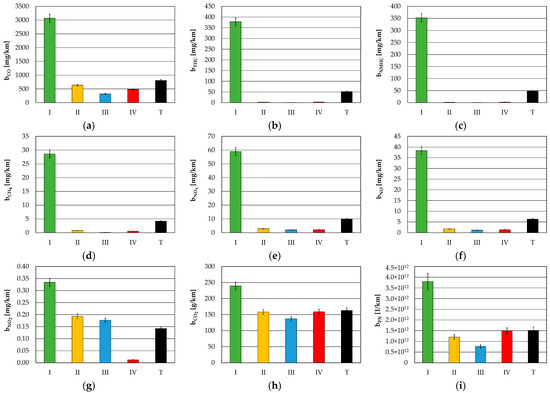
Figure 2.
Mean road exhaust emissions in the different phases of the WLTC test (I–Low, II–Medium, III–High, IV–Extra High, T–Total) for: (a) carbon monoxide; (b) hydrocarbons; (c) non-methane hydrocarbons; (d) methane; (e) nitrogen oxides; (f) nitrogen oxide; (g) nitrogen dioxide; (h) carbon dioxide; (i) number of emitted particles.
There is a clear and noticeable difference between the average road emissions of carbon monoxide (Figure 2a) in phase I and the same road emissions in the subsequent phases. This was mainly due to the cold start of the engine, which results in a greater emission of substances that reduces properties in relation to oxygen. Moreover, after the engine cold-start, the efficiency of the catalytic converter was low. Even greater than in the case of carbon monoxide was the difference in the road emissions of hydrocarbons (Figure 2b), non-methane hydrocarbons (Figure 2c) and methane (Figure 2d). The reasons for this were the same as those for carbon monoxide. In the case of nitrogen oxides (Figure 2e), nitrogen oxide (Figure 2f) and nitrogen dioxide (Figure 2g), the lower engine temperature leads to a reduced formation of these substances; however, the decisive factor in the higher average road emissions in phase I is the low efficiency of the catalytic reactor when it is below its operating temperature. Additionally, the average road emissions of carbon dioxide (Figure 2h) were higher in phase I, in which the impact of the cold engine start on fuel consumption is visible. As in the case of gaseous exhaust emissions, the mean road emissions of the number of particles were also the highest in phase I (Figure 2i).
Figure 3 shows the average road exhaust emissions from particular phases and from the entire RDE test. The figure also shows the mean number of particles emitted during the individual phases as well as during the RDE test as a whole.
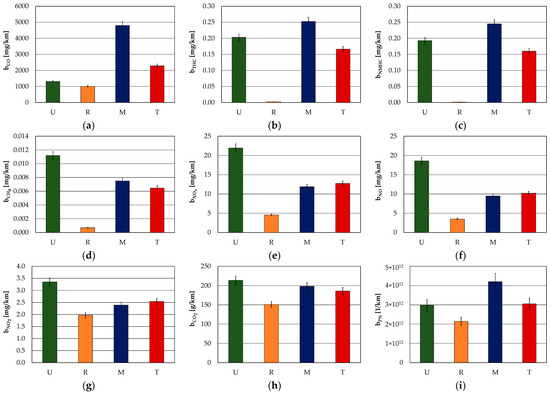
Figure 3.
Mean road exhaust emissions in the different phases of the RDE test (U–Urban, R–Rural, M–Motorway, T–Total) for: (a) carbon monoxide; (b) hydrocarbons; (c) non-methane hydrocarbons; (d) methane; (e) nitrogen oxides; (f) nitrogen oxide; (g) nitrogen dioxide; (h) carbon dioxide; (i) number of emitted particles.
The highest mean road emission of carbon monoxide occurred during the motorway driving phase (Figure 3a), which results from the high engine load in such driving conditions. The same was true for hydrocarbons (Figure 3b) and non-methane hydrocarbons (Figure 3c). Among the organic compounds, only the values of the mean road emissions for methane differ (Figure 3d).
Generally, the orders of magnitude of this value were comparatively small, and the decisive factor of the great value in the urban phase was the cold engine start. In the case of nitrogen oxides (Figure 3e), nitrogen oxide (Figure 3f) and nitrogen dioxide (Figure 3g) with a high average road emission value in the urban phase, the engine cold-start had a decisive impact.
The same was true for carbon dioxide (Figure 3h). The highest mean road emission value for the number of particles (Figure 3i) in the motorway phase resulted mainly from the high average engine load in such driving conditions.
It could clearly be seen that the cold engine start had a much greater impact on the increase in the mean road exhaust emissions and the mean number of emitted particles in the first phase of the WLTC test as compared to the analogous phenomenon in the RDE test. This was largely due to the fact that the distance travelled in the RDE test is much greater than in the WLTC test, and thus, the share of exhaust emissions during the engine heat-up phase as part of the total exhaust emissions value was lower for the RDE test.
In the WLTC test, the mean road emissions of all measured exhaust gases and the mean number of particles were the highest in the first test phase. The greatest impact of the engine cold-start on the change in mean road emissions in the first phase of the WLTC test was observed for organic compounds.
Figure 4 compares the mean road exhaust emissions from the WLTC and RDE tests, and also compares the mean road emissions of the number of particles from the WLTC and RDE tests.
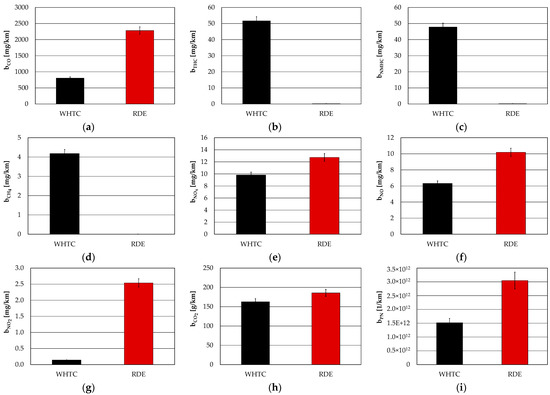
Figure 4.
Comparison of mean road exhaust emissions in the different phases of the RDE and WLTC tests for: (a) carbon monoxide; (b) hydrocarbons; (c) non-methane hydrocarbons; (d) methane; (e) nitrogen oxides; (f) nitrogen oxide; (g) nitrogen dioxide; (h) carbon dioxide; (i) number of emitted particles.
The mean road emissions of carbon monoxide were clearly higher in the RDE test (Figure 4a). The main reason for this was the higher average engine load in the RDE test. For organic compounds, the dominant cause of the significantly higher road emissions in the WLTC test was the very high exhaust emissions of these substances when starting a cold engine (Figure 4b–d).
In the case of nitrogen oxides, nitrogen oxide and nitrogen dioxide, the mean road emissions in the RDE test were higher, which was mainly due to the higher average engine load in this test (Figure 4e–g). Additionally, for this reason, the mean road carbon dioxide emissions were higher (Figure 4h), as well as the mean number of solid particles emitted (Figure 4i).
Summarizing the comparison of the mean road exhaust emissions and the mean road emitted number of particles, the following can be stated: The mean road emissions were significantly higher in the WLTC test for organic compounds. For carbon monoxide and nitrogen oxides, the average road emissions in the RDE test were higher, and for nitrogen dioxide, they were much higher, whereas for the combined nitrogen oxides and nitrogen oxide, they were only slightly higher.
The mean road carbon dioxide emission values were comparable for both tests, which means that the average operational fuel consumption was comparable between both tests. The mean number of particles emitted was much higher in the RDE test, which was mainly due to the fact that the RDE test had a greater share of dynamic states than the WLTC test.
Figure 5 shows a comparison of the relationship between the mean road emissions and the average speed of a car in particular phases of the WLTC and RDE tests, as well as the relationship between the average road emissions of the particle number and its effect on the average speed of a test vehicle in particular phases of the WLTC and RDE tests. Such characteristics, determined in many tests, were used to model exhaust emissions when the vehicle was moving at a given average speed. In the case of the exhaust emissions of carbon monoxide (Figure 5a), a very large difference occurred only for the lowest average speed, i.e., in phase I of the WLTC test. The situation was similar in the case of other organic compounds (Figure 5b–d). In these cases, however, the increase in exhaust emissions of organic compounds in phase I of the WLTC test was very clear due to the engine cold-start. As the road emissions of organic compounds in phase I of the WHCT test were largely defined by the initial emissions of the cold engine, graphs without this phase are presented in Figure 5e–g. Even without phase I of the WLTC test, the average road emissions of organic compounds were significantly higher than the average road emissions in the RDE test. This may be due to significantly different engine operating conditions present in the WLTC and RDE tests, and as a result, due to different heating characteristics of the exhaust aftertreatment devices.
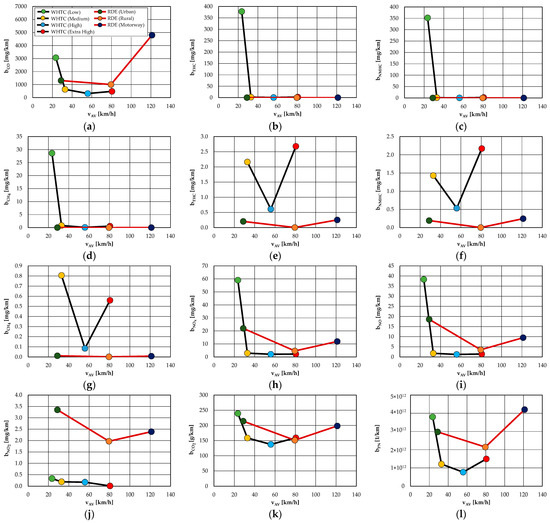
Figure 5.
The relationship between the road exhaust emissions and the test vehicle driving speed in the WLTC and RDE tests for: (a) carbon monoxide; (b) hydrocarbons; (c) non-methane hydrocarbons; (d) methane; (e) hydrocarbons w/o cold-start; (f) non-methane hydrocarbons w/o cold-start; (g) methane w/o cold-start; (h) nitrogen oxides; (i) nitrogen oxide; (j) nitrogen dioxide; (k) carbon dioxide; (l) number of emitted particles.
The exhaust emission results of nitrogen oxides, nitrogen oxide and nitrogen dioxide were different (Figure 5h–j). In the case of nitrogen oxides, there was a tendency for the average road emissions in the RDE test to be higher. This was especially true for nitrogen dioxide. The reason for the higher mean road emissions of nitrogen oxides in the RDE test was the higher average engine load in this test. In the case of nitrogen oxides and nitrogen oxide, as in the case of other pollutants, the greater value of the mean road emissions in phase I of the WLTC test results from the greater impact of the cold engine start and operation when compared to the impact of the same start in the RDE test.
The mean road carbon dioxide emission results (Figure 5k) were similar for both tests. The higher value of the mean road carbon dioxide emissions for low vehicle speed in Phase I of the WLTC test was due to the high fuel consumption impact of the cold engine start. On the other hand, higher values of the mean road emissions of carbon dioxide in the RDE test resulted from the higher average engine load in this test. The relationships for the characteristics of the mean road emissions of the number of particles were similar (Figure 5l).
The road exhaust emission characteristics and the road particle number emissions, relative to the average speed of the test vehicle, differed significantly between the two tests. First of all, the average vehicle speed range in the individual test phases differed significantly: for the RDE test, these values were higher than for the WLTC test. Moreover, for low values of the average vehicle speed, the effect of cold starting the engine and its subsequent heating in the WLTC test was clearly noticeable, whereas for high values of the average vehicle speed, the impact of the higher average load of the engine could be seen in the RDE test.
6. Conclusions
The test results allowed us to conclude that the exhaust emissions of harmful compounds are very sensitive to the operating state of the internal combustion engine, determined by the vehicle speed process. A certain limitation of the generalized nature of the conclusions is the fact that the comparisons of road emissions and road particle emissions were made based on the results of one-off tests, both performed through a chassis dynamometer and in real driving conditions of a vehicle. It would be advisable to continue working with repeatable conditions and using multiple tests. In such a situation, it would be possible to treat the engine operating states in individual vehicle speed curves as an implementation of a stochastic process [19,20]. Such tests, although very time-consuming and costly, would make it possible to determine the probabilistic characteristics of exhaust emission test results, such as probability density, expected value, mean standard deviation and coefficient of variation.
It is also possible to carry out tests in engine operation states that are determined by the car speed processes or the car’s acceleration (or the product of speed and acceleration), treating them as stochastic, and the realizations of which are determined as a result of empirical tests in various traffic conditions. Examples of the results of such studies were presented in [8,21]. This publication presents the exhaust emission test results in the implementation of driving tests determined for the traffic conditions of a passenger car in traffic jams, in the city without road congestion, outside cities and on highways and expressways.
The next planned step of the research should be testing vehicles supplied with a different fuel (such as liquefied petroleum gas or diesel), as well as vehicles with other types of drive systems. The authors anticipate the great potential of the research of hybrid vehicles (including plug-in hybrids).
Author Contributions
Conceptualization, Z.C., J.M., M.A.-Z. and J.P.; methodology, Z.C., J.M. and J.P.; software, J.P.; validation, Z.C., J.M., M.A.-Z. and J.P.; formal analysis, Z.C., J.M., M.A.-Z. and J.P.; investigation, Z.C., J.M. and J.P.; resources, Z.C. and J.M.; data curation, Z.C., J.M., M.A.-Z. and J.P.; writing—original draft preparation, Z.C. and J.M.; writing—review and editing, Z.C., J.M., M.A.-Z. and J.P.; visualization, Z.C. and J.P.; supervision, Z.C., J.M., M.A.-Z. and J.P.; project administration, Z.C., J.M., M.A.-Z. and J.P.; funding acquisition, Z.C., J.M., M.A.-Z. and J.P. All authors have read and agreed to the published version of the manuscript.
Funding
This research received no external funding.
Institutional Review Board Statement
Not applicable.
Informed Consent Statement
Not applicable.
Data Availability Statement
The data presented in this study are available on request from the corresponding author.
Conflicts of Interest
The authors declare no conflict of interest.
Abbreviations
| b | road emissions/road number (for particles) |
| CH4 | methane |
| CO | carbon monoxide |
| CO2 | carbon dioxide |
| EU | European Union |
| Gf | consumption of fuel mass |
| M | motorway |
| NEDC | New European Driving Cycle |
| NMHC | non-methane hydrocarbons |
| NO | nitrogen oxide |
| NO2 | nitrogen dioxide |
| NOx | nitrogen oxides |
| PEMS | portable emission measurement system |
| PN | particle number |
| R | rural |
| RDE | real driving emissions |
| S | distance |
| t | time |
| THC | total hydrocarbons |
| U | urban |
| v | vehicle speed |
| WLTC | Worldwide Harmonized Light-Duty Vehicles Test Cycle |
| WLTP | Worldwide Harmonized Light-Duty Vehicles Test Procedure |
References
- Merkisz, J.; Bielaczyc, P.; Pielecha, J.; Woodburn, J. RDE Testing of Passenger cars: The effect of the cold start on the emissions results. SAE Tech. Pap. 2019, 2019-01-0747. [Google Scholar] [CrossRef]
- Commission Regulation 2016/427 of 10 March 2016 Amending Regulation (EC) No. 692/2008 as Regards Emissions from Light Passenger and Commercial Vehicles (Euro 6), Verifying Real Driving Emissions, L 82. Available online: http://data.europa.eu/eli/reg/2016/427/oj (accessed on 15 September 2022).
- Commission Implementing Decision (EU) 2016/464 of 29 March 2016 Amending the Annex to Implementing Decision 2014/709/EU Concerning Animal Health Control Measures Relating to African Swine Fever in Certain Member States, as Regards the Entries for Estonia and Poland, L 80. Available online: http://data.europa.eu/eli/dec_impl/2016/464/oj (accessed on 15 September 2022).
- European Commission Regulation (EC) 2017/1151 of 1 June 2017 Supplementing Regulation (EC) No 715/2007 of the European Parliament and of the Council on Type-Approval of Motor Vehicles with Respect to Emissions from Light Passenger and Commercial Vehicles (Euro 5 and Euro 6) and on Access to Vehicle Repair and Maintenance Information, Amending Directive 2007/46/EC of the European Parliament and of the Council, Commission Regulation (EC) No 692/2008 and Commission Regulation (EU) No 1230/2012 and Repealing Commission Regulation (EC) No 692/2008. Official Journal of the European Union. L 175. Available online: http://data.europa.eu/eli/reg/2017/1151/oj (accessed on 15 September 2022).
- Pielecha, J.; Skobiej, K.; Kubiak, P.; Wozniak, M.; Siczek, K. Exhaust emissions from plug-in and HEV vehicles in type-approval tests and real driving cycles. Energies 2022, 15, 2423. [Google Scholar] [CrossRef]
- Merkisz, J.; Pielecha, J.; Bielaczyc, P.; Woodburn, J. Analysis of emission factors in RDE tests as well as in NEDC and WLTC chassis dynamometer tests. SAE Tech. Pap. 2016, 2016-01-0980. [Google Scholar] [CrossRef]
- Andrych-Zalewska, M.; Chłopek, Z.; Merkisz, J.; Pielecha, J. Evaluation of the Test drive cycle conditions impact on exhaust emissions from an internal combustion engine. Combust. Engines 2018, 175, 4. [Google Scholar] [CrossRef]
- Kurtyka, K.; Pielecha, J. The evaluation of exhaust emission in RDE tests including dynamic driving conditions. Transp. Res. Procedia 2019, 40, 338–345. [Google Scholar] [CrossRef]
- Pielecha, J.; Merkisz, J.; Markowski, J.; Jasiński, R. Analysis of passenger car emission factors in RDE tests. E3S Web Conf. 2016, 10, 00073. [Google Scholar] [CrossRef]
- Thomas, D.; Li, H.; Wang, X.; Ropkins, K. Comparison of tailpipe gaseous emissions for RDE and WLTC using SI passenger cars. SAE Tech. Pap. 2017, 2017-01-2391. [Google Scholar] [CrossRef]
- Woodburn, J.; Bielaczyc, P.; Pielecha, J.; Merkisz, J.; Szalek, A. Exhaust emissions from two Euro 6d-compliant plug-in hybrid vehicles: Laboratory and on-road testing. SAE Tech. Pap. 2021, 2021-01-0605. [Google Scholar] [CrossRef]
- European Commission; Joint Research Centre; Weiss, M.; Paffumi, E.; Clairotte, M.; Drossinos, Y.; Vlachos, T.; Bonnel, P.; Giechaskiel, B. Including Cold-Start Emissions in the Real-Driving Emissions (RDE) Test Procedure: An Assessment of Cold-Start Frequencies and Emission Effects; Publications Office of the European Union: Luxembourg, Luxembourg, 2017; Available online: http://data.europa.eu/doi/10.2760/70237 (accessed on 25 September 2022).
- Pielecha, J.; Skobiej, K.; Gis, M.; Gis, W. Particle number emission from vehicles of various drives in the RDE tests. Energies 2022, 15, 6471. [Google Scholar] [CrossRef]
- Šarkan, B.; Jaśkiewicz, M.; Kubiak, P.; Tarnapowicz, D.; Loman, M. Exhaust Emissions Measurement of a Vehicle with Retrofitted LPG System. Energies 2022, 15, 1184. [Google Scholar] [CrossRef]
- Giechaskiel, B.; Valverde, V.; Kontses, A.; Suarez-Bertoa, R.; Selleri, T.; Melas, A.; Otura, M.; Ferrarese, C.; Martini, G.; Balazs, A.; et al. Effect of Extreme Temperatures and Driving Conditions on Gaseous Pollutants of a Euro 6d-Temp Gasoline Vehicle. Atmosphere 2021, 12, 1011. [Google Scholar] [CrossRef]
- Ehrenberger, S.I.; Qiao, J.; Konrad, M.; Philipps, F. Analysis of Tail-Pipe Emissions of a Plug-in Hybrid Vehicle and Its Average Emissions for Different Test Cycles. In Proceedings of the 22rd International Transport and Air Pollution Conference, Zürich, Switzerland, 15–16 November 2017; Available online: https://elib.dlr.de/116955/1/TAP2017_Ehrenberger.pdf (accessed on 27 October 2022).
- Suarez-Bertoa, R.; Pechout, M.; Vojtíšek, M.; Astorga, C. Regulated and Non-Regulated Emissions from Euro 6 Diesel, Gasoline and CNG Vehicles under Real-World Driving Conditions. Atmosphere 2020, 11, 204. [Google Scholar] [CrossRef]
- Commission Regulation 692/2008 of 18 July 2008 Implementing and Amending Regulation (EC) 715/2007 of the European Parliament and of the Council on Type-Approval of Motor Vehicles with Respect to Emissions from Light Passenger and Commercial Vehicles (Euro 5 and Euro 6) and on Access to Vehicle Repair and Maintenance Information, European Commission (EC), L 199. Available online: http://data.europa.eu/eli/reg/2008/692/oj (accessed on 15 September 2022).
- Papoulis, A.; Pillai, S.U. Probability, Random Variables, and Stochastic Processes; Tata McGraw-Hill: New York, NY, USA, 2002. [Google Scholar]
- Parzen, E. Stochastic Processes; Courier Dover Publications: Mineola, NY, USA, 2015. [Google Scholar]
- Chłopek, Z.; Biedrzycki, J.; Lasocki, J.; Wójcik, P. Examination of pollutant emissions and fuel consumption at tests simulating the real conditions of operation of a passenger car. Arch. Automot. Eng. 2014, 65, 3. [Google Scholar]


Publisher’s Note: MDPI stays neutral with regard to jurisdictional claims in published maps and institutional affiliations. |
© 2022 by the authors. Licensee MDPI, Basel, Switzerland. This article is an open access article distributed under the terms and conditions of the Creative Commons Attribution (CC BY) license (https://creativecommons.org/licenses/by/4.0/).