Article

Analysis of the Possibilities of Reduction of Exhaust Emissions from a Farm Tractor by Retrofitting Exhaust Aftertreatment

1
Faculty of Civil Engineering and Transport, Institute of Combustion Engines and Powertrains, Poznan University of Technology, Piotrowo 3, PL-60965 Poznan, Poland
2
Faculty of Chemical Technology, Institute of Chemistry and Electrochemistry, Poznan University of Technology, Berdychowo 4, PL-60965 Poznan, Poland
*
Author to whom correspondence should be addressed.
Energies 2022, 15(21), 7963; https://doi.org/10.3390/en15217963
Submission received: 23 September 2022 / Revised: 17 October 2022 / Accepted: 20 October 2022 / Published: 27 October 2022
(This article belongs to the Special Issue Internal Combustion Engine: Research and Application)

Abstract

:
The paper evaluates particulate matter emissions and exhaust gas components from retrofitted engines of non-road vehicles measured under actual operating conditions. The content is divided into three main parts: formation of guidelines, production of the filter and emission tests. The obtained results clearly indicate excess PM and PN emissions from the engine under actual operating conditions when compared to the limits outlined in the type approval standards. Moreover, it was observed that the actual conditions are reflected to a very small extent at the points included in the stationary homologation test cycle. Based on these observations, the authors decided to modify the stationary test cycle. The measured exhaust gas compositions and their mass flow rates were used to create the geometry of the newly developed filter. The paper contains detailed results of the relative specific exhaust emissions of particulate matter and gaseous components at individual engine operating points. The exhaust emissions analysis made it possible to draw conclusions regarding the operation of the newly designed system. One of them is that fitting a metal-support particulate filter in the exhaust system significantly contributes to reducing the exhaust emissions.

1. Introduction

Aside from the attempts to reduce fuel consumption, the advancement of the powertrains of vehicles and machines also focuses on reducing their negative environmental impact. For over 100 years, internal combustion engines have been the main source of power for machines and vehicles. Despite continuous improvements to their design, as well as advancement in the applied materials, they still generate a multitude of toxic components when in operation. These are: carbon monoxide (CO), hydrocarbons (HC), nitrogen oxides (NOx), particulate matter (PM) and particulate number (PN). The last two are particularly problematic in diesel engines (CI), dominant among heavy-duty vehicles (HDV) and non-road machinery (including non-road mobile machinery, NRMM). When analyzing average air pollution with PM10 and PM2.5 (suspended particles of a size lower or equal to 10 and 2.5 micrometers), Poland places second last out of all the EU member states [1]. The problem has many adverse effects, such as the reduction of the life expectancy of an average EU citizen by 6 to 12 months [2,3].
According to the WHO (World Health Organization), 13% of EU citizens are regularly exposed to air containing excess PM10 level and 6% to air with excess PM2.5 [4]. According to the report, excess air pollution with PM10 and PM2.5 contributed to 422,000 premature mortalities in Europe in 2015 [4]. In Poland, this number reaches 44,000 [5], where long-term exposures to PM2.5 occur in the concentration of 20–30 µg/m3, and in the most highly polluted regions in the south of the country, the average values reach 40 µg/m3 [4]. Health-wise, breathing such polluted air can be compared to smoking up to 3000 cigarettes per annum, which significantly contributes to the occurrence of upper respiratory diseases in the society [6,7,8].
The engine under operation generates particulate matter whose fundamental component is soot from unburnt fuel [9]. Compared to PM2.5 and PM10, particles generated by engines are characterized by much smaller size (aerodynamic diameters reach several nanometers, i.e., up to 1000 smaller than the upper limit for PM10, Figure 1) [10]. Such particles are extremely hazardous to human health. A human’s nasal cavity can filter particles of a size of up to approx. 100 nm, the human throat accumulates particles of the size of several nm, and the smallest ones make their way to the pulmonary alveoli and then directly to the bloodstream [11]. These particles are mainly composed of carbon and their surface adsorbs a multitude of toxic substances [6], hydrocarbons in particular.
Outside of the energy sector, the transport sector (particularly machines fitted with diesel engines) has a dominant share in the emission of nitrogen oxides and the secondary emission of tropospheric ozone [6]. It is estimated that, in Europe, 12% of the population is exposed to an excess concentration of NOx. In Poland, annually, particulate matter and nitrogen oxides directly contribute to 1600 and 1000 mortalities, respectively [12].
In works focusing on the reduction of exhaust emissions from combustion engines, scientists have undertaken numerous attempts of hybridization and electrification. Examples of the application of electric motors are evident in the designs of the powertrains of the PC (passenger car) and LDV (light duty vehicle) categories. For these vehicles, for years the market has been offering powertrain solutions such as: hybrid, electric or hydrogen-based fuel cells. The said alternative solutions are rarely applied in HDVs (heavy-duty vehicles). However, increasingly wider actions in this context have recently been taken for this group of vehicles. There is a similar situation in the category of non-road machinery. Compared to passenger cars, the nature of the NRMM operation, i.e., the engine operation characteristics, does not ensure such measurable positive effects when hybridization or electrification is applied [6]. In the case of HDVs, buses are an exception where hybrid and electric solutions are widely applied.
For NRMM, the strategy of design assumes high engine durability, which significantly extends the service life compared to the PC category. For the above reason, a problem of use arises in which obsolete machines of low technical condition generate excess exhaust emissions, the latter being in no way under control during operation. The measured values of particulate and nitrogen oxide emissions from HDVs and farm machinery in Australia indicate different trends in these categories. For HDVs, the particulate emissions have been significantly decreasing since 2000, while the emission of nitrogen oxides have only decreased since 2018 [13]. For the much smaller group of NRMM, the forecast indicates an increasing trend for these exhaust components. Again, the problem appears to be the average age of the equipment reaching several years [14,15].
According to forecasts, increasing the number of vehicles and machines fitted with combustion engines, not only in the NRMM group, will contribute to the growth of exhaust emissions (PM and NOx) from diesel engines and increase the cost of human health. According to these forecasts, in Australia, this cost will grow from AUD 790 million (2016) to AUD 4.6 billion in 2050 [16].
Due to the destructive environmental impact of the group of machines under analysis and the slow process of their renewal, the idea of retrofitting was born [17,18] as a way to reduce the exhaust emissions. NRMM retrofitting is a process of equipping already existing designs manufactured according to obsolete homologation standards with modern aftertreatment systems without changing the original engine design. Reducing the admissible values of exhaust emissions in individual emission standards has a real impact only on the newly manufactured equipment. Reducing the exhaust emissions from older machinery should have a better environmental outcome compared to the slow process of machine renewal, given the cost of retrofitting that, for some years now, has been several times lower than the said renewal [17].
The idea of using modern aftertreatment consists of reducing excess emissions through catalytic reactions of oxidation or chemical reduction. In the case of particulate matter, a filter is applied, trapping particles that are continuously or periodically oxidized. The implementation of the new solution consists of installing the aftertreatment device in the existing exhaust system. It does not require any additional action from the machine operator. The process of retrofitting has already been applied to vehicles of other groups and it is constantly being improved and implemented in new areas of transport and machine operation. The legislation presented in this chapter pertains to machines marketed within the European Union, which boasts to have the most rigorous standards worldwide (Figure 2) [19,20].

2. Research Methodology

2.1. Research Object

In order to explore the actual emission values, we selected a non-road machine as a base research object (Stage IIIA farm tractor). In the exhaust system of the tractor was a DOC (diesel oxidation catalyst) (Table 1). The performed investigations focused on measuring the operating conditions (variability of engine speeds and loads) and the assessment of the raw untreated exhaust gas (PM and PN) under actual operation. During the measurements, the tractor performed a triticale sowing job and the machine was operated by a qualified driver (Figure 3). The weight of the measurement equipment and the peripherals were sufficiently low compared to the weight of the entire machine, and therefore the authors decided to neglect it when processing the results.

2.2. Measurement Equipment

The advancement in the area of measurement systems has led to the miniaturization of exhaust emissions research equipment to the extent that it now can be installed in the vehicle and used during its operation while still ensuring the required measurement accuracy. This is an important aspect because, in practically all categories of vehicles and machines fitted with combustion engines, the occurrence of differences between the homologation and actual operation testing conditions has been observed [10]. The variations pertain to the engine operating points and the area of variability of their occurrence, hence the exhaust emissions [20,22,23,24,25,26,27,28].
Portable emission measurement systems (PEMS) represent a group of devices measuring tailpipe exhaust emissions under actual conditions of operation. The measurements are carried out by utilizing the absorption of radiation of a given wavelength by a given exhaust component and comparing the obtained signal to the reference gas or ambient air. The analyzers take only a small volume of the exhaust gas; therefore, their proper fitting in the exhaust system is vital to ensure no unnecessary changes in the gas flow direction.
Due to the necessity of a complex assessment of the exhaust emissions, within this research work, the authors used three PEMS devices. For the assessment of the gaseous exhaust components, the authors used SEMTECH DS by Sensors Inc. (Figure 4a). In the device, a gas sample is taken from the exhaust mass flow meter. Based on the pressure measurement at different points of the line (Pitot tube) and appropriate calculations, information can be obtained regarding the mass exhaust flow that is used to calculate the emission rate. The sample is transported through a heated line at the temperature of approx. 191 °C. This prevents the condensation of hydrocarbons on its walls when passing from the flow meter to the analyzer.
At the inlet to the SEMTECH DS. device, the tested gas volume is filtered out of the particulate matter and the purified gas flows to the flame ionization detector (FID). There, the concentration of hydrocarbons is measured by the observation of the changes of the ionization of the hydrogen flame. Then, the sample is chilled to approx. 4 °C and travels to the NDUV (non-dispersive ultraviolet) and NDIR (non-dispersive infrared) analyzers. At these points, the system measures the absorption of the ultraviolet and infrared radiation, which allows the concentration of carbon monoxide, carbon dioxide and nitrogen oxides in the sample to be determined. The last stage is the measurement of the oxygen concentration in the electrochemical sensor (Figure 4b). At the end of the measurement line, the exhaust gas is removed from the system.
The equipment is also fitted with a weather station, based on which a correction of the obtained data is performed and a GPS receiver records the motion parameters of the tested object. The equipment can also communicate with the vehicle OBD/CAN system and records the basic engine parameters through the implemented protocols, which allows a direct calculation of specific emissions. These data were used in the measurements made in this article (RPM and engine load).
Depending on the mass flow, it is necessary to select the mass flow meter. The selection of this meter is based on the engine displacement and whether or not the engine is supercharged.
The measurements of the particulate matter were carried out with an MSS (a portable Micro Soot Sensor analyzer) by AVL GmbH (Figure 5a). The device takes a sample of the exhaust gas through a heated line and, when necessary, dilution is applied. This is required for exhaust gas with a high level of PM, because the measurement range of the device is limited.
The taken sample is conditioned and then travels to the measurement chamber, where it is subjected to a fast-varying radiation, resulting in a constant heating and chilling of the contained particles. The measure of the PM concentration is the vibration generated during the process.
The generated sound is captured by sensitive microphones at a certain range of amplitudes and frequencies and the intensity of the obtained acoustic wave is the measure of the PM concentration (Figure 5b). Given the volumetric flow of the exhaust gas and the dilution coefficients, it is possible to calculate the specific PM emissions.
The PN and PM size distribution within the research was determined with the Engine Exhaust Particle Sizer (EEPS™) 3090 by TSI (Figure 6a). Similar to AVL MSS, the device can dilute the exhaust gas samples for engines of high PM emissions.
Upon taking the volumetric sample of the exhaust gas, in the first measurement step, the particles larger than 1 µm are trapped by the prefilter (this size is outside of the measurement range of the device). Then, upon passing the neutralizer, the sample is electrically charged. In the next step, the charged PM is repulsed by the main electrode and attracted by the lateral electrodes located in the analyzer. The greater the weight of the particle (hence the diameter), the greater the potential of the electrode it is attracted to (Figure 6b).
The content of the particles on the electrode constitutes a measure of the number and size distribution of the particle diameters. Depending on the tested engine, the exhaust gas can be diluted by the ambient air sucked into the line through the HEPA (high-efficiency particulate air) filter in order to avoid measurement errors. The device allows measuring the PM of the diameter from 5.6 to 560 nm at the measurement frequency of up to 10 Hz [30].

3. Results of Preliminary Studies

The investigated machine generated much less carbon monoxide than the admissible limit. The obtained data confirm the results from earlier works regarding the testing of vehicles and machines under actual operating conditions [10,13,31]. Significant amounts of carbon monoxide are emitted into the atmosphere during cold starts, and the tests performed under actual operating conditions of the machine were carried out on a warm engine. The present oxidation catalyst technology applied in the exhaust systems is sufficient to meet the Stage IIIA standard, according to which the investigated research object was homologated. In the case of the investigated farm tractor, the specific emission of CO was 52% of the values defined by the standards, despite different engine operating points (Figure 7). The presence of hydrocarbons in the exhaust gas is usually caused by the same factors that cause the presence of carbon monoxide. The main reason behind it is the imperfection of the combustion process.
The determined emission of PM for the tested tractor was referred to the limits of the homologation standards [32]. In the IIIA guidelines, the limit is 0.2 g/kWh (Figure 8). The obtained value indicates a serious excess of the limits as measured during the tests under actual operation, compared to the guidelines defined for the homologation measurements. In order to adjust the emission levels obtained during actual operation to the homologation cycles for engines of machines from other categories, a conformity factor CF (conformity factor) was introduced. It constitutes a multiplicity by which the emission level increases (or decreases) under actual operation compared to the homologation procedure (emission testing in the NRSC and NRTC). The above makes it possible to compare the emission results under actual operation.
When applying the factor of 2 (defined for the gaseous exhaust components of the newer Stage V standard), the legislation guidelines will also be exceeded almost three times (Figure 8).
An important aspect in the context of environmental protection is the emission of PM in terms of its number. This is the latest trend when it comes to the reduction of engine exhaust emissions. Within Stage V, a PN limit was defined on the level of 1 × 10¹²/kWh, yet it is only applicable for selected machine subgroups of non-road applications (engine power from 19 to 560 kW) [30]. It is noteworthy that this value is ten times greater than the currently applicable limit for HDV vehicles. When referring to the recorded values of PN for the research object to the limit of the newer Stage V standard, a significant excess was observed (Figure 9).
The said excess was greater than it was for PM, which indicates a greater number of the most hazardous particles of nanometric diameters.

4. Filter Simulation Research

The basic and widespread particulate filtering system is a catalyst-covered DPF. Based on the results of the preliminary studies, a simulation of a virtual filter with a metal support was performed in the Fluent 14.5 environment. Fluent 14.5 is a part of the Ansys package in the Academic Research version. The used software allowed modeling of the flow for the filter design that is different from the conventional solutions of the automotive industry, where ceramic supports prevail. We assumed a combination of inner construction features, referred to as flow-through and wall-flow, the effect of which was the defined geometry of the metal support where the flow was to occur between the neighboring channels and the porous layer. The aim of the calculations was the selection of parameters of the layer and the channels in such a way as to ensure a filtration of the particles suspended in the exhaust gas without unnecessary flow resistance. The support channels were selected in such a way as to force a swirl of the exhaust gas, thus increasing the contact with the heated support and intensifying the oxidation of the particles. The investigated geometry and the descriptive dimensions are presented in Figure 10. In the process of production of the filters with metal support, the geometry cannot be selected arbitrarily; therefore, the inner dimensions of the channels were assumed in accordance with the design of such filters manufactured for the PC category of vehicles (Table 2).
The numerical analysis in the Ansys environment was carried out in several steps. In Design Modeler, the geometry of the flow channels and the porous layer was modeled. The flow domain was discretized in the Ansys Meshing module and calculation meshes of possibly high coefficient of quality were created. The meshes were imported to the Fluent software, where the boundary conditions were set according to the selected models of heat exchange, turbulence, porosity and discrete phase. Based on the measurements of the exhaust gas composition, boundary conditions were set for the continuous phase (exhaust gas) and the distribution of PM in the discrete phase. Based on the adopted parameters characterizing the porous layer, the resistance of the medium was calculated that was implemented in the porosity model. The results were presented using Post-cfd and the most advantageous values were selected that the porous layer and the geometry should be characterized with (due to the minimization of the pressure loss and the efficiency of trapping PM).
The exhaust gas, composed of the gaseous phase and the particulate matter, when flowing through the exhaust channel, is slowed down by an inlet diffuser upstream of the support. The uneven distribution of the velocity profile at the expansion of the channel results in the occurrence of the velocity gradient directed from the axis towards the outer walls of the channel, leading to a formation of local swirls near its walls. As a result, the exhaust gas is directed to the inlet area of the filtering channels, where it increases its velocity and pressure following the reduction of the available cross-section of the layer of the thrust support. The distribution of the flow holes along the entire length of the channels allows a flow of the gas between subsequent layers and a deposition of the particles on the surfaces of the filtering channels and the porous layer in the form of chemical substances that increase the relative surface area of the filtering layer.
An increase in the time that the exhaust gas is present in the system, and an increase in the area by applying a porous layer, result in an increased flow resistance compared to a filter with straight channels, composed exclusively of parallel isolated filtering channels. The inner resistance of the medium and the viscous resistance generated by the porosity are proportional to the first and second derivatives of displacement against time. As the thickness of the layer accumulated on the surface of the filter increases, the resistance grows until the point of permanent stoppage of the transverse flow within the simulation. The situation is reflected in an increase in the pressure, reduction of the cross-section of the channels and, as a consequence, increase in the flow velocity through the filtering channels, a drop in the filtering efficiency and an increase in the temperature. When this happens, the exhaust gas flows only through the longitudinal channels where it swirls.
In real life, the accumulation of particulate matter on the surface of filters takes place according to several mechanisms: gravitational, diffusive, intercept and inertia. The deposited layer of particles forms a coating of the permeability of the order of 1.3 × 10⁻¹¹ cm2, differing by two orders of magnitude compared to standard porous layers used in filters (pores of the dimeters of 3 × 10⁻⁹ cm2), which forces periodic regeneration and oxidation of the accumulated particles.
The viscosity of the medium was simulated by the introduction of RSM (Reynolds stress model) turbulence with an extended definition of phenomena taking place near the walls. It also introduced the anisotropy of viscosity that may be significant when modeling the resistance of the porosity, depending on the direction of the flow. In order to obtain a greater convergence of the calculations for the multi-equation model of the flow phenomenon (five equations for two dimensions), the initialization values were the results obtained with the use of the k-ε phenomenon model. This is the most frequently used module in the modeling of fluid flows in the Ansys environment. We assumed that the deposition of the particles on the surface of the filter was of a gravitational nature, which caused the directing of their acceleration alongside the axis of the support as well as inertia and their interception by the walls. The catalytic bed and washcoat were not simulated because, depending on the temperature, they would cause oxidation of the particles. The results of the input and output data are shown in Table 3, Table 4 and Table 5.
The visualization of the exhaust gas flow through the support has confirmed the assumed concept. The exhaust gas moved between the channels, which, in the case of the flow-through support, results in an increased contact of the particles with the support (Figure 11) and their increased oxidation under real conditions. When it comes to the behavior of the particles in the exhaust gas (Figure 11), we can see their distribution on the outer wall (the right side of the figure) caused by the presence of the deflectors in the support. This denotes fulfilment of the assumed objective. When analyzing the filtration efficiency, the results shown in Table 6 were obtained (Table 6).
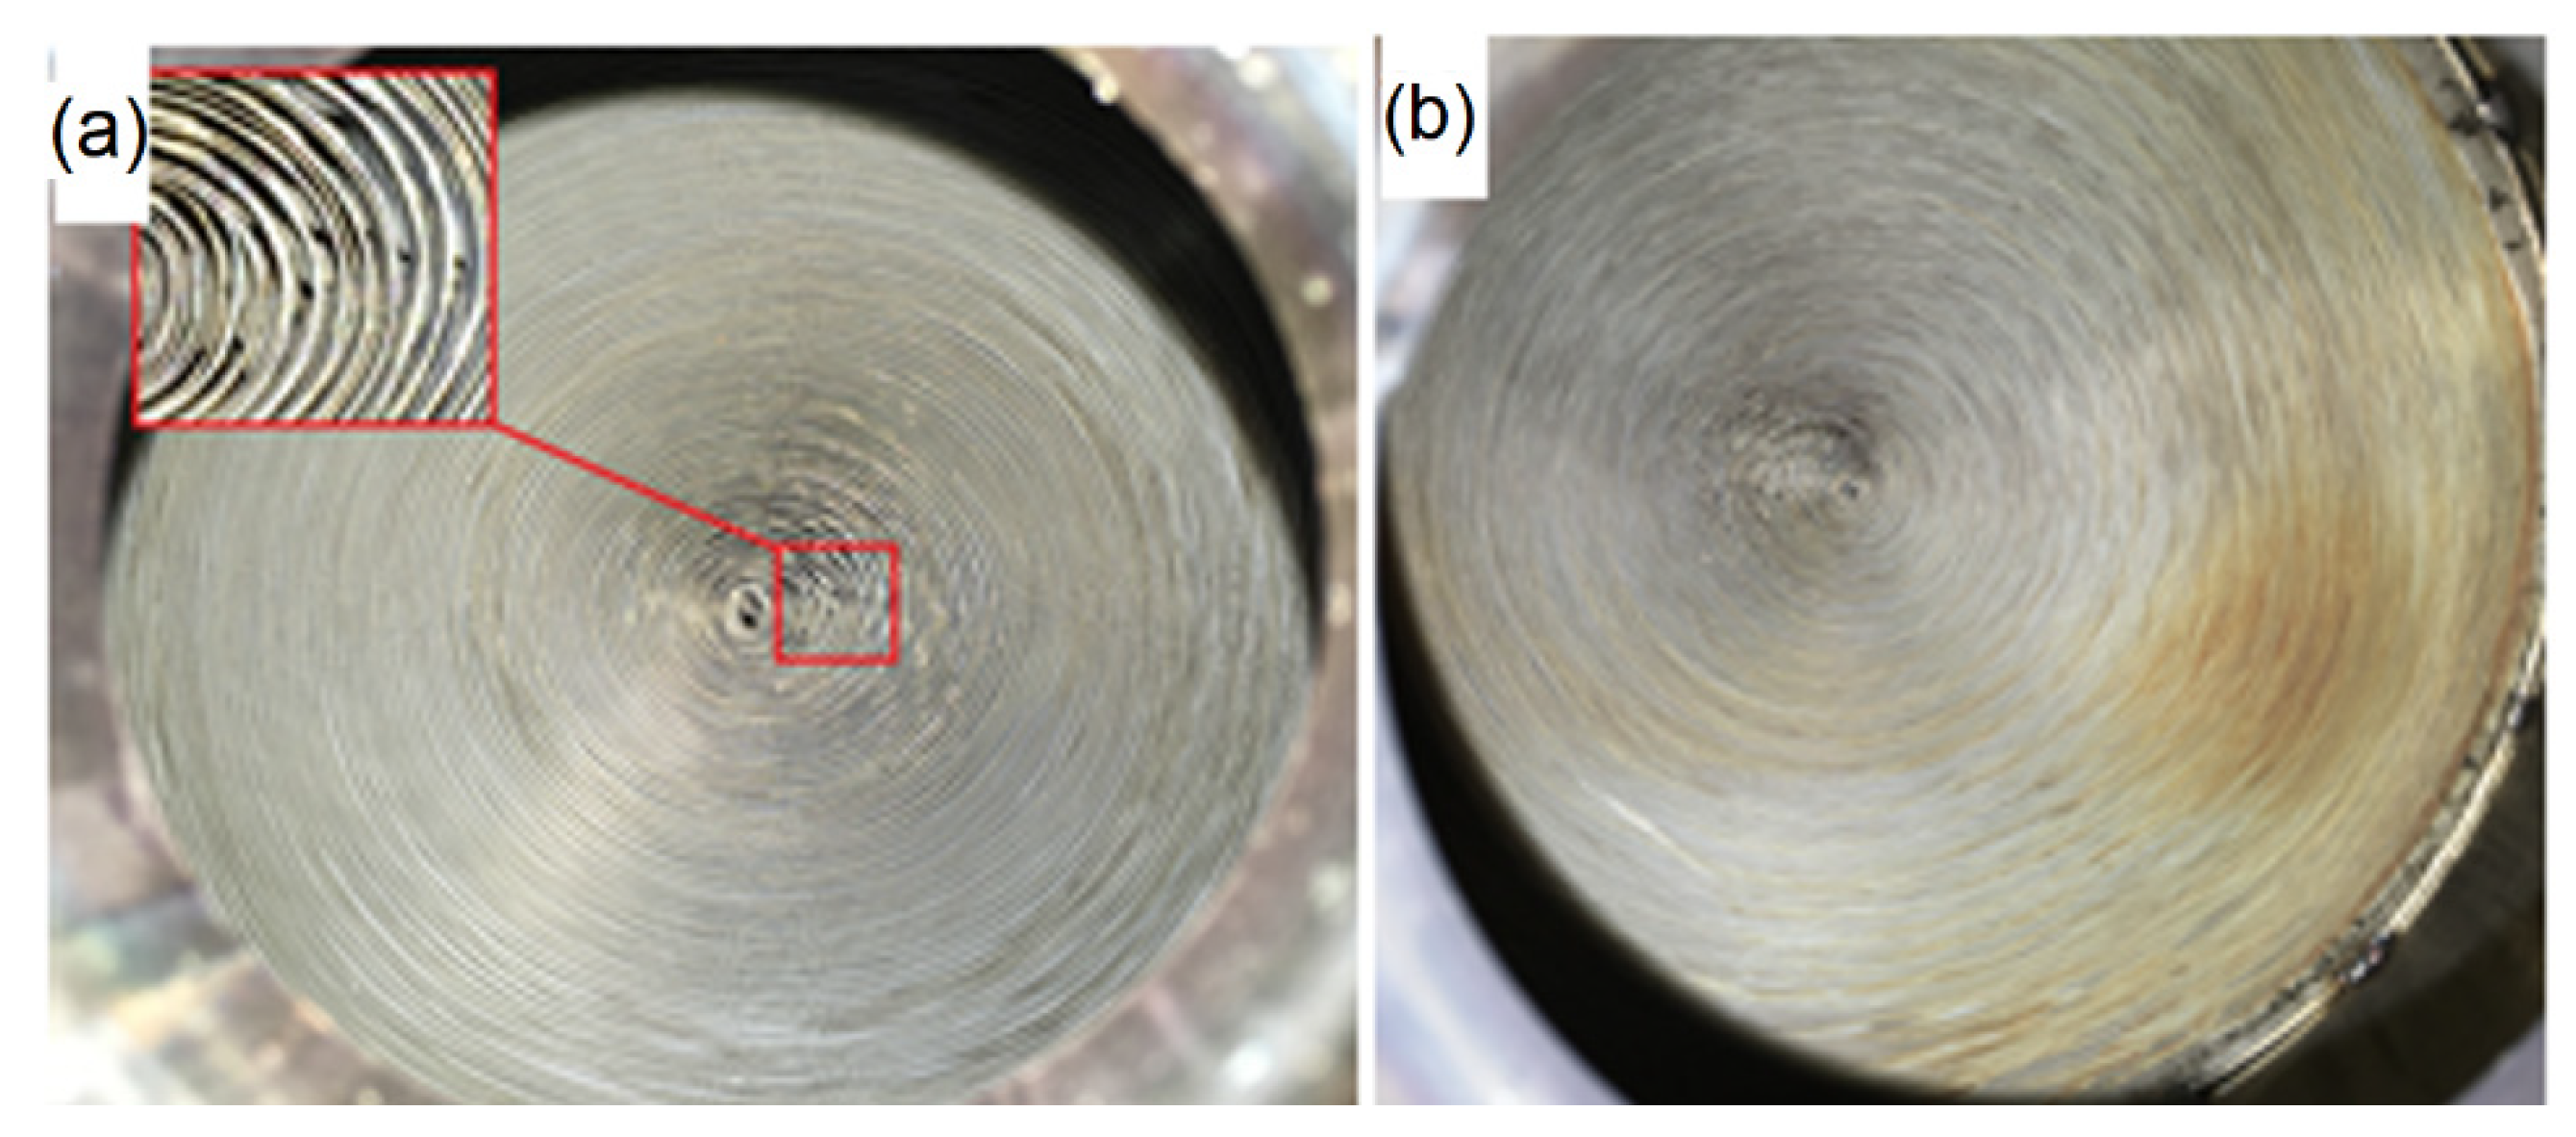
The obtained filtration efficiency is lower compared to the wall-flow types. The developed support is to serve the purpose of retrofitting, whose idea assumes no engine modifications. The application of a ceramic filter could lead to excess resistance at the outlet, and hence impact the combustion process, reduce the efficiency and increase the fuel consumption. The filter was selected based on the engine displacement. The dimensions of the support are shown in Table 7 and the view of its inlet and outlet in Figure 12.

5. Efficiency of the Applied DPF

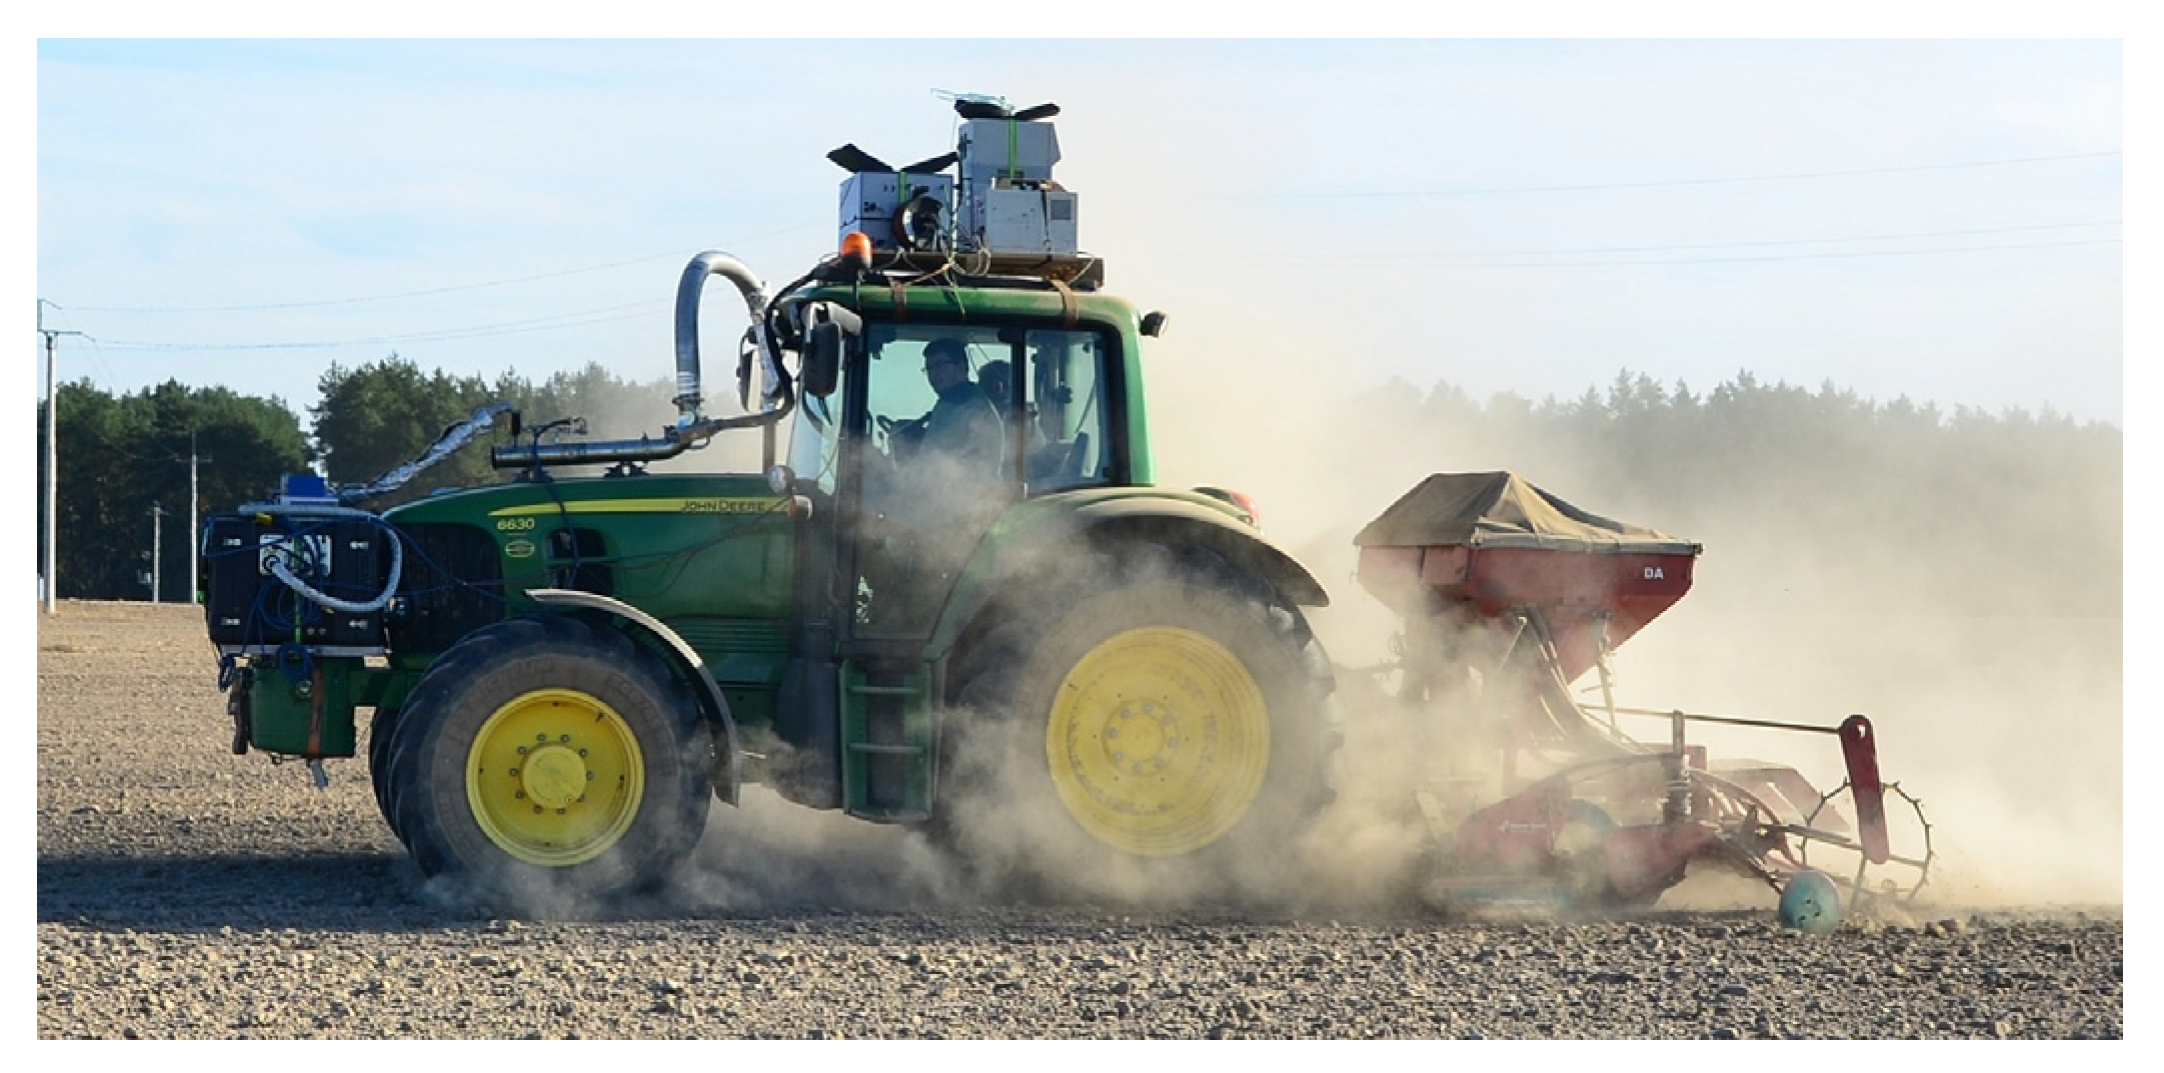
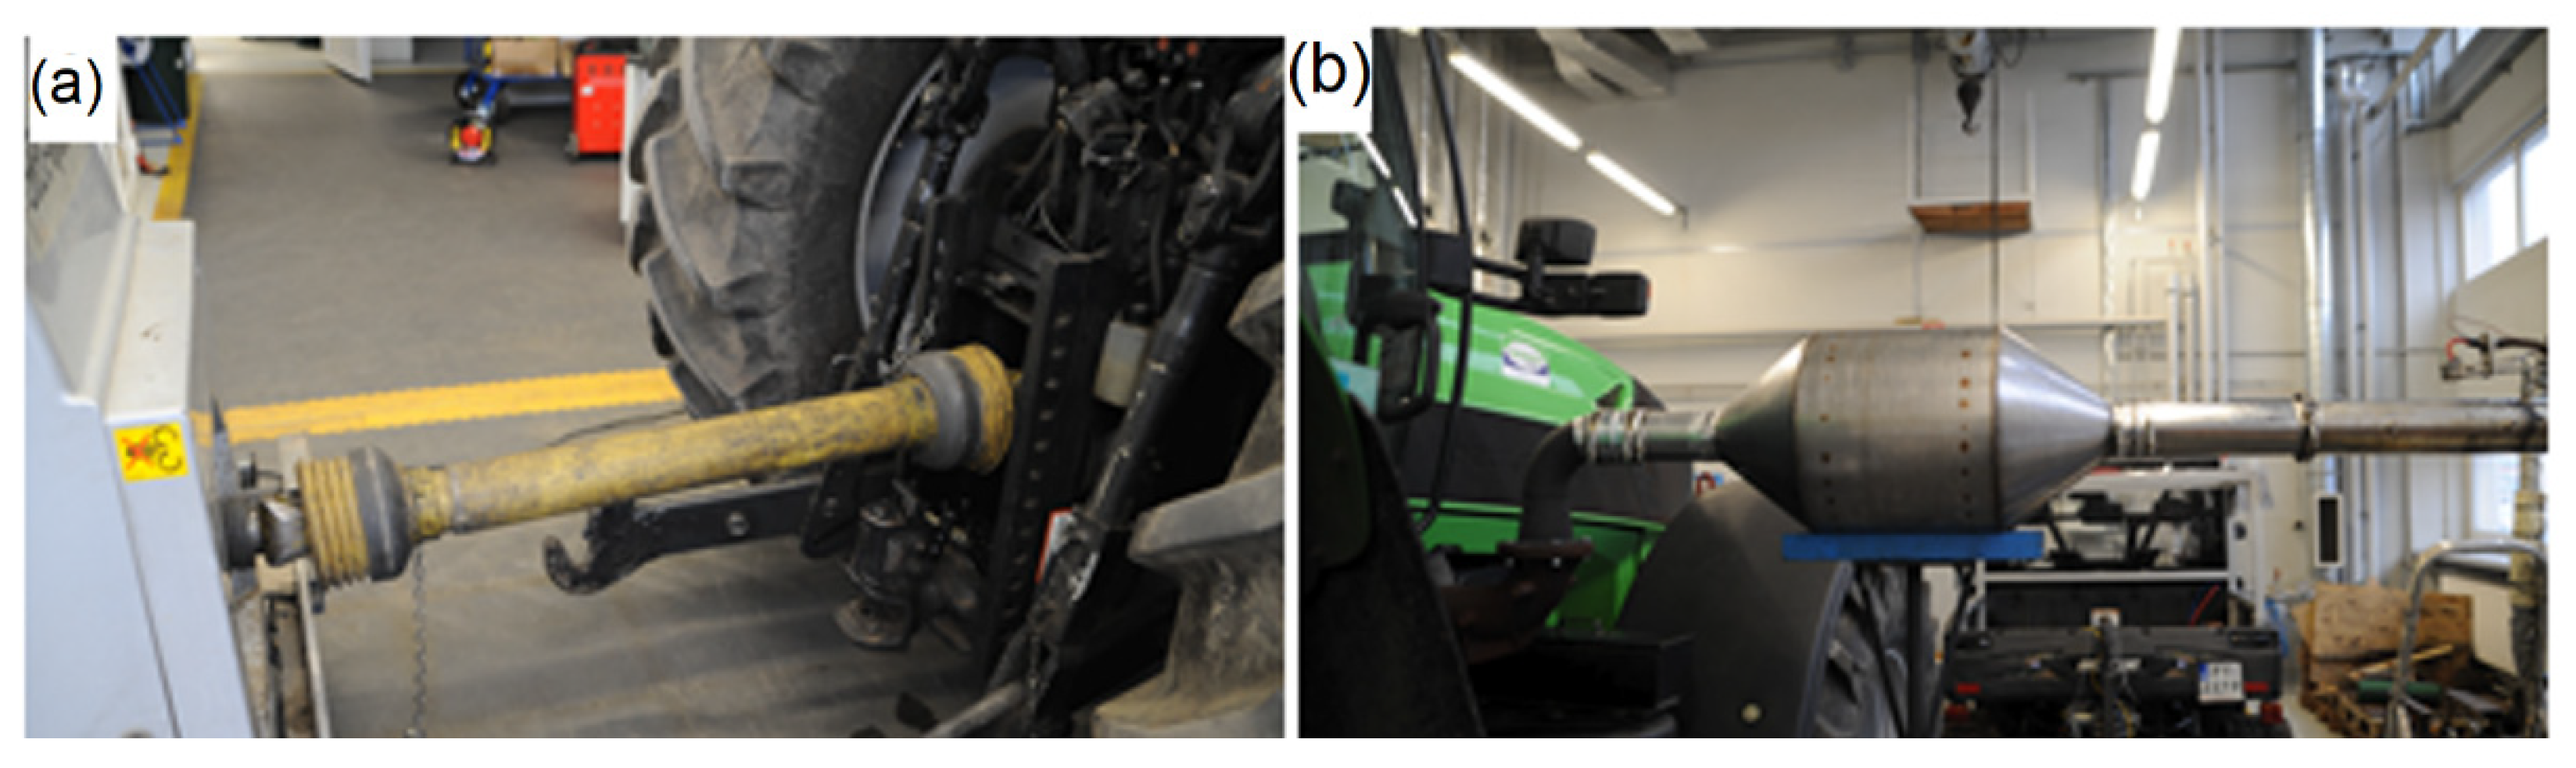
The engine of the research objects did not originally have a factory-fitted DPF aftertreatment system; therefore, they were ideal for the studies of the efficiency of retrofitting. During the validation studies, as the reference values the authors adopted the investigations performed under the same operating points and factory configurations of the powertrains and aftertreatment systems. During the tests, the farm tractor was in the laboratory room and was stationary. It was coupled with the portable generator brake with a PTO shaft (Figure 13a). The studies of the exhaust emissions were carried out with the previously described PEMS equipment. Because it was necessary to maintain a possibly small distance from the exhaust manifold, the investigated filter was installed on a support near the machine (Figure 13b). Prior to the tests, the tractor was inspected for malfunctions and it was in a good technical condition. Despite additional resistance in the exhaust system, the machine did not show any malfunctions or faulty readings from the sensors. The tractor engine was warmed up to the operating temperature. During the tests, the laboratory room was ventilated with ambient air at a temperature of 8 °C. No forced air flow was applied.
For the engine load application, the authors used an PT 301 MES portable brake by Eggers-Dynamometer (Table 8). This is a portable test stand fitted with an air-cooled (forced-cooling) generator. For the tests, the brake software was modified with a gear-reducing ratio (2.1:1) against the engine speed. In this way, the speed transferred by the PTO was equalized with the engine speed. The resistance of the brake was set manually according to the previously calculated points (Table 9). The engine speed was adjusted by the machine operator in the cabin during the tests.
In each of the operating points, the engine operated for approx. 60 s to stabilize the temperature of the exhaust gas and the concentration of the exhaust components. The measure of readiness was the readings of the concentrations of the exhaust components. This methodology was to eliminate possible errors of too quick a switching between the operating points and enable a direct comparison of the results obtained with and without the filter. Upon fitting of the exhaust system and the measurement equipment, the vehicle was checked with diagnostic equipment—no errors were identified. The tests were performed on the same day to eliminate the impact of the ambient temperature.
Similar to the previous chapter, the results were presented as relative emissions where the reference emission level for standard aftertreatment amounted to 100%. The test was prepared twice and the shown result is an average value from each point.
When analyzing the relative emission of CO (Figure 14), for the majority of the NRSC–PUT operating points, the authors observed its reduction to 44%. Only in the operating point characterized by high engine speed and low engine load was a significant increase observed (almost 50%). This was not a gross error. The measurement was repeated, which confirmed the increase in the emission at this point. The collective efficiency of the reduction of the CO emission was 16%.
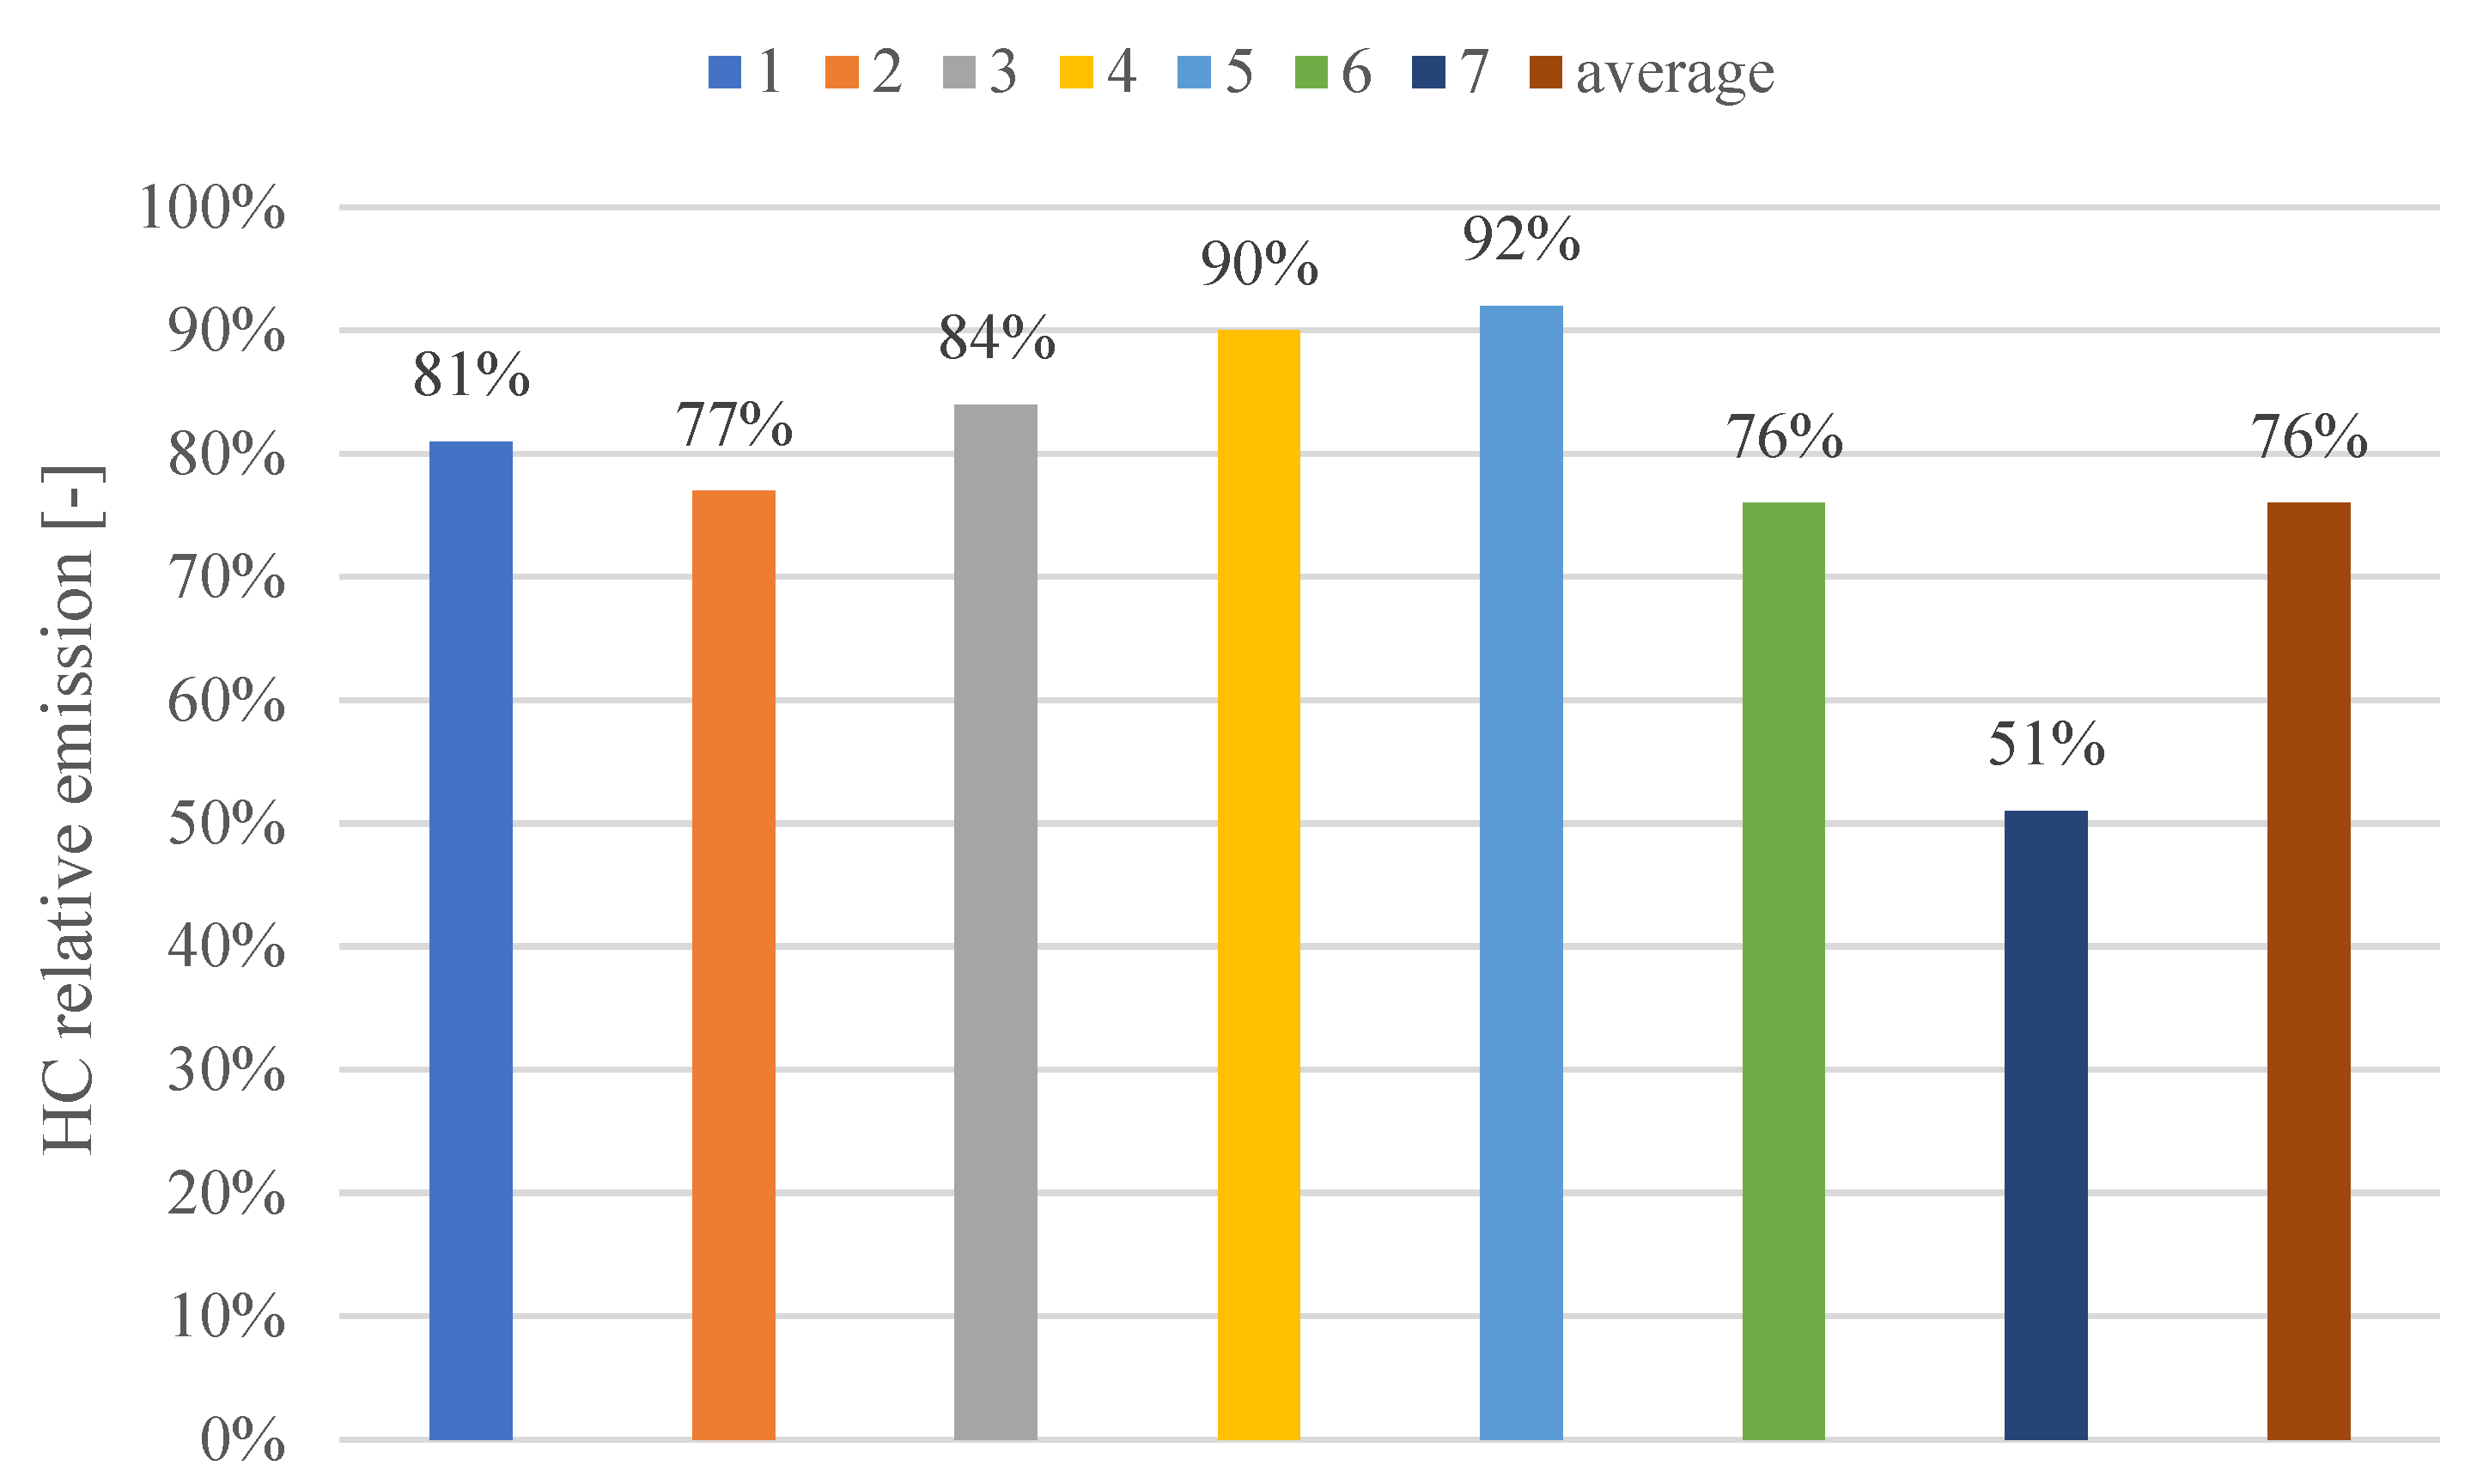
The roots and conditions of oxidation for HC are similar to CO, yet, in the studies, we revealed different trends of the recorded results (Figure 15). At all engine operating points, the investigated filter had a better efficiency than the standard exhaust system. Within the research cycle, a 24% drop in the emission was observed. The obtained trends are similar to those of CO—the oxidizing action of the filter is used here as well [10].
Despite the exclusive application of the oxidizing bed as the catalyst, its impact on the gaseous exhaust components is ambiguous. The collective efficiency of oxidation of CO and HC is relatively small. The purpose of the filter proposed by the authors is to reduce the emission of particulate matter in terms of mass and number.
The specific emission of particulate matter at all the investigated operating points decreased (Figure 16). The efficiency varied from 14% to 62% and was related to the engine operating point. The engine load was proportional to the efficiency of the reduction of the PM emission. The highest value was obtained for the first operating point and the lowest for the seventh (idle). The collective efficiency amounted to 34% and its small value was determined by the operation at idle, where the greatest PM weight share occurred and the efficiency was limited (8–16%). The reduction of the PM emission, even at low engine loads, may be attributed to the increased content of nitrogen oxides (IV) oxidizing the particles at a lower exhaust gas temperature. The increase of nitrogen oxides can be caused by the higher drag of the exhaust gases. Next, we went on to analyze the relative particle number (Figure 17).
Based on the analysis of the results presented in Figure 16 and Figure 17, one may confirm that the particle number PN is dependent on the emission of PM. This is confirmed by the differences in the densities of particulate matter in relation to its aerodynamic diameter. The obtained results are characterized by the same trend as PM, yet the maximum efficiency is greater and amounts to 85% for the first engine operating point. The minimum efficiency, compared to PM, is slightly lower and occurs at the seventh operating point. Its value is 16%. Only for the sixth operating point was the relative reduction of PN lower compared to PM. This proves the reduction of the particles of small diameters. Collectively, the particle number was reduced almost twice.

6. Conclusions

6.1. General Conclusions

  • Retrofitting is an efficient way of reducing exhaust emissions, therefore significantly improves the environmental performance of non-road mobile machinery (NRMM), which was confirmed in the studies described in this paper.
  • In terms of the emission of PM and PN, the efficiency of the operation of the filter designed by the authors and used for retrofitting in NRMMs was confirmed.
  • The exhaust emissions under field conditions and the engine operating points significantly diverged from the NRMM homologation cycles.
  • A review of the literature allows the authors of this paper to state that its topic is convergent with the worldwide trends in this type of research.

6.2. Detailed Conclusions

  • The comparative analysis of the exhaust emissions has shown that for the gaseous exhaust components, a reduction for each operating point (except point 3) reached almost 50%.
  • The obtained reduction of specific exhaust emissions in the tests was 34 and 47% for PM and PN, respectively.
  • Compared to the incurred expenses, the result is very good and may contribute to the reduction of the exhaust emissions from non-road machinery.

6.3. Methodological Conclusions

  • A proprietary method of validation of the efficiency of particulate filters was developed based on the use of the PEMS equipment and signals from the on-board diagnostic systems.

6.4. Prospects

The studies of the authors do not fully exhaust the research problem, which requires further research related to:
  • the analysis of the influence of the integration of DOC + DPF on the efficiency of reduction of the exhaust emissions;
  • the assessment of the influence of the type of catalytic coating of the filter on the reduction of PM, PN and its size distribution;
  • the durability studies of particulate filters designed for retrofitting in non-road machinery and the operation of the developed particulate filter retrofitted in NRMM in the context of reduction of PM and PN;
  • the assessment of the influence of the filter application in the exhaust system on the emission of CO2 (fuel consumption);
  • the efficiency of operation of the filters under actual conditions of operation.

Author Contributions

Conceptualization, M.S. and N.S.; methodology, M.S. and P.F.; validation, M.S. and P.F.; formal analysis, M.S. and N.S.; investigation, B.K.; writing—original draft preparation, M.S. and N.S.; writing—review and editing, M.S. and N.S.; supervision, P.F. and B.K.; funding acquisition, M.S. and P.F. All authors have read and agreed to the published version of the manuscript.

Funding

This research received no external funding.

Data Availability Statement

Not applicable.

Conflicts of Interest

The authors declare no conflict of interest.

References

  1. Karpiuk, W.; Borowczyk, T.; Idzior, M.; Smolec, R. The Evaluation of the impact of Design and Operating Parameters of Common Rail System Fueled by Bio-Fuels on the Emission of Harmful Compounds. In Proceedings of the 2016 International Conference on Sustainable Energy, Xiamen, China, 18–19 December 2016. [Google Scholar]
  2. ACI Europe—Airports Council International. Environmental Strategy Committee Discussion and Assessment of Ultrafine Particles (UFP) in Aviation and at Airports in 2012. 2012. Available online: https://www.cph.dk/48da29/globalassets/8.-om-cph/stoj-trafik-og-miljo/rapporter/7_ultrafine-particles-at-airports-aci.pdf (accessed on 29 July 2022).
  3. Dziubak, T.; Dziubak, S.D. A Study on the Effect of Inlet Air Pollution on the Engine Component Wear and Operation. Energies 2022, 15, 1182. [Google Scholar] [CrossRef]
  4. World Health Organization. World Health Statistics 2016: Monitoring Health for the SDG; World Health Organization: Geneva, Switzerland, 2016. [Google Scholar]
  5. European Commission. Non Road Mobile Machinery Regulation—DG GROW. In Proceedings of the 1st Meeting of the Commission Expert Group on Inland Waterway Transport, Brussels, Belgium, 26 June 2017. [Google Scholar]
  6. European Environment Agency. European Union Emission Inventory Report 1990–2020. EEA Report 2020, 05/2020. Available online: https://www.eea.europa.eu/publications/european-union-emission-inventory-report-1990-2018 (accessed on 29 July 2022).
  7. European Environment Agency. Pollution in Europe Report 2018. EEA Report 2018, 12/2018. Available online: https://www.eea.europa.eu/publications/air-quality-in-europe-2018 (accessed on 29 July 2022).
  8. Dziubak, T. Theoretical and Experimental Studies of Uneven Dust Suction from a Multi-Cyclone Settling Tank in a Two-Stage Air Filter. Energies 2021, 14, 8396. [Google Scholar] [CrossRef]
  9. badwaterjournal.com. Available online: https://badwaterjournal.com/BadWaterJournal/Transportation-policy.html (accessed on 27 July 2022).
  10. Merkisz, J.; Pielecha, J. Emisja Cząstek Stałych ze Źródeł Motoryzacyjnych; Wydawnictwo Politechniki Poznańskiej: Poznań, Poland, 2014. [Google Scholar]
  11. Chlebnikovas, A.; Kilikevičius, A.; Selech, J.; Matijošius, J.; Kilikevičienė, K.; Vainorius, D.; Passerini, G.; Marcinkiewicz, J. The Numerical Modeling of Gas Movement in a Single Inlet New Generation Multi-Channel Cyclone Separator. Energies 2021, 14, 8092. [Google Scholar] [CrossRef]
  12. gios.gov.pl. Available online: https://www.gios.gov.pl/images/dokumenty/pms/raporty/Stan_srodowiska_w_Polsce-Raport_2018.pdf (accessed on 27 July 2022).
  13. Reitz, R.D.; Ogawa, H.; Payri, R.; Fansler, T.; Kokjohn, S.; Moriyoshi, Y.; Agarwal, A.K.; Arcoumanis, D.; Assanis, D.; Bae, C.; et al. The future of the internal combustion engine. Int. J. Engine Res. 2020, 21, 3–10. [Google Scholar] [CrossRef] [Green Version]
  14. cat.com. Available online: https://www.cat.com/en_GB/by-industry/electric-power/Articles/White-papers/emission-standards-managing-the-challenging-transition-from-eu-stage-iiia-to-eu-stage-v-in-europe.html (accessed on 29 July 2022).
  15. Poulsen, T. Market analysis for non-road mobile machinery sector. In Report from Scandinavian GPP Alliance; Scandinavian GPP Alliance: Copenhagen, Denmark, 2017. [Google Scholar]
  16. NSW Environmental Protection Authority. Reducing Emissions from Non Road Diesel Engines; NSW Environmental Protection Authority: Sydney, Australia, 2014.
  17. Kasprak, A.; Schattanek, G.; Kenny, J. Massachusetts Department of Transportation Diesel Retrofit Program for Nonroad Construction Equipment. Presented at the 91st Annual Meeting the Transportation Diesel Retrofit Program for Non-Road Construction Equpiment, January 2012. Available online: https://trid.trb.org/view/1129418 (accessed on 29 July 2022).
  18. Vlachos, T.G.; Bonnel, P.; Perujo, A.; Weiss, M.; Villafuerte, P.M.; Riccobono, F. In-use emissions testing with portable emissions measurement systems (PEMS) in the current and future European vehicle emissions legislation: Overview, underlying principles and expected benefits. SAE Int. J. Commer. Veh. 2014, 7, 199–215. [Google Scholar] [CrossRef]
  19. bestsupportunderground.com. Available online: https://bestsupportunderground.com/non-road-engineemissions-standards/?lang=en (accessed on 29 July 2022).
  20. Merkisz, J.; Siedlecki, M. Specific emissions analysis for a combustion engine in dynamometer operation in relation to the thermal state of the exhaust gas aftertreatment systems in a modified NRSC test. In MATEC Web of Conferences, VII International Congress on Combustion Engines, Poznan, Poland, 27–29 June 2017; EDP Sciences: Les Ulis, France, 2017; Volume 118, p. 00027. [Google Scholar]
  21. Deere, J. 3060 Series Premium Tractors—Sales Manual 2007.
  22. Yuan, Q. Real world duty cycle development method for non-road mobile machinery (NRMM). SAE Int. J. Commer. Veh. 2016, 9, 306–313. [Google Scholar] [CrossRef]
  23. Merkisz, J.; Mizera, J.; Bajerlein, M.; Rymaniak, L.; Maj, P. The Influence of Laser Treatment and the Application of Reduced Pressure Force Piston Rings on the Engine Exhaust Emissions under the Conditions of Engine Lubrication with Different Engine Oils. Appl. Mech. Mater. 2014, 518, 102–107. [Google Scholar] [CrossRef]
  24. Rymaniak, L.; Ziolkowski, A.; Gallas, D. Particle number and particulate mass emissions of heavy duty vehicles in real operating conditions. In MATEC Web of Conferences, VII International Congress on Combustion Engines, Poznan, Poland, 27–29 June 2017; EDP Sciences: Les Ulis, France, 2017; Volume 118. [Google Scholar]
  25. Szymlet, N.; Lijewski, P.; Sokolnicka, B.; Siedlecki, M.; Domowicz, A. Analysis of research method, results and regulations regarding the exhaust emissions from two-wheeled vehicles under actual operating conditions. J. Ecol. Eng. 2020, 21, 128–139. [Google Scholar] [CrossRef]
  26. Lijewski, P.; Merkisz, J.; Fuc, P.; Kozak, M.; Rymaniak, L. Air pollution by the exhaust emissions from construction machinery under actual operating conditions. Appl. Mech. Mater. 2013, 390, 313–319. [Google Scholar] [CrossRef]
  27. Merkisz, J.; Lijewski, P.; Fuc, P.; Siedlecki, M.; Weymann, S. The use of the PEMS equipment for the assessment of farm fieldwork energy consumption. Appl. Eng. Agric. 2015, 31, 875–879. [Google Scholar]
  28. Bielaczyc, P.; Kozak, M.; Merkisz, J. Effects of Fuel Properties on Exhaust Emissions from the Latest Light-Duty DI Diesel Engine. SAE Technical Paper 2003, 2003-01-1882. Available online: https://www.sae.org/publications/technical-papers/content/2003-01-1882/ (accessed on 29 July 2022).
  29. avl.com. Available online: https://www.avl.com/-/mssplus-avl-micro-soot-sensor (accessed on 11 July 2022).
  30. tsi.com. Available online: https://tsi.com/products/particle-sizers/fast-particle-sizer-spectrometers/engine-exhaust-particle-sizer-%28eeps%29-3090/ (accessed on 28 July 2022).
  31. European Union. Regulation (EU) 2016/1628 of the European Parliament and of the Council of 14 September 2016; European Union: Maastricht, The Netherlands, 2016. [Google Scholar]
  32. Karpiuk, W.; Smolec, R.; Idzior, M. DME use in self-ignition engines equipped with common rail injection systems. In Proceedings of the International Conference on Sustainable Energy, Environment and Information Engineering, Xiamen, China, 18–19 December 2016; pp. 37–43. [Google Scholar]
Figure 1. PM size visualization: (a) compared to a human hair, (b) comparison of PM10, PM2.5 and the smallest PM [9].
Energies 15 07963 g001
Figure 2. Map of applicable laws for the non-road group depending on the country in 2020 [19].
Energies 15 07963 g002
Figure 3. Machine during the tests.
Energies 15 07963 g003
Figure 4. SEMTECH DS analyzer: (a) overview, (b) schematics of operation.
Energies 15 07963 g004
Figure 5. AVL MSS analyzer: (a) overview, (b) schematics of operation [29].
Energies 15 07963 g005
Figure 6. EEPS TSI 3090 analyzer: (a) overview, (b) schematics of operation [30].
Energies 15 07963 g006
Figure 7. Relative emission of CO and THC during tests under actual operating conditions, referring to the limits of the homologation standards.
Energies 15 07963 g007
Figure 8. Relative emission of PM under actual operation, referring to the limit.
Energies 15 07963 g008
Figure 9. Relative PN obtained under actual operation.
Energies 15 07963 g009
Figure 10. Transverse dimensions of the geometry of the designed filter: l: length of the entire filter, a: length of the sheet metal from the inlet to the first perforation, b: length of the perforation, c: distance between perforations, d: linear length of the perforation, α: bend angle of the perforation, e: distance between two perforations on the two sides of the channel, f: height of the channel, g: height of the porous layer.
Energies 15 07963 g010
Figure 11. Visualization of the distribution of gas velocities and concentration of particulate matter within the simulation.
Energies 15 07963 g011
Figure 12. Inner structure used in the filter supports: (a) inlet, (b) outlet.
Energies 15 07963 g012
Figure 13. View of: (a) the coupling of the tractor with the brake during the tests, (b) the investigated filter.
Energies 15 07963 g013
Figure 14. Relative specific emission of CO depending on the operating point.
Energies 15 07963 g014
Figure 15. Relative specific emission of HC depending on the operating point.
Energies 15 07963 g015
Figure 16. Relative specific emission of PM depending on the operating point.
Energies 15 07963 g016
Figure 17. Relative specific emission of PN depending on the operating point.
Energies 15 07963 g017
Table 1. Technical specifications of the investigated machinery [21].
ParameterFarm Tractor
Displacement [dm3]6.8
Cylinder number and configuration [–]6, in-line
Maximum power output [kW]130 @2100 rpm
Maximum torque [Nm]840 @1600 rpm
AftertreatmentDOC
Homologation standardStage IIIA
Table 2. Dimensions and basic properties of the geometries of the models.
Model DescriptionNumber of Nodes/ElementsDimensions [mm]Angle [°]Mesh Quality
abcdeα
Symmetrical half of the filter, constant height, outward direction of the flow, interchanging channels65,289/
64,910
105261.928210.79
Table 3. Exhaust gas composition used in the simulation.
Component/ParameterValueUnit
Methane0.00042Volumetric share
Carbon monoxide0.00094
Carbon dioxide0.052
Nitrogen0.580
Oxygen0.123
NOx0.00066
Water0.242
Methane0.00025Mass share
Carbon monoxide0.00098
Carbon dioxide0.0847
Nitrogen0.605
Oxygen0.146
NOx0.00073
Water0.162
Particulate matter155mg/m3
Calorific value0.036MJ/Nm3
0.03MJ/Nm
Density1.2kg/Nm3
Table 4. Thermal and physics parameters of the exhaust gas.
ParameterValue
Inflow velocity on the filtering channels [m/s]2.4
Outflow velocity from the exhaust channel [m/s]38.4
Filter outer diameter [mm]320
Exhaust channel diameter [mm]80
Temperature [K]568.55
Pressure [Pa]100,000
Flowrate under operation [m3/s]0.242
Flowrate at normal conditions [Nm3/s]0.1931
Gas density [kg/m3]0.0928
Carbon dioxide0.476
Total mass flow [kg/s]0.092
Table 5. Flow parameters of the exhaust gas.
ParameterValue
Dynamic viscosity [kg/m/s]1.79 × 10−5
Exhaust gas density [kg/m3]0.477
Sphericality [–]0.8
Share of liquid [mm]0.5
Size of the porous spaces [mm]1
Thickness of the porous layer [mm]10
Coefficient of viscous resistance (Rv) [1/m2]4.69 × 108
Coefficient of inner resistance (Ri) [1/m]1.75 × 104
Table 6. Input parameters and results for selected cases.
Share of LiquidRv [1/m2]Ri [1/m]Pressure Loss [P]DPM
TrappedUntrappedFiltration Efficiency [%]
0.54.68 × 1081.75 × 104100971241987
Table 7. Basic data of the DPF.
Diameter [mm]Total Length [mm]Length of the Support [mm]Inlet Diameter [mm]Support Volume [dm3]
300720304802.5
Table 8. Parameters of used dyno.
ParameterValue
Maximum instantaneous power takeoff [kW]600
Brake systemgenerator
CoolantAir
Maximum engine speed [rpm]3600
Maximum torque [Nm]7200
Direction of rotationany
Table 9. Operating points of the engines of the two machines determined according to NRSC–PUT.
Operating Point1234567
Engine Speed [rpm]141014101410211521152115850
Engine Torque [Nm]8786333906724622520
Publisher’s Note: MDPI stays neutral with regard to jurisdictional claims in published maps and institutional affiliations.

