1. Introduction
Direct measurements of salt-dust emissions to the atmosphere and their variability over time are rare but necessary to attempt to explain their environmental impact. Based on the long-term research conducted, the results can be used to develop models determining the variability of transport routes and the amount of the emissions from the dust source area based on environmental conditions [
1]. Various properties, different from other dusts, make it difficult to classify the salt dust into the appropriate group of industrial dusts. The positive inhalation properties and medical effects of sodium chloride (NaCl) are well known and proven by providing tourists and patients with routes and chambers in underground salt mines [
2]. In this type of research, the authors focus on the assessment of mass concentration and determination of the chemical composition of particulate matter (PM), mainly in terms of their possible relationship with the therapeutic effect of underground air in a mine [
3]. The hygroscopic behavior of salt as a function of relative humidity (RH), taking into account the thermodynamic model, is of significance [
4]. Among the various studies, attempts are made to find the correlation between the deposition rate of solid particles and the parameters of the aerosol [
5,
6,
7]. This dependence can be used to parameterize mathematical models of air–dust mixture flow in mine ventilation networks [
8]. The exploitation of rock-salt deposits is carried out by underground or borehole method from the surface. The underground method of extracting rock salt is carried out in a dry way by mechanical mining or with the use of explosives [
9]. Such a system is known as a “dry” underground mining method. In the case of a lower NaCl content in the rock-salt deposit, underground mining can be carried out using the “wet” system by mining the salt solids with water and producing evaporated salt from the obtained brine [
10]. This type of salt extraction system has been designed in the Wieliczka Salt Mine, which obtains brine solutions as a result of drainage of mining excavations. These activities are necessary to ensure the safe functioning of the mining plant employees as well as people traveling along the mine’s tourist routes [
11]. An analysis of the world literature about salt dust showed that the conducted research concerns mainly the influence of salt on the pollution of lakes, rivers, seas and soils [
12,
13,
14]. The long-term effects of improper mining activities often caused degradation of the natural environment [
15,
16,
17]. Only a few researchers try to determine the factors influencing soil erosion and its impact on dust formation around mining enterprises [
18,
19]. Currently, there is no mining in the Wieliczka Salt Mine, and its main activity is to provide tourists with tourist routes with numerous chambers. The work of miners in a mining plant is to control and maintain the mine’s workings and to control water leaks, which in the case of salt pose a catastrophic threat to the existence of the mine. The water is constantly pumped out and discharged to the water tanks on the eighth level. Then, the brine is pumped to the surface where the brewing process takes place in the Saline Water Treatment Plant. As a result of this process, salt is produced in the amount of approx. 20 thousand tons annually, the production of which is beneficial for the whole of Poland, especially for the Krakow region. Considering the very limited amount of information on the emission of salt dust, the article presents the results of tests of the efficiency of the installation in the saltwork in the Wieliczka Salt Mine in the years 2004–2021. On the basis of industrial research, it was found that the proposed measurement method with the use of the AS-50 gravimetric dust meter as well as the selection of filters to work with the selector constitute an original research methodology adapted to salt dust. The main aim of the research was to determine the efficiency of the applied installation. On the other hand, the secondary goal was to design a measuring probe and carry out measurements for such a designed installation. The tested installation was specially designed individually and does not allow for reliable measurements using traditional methods and devices. Therefore, one of the goals presented was to design and manufacture a measuring probe.
2. Methodology of Air Dustiness Tests
Dust measurement has a large number of different types of dust meters, working on the basis of using different physical properties of solid particles. Classic air pollution analysis consists of three stages: collecting a pollutant sample at the test stand; quantitative analysis of the collected pollutant sample; converting analysis results into the required concentration units. Sampling methods with the use of gravimetric, conimetric or optical dust meters are most often used to determine the value of dust pollutants in mining. In Polish mines, gravimetric dust meters “Barbara-3a” (Central Mining Institute, Katowice, Poland) and Aspirator Stationary type 50 (AS-50) (Cooperative Two-Met, Zgierz, Poland) are commonly used, as well as individual PM10 (particulate matter meter for airborne particles with a diameter of less than 10 μm), P25 (particulate matter meter for airborne particles with a diameter of less than 25 μm) and PO-01 (personal dust meter series number 01), which operate on the basis of aspiration pollutant collection methods. Moreover, the AS-50 aspirator used in the research, due to the way it works, is classified as a direct operating gravimetric dust meter. The sampling principle is based on filtration using measuring filters. The methodology of measuring dust emissions in the saltworks of the “Wieliczka” salt mine was developed by AGH (University of Science and Technology) employees on the basis of applicable standards and measurement procedures [
20,
21,
22,
23]. Due to the need to obtain large flows of sucked air, an aspirator powered from a 230 V network, type AS-50, manufactured by TWO-MET in Zgierz, was used for measurements (
Figure 1a). The technical and operational parameters of the AS-50 aspirator are presented in
Table 1. A RADWAG XA 82/220/2X laboratory balance was used to measure the mass of salt dust retained on the measuring filter. To calculate the air-flow velocity in the scrubber installation (salt scrubber), a Pitot–Prandtl tube was used, and the dynamic pressure was read using a liquid U-tube manometer filled with distilled water (
Figure 1b). Temperature measurements were carried out with the EMT-02 temperature meter with a TP01 sensor, manufactured by ELMECH, with a range from −100 to +500 °C.
Dust emission to the atmosphere was determined on the basis of Formulas (1)–(8). The mass of the collected salt dust on the filters for individual measurement series is determined according to Equation (1):
where:
Δmi—weight gain on the filter (g).
mfci—filter mass before measurement (g).
mfzi—filter weight after measurement, (g).
The volume of gas taken by the gravimetric dust meter is calculated according to Equation (2):
where:
Vi—gas volume taken (m3).
qs—flow rate of the gas recorded on the instrument (L/min).
ti—sample measurement time (min).
The mass concentration of dust was determined according to Equation (3):
The air-flow velocity was calculated according to Equation (4):
where:
ωg—air-flow velocity (m/s).
Pd—dynamic pressure (Pa).
ρp—air density (kg/m3).
In the tests, the total and static pressure were determined using a Pitot–Prandtl tube. Based on the readings of these pressures, the dynamic pressure was determined.
The air density is read from the tables on the basis of measurements of the temperature of the properties of moist air saturated in the duct [
24]. The air volume flow (output) was calculated according to Equation (5):
where:
Qg—gas volume flow (output) (m3/h).
Fe—emitter cross-sectional area (m2).
The total efficiency of the dedusting devices is determined from the mass flow rate of dust in the pipe upstream and downstream of the device, according to Equation (6):
where:
η—efficiency of the installation (%).
Z1—dust concentration in front of the dust collector (g/m3).
Z2—dust concentration behind the dust collector (g/m3).
The amount of salt-dust emissions to the atmosphere is calculated according to Equation (7):
where:
E—salt-dust emission (g/h).
Based on the statistical analysis, it was assumed that the distribution of dust in air with salt dust was log-normal. The cumulative distribution function of this distribution is determined by Equation (8):
where:
logZ—logarithm of the dust value.
lgZn—arithmetic mean value from the logarithm of the dustiness value in a given population.
σ1—standard deviation of the dust logarithm value.
The cumulative distribution function F(Z) determines the probability that the dustiness in the tested sample will be less than Z. The cumulative distribution value is also treated as the time interval in which the dustiness is lower than Z.
3. Industrial Tests
The salt-dust emission to the atmosphere was tested in the saltwork in the Wieliczka Salt Mine. The layout of the dust concentration measurement points is shown in
Figure 2. Measurements of the tested parameters were carried out in two places. The measuring point P1 is located upstream of the scrubber inlet where the salt brewing process takes place (
Figure 3a). At this point, the gas flow velocity was on average approx. 20 m/s. The emitter cross-sectional area is 0.1018 m
2, which results in a gas volume flow of approximately 7300 m
3/h. Moreover, the measured brine temperature was in the range of 68–75 °C. Measurement point P2 is in the gas scrubber line (
Figure 3b). The dust air-flow velocity was on average about 35 m/s, and the temperature was in the range of 30–34 °C. Production in the saltworks is carried out in a three-shift system, and each shift lasts 8 h. Due to the significant reduction in the production of salt assortments, the production equipment and dedusting systems operate continuously for an average of 10–12 days. After this period, there is a technical break until the assortment of salt is replenished. Currently, salt emission tests from the saltwork are carried out once a year in the fall and winter periods (November/December) and result directly from the desalination plant’s work schedule. The air scrubber is used to clean the exhaust air from the salt dryer contaminated with salt dust. It is equipped with an external recirculation system with pumps. The rinsing liquid is condensate. Prior to startup of the scrubber, the position of the valves in the circulation piping system is checked. Before first use, remove the spray nozzle and thoroughly flush all water lines for 20 min at full pressure. Then, all filters installed in the piping system are cleaned. After 48 h of continuous operation, adjust all bolts on the flanges. Subsequent adjustments are made after a continuous two weeks of work. The mass flow and the condition of the liquid level are checked as part of the daily check. However, for the weekly check, the pump supply, water supply line, gas inlet, valves and fresh water supply are checked. The operation check of the scrubber can be carried out through the viewing holes with transparent surfaces. After a short start-up time of the water circuit—the time needed to fill the piping system—the scrubber is ready for operation. The filled scrubber reservoir serves as a water reservoir for the circulation pump, ensuring minimal NaCl emissions. During operation, the functioning of the high-level switch and keeping the overflow clean are checked. In addition, the concentration of NaCl in the circuit is checked periodically, and the fresh water supply is adjusted if necessary [
25].
In the standard measuring system, the gravimetric dust meter is equipped with a cyclone, the essential elements of which are a filter and a tank. This structure of the cyclone allows the measurement of the respirable fraction precipitated on the filter and the remaining dust fraction deposited in the tank. In the case of industrial dusts, the obtained dustiness results are compared with the maximum permissible concentrations (NDS), which are used to determine the actual exposure of workers to dust hazard. In order to collect samples from the desalination plant at Wieliczka Salt Mine, AGH (University of Science and Technology) employees designed and manufactured a measuring probe with a salt-dust sampling selector (
Figure 4a). Replacing the cyclone with a measuring probe resulted from the need to adjust the possibility of carrying out measurements, taking into account the nature of the installation structure. Dusty air, sucked in at the measurement site by the AS-50 aspirator, passes through the basic selector with a bag filter where the salt-dust fraction is deposited. Due to the high flow rate of dust-laden air, it was calculated that the constant flow rate in the aspirator was 50 l/min. For such high expenditure values, only a few dust meters can meet the assumed criteria; therefore, it was decided to use the AS-50 dust meter. The sampling time is constant and is 15 min. The weight of the dust deposited on the filter is determined as the weight increase of the filter weighed in the laboratory before and after sampling (
Figure 4b). The applied bag filters were characterized by the high efficiency of retaining salt-dust grains and low air-flow resistance. The authors’ research and analyses allowed us to conclude that for the designed measurement methodology, these will be propylene non-woven filters characterized by high chemical resistance to salt action and good medium permeability [
26].
The saltwork in the Wieliczka Salt Mine was launched in 2003. The process of obtaining salt, which is a by-product, takes place as a result of desalination of water obtained from brine pumped out from underground workings. The water under very low pressure is heated and evaporates to leave pure evaporated salt. Measurements of salt-dust emissions discharged into the atmosphere have been carried out periodically, once a year by AGH (University of Science and Technology) employees since 2004. The average working time in the saltwork per month is from 10 to 12 days, because this is the amount of brine obtained from the drainage of workings, which is used as a contribution to the desalination installation. The research methodology includes six measurements of salt-dust mass increments on filters, including three before the inlet to the desalination installation and three at the outlet of the emitter. In order to reduce errors resulting from the diversity of concentrations in the mixture of dosed brine, three series of measurements are carried out each time. The results of the measurements from the last survey conducted in November 2021 are presented in
Table 2.
4. Discussion
Various dust control methods are frequently used in coal mines, among which the use of wet scrubbers has proven to be an effective technology to remove dust from air streams, rather than diluting or retaining dust [
27]. The capture of airborne respirable coal dust by spraying water or wet scrubbers has been studied and developed over many decades as an engineering control to reduce dust exposure in coal mines and combat the pneumoconiosis of coal workers [
28].
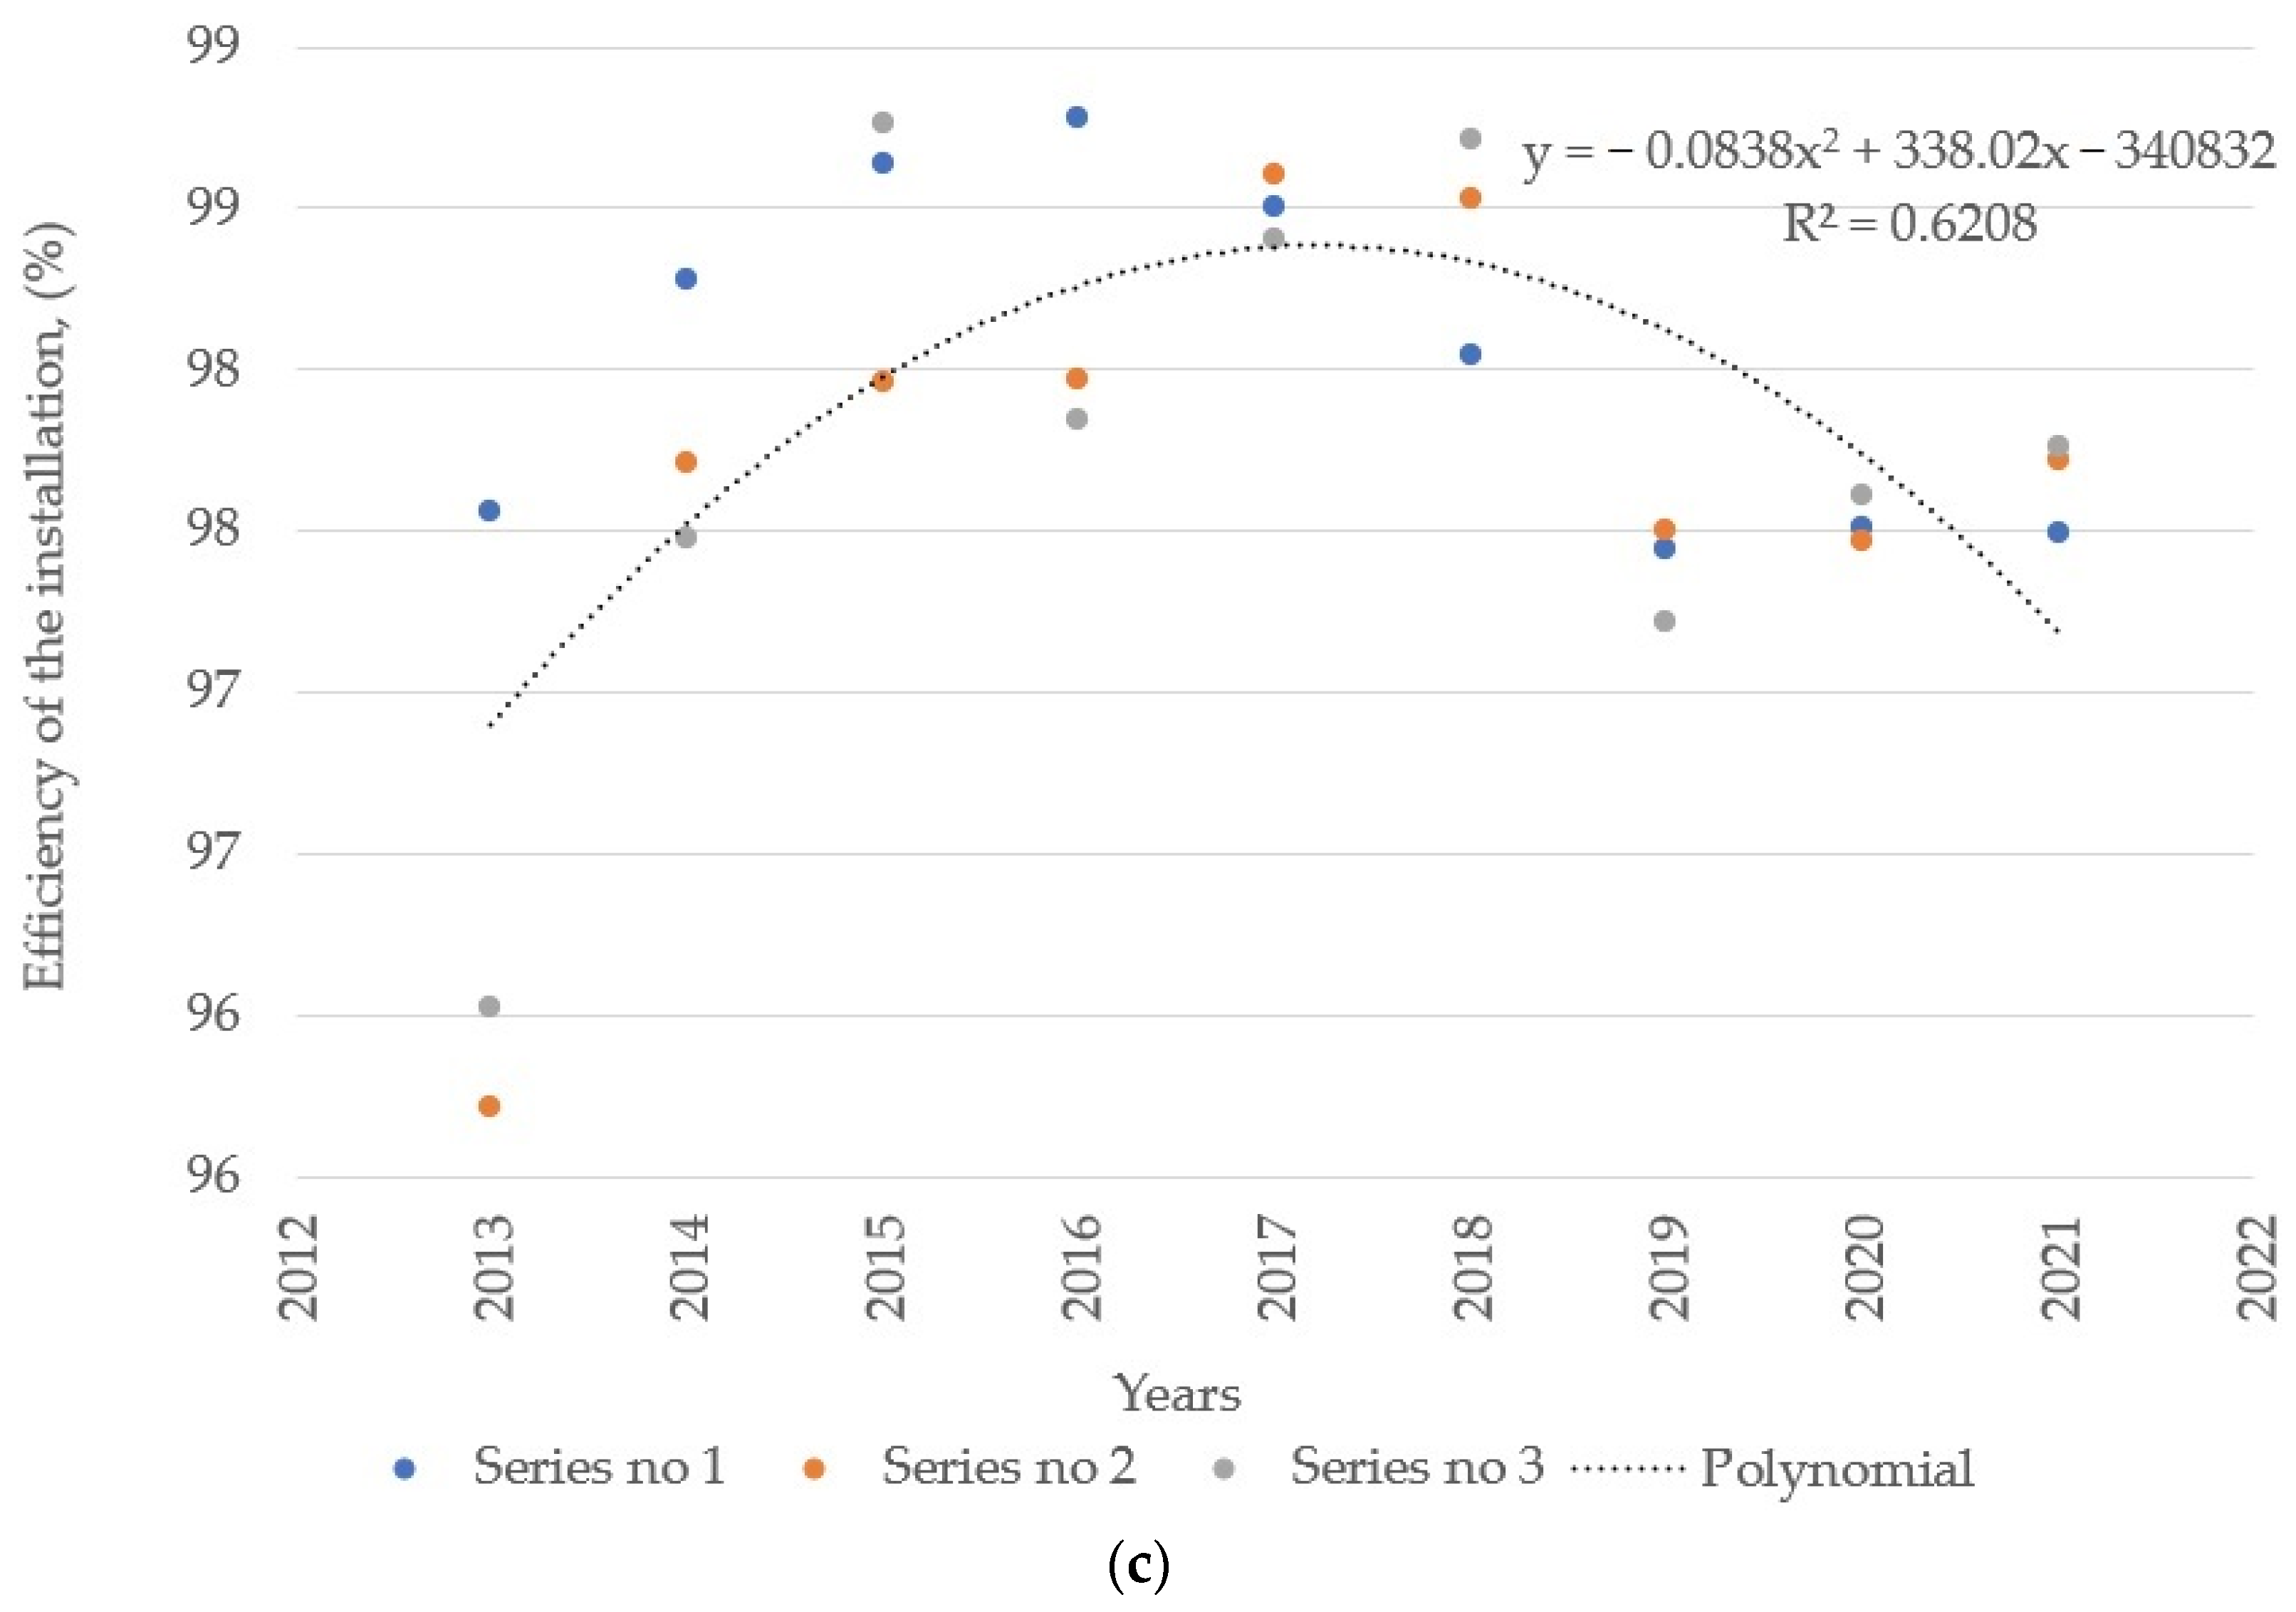
On the basis of annual tests in the saltwork in the Wieliczka Salt Mine, a list of changes in the operation of the desalination installation was made. In the analyzed period, the efficiency of the dedusting installation was in the range of 90.50–98.78%. The lowest value was recorded in 2009 and the highest in 2016 (
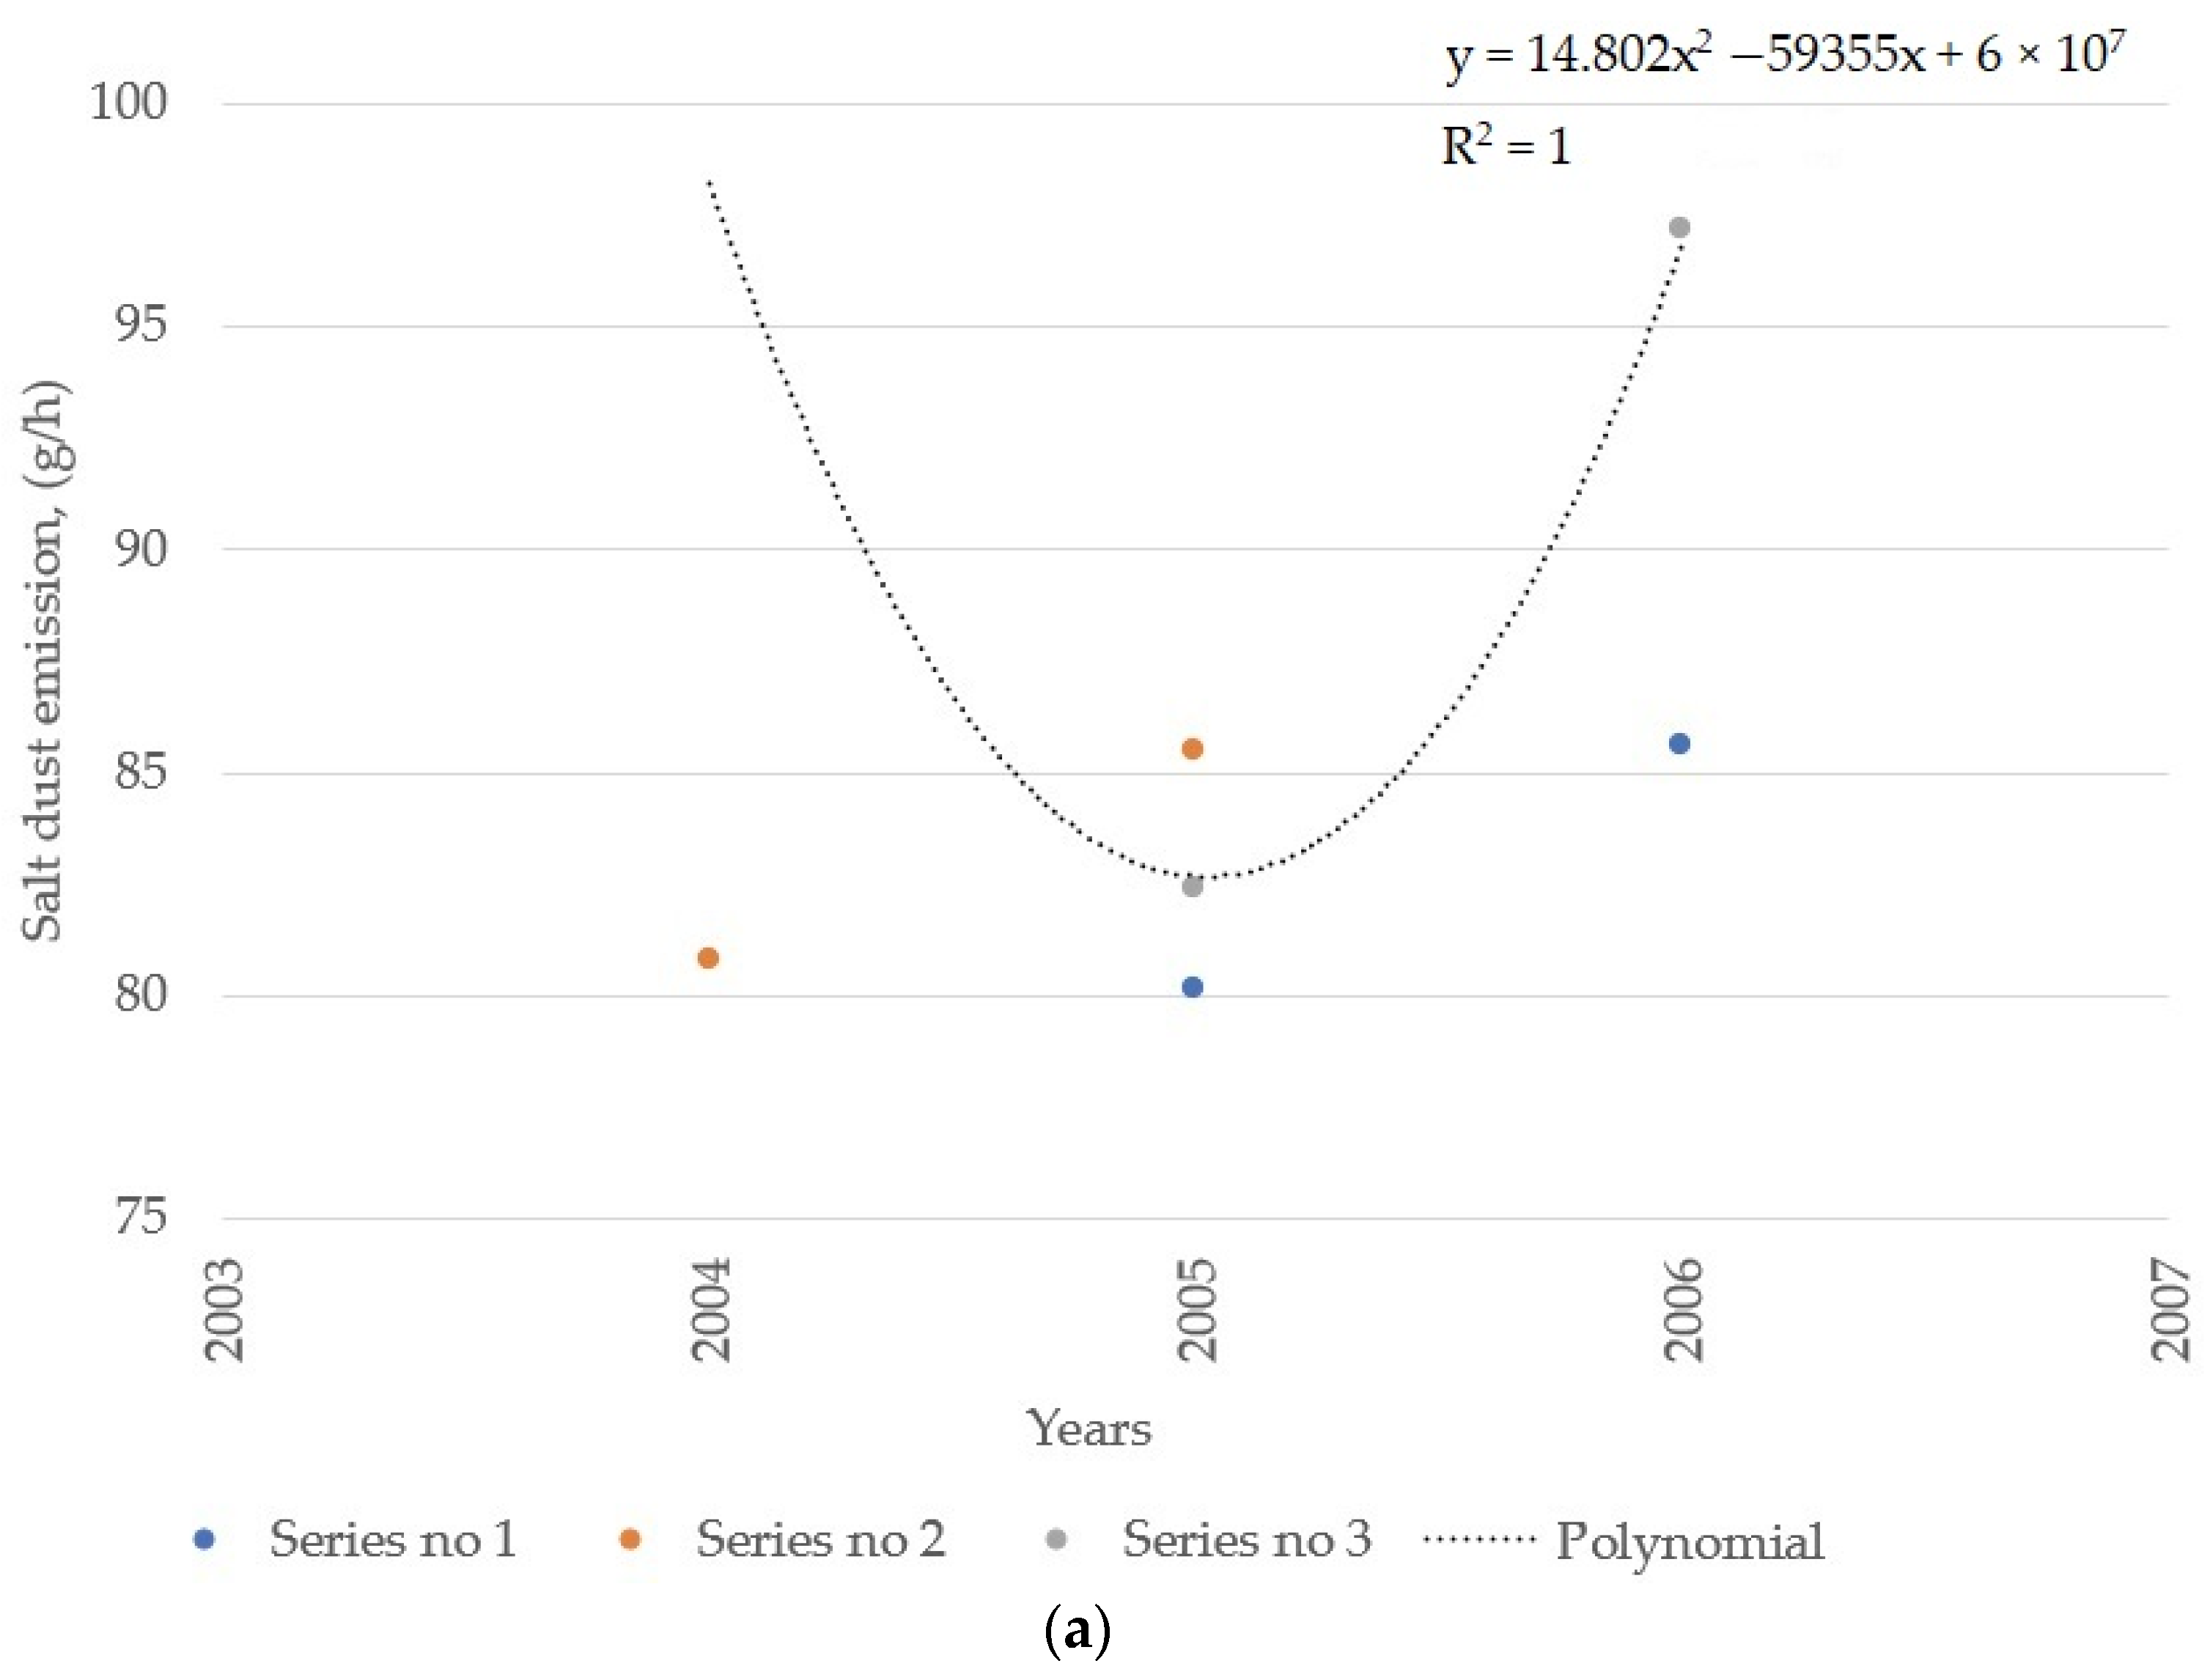
Figure 5a–c). In the case of the amount of salt-dust emissions to the atmosphere, the value was 73.12–124.34 g/h. In this case, the highest value of emissions was obtained in 2012 and the lowest in 2021 (
Figure 6a–c). A review of the records of the working time of the installation shows that on average it works about 180 days a year (50%). Throughout the entire period of measurements, the mean value of the efficiency was 95.99% with a standard deviation of σ = 0.57. In the case of the emission, the mean of the measurements was 99.51 g/h and the standard deviation σ = 6.93. When analyzing the changes in the efficiency of the installation, it can be noticed that in the years 2007–2009 there was a decrease in the dedusting value to approx. 90%. In the following years, there were regular increases in the efficiency of dedusting up to a value of approx. 98% in 2015. Since then, the operation of the systems has stabilized, which is confirmed by the test results until 2021. However, in the case of salt-dust emission into the atmosphere over the analyzed test period, it can be noticed that slight fluctuations with a slight downward trend have been observed in the last 5 years. The first period concerns the start-up of the installation and covers the years 2004–2006. During this period, the difference between the minimum and maximum values for the efficiency of the installation and salt-dust emissions was 5.7% and 28.35 g/h, respectively. The second period is related to the correction and adjustment of the operation of the installation, and it is the period from 2007 to 2012. In this period, the difference between the extreme values was reduced to the value of 5.45% and increased to the value of 41.14 g/h for efficiency and salt-dust emission, respectively. On the other hand, the third period is the stabilization of work, and it is counted from 2013 to the present (
Figure 7a,b). This period is characterized by a significant improvement in efficiency because the difference between the extreme values is lower by 2.38% and 2.63%, respectively, for period II and I. In the case of salt-dust emission, the differences for the minimum and maximum values are higher by 3.64 g/h and 16.35 g/h for period II and I, respectively, which proves a significant improvement in the operation of the installation.
The efficiency of the dedusting installation presented in
Figure 5b, in the adopted time intervals, showed an upward trend in comparison to
Figure 5a,c. The reason for this was that in the analyzed period, the brine flowed in from various regions, which were then gradually liquidated. The first criterion for testing the salt-dust concentration is the provisions of the environmental protection law, which imposes an obligation on the enterprise to protect the earth. In the case of desalination plants, this is the prevention of contamination with risk-causing substances and the remigration of salinity due to the accumulation of soluble salts in the soil. In addition, the law provides information on the obligations to counteract adverse changes in the earth’s surface by preventing and limiting the destruction of the land cover with vegetation [
29]. Derogation from the regulations may be established industrial zones specified in spatial development plans as areas intended for production activities. The second criterion for carrying out measurements is the assessment of human exposure to the maximum permissible concentrations at the workplace. The concentrations of dust in the air at workplaces refer to the concentration of total dust, the concentration of the respirable fraction and the number of fibers above 5 µm [
30]. However, in the case of salt dust, the regulations do not regulate the maximum permissible concentrations in the work environment, which confirms that it is not considered harmful to people. The factor that could influence its classification as harmful is the admixtures of free silica (SiO
2) or other elements, the content of which is often trace. Climate protection by improving air quality is part of the concept of the European Green Deal. Enterprises in the raw materials industry are obliged to take all measures to reduce the level of environmental pollution [
31]. The activities carried out in the Wieliczka Salt Mine are in line with the trend of the proposed directions. Measurements of the chemical analysis carried out at the saltwork in the Wieliczka Salt Mine show that the pH of the brine fed to the scrubber is in the range from 6.9 to 8.1. On the other hand, the values of the individual elements are as follows: NaCl, Ca
2+, Mg
2+, SO
42-,135; 0.98; 0.31; 3.86 g/L, respectively [
32].
5. Conclusions
The possibility of observing the emission of salt dust from the saltwork in the Wieliczka Salt Mine allows one to assess its impact on the environment and the exposure of people around the company. The fact that the tests are carried out cyclically and the results are analyzed for several years are of particular importance. In addition, the use of a repeatable test methodology as well as the use of individually designed measuring equipment allows for repeatability of results and minimization of errors. The research has been conducted for over a dozen years and covers almost the entire period of operation of the installation. On the basis of the obtained results, the following conclusions can be made:
In the characteristics of the saltwork of the scrubber in the Wieliczka Salt Mine, three operating periods can be distinguished: start-up, correction and adjustment and stabilization of work. Comparing the individual periods with each other in terms of the maximum and minimum value, it can be concluded that: the efficiency of the installation in the third period is better by 2.63% and 2.38% compared to the first and the second period.
The applied dedusting system is characterized by high efficiency in the range of 90.50–98.78%.
Salt-dust emission to the atmosphere is small and ranged from 73.12 g/h in 2021 to 124.34 g/h in 2012.
The designed probe with the selector for the AS-50 gravimetric dust meter allows for measurements of dust in the desalination installation.
Properly selected filters to work with the selector allow one to test the actual values of the salt-dust mass.
It is also worth noting that the Wieliczka Salt Mine, which is entered on the UNESCO World Heritage List, does not carry out any exploitation activities but still obtains salt in the saltwater utilization plant. Due to the amount of brine obtained, the saltwork operates 50% of the time during the year. A small annual emission of salt dust to the atmosphere causes a negligible or even marginal impact on the environment. In the future, the method of remote sensing, active or passive, can be used to compare the applied method. Such tests may allow the verification of the method used so far.


