Abstract
The thermal performance of fin-and-tube heat exchangers (HX) is a crucial aspect in a multitude of applications and fields; several design and operational parameters influence this performance. This study focuses on the issue of flow maldistribution and its effect on the HX thermal performance. For this purpose, an experimental setup is designed and implemented to emulate the conditions under which an automotive heat exchanger operates in regard to the non-uniform upstream airflow velocity distribution over the HX surface. The setup allows obtaining various configurations of airflow velocity non-uniformity of some desired mean velocity and standard deviation. The experimental results reveal that a higher degree of non-uniformity (higher standard deviation of the velocity distribution) causes an increased deterioration of the HX thermal performance. For example, at a water flowrate of 200 L/h and a mean airflow velocity of 2 m/s, increasing the standard deviation from 0 to 2 m/s (i.e., moving from the lowest to highest degrees of non-uniformity) causes a total deterioration of 27% in the performance (3.78 to 2.75 kW, respectively), which can also be observed in the increased level of outlet water temperature (53.8 to 58.2 °C, respectively). The obtained results confirm the numerical results reported in the literature.
1. Introduction
Underhood aerothermal management is a discipline in automotive research that includes a multitude of studies than be classified into three main axes [1,2,3,4,5]:
- Development of experimental measurement techniques appropriate for underhood experimental analysis;
- Physical analysis of heat transfer phenomena occurring in the zone engine/components and development of associated analytical and semi-analytical models;
- Analysis and thermal modeling of the zone comprising the heat exchangers.
It is to the framework of the third axis that the present study belongs.
Indeed, heat release and heat transfer phenomena are perhaps a definite occurrence in multiple fields. Regardless of it being undesirable or necessary for proper operation of the system at hand, this transfer must be controlled, perhaps for the recovery of lost heat or enhancing the heat transfer. This is the case in several engineering fields, especially energy systems, heating/cooling, industrial and automotive applications [6,7,8]. In such systems, heat exchangers (HX) are used to achieve the desired transfer of heat, mainly between two fluid streams.
There are numerous types of heat exchangers, which are classified mainly according to their geometry and the flow pattern. Common types include fin-and-tube, shell-and-tube, counter flow channels, and plate HX [9,10,11]. The big picture behind this study is the car underhood compartment where a heat exchanger is needed to cool the engine. The focus of this paper is the fin-and-tube HX which is often used in a car underhood, mainly due to its compactness, thermal efficiency and lightweight. Fin-and-tube HXs are composed of tubes of elliptical sections that pass among multiple parallel fins that are said to increase the heat transfer surface.
The literature [12,13,14,15,16] reveals that the thermal performance of fin-and-tube type HXs relies on geometrical parameters such as tube pitch spacing in addition to operational parameters including fluid properties, e.g., temperatures at the inlet and outlet of the fluid streams, their flowrates, and the overall coefficient of heat transfer. Moreover, previous studies show that for a given fin-and-tube HX, the thermal performance is influenced by the topologies of the two fluid streams. Precisely, the distribution of the airflow (which is often the cooling flow) exhibits a superior effect on the HX performance than the tube flow (hot flow) [17,18]. In other terms, a single fin-and-tube HX will convey different thermal performances when cooled by different airflow distributions despite having the exact same flow rate. In fact, when integrating a fin-and-tube HX in a system of complex design, e.g., a car underhood compartment, it is surely subjected to non-uniformities in the airflow velocity and temperature profiles. The thermal performance deteriorates under velocity non-uniformity [19,20,21]. However, few studies [22,23,24] focused directly on the effect of non-uniformities of velocity and temperature on the thermal performance of HXs. Numerical investigations by Khaled et al. [22,23,24] reveal that velocity non-uniformities of air and water in a fin-and-tube HX can cause a performance degradation of up to 40%. As an example, taking the case of a mean airflow velocity of 10 m/s, moving from the case of a uniform distribution to the highest degree of non-uniformity causes a 33.5% drop in the HX performance (from 62 to 41.2 kW). Tests on the effect of water flow rate maldistribution reveal also a similar outcome, where for example, at a mean flowrate of 6000 L/h and when moving also from the lowest to the highest degrees of non-uniformity, the performance decreases from 36.1 to 18.5 kW, whereas temperature non-uniformities have the possibility to improve or reduce the performance by up to 5%.
Moreover, a variety of investigations focus on studying the effects of airflow non-uniformity. Song et al. [25] studied a multi-circuit evaporator’s performance when subjected to non-uniform velocity; the numerical and experimental investigations revealed a 7.78% decrease in the evaporator capacity while under maldistributed airflow compared to the case of a uniformly distributed one.
Belcich et al. [26] investigated the effect of non-uniform distributions of the entering airflow temperature and velocity fields on an air-cooled HX (cross-flow type) performance. Accordingly, the non-uniformity leads to reducing the performance of the heat exchange by 2%.
Recently, Lanping Zhao et al. [27] have studied also the effect of non-uniformity of air flow on a parallel-flow type HX’s (PFHX) thermal performance using an automotive radiator. Based on their results, the non-uniformity of air flow causes a rapid deterioration on the performance of the heat exchanger, and it could reach around 19%.
T’Joen et al. [28] established a simulation method that allows predicting the effects of maldistributed airflow on heat exchangers with a uniformly distributed liquid flow; it was concluded that this maldistribution harms the performance of the HX, the presented method also aids in designing more efficient HXs. Mueller [29] investigated laminar and turbulent non-uniform airflows, and concluded that while some HX types undergo small performance reductions under turbulent non-uniform airflow, the reductions are more severe under laminar non-uniform airflow. Mao et al. [30] studied the thermal performance of a fin-and-tube HX subjected to airflow non-uniformity and found a deterioration up to 6%. Yaici et al. [31] studied the thermohydraulic performance of HXs under airflow non-uniformity and presented a useful tool for the design and optimization of HXs to avoid harmful effects of non-uniformity.
Some studies in the literature also focus on the temperature maldistribution. Kou and Yuan [32] studied the performance of a direct transfer HX, concluding that temperature non-uniformity enhanced the performance. Guo et al. [33] investigated the effectiveness of several HX types with respect to the distribution of temperature; it was found that effectiveness decreases with maldistributed temperature difference fields. Mishra et al. [34] conducted finite difference calculations of temperature dynamics in a cross-flow HX under temperature and flow maldistributions for several conditions. Zhu et al. [35] performed a numerical investigation on fluid parameters and their impact on heat transfer, and the study concluded that a reduced fluid velocity improves the thickness of the thermal boundary layer. Ishaq et al. [36] studied the effect of flow distribution on the performance of a double pipe heat exchanger when adding fins of a diamond shape. Based on the present brief literature review, it could be concluded that the non-uniformity has a significant effect on the heat transfer performance of heat exchangers. Consequently, it should be taken into consideration. For these reasons, the present paper focuses on the effects of airflow velocity maldistribution upstream a fin-and-tube HX through an experimental setup. The setup permits circulating a hot water flow through the tubes and allows controlling the airflow velocity profile upstream the HX to a desired non-uniformity configuration; the obtained experimental data are compared to numerical results in the literature. The originality of this work resides mainly in the experimental setup developed which permits controlling the configurations of non-uniformity so that its effect can be studied under a wide range of parameters in the future. It also allows us to have some experimental data that serve in the validation of numerical studies.
The rest of the paper is structured such that Section 2 lays down the theoretical basics of this study. Section 3 details the experimental setup and its various components. Section 4 is devoted to the testing configurations and their results. Then, Section 5 provides some discussion and analysis to finally draw conclusions in Section 6.
2. Theoretical Background
Passing through the detailed literature in the preceding section and the previous investigations by the authors of this article [22,23,24], it is observed that multiple numerical methods exist in order to characterize the effects of non-uniform distributions of airflow velocity and temperature on the HX thermal performance. Nevertheless, most methods share the concept of discretizing the heat transfer area into n × m cells and performing energy analysis locally on each cell, as shown in Figure 1.
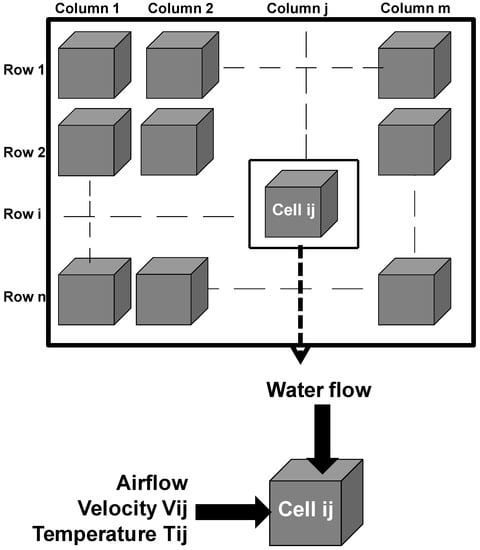
Figure 1.
Schematic of HX representation in numerical modeling.
Each cell is characterized by local airflow velocity and temperature values; output parameters of the energy balance analysis of each cell are taken as input parameters of the neighboring cell. This allows the analysis of the global airflow velocity and temperature non-uniformity scheme.
The basic objective of the different investigations summarized above is to analyze how the HX thermal performance is affected under non-uniform airflow velocity and temperature distributions. The aim of such analysis is to enhance the performance of an HX by optimizing the design and the setup to reach an optimum airflow arrangement to cool the fin-and-tube HX. Consequently, experimental analysis is crucial to validate the results and conclusions obtained through numerical tools, in addition to providing a basis for the improvement of the models built and their accuracy. Therefore, a suitable experimental setup must be designed and implemented; it should be flexible in a way that allows varying and controlling airflow velocity and temperature distributions upstream the heat transfer area of the HX. This is to permit performing parametric analysis for any desired degree and configuration of non-uniformity.
The mathematical model on which the computations are based is based mainly on the discretization of the HX surface into an n × m matrix of cells; the procedure is based on the following assumptions:
- Hot water inlet flow is uniformly distributed among the columns of the discretized HX surface.
- Perfect mixing is assumed at the outlet of the columns.
- The temperature at the outlet of each cell is considered as the inlet temperature of the neighboring cell.
- The method of obtaining an overall heat transfer coefficient of the entire HX is valid on each cell in the HX matrix.
The thermal performance (heat transfer rate among the two fluid streams) of a water–air HX is given by the following relation [23]:
where represents the overall heat transfer coefficient (referred to as U-value in the remainder of the paper), is the surface of heat transfer (area of the HX separating the two fluids), and ETD stands for the extreme temperature difference given by:
where and represent, respectively, the outlet and inlet water temperatures in the HX. corresponds to the upstream air temperature over the exchanger.
A previous study [23] concluded that the exchanger’s U-value does not depend on ETD but rather is a function of air and water flow rates and :
Applying the thermal performance formulation of Equation (1) to each cell of the discretized HX surface yields:
where is the overall coefficient of heat exchange between air and water at the sub-domain level, is the cell heat transfer area, is the average water temperature in and out of the cell, and is the cell’s upstream air temperature. On the other hand, the thermal performance corresponds to the dissipated heat of the water stream in the exchanger, which is represented in each cell as:
Such that stands for the cell water flowrate, the thermal capacity of water, and and are, respectively, the outlet and inlet water temperatures in the cell.
The cell’s outlet water temperature is determined by combining Equations (4) and (5) as follows:
The temperature of air at the cell downstream is obtained by:
Such that represents the air mass flow rate in the cell and corresponds to the air heat capacity. Equations (6)–(10) represent the basic equations used in HX thermal modeling. The U-value of the cell is obtained from experimental curve fits.
Considering the total area of the heat exchanger, the thermal performance is calculated by performing an energy balance among the HX inlet and outlet, as follows:
3. Experimental Setup
As stated previously, the experimental setup must facilitate testing under different degrees and configurations of airflow velocity non-uniformity. To proceed, the setup must be capable of emulating the real case of a HX in a car underhood. Therefore, the proposed design consists of a thermal part responsible for providing the hot water flow and an aerodynamic part responsible for providing the maldistributed airflow.
3.1. The Thermal Part
Table 1 lists the components of the thermal part of the experimental setup. A water tank is used for 100 L of volume capacity connected with a gate valve and equipped with an electric heater (3 kW). A hot water pump is used in the experimental setup. The head of the hydraulic pump is 10 m and the volume flow rate provided is 18 L·min−1. A pipe connection is installed in order to guide the flow and make a good connection between different parts. The used heat exchanger has a surface of 70 × 55 cm2, which is equipped by two temperature sensors installed at the inlet and outlet. Figure 2 shows the different parts of the entire assembly of experimental setup that has been investigated in the present project.

Table 1.
Components of the thermal part.
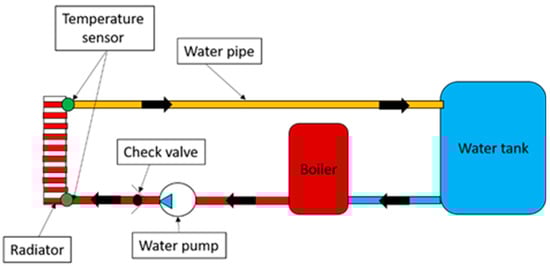
Figure 2.
Schematic of the thermal part.
3.2. The Aerodynamic Part
The aerodynamic part (Figure 3) is composed of several parts as described below:
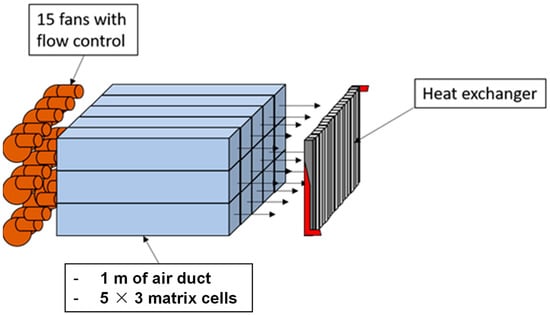
Figure 3.
Schematic of the aerodynamic part.
- An air duct (70 cm × 60 cm) is discretized into 15 smaller areas (cells). Accordingly, each small area consists of 18.3 × 14 cm2. Accordingly, this division allows controlling the airflow in each cell to have the desired configuration of non-uniformity. The reasoning behind this discretization is to be in accordance with the numerical methods that are based on the same principle.
- Fifteen 100 W fans, capable of providing an air velocity up to 13 m·s−1 through each cell (discretized duct).
- Speed regulators to control the speed of the fans is used in order to create the velocity maldistribution configuration through the discretized duct.
- 40-A/12-V batteries to power up the fans and their regulators.
The component layout of the aerodynamic part is illustrated in Figure 3. The complete experimental setup with the two parts connected is shown in Figure 4. The design of the experimental setup provides flexibility in testing which permits studying thoroughly the effects of airflow velocity maldistribution on the performance of a HX. The next section discusses the different velocity non-uniformity configurations achieved with the setup and their impacts on the HX performance.
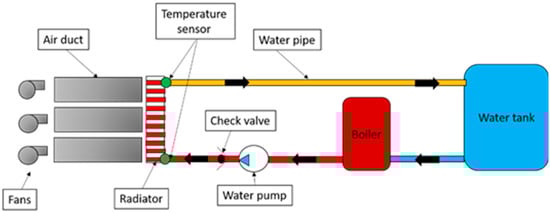
Figure 4.
Illustration of the complete experimental setup.
3.3. Measurements and Uncertainty
Velocity measurements of air in the cells upstream of the exchanger are performed with a digital anemometer remote fan air flow meter of high precision, and water flow rates are measured using the stop watch method in preliminary tests with valves regulated at different speeds. Water temperatures at the inlet and outlet of the heat exchanger are measured using k-type digital thermocouples.
In order to validate experimental results, uncertainty analysis is considered on the temperature measurements, since the heat transfer rates (thermal performance of the heat exchanger) depend mainly on the measurement of temperatures (difference of temperatures) and since errors on the velocity measurements are relatively small. Variations of water temperatures at the inlet and outlet of the heat exchanger for tests repeated twice under the same operating conditions and configuration and then for different operating conditions (three) are considered (which gives a total of six tests). It was found that the maximum mean temperature difference between the tests is about 0.3 °C, showing a 0.5% in relative difference calculated with respect to an average water temperature of 61.5 °C, suggesting that temperature variation is well reproduced by repeating the same test and conserving the same operating conditions. On the other hand, the maximum error of positioning thermocouples in the water streams is 0.5 °C. Then, with an average measured temperature of 61.5 °C, the maximum relative error due to the present method of thermocouple positioning does not exceed 0.8%.
Finally, with 0.5% repeatability and 0.8% precision error of temperature measurement, the uncertainty is 0.94%, giving then 99.06% confidence in temperature measurements.
4. Testing Configuration and Results
The testing is performed for different mean airflow velocities that are 2 and 3 m·s−1, which are run against multiple water flow rates, namely 200, 400 and 600 L·h−1.
The experimentation is conducted as follows:
- Fix a certain water flow rate and mean airflow velocity;
- Try all the non-uniformity configurations at the prescribed mean air velocity;
- Record the inlet and outlet temperatures at each configuration.
Each water flow rate will be tested with both mean air velocity values (2 and 3 m·s−1); each mean air velocity has six different non-uniformity configurations to be tested, which total 12 testing configurations for each water flow rate, with three water flow rates tested (200, 400 and 600 L·h−1); this leads to 36 testing configurations. The non-uniformity configurations for each mean airflow velocity are shown in Figure 5 and Figure 6.
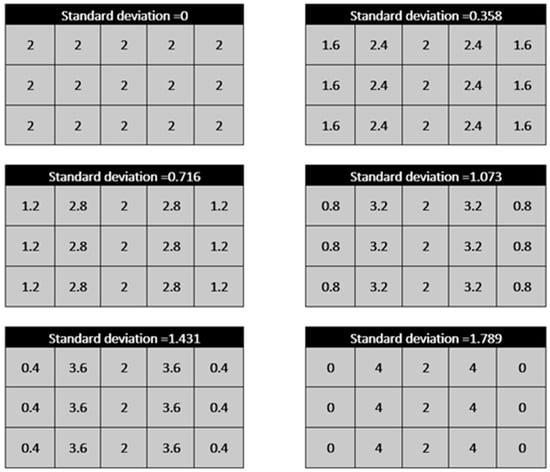
Figure 5.
Velocity non-uniformity configurations for a mean air velocity of 2 m·s−1.
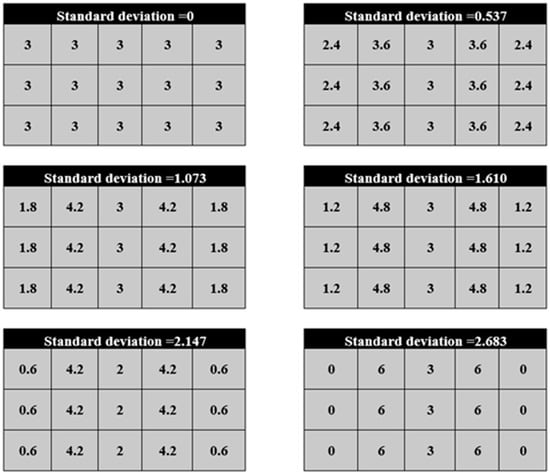
Figure 6.
Velocity non-uniformity configurations for a mean air velocity of 3 m·s−1.
In each configuration of Figure 5 and Figure 6, the airflow velocity in each small duct (cell) was fixed in a manner to obtain a given standard deviation of the airflow non-uniformity upstream of the HX. This standard deviation is a representation of the non-uniformity in velocity distribution and is the main parameter that influences the thermal performance of the HX (see below). Configurations of Figure 5 and Figure 6 allowed finally obtaining for each mean air velocity six different airflow velocity distributions: each one characterized by a given standard deviation. The standard deviation is calculated using the following equation:
where is the number of cells (small ducts/fans), is the airflow velocity in the cell , and is the mean airflow velocity.
Figure 7 shows the evolution of the HX thermal performance and non-dimensional HX thermal performance at different water flow rates as a function of the standard deviation of upstream airflow velocity distribution of a mean value of 2 m·s−1.
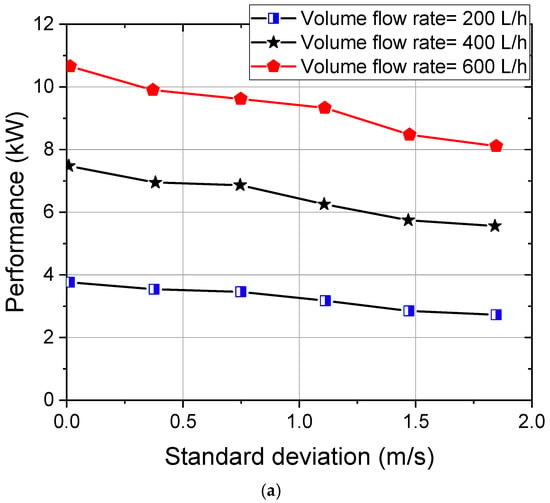
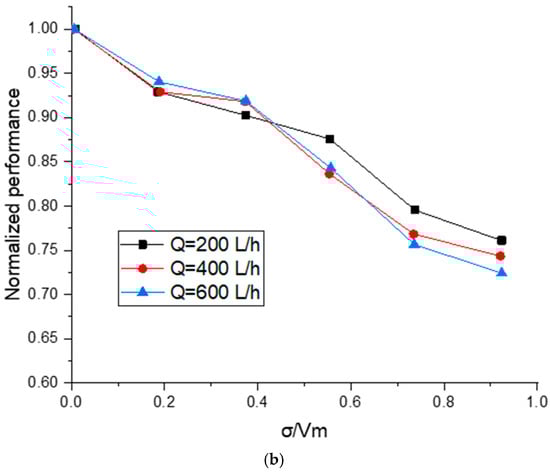
Figure 7.
Evolution (for the tested water flow rates) of (a) water outlet temperature and (b) HX thermal performance versus the standard deviation of the distribution of airflow velocity for a mean air velocity of 2 m·s−1.
It can be observed that upstream airflow velocity non-uniformity causes a deterioration in the HX thermal performance. For instance, with the water flowrate fixed at 200 L·h−1, varying the standard deviation in an increasing manner from 0 to 2 m·s−1 leads to a decrease from 3.78 to 2.75 kW, which is a 27% decrease in comparison to the case of uniform airflow velocity distribution. These orders of magnitude are close to the ones achieved numerically by Khaled et al. [22]. For 400 and 600 L·h−1, the HX performance deteriorates from 7.56 to 5.65 kW and from 10.99 to 8.26 kW, respectively.
Similar trends are observed for a mean velocity of 3 m·s−1.
Figure 7b shows the normalized heat exchanger performance (with respect to , the performance for the case of a completely uniform flow, i.e., a standard deviation m/s) as a function of the standard deviation that is also normalized with the mean airflow velocity (Vm = 2 m/s). It is obvious that the curves are very close and a linear generalization can be obtained, which is:
Table 2 lists a comparison of the results obtained in this study against data in the literature from Khaled et al. [22], particularly the reduction in the water temperature and the HX performance deterioration (in relation to a fully uniform flow case, i.e., standard deviation of 0 m/s), in the case of a mean airflow velocity of 2 m/s. The table shows a good agreement of the results of this study with data reported in the literature.
Table 2.
Comparison of study results with the literature [22], for the case of mean airflow velocity of 2 m/s.
5. Discussion
As portrayed by the above results, it appears evident that with a more uniformly distributed airflow velocity, the heat exchanger performance evolves and is superior to cases of high degree of non-uniformity. In the context of a vehicle cooling module, which is the motivation behind this study, achieving a uniform flow of air upstream the cooling module provides several advantages, i.e., as the performance of the heat exchanger is enhanced, less power is consumed for cooling purposes. To be precise, pump and compressor power requirements are reduced; this in turn reduces fuel consumption and consequently pollutant emissions.
Nevertheless, obtaining a uniform airflow upstream the vehicle’s cooling module is not a simple task. As mentioned previously, a vehicle’s exchanger is almost always subjected to maldistributed airflow velocity profile. Therefore, the challenge would be to increase the degree of uniformity of the upstream airflow. Several control methods for this purpose could be feasible, but surely, several constraints might stand in the way; space constraints in a car underhood are an obvious example here. Moreover, any control methodology as applied to a vehicle cooling module would face numerous disturbances that are hard to predict and avoid. A suggestion which is under investigation by the authors is using a diffuser ahead of the first exchanger in the cooling module or perhaps a nozzle–diffuser setup. This is thought to be beneficial in enhancing the degree of uniformity of the upstream airflow velocity profile.
6. Conclusions
This paper presented an experimental investigation on the impact of a maldistributed velocity profile of the airflow on the thermal performance of a fin-and-tube HX. An experimental testing setup was built; it consists of a thermal part, which provides the hot water circulating in the tube, and an aerodynamic part, which allows obtaining the desired degree and configuration of velocity non-uniformity of the airflow. The aim is to observe the HX performance under different airflow velocity non-uniformity schemes. The setup is designed so as to imitate the case of a car underhood radiator which is always performing under a non-uniform upstream airflow velocity profile. It allows testing for various degrees of non-uniformity; the degree of non-uniformity is represented as the standard deviation of the airflow velocity distribution profile over the HX surface. For a profile of a particular mean velocity Vm, the lowest degree of non-uniformity (completely uniform airflow velocity distribution) is represented by a standard deviation of zero, while the highest degree of non-uniformity is conveyed by a standard deviation equal to the value of Vm.
It was proven that the heat exchanger’s thermal performance is deteriorated under airflow velocity non-uniformity. For example, for a 2 m·s−1 mean air velocity and 200 L·h−1 water flowrate, increasing the standard deviation of air velocity distribution from 0 to 2 m·s−1 causes a decrease in the exchanger performance from 3.78 to 2.75 kW, which is a 27% decrease in comparison to the case of a uniformly distributed airflow velocity profile. This can also be illustrated in the increase in the outlet water temperature, which moved from 53.8 °C (in the case of a uniform flow) to 58.2 °C (for the case of the most severely maldistributed profile). Those trends are in agreement with the numerical results observed in the literature.
Author Contributions
Conceptualization, M.K.; Data curation, M.M.; Formal analysis, M.K., M.M., J.F., K.C., T.L. and H.S.R.; Investigation, M.K., M.M., J.F., K.C., T.L. and H.S.R.; Methodology, M.K. and M.M.; Project administration, M.K.; Supervision, M.K.; Validation, M.M.; Writing—original draft, M.M.; Writing—review & editing, M.K., J.F., K.C., T.L. and H.S.R. All authors have read and agreed to the published version of the manuscript.
Funding
This research received no external funding.
Data Availability Statement
The data presented in this study are available in this article.
Conflicts of Interest
The authors declare no conflict of interest.
Nomenclature
| a | constant |
| A | surface area (m2) |
| b | constant |
| heat capacity (J kg−1 K−1) | |
| ETD | extreme temperature difference (°C) |
| HX | heat exchanger |
| m | number of column of heat exchanger matrix |
| flow rate (kg s−1) | |
| n | number of rows of heat exchanger matrix |
| N | number of cells of heat exchanger matrix |
| Q | water flowrate (L h−1) |
| heat exchanger thermal performance (kW) | |
| heat exchanger performance for a uniform airflow (kW) | |
| T | temperature (°C) |
| U | overall heat transfer coefficient (W m−2 K−1) |
| V | airflow velocity (m/s) |
| standard deviation of velocity distribution (m/s) | |
| Subscripts | |
| air | air |
| cell | cell |
| fluid | fluid |
| in | inlet |
| m | mean |
| out | outlet |
| w | water |
References
- Khaled, M.; Harambat, F.; El Hage, H.; Peerhossaini, H. Spatial optimization of underhood cooling module—Towards an innovative control approach. Appl. Energy 2011, 88, 3841–3849. [Google Scholar] [CrossRef]
- Karamanos, K.; Afrasiabian, E.; In Kim, S.; Dougla, R.; Mahmoudi, Y. Multifidelity simulation of underhood thermal system for a bus engine. Appl. Therm. Eng. 2022, 201, 117707. [Google Scholar] [CrossRef]
- Lu, P.; Gao, Q.; Wang, Y. The simulation methods based on 1D/3D collaborative computing for the vehicle integrated thermal management. Appl. Therm. Eng. 2016, 104, 42–53. [Google Scholar] [CrossRef]
- Liu, X.; Guo, H.; Cheng, X.; Du, J.; Ma, J. A Robust Design of the Model-Free-Adaptive-Control-Based Energy Management for Plug-in Hybrid Electric Vehicle. Energies 2022, 15, 7467. [Google Scholar] [CrossRef]
- Khaled, M.; Garnier, B.; Harambat, F.; Peerhossaini, H. A New Method for Simultaneous Measurement of Convective and Radiative Heat Flux in Car Underhood Applications. Meas. Sci. Technol. 2010, 21, 025903. [Google Scholar] [CrossRef]
- Mancaruso, E.; Sequino, L. Measurements and modeling of piston temperature in a research compression ignition engine during transient conditions. Results Eng. 2019, 2, 100007. [Google Scholar] [CrossRef]
- Lyu, Y.; Siddique, A.R.M.; Gadsden, S.A.; Mahmud, S. Experimental investigation of thermoelectric cooling for a new battery pack design in a copper holder. Results Eng. 2021, 10, 100214. [Google Scholar] [CrossRef]
- Zhang, L.; Zhai, H.; He, J.; Yang, F.; Wang, S. Application of Exergy Analysis in Flue Gas Condensation Waste Heat Recovery System Evaluation. Energies 2022, 15, 7525. [Google Scholar] [CrossRef]
- Ameur, H. Effect of the baffle inclination on the flow and thermal fields in channel heat exchangers. Results Eng. 2019, 3, 100021. [Google Scholar] [CrossRef]
- Seco-Nicolás, M.; García, M.A.; Luna-Abad, J.P. Experimental calculation of the mean temperature of flat plate thermal solar collectors. Results Eng. 2020, 5, 100095. [Google Scholar] [CrossRef]
- Hussein, A.M.; Dawood, H.K.; Bakara, R.A.; Kadirgamaa, K. Numerical study on turbulent forced convective heat transfer using nanofluids TiO2 in an automotive cooling system. Case Stud. Therm. Eng. 2017, 9, 72–78. [Google Scholar] [CrossRef]
- Lee, Y.T.; Chien, L.H.; He, J.; Wen, C.Y.; Yang, A.S. Air side performance characterization of wavy Fin-and-tube heat exchangers having elliptic tubes with large waffle heights. Appl. Therm. Eng. 2022, 217, 119220. [Google Scholar] [CrossRef]
- Zhang, L.; Song, M.; Mao, N.; Dong, J. Temporal and spatial frost growth prediction of a tube-finned heat exchanger considering frost distribution characteristics. Int. J. Heat Mass Transf. 2022, 183, 122192. [Google Scholar] [CrossRef]
- Blecich, P. Experimental investigation of the effects of airflow nonuniformity on performance of a fin-and-tube heat exchanger. Int. J. Refrig. 2015, 59, 65–74. [Google Scholar] [CrossRef]
- Fernández-Seara, J.; Pardiñas, Á.Á.; Diz, R. Heat transfer enhancement of ammonia pool boiling with an integral-fin tube. Int. J. Refrig. 2016, 69, 175–185. [Google Scholar] [CrossRef]
- Abdous, M.A.; Saffari, H.; Avval, H.B.; Khoshzat, M. The study of entropy generation during flow boiling in a micro-fin tube. Int. J. Refrig. 2016, 68, 76–93. [Google Scholar] [CrossRef]
- Waschle, A. Numerical methods, Three-Dimensional. In Progress in Vehicle Aerodynamics II Thermo-Management; Wiedemann, J., Hucho, W.H., Eds.; Expert: Stuttgart, Germany, 2002; pp. 115–128. [Google Scholar]
- Zhang, L.Z. Flow maldistribution and thermal performance deterioration in a cross-flow air to air heat exchanger with plate-fin cores. Int. J. Heat Mass Transf. 2009, 52, 4500–4509. [Google Scholar] [CrossRef]
- Shaji, K.; Das, S.K. The effect of flow maldistribution on the evaluation of axial dispersion and thermal performance during the single-blow testing of plate heat exchangers. Int. J. Heat Mass Transf. 2010, 53, 1591–1602. [Google Scholar] [CrossRef]
- Srihari, N.; Rao, B.P.; Sunden, B.; Das, S.K. Transient response of plate heat exchangers considering effect of flow maldistribution. Int. J. Heat Mass Transf. 2005, 48, 3231–3243. [Google Scholar] [CrossRef]
- Cabezas-Gómez, L.; Navarro, H.A.; de Godoy, S.M.; Campo, A.; Saiz-Jabardo, J.M. Thermal characterization of a cross-flow heat exchanger with a new flow arrangement. Int. J. Therm. Sci. 2009, 48, 2165–2170. [Google Scholar] [CrossRef]
- Khaled, M.; El Hage, H.; El Marakbi, A.; Harambat, F.; Peerhossaini, H. Aerothermal management of vehicle heat exchangers—Parametric analysis. In Fluids Engineering Division Summer Conference; American Society of Mechanical Engineers: Reno, NV, USA, 2013. [Google Scholar] [CrossRef]
- Khaled, M.; Harambat, F.; Peerhossaini, H. Analytical and empirical determination of thermal performance of louvered heat exchanger–effects of air flow statistics. Int. J. Heat Mass Transf. 2011, 54, 356–365. [Google Scholar] [CrossRef]
- Khaled, M.; Ramadan, M.; Shaito, A.; El Hage, H.; Harambat, F.; Peerhossaini, H. Parametric analysis of heat exchanger thermal performance in complex geometries—Effect of air velocity and water flow distributions. Heat Transf. Eng. 2016, 37, 1027–1037. [Google Scholar] [CrossRef]
- Song, X.; Huang, D.; Liu, X.; Chen, Q. Effect of non-uniform air velocity distribution on evaporator performance and its improvement on a residential air conditioner. Appl. Therm. Eng. 2012, 40, 284–293. [Google Scholar] [CrossRef]
- Beiler, M.G.; Kröger, D.G. Thermal performance reduction in air-cooled heat exchangers due to nonuniform flow and temperature distributions. Heat Transf. Eng. 1996, 17, 82–92. [Google Scholar] [CrossRef]
- Zhao, L.; Wang, B.; Wang, J.; Zhu, Z.; Li, T.; Guo, B.; Yang, Z. Effect of non-uniform airflow on the performance of a parallel-flow heat exchanger considering internal fluid distribution—Simulation studies and its experimental validation. Appl. Therm. Eng. 2020, 180, 115685. [Google Scholar] [CrossRef]
- T’joen, C.; Willockx, A.; Steeman, H.J.; De Paepe, M. Performance prediction of compact fin-and-tube heat exchangers in maldistributed airflow. Heat Transf. Eng. 2007, 28, 986–996. [Google Scholar] [CrossRef]
- Mueller, A.C. Effects of some types of maldistribution on the performance of heat exchangers. Heat Transf. Eng. 1987, 8, 75–86. [Google Scholar] [CrossRef]
- Mao, J.N.; Chen, H.X.; Jia, H.; Wang, Y.Z.; Hu, H.M. Effect of air-side flow maldistribution on thermal–hydraulic performance of the multi-louvered fin and tube heat exchanger. Int. J. Therm. Sci. 2013, 73, 46–57. [Google Scholar] [CrossRef]
- Yaïci, W.; Ghorab, M.; Entchev, E. 3D CFD analysis of the effect of inlet air flow maldistribution on the fluid flow and heat transfer performances of plate-fin-and-tube laminar heat exchangers. Int. J. Heat Mass Transf. 2014, 74, 490–500. [Google Scholar] [CrossRef]
- Kou, H.S.; Yuan, P. Thermal performance of crossflow heat exchanger with nonuniform inlet temperatures. Int. Commun. Heat Mass Transf. 1997, 24, 357–370. [Google Scholar] [CrossRef]
- Guo, Z.Y.; Zhou, S.Q.; Li, Z.X.; Chen, L.G. Theoretical analysis and experimental confirmation of the uniformity principle of temperature difference field in heat exchanger. Int. J. Heat Mass Transf. 2002, 45, 2119–2127. [Google Scholar] [CrossRef]
- Mishra, M.; Das, P.K.; Sarangi, S. Effect of temperature and flow nonuniformity on transient behaviour of crossflow heat exchanger. Int. J. Heat Mass Transf. 2008, 51, 2583–2592. [Google Scholar] [CrossRef]
- Zhu, A.; Ali, H.; Ishaq, M.; Junaid, M.S.; Raza, J.; Amjad, M. Numerical Study of Heat and Mass Transfer for Williamson Nanofluid over Stretching/Shrinking Sheet along with Brownian and Thermophoresis Effects. Energies 2022, 15, 5926. [Google Scholar] [CrossRef]
- Ishaq, M.; Ali, A.; Amjad, M.; Syed, K.S.; Iqbal, Z. Diamond-Shaped Extended Fins for Heat Transfer Enhancement in a Double-Pipe Heat Exchanger: An Innovative Design. Appl. Sci. 2022, 11, 5954. [Google Scholar] [CrossRef]
Publisher’s Note: MDPI stays neutral with regard to jurisdictional claims in published maps and institutional affiliations. |
© 2022 by the authors. Licensee MDPI, Basel, Switzerland. This article is an open access article distributed under the terms and conditions of the Creative Commons Attribution (CC BY) license (https://creativecommons.org/licenses/by/4.0/).