Article

Machine Learning for Short-Term Load Forecasting in Smart Grids

by
Bibi Ibrahim
1,
Luis Rabelo
1,*,
Edgar Gutierrez-Franco
2 and
Nicolas Clavijo-Buritica
3,4
1
Industrial Engineering & Management Systems Department, University of Central Florida, Orlando, FL 32816, USA
2
Massachusetts Institute of Technology, Center for Transportation and logistics CTL, Cambridge, MA 02142, USA
3
Department of Industrial Engineering and Management, Faculty of Engineering, University of Porto, 4200-465 Porto, Portugal
4
Centre for Industrial Engineering and Management, Institute for Systems and Computer Engineering, Technology and Science—INESCTEC, 4200-465 Porto, Portugal
*
Author to whom correspondence should be addressed.
Energies 2022, 15(21), 8079; https://doi.org/10.3390/en15218079
Submission received: 30 September 2022 / Revised: 24 October 2022 / Accepted: 25 October 2022 / Published: 31 October 2022

Abstract

:
A smart grid is the future vision of power systems that will be enabled by artificial intelligence (AI), big data, and the Internet of things (IoT), where digitalization is at the core of the energy sector transformation. However, smart grids require that energy managers become more concerned about the reliability and security of power systems. Therefore, energy planners use various methods and technologies to support the sustainable expansion of power systems, such as electricity demand forecasting models, stochastic optimization, robust optimization, and simulation. Electricity forecasting plays a vital role in supporting the reliable transitioning of power systems. This paper deals with short-term load forecasting (STLF), which has become an active area of research over the last few years, with a handful of studies. STLF deals with predicting demand one hour to 24 h in advance. We extensively experimented with several methodologies from machine learning and a complex case study in Panama. Deep learning is a more advanced learning paradigm in the machine learning field that continues to have significant breakthroughs in domain areas such as electricity forecasting, object detection, speech recognition, etc. We identified that the main predictors of electricity demand in the short term: the previous week’s load, the previous day’s load, and temperature. We found that the deep learning regression model achieved the best performance, which yielded an R squared (R2) of 0.93 and a mean absolute percentage error (MAPE) of 2.9%, while the AdaBoost model obtained the worst performance with an R2 of 0.75 and MAPE of 5.70%.

1. Introduction

A smart grid is the future vision of power systems that will be enabled by artificial intelligence (AI), big data, and IoT, where digitalization is at the core of the energy sector transformation. The smart grid concept was introduced in the 2000s to address multiple issues, such as power quality, energy security, renewable integration, etc., through new investment in modern bidirectional communication infrastructure [1]. In 2011, the Electric Power Research Institute (EPRI) referred to the smart grid as “a modernization of the electricity delivery system that can monitor, protect, and automatically optimize the operation of its interconnected elements”.
AI is another technology starting to positively impact the energy sector as enterprises change their attitude towards this technology. A recent survey conducted by Siemens found that energy companies are already transforming their operations using AI, where 30% responded that they are using AI for more intelligent automation of machinery equipment, while 28% are using it for asset maintenance forecasts. However, the study also found that many leaders are cautious about implementing AI, as they still have difficulty trusting it with important decisions [2].
Energy managers are becoming more concerned about the reliability and security of power systems. In addition, the digital economy has imposed greater demand on the electricity supply’s reliability, with more consumers and electric vehicles (EVs) becoming connected to the electric grid. Therefore, the electricity industry is now on the verge of a new era faced with many challenges to meet higher security, interoperability, and reliability requirements. The growing challenges are rising electricity demand, peak demand growth, energy security [3], lack of smart grid technology standards, EV accommodation [4], and cybersecurity concerns.
Energy managers are struggling to find ways to reduce the gap between supply and demand. Therefore, energy planners use various methods and technologies to support the sustainable expansion of power systems, such as electricity demand forecasting models, stochastic optimization, robust optimization, and simulation. Electricity forecasting plays a vital role in supporting the reliable transitioning of power systems. For example, the authors in [5] recently provided a global perspective on the importance of electricity forecasting and the state-of-the-art techniques to support rising electricity demand in low and middle-income countries, focusing mainly on Pakistan. However, challenges still exist in generating more accurate forecasts due to the granularity and quality of the data collected from sensors and Supervisory Control and Data Acquisition (SCADA) systems, the nonlinear and noisy patterns presented in the data, and the complex features that affect it.
Short-term load forecasting (STLF) has become an active area of research over the last few years, with a handful of studies. With the advent of the smart grid, there is a need for more accurate forecasting models to allow for better planning and operation of electricity providers to meet consumer demand reliably. STLF deals with predicting demand one hour to 24 h in advance. It can help support short-term decisions such as economic dispatch of power plants, fuel purchases, and electricity market trading while addressing the grid’s real-time control and security from massive power outages.
The ability to accurately forecast demand one hour to a day ahead can help energy suppliers anticipate how much power to generate to meet real-time consumer demand most reliably and cost-effectively possible. Underestimating demand can lead to power outages and unreliable grid operation, while overestimating demand can result in energy wastage. Therefore, an accurate forecast can result in better energy management and significant supplier cost savings. However, short-term load forecasting can be challenging because the load exhibits highly nonlinear patterns that are difficult to model. In addition, several factors can affect the load, such as weather, season, time of the day, consumer behavior, and other random factors.
Three main methods have been proposed in the literature to solve this problem, which are (1) traditional statistical-based models, (2) machine learning-based models, and (3) deep learning-based models. The most common statistical methods used in the literature are autoregressive moving average (ARMA), autoregressive integrated moving average (ARIMA), exponential smoothing, linear regression, and the similar day approach. However, these methods are limited in learning the complex nonlinear interactions between the input and output variables. Therefore, they do not provide satisfactory results for such problems. On the other hand, machine learning methods can deal with the shortcomings of statistical-based models since they can model complex nonlinear mapping between inputs and outputs, learn hidden patterns in vast amounts of data, and offer scalability. Examples of machine learning methods widely used for STLF are Artificial Neural Networks (ANNs), decision tree regression, ensemble trees, random forest, support vector regression (SVR), and extreme learning machines (ELM).
Machine learning methods have been studied. The authors in [6] compared four machine learning approaches for estimating electricity demand in Cyprus between 2016 and 2017 with short to long-term analysis. Population, economic, and weather variables were introduced into the model to forecast electricity demand for the region. The study concluded that ANN and support vector machine (SVM) methods were superior to multiple linear regression [6]. Ref. [7] proposed an improved machine learning framework based on SVM and ELM. For this study, the hyperparameters were tuned with the Grid Search method. The authors agreed on the fast training and accuracy that ELM provided.
Recursive Neural Networks (RNNs) have become more established in the STLF field, with Long Short-Term Memory (LSTM) receiving increased attention. The authors in [8] proposed a new architecture based on RNN to forecast electricity demand for different time scales. The model was benchmarked against other established neural networks, i.e., backpropagation and LSTM. The results indicated that RNN had superior performance and was easier to train than LSTM. The authors in [9] first proposed an improved hybrid model based on LSTM and ELM to learn deep and shallow electricity patterns. The hybrid model performed the best after being benchmarked against classical ELM, LSTM, and SVR. The authors in [10] compared single versus deep-stacked LSTM neural networks with different activation functions to forecast electricity load one hour ahead, considering historical temperature and load data. The results demonstrated that the model with two stacked LSTM layers performed the best, with a MAPE of 1.53%. The researchers in [11] investigated two deep learning methods, LSTM and the Gate Recurrent Unit (GRU), benchmarked with ANN and ensemble trees. Deep learning provided the most stable and accurate performance. The work in [12] proposed an LSTM-based framework to predict short-term residential demand using open data from the Australia Smart Grid project.
LSTM was the most successful for individual and aggregated forecasts after being benchmarked against machine learning methods. A sequence-to-sequence (Seq2seq) architecture was investigated by [13]. The model was benchmarked against RNN, LSTM, and GRU methods. The Seq2seq model had superior performance, with a MAPE of 5.20%. Bi-LSTM has also been widely investigated in the literature. The authors in [14] proposed a novel Bi-LSTM network with an attention mechanism to predict load up to half an hour in advance. The proposed model performed better than the traditional Bi-LSTM, given that more weight is allocated to important information. The researchers in [15] proposed a stacked Bi-LSTM method to forecast day and week residential consumption in Scotland, using historical demand and weather features. Bi-LSTM delivered high accuracy, with MAPE ranging between 1.66% and 2.22% for the maximum demand week. The work in [16] found that deep networks based on Bi-LSTM did not improve performance. The authors in [17] later compared the performance of LSTM with two machine learning methods to solve single and multi-step forecasting. LSTM had superior performance, especially during the summer. In [18], the effectiveness of LSTM in delivering an accurate forecast of one hour and 24 h ahead was similarly demonstrated in Poland. The authors agreed that LSTM could support forecasting, especially for small power regions with irregular demand patterns.
Research has recently focused on Convolutional Neural Networks (CNN) for STLF. Ref. [9] demonstrated that temporal CNN could effectively provide a reliable forecasting model compared to SVR and Long Short-Term Memory (LSTM) networks. The authors in [19] proposed a novel Wavenet model that combines causal Convolutional Neural Networks (CNNs) and LSTM inspired by fine-tuning to support demand response programs. Although the model performed better than the benchmarked methods, the authors suggested considering weather and holiday indicators for future work. Researchers in [20] developed a hybrid CNN-LSTM model with clustering analysis to predict Australia’s electricity consumption. A remark was made on the robustness of the model to outliers. Ref. [21] recommended an integrated CNN-LSTM model to forecast the electricity load for Bangladesh. The CNN-LSTM model provided robust performance compared to LSTM, radial basis function network (RBFN), and Extreme Gradient Boosting (XGBoost). Finally, Ref. [22] introduced a novel parallel LSTM-CNN network to address the STLF problem in Smart Grids, in which the CNN and LSTM were trained separately. The LSTM-CNN model proved to be a good candidate. Regression models, on the contrary, did not perform well. The authors in [23] were among the first to explore 2D CNN for forecasting electricity demand, in which the data were processed using four channels. The model performed reasonably well on the test set and captured the trends, especially for holidays. Ref. [24] proposed a novel feature extraction framework based on 2D CNNs, with Singapore as a case study. The authors agreed that the model provided high feature extraction and was superior to other methods, such as ResNet. The authors in [24] recently suggested a model based on CNN-BiLSTM for Smart Grids at the customer level, using big datasets from Turkey. CNN performed better than the machine learning methods and handled the missing data.
Several authors are starting to investigate the impact of the COVID-19 pandemic on the performance of electricity forecasting models. The authors in [25] evaluated LSTM to forecast electricity demand for the Australian Energy Market, given the impact of COVID-19. The data were analyzed from January 2019 to August 2020. This study revealed that LSTM was very effective at learning about the drastic changes in electricity patterns caused by the lockdown. On the other hand, the researchers in [26] evaluated the performance of three models: ARIMA, traditional ARIMA, and ANN. The rolling ARIMA was the best model, obtaining a MAPE of 5.5% between March and May 2020. A remark was made on the ability of the model to perform well despite the high uncertainty caused by the pandemic. In [27], a graph convolutional network based on representation learning was introduced to model the impact of various COVID-19-related features (i.e., mobility, the daily number of confirmed cases) on electricity demand in Houston, Texas. While the model was found to be robust, the authors found that the encoded features were not able to capture the effect of the pandemic fully.
This paper involves forecasting short-term electricity demand, an important field of application in Smart Grids in this machine-learning era. This study aims to develop a forecasting model using a machine learning approach to predict hourly electricity demand. A real case study of Panama’s power system is presented to validate the model. This case study was significant for understanding how short-term forecasting can help energy managers deal with the day-to-day operations of large-scale power systems. We experimented with several machine learning models such as SVR, Random Forest, XGBoost, Light Gradient Boosting Machine, Adaptive Boosting, Bi-LSTM, GRU, and a deep learning regression model. The contributions of this paper are the following. First, this paper experimented with a large dataset from 2016 to 2019 to test and evaluate the performance of several models for forecasting electricity demand. Second, we incorporated important features for predicting electricity demand, such as temperature, relative humidity, and time lags. The results indicated that these features were significant for improving forecasting accuracy. Third, we evaluated the performance of two well-known deep learning models based on Bi-LSTM and GRU for predicting electricity demand in multiple time steps. This paper is organized as follows: Section 2 provides a high-level overview of the framework and describes the different methods used. Section 3 provides a more detailed description of the case study and the implementation of the framework with the case study that includes data collection, data analysis, and model architecture. Section 4 discusses the results obtained. Finally, Section 5 presents the conclusions of this study.

2. Framework with Short-Term Electricity Demand Forecasting

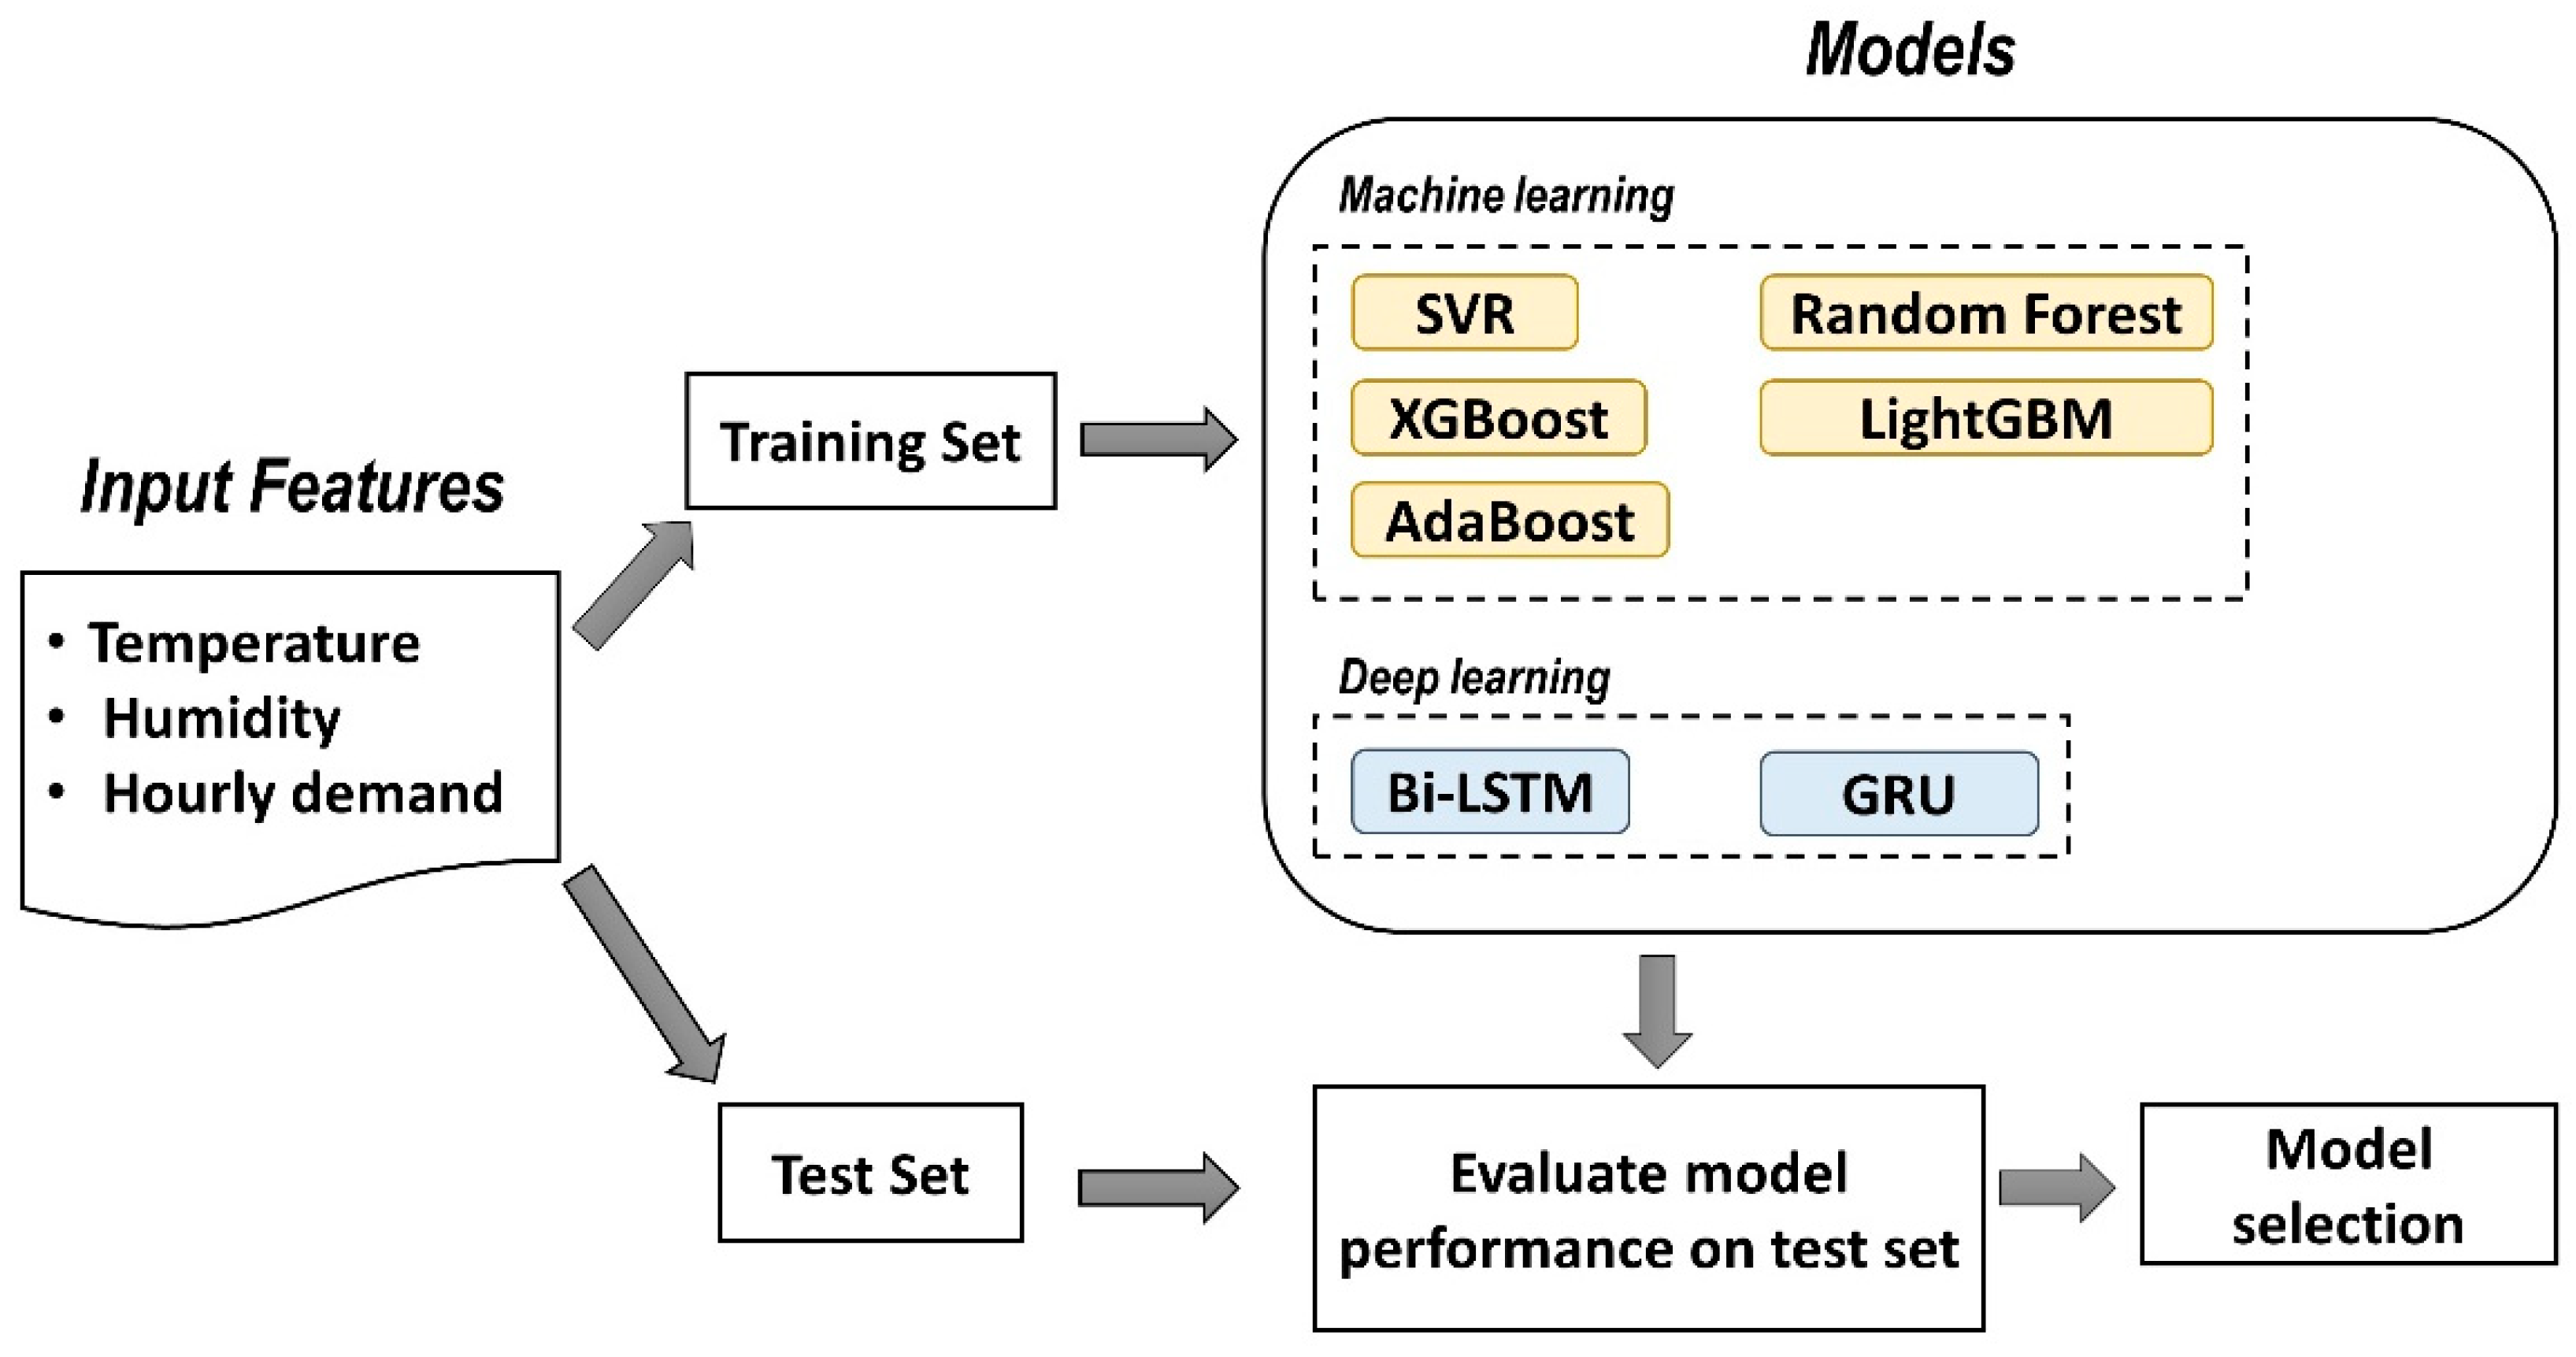
Figure 1 provides a high-level overview of the framework proposed for short-term load forecasting. It consists of machine learning and deep learning methods that will be evaluated and benchmarked for forecasting electricity demand one hour and 24 h in advance. The experiment consists of several steps, which are (1) data collection, (2) feature selection, (3) data preprocessing and transformation, (4) training of models, (5) evaluation of models on the test set, and (6) selection of the best model. The literature review indicated that weather variables are essential for improving the accuracy of electricity forecasting. Therefore, the second step required preprocessing the data to make them appropriate for building and training the models. The third step involves defining the hyperparameters for training the models. Once the models have been trained, the last step evaluates the model on a separate test set (unseen data) to obtain the predicted values.
These are the descriptions of the different methods utilized in the experiment.

2.1. Deep Learning (Regression)

KNIME (https://www.knime.com/ (accessed on 10 September 2021)) was the platform used to build the deep-learning regression model for predicting electricity demand. KNIME analytics platform is an open-source tool that allows users with minimum programming skills to build and train machine learning and deep learning models. It provides seamless access to open-source projects such as Keras, Apache Spark for big data processing, Python, and R. It provides a user-friendly interface that enables users to see the workflow and execution of tasks efficiently. KNIME has many built-in nodes to build decision tree models, logistic regression, deep learning (regression and classification), SVM, and CNN for image recognition.
For building deep learning models, Knime provides access to various frameworks such as Keras and Tensorflow. In addition, Knime has the advantage that it can support both structured and unstructured data. Therefore, Knime was among the software considered for this study.
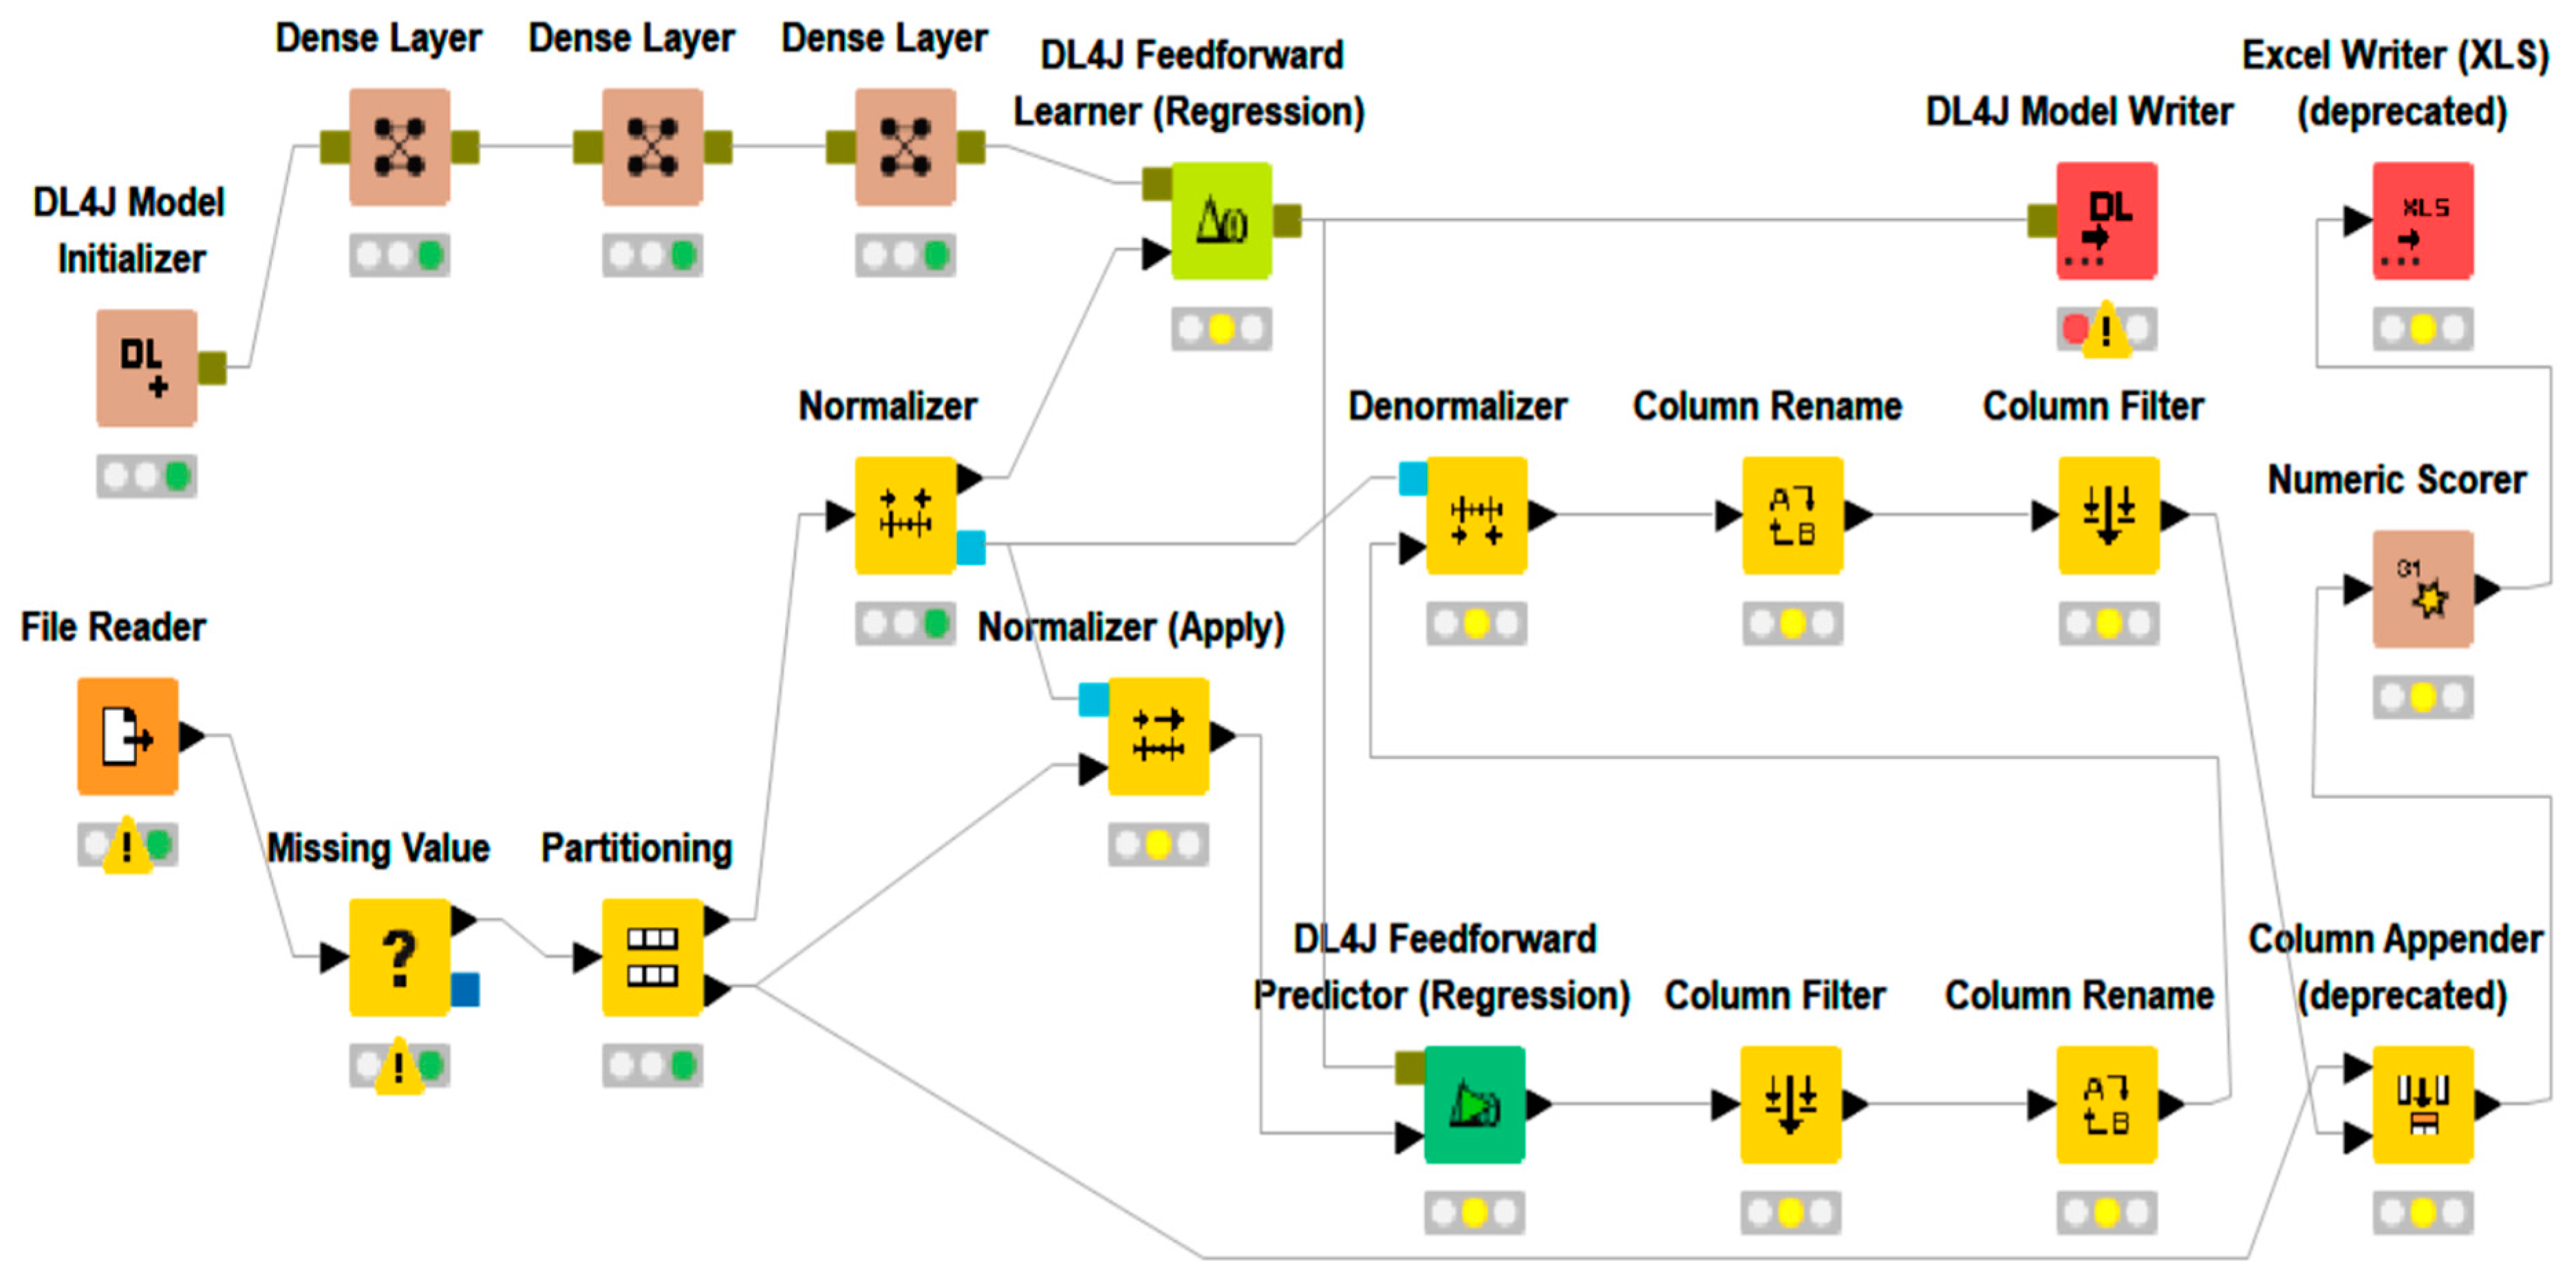
Figure 2 presents the workflow for building the deep learning model to predict hourly electricity demand. Deep learning regression mapped the nonlinear relationship between the input features and the output (electricity demand). Several input features were considered to predict demand: month, day of the week, hour of the day, temperature, and relative humidity. The first node of the workflow is the File Reader, which reads the .csv file that contains the input data. The dataset is then divided into a training (80%) and test set (20%) using the Partitioning node. Next, the training data are normalized between 0 and 1 using the Normalizer node. The test set was then normalized according to the normalization parameters learned from the training set using the Normalizer (Apply) node. It was important to normalize the data since all the input features have different scaling ranges, which can affect the training of the machine learning models. Therefore, normalizing the data between 0 and 1 makes each input feature equally important.
For building the deep learning models, four nodes are needed, which are (1) DL4J Model Initializer, (2) Dense Layer, (3) DL4J Feedforward Learner (Regression), and DL4J Feedforward Predictor (Regression). First, the DL4J Feedforward Learner node is used for training the models. This node needs many hyperparameters, such as the batch size, the number of epochs, the learning rate, and the optimization algorithm. Once this node is executed, the DL4J Feedforward Predictor predicts on the test set. Finally, the data are denormalized, and the model performance is evaluated using the Numeric Scorer node.

2.2. Bidirectional LSTM (Bi-LSTM)

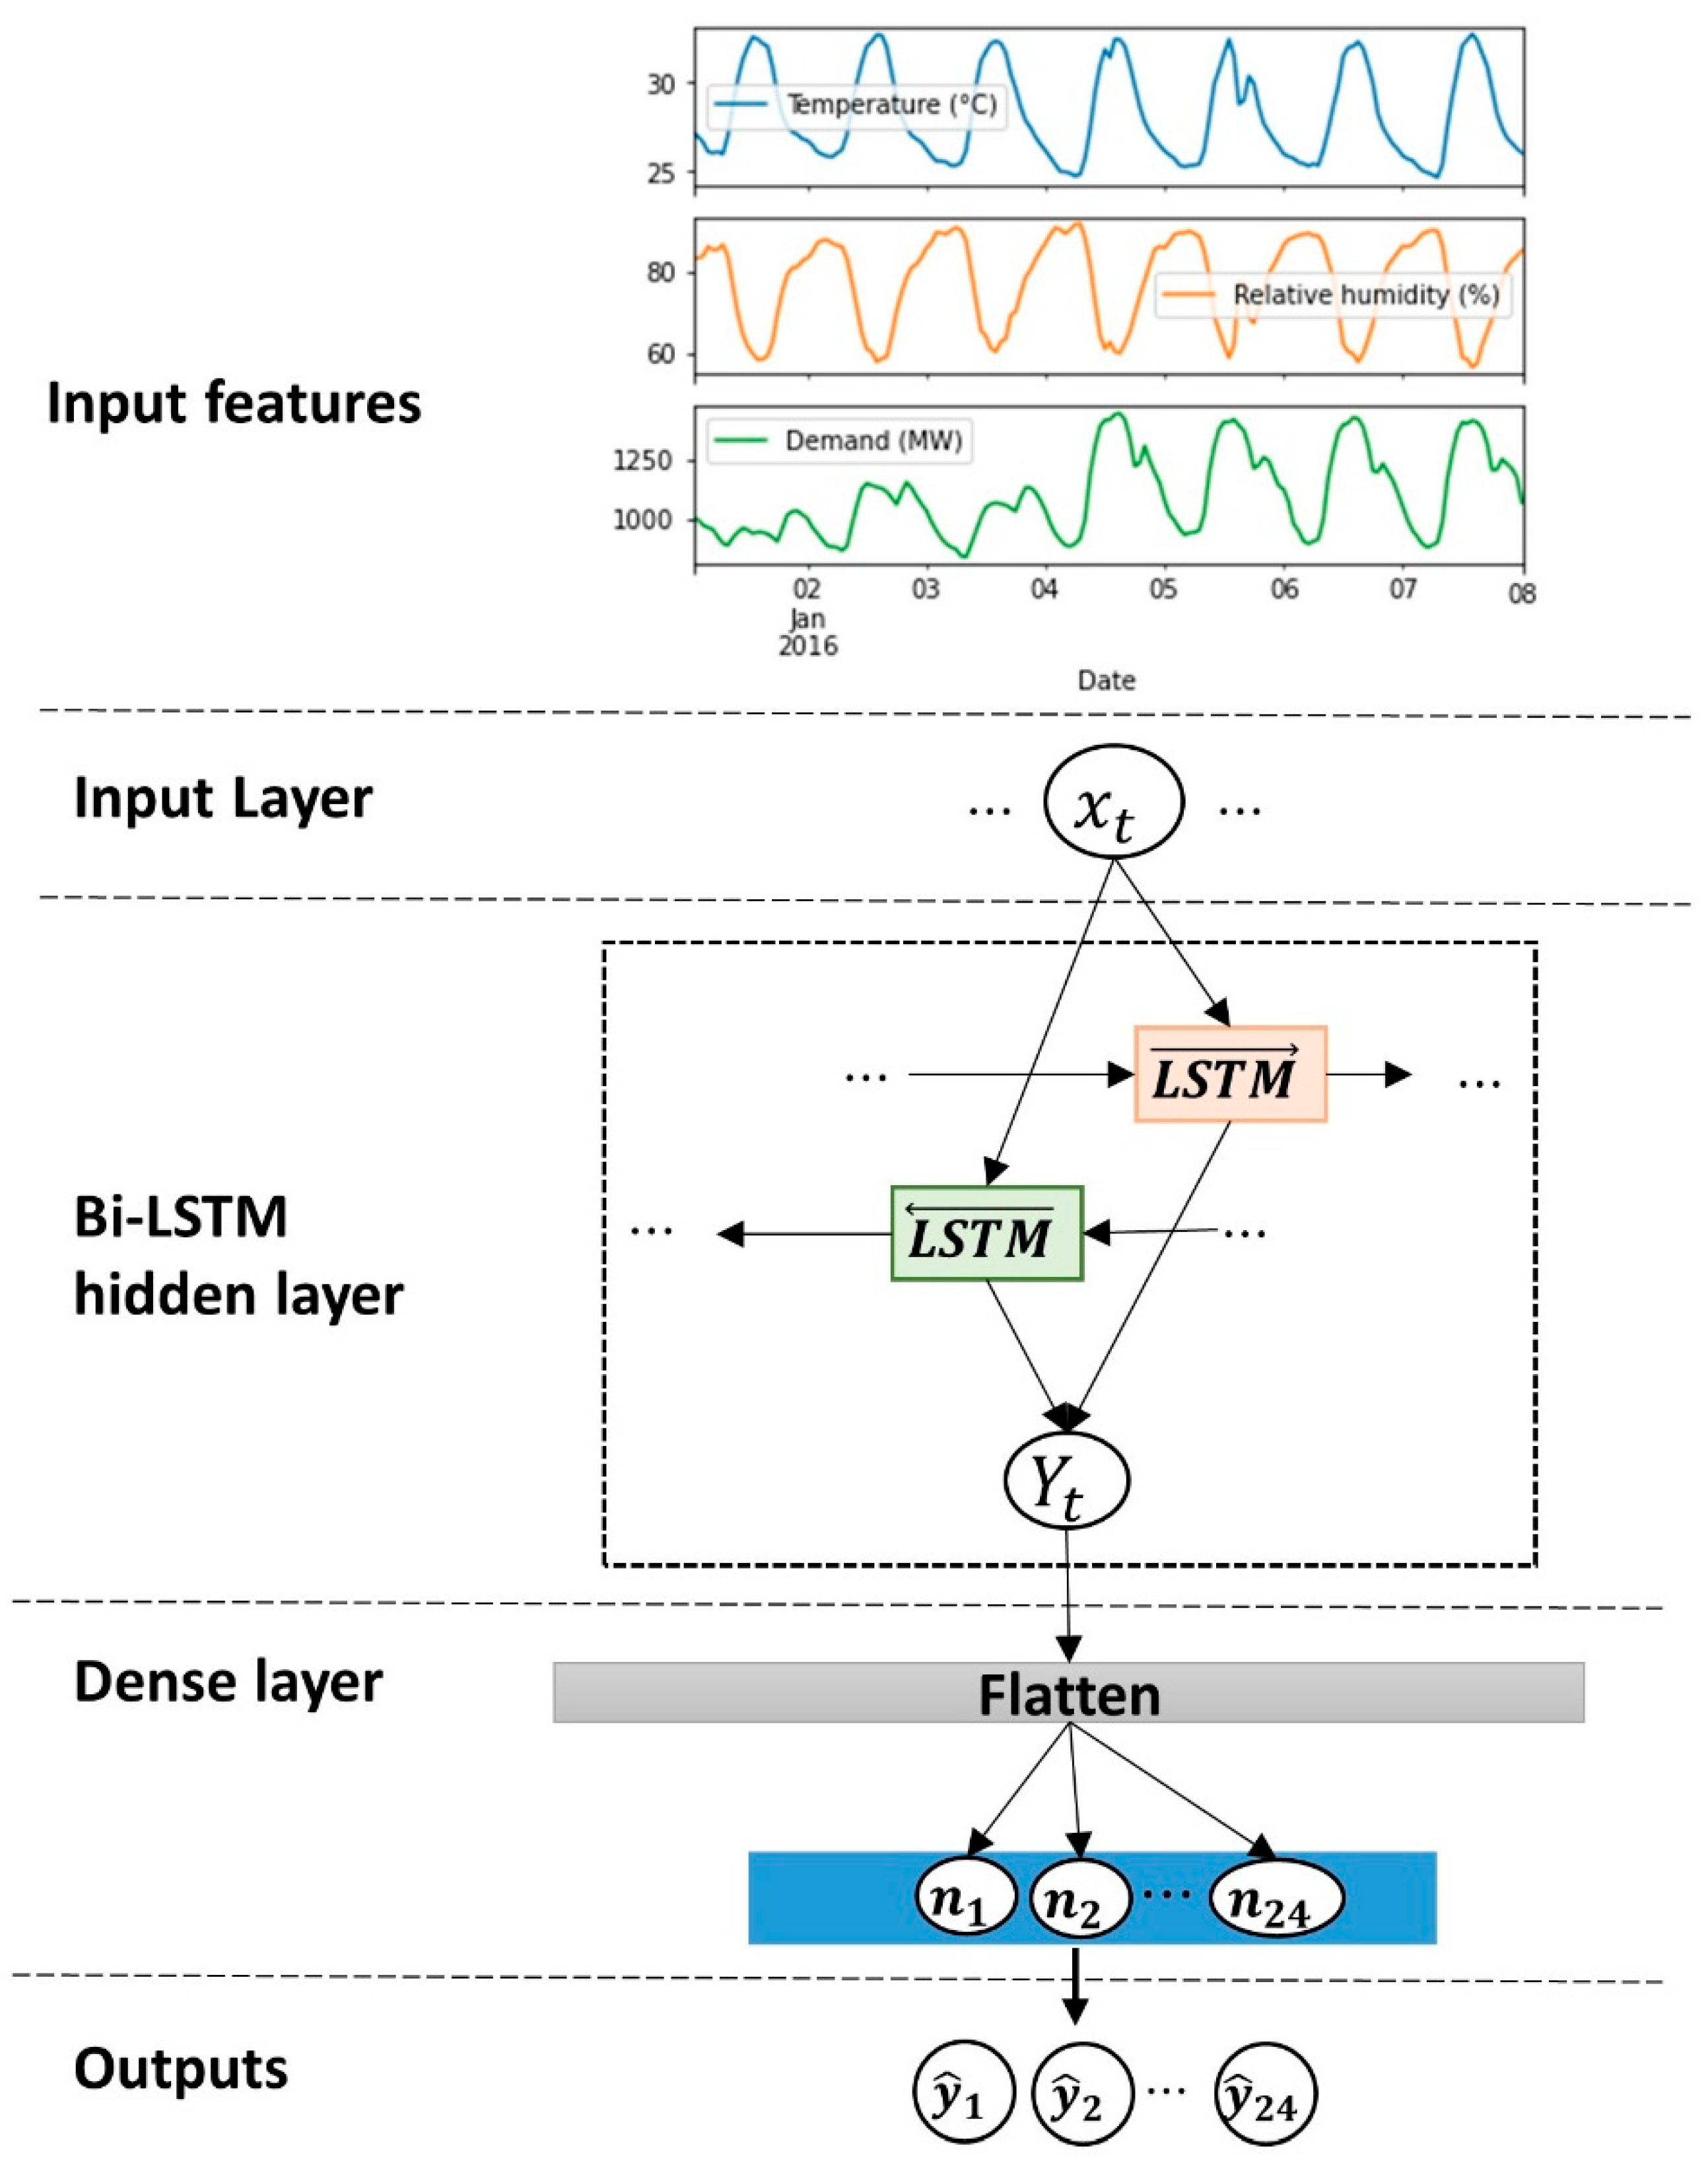
LSTM networks present a limitation in that they can only take advantage of past information but not the future context. To improve the performance of LSTM, Bi-LSTM networks were proposed to deal with this shortcoming. These consist of two independent LSTM layers that run in opposite directions, forward and backward, while connected to the same output, as illustrated in Figure 3.
The forward L S T M layer processes the information from the past sequences in the forward direction and produces the hidden forward states ( h 1 , , h n ) as expressed in Equation (1), while the backward L S T M layer obtains information from the future context, generating the backward hidden states ( h n , , h 1 ), demonstrated in Equation (2). The forward and backward hidden states are concatenated at each time step to generate the final vector representation h t as computed in Equation (3).
h t = L S T M ( h t 1 ,   x t ,   c t 1 ) ,       t [ 1 , T ]
h t = L S T M ( h t + 1 ,   x t ,   c t + 1 ) ,       t [ T , 1 ]
h t = ( h t ,   h t )
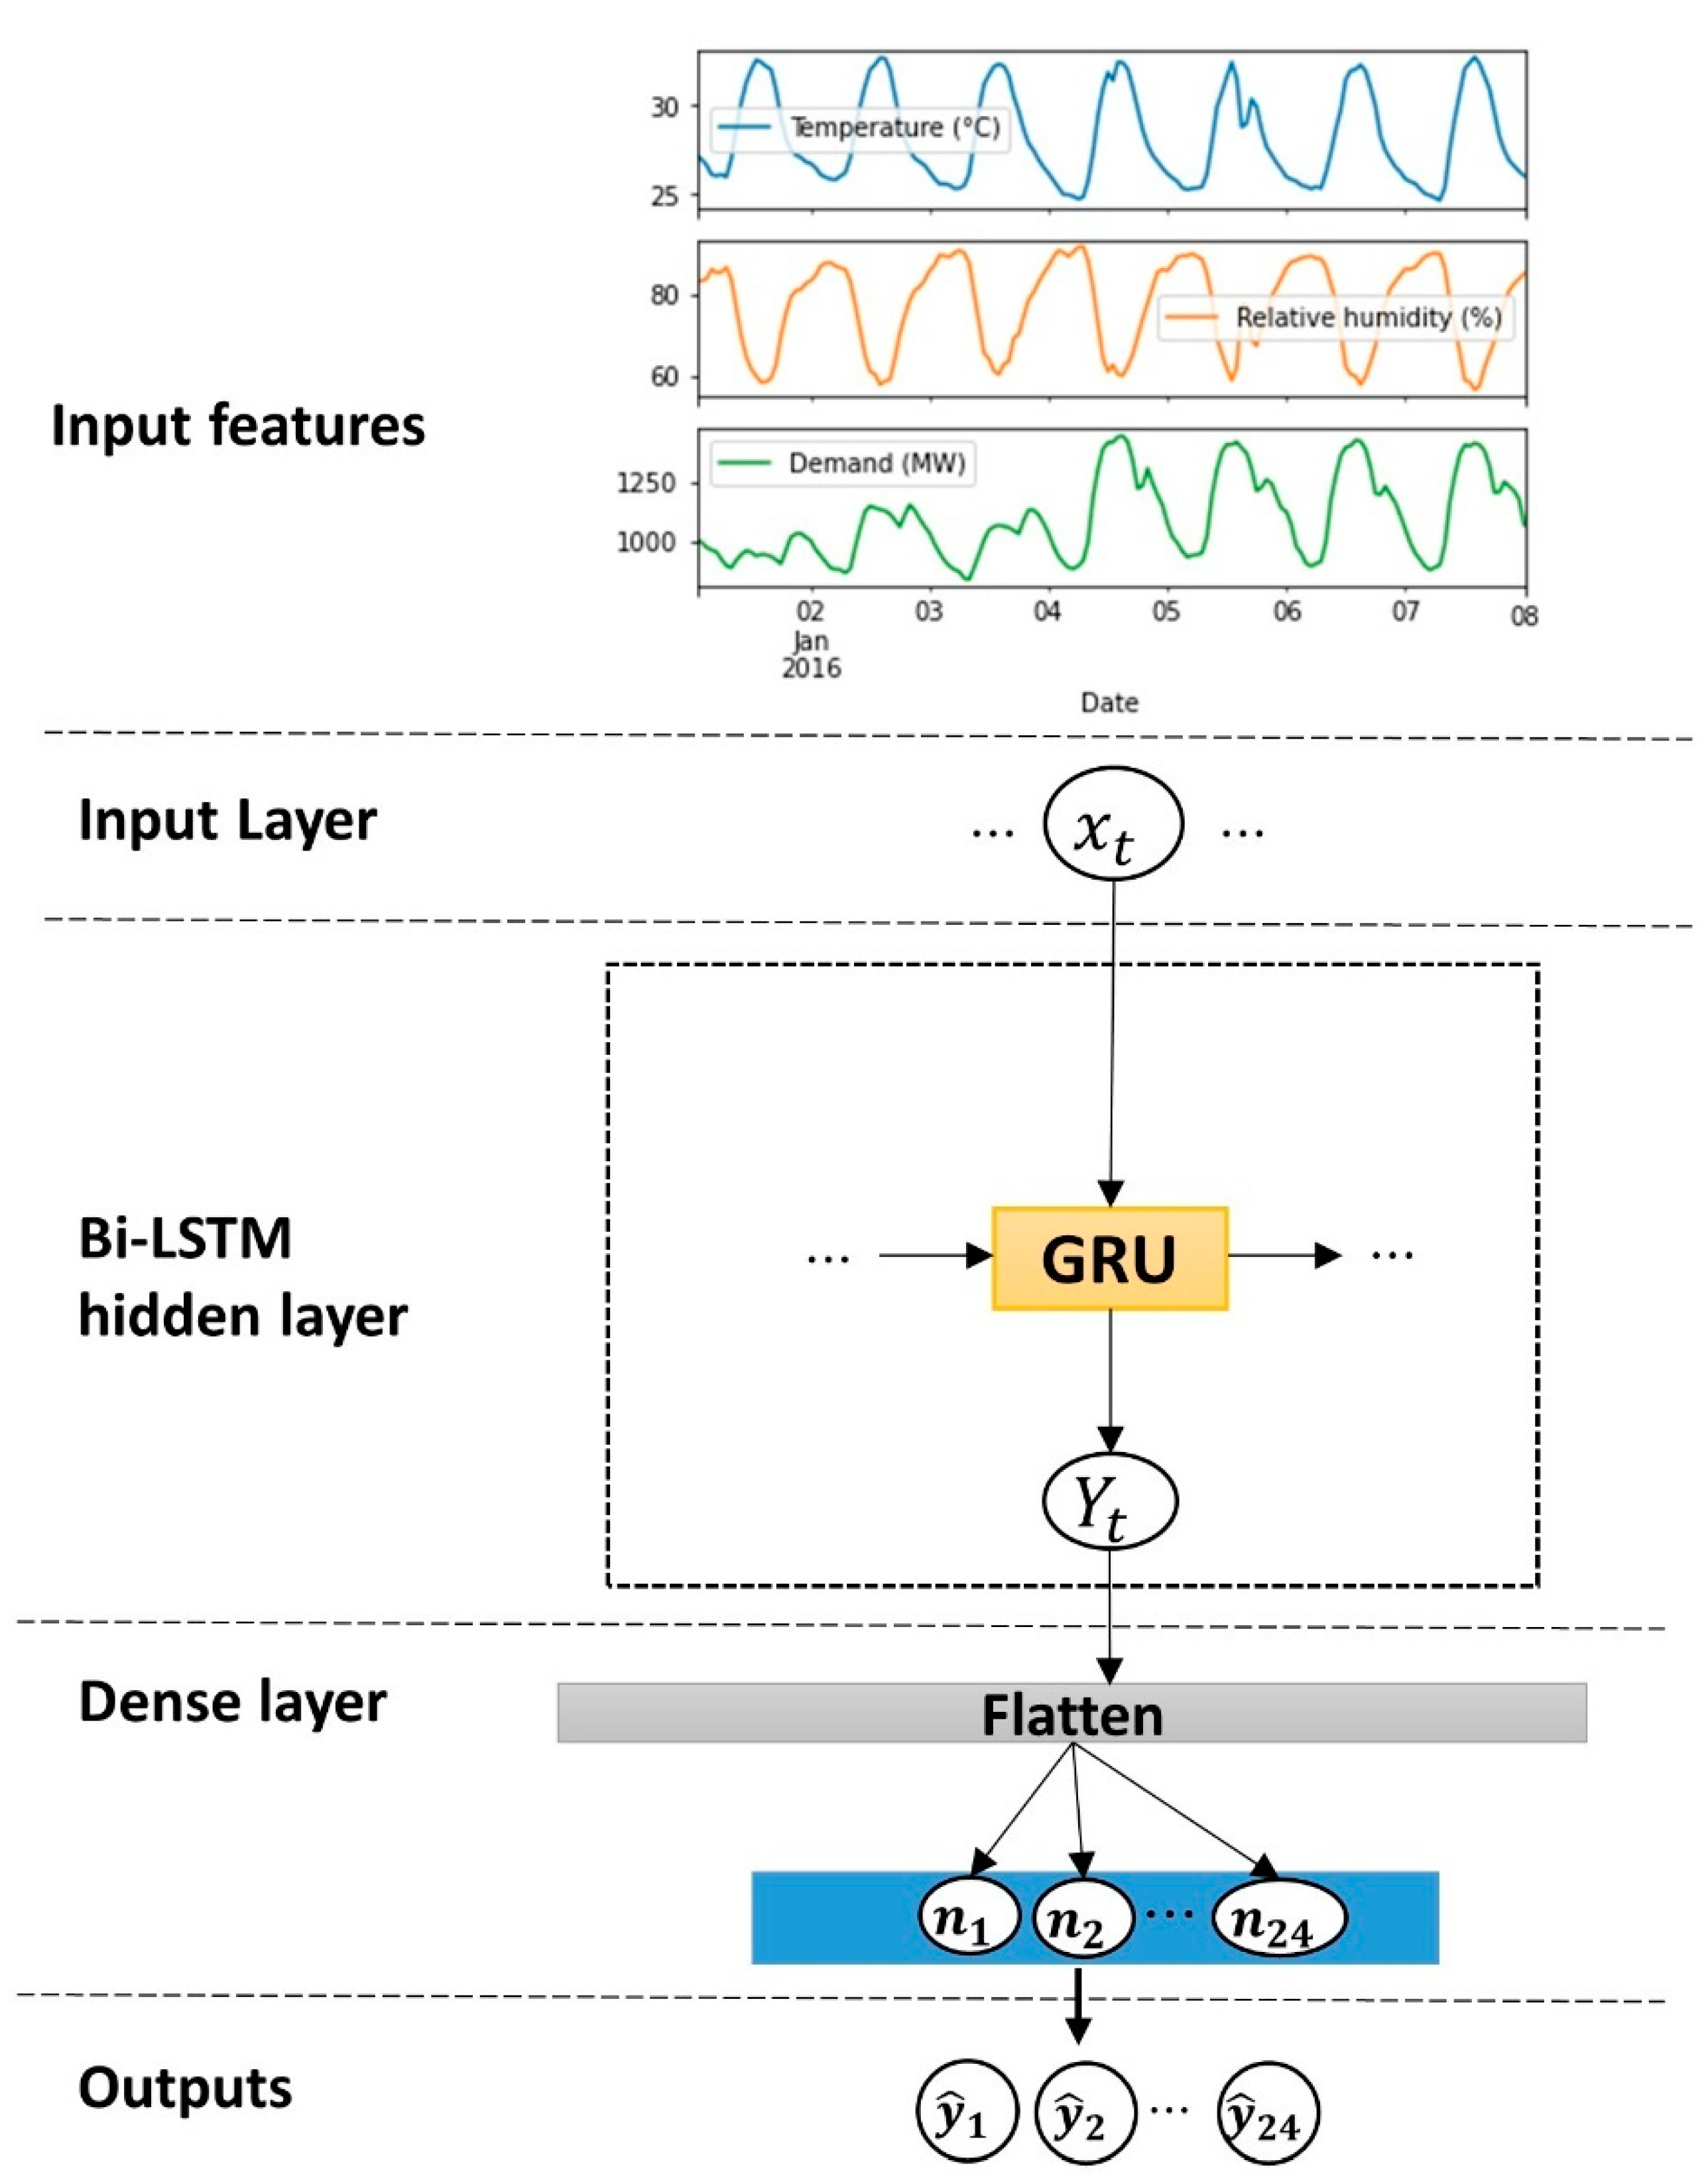
As observed in Figure 3, the architecture of the Bi-LSTM model for predicting electricity demand consists of an input layer, a hidden layer, and an output layer. The first layer is the input layer, which receives the features as input vectors. These features contain important sequential data such as the historical temperature, humidity, and electricity demand that the successive layers will process to extract meaningful information. The input features are first passed on to the Bi-LSTM hidden layer that consists of two LSTM layers in opposite directions, which processes the input sequence data in both forward and backward directions to learn richer information. A flattening layer is then used to flatten the output of the hidden layer to create a single long feature vector. Lastly, a fully connected dense layer of 24 hidden neurons is used to output the 24 hourly predictions for the electricity demand.

2.3. Gated Recurrent Unit (GRU)

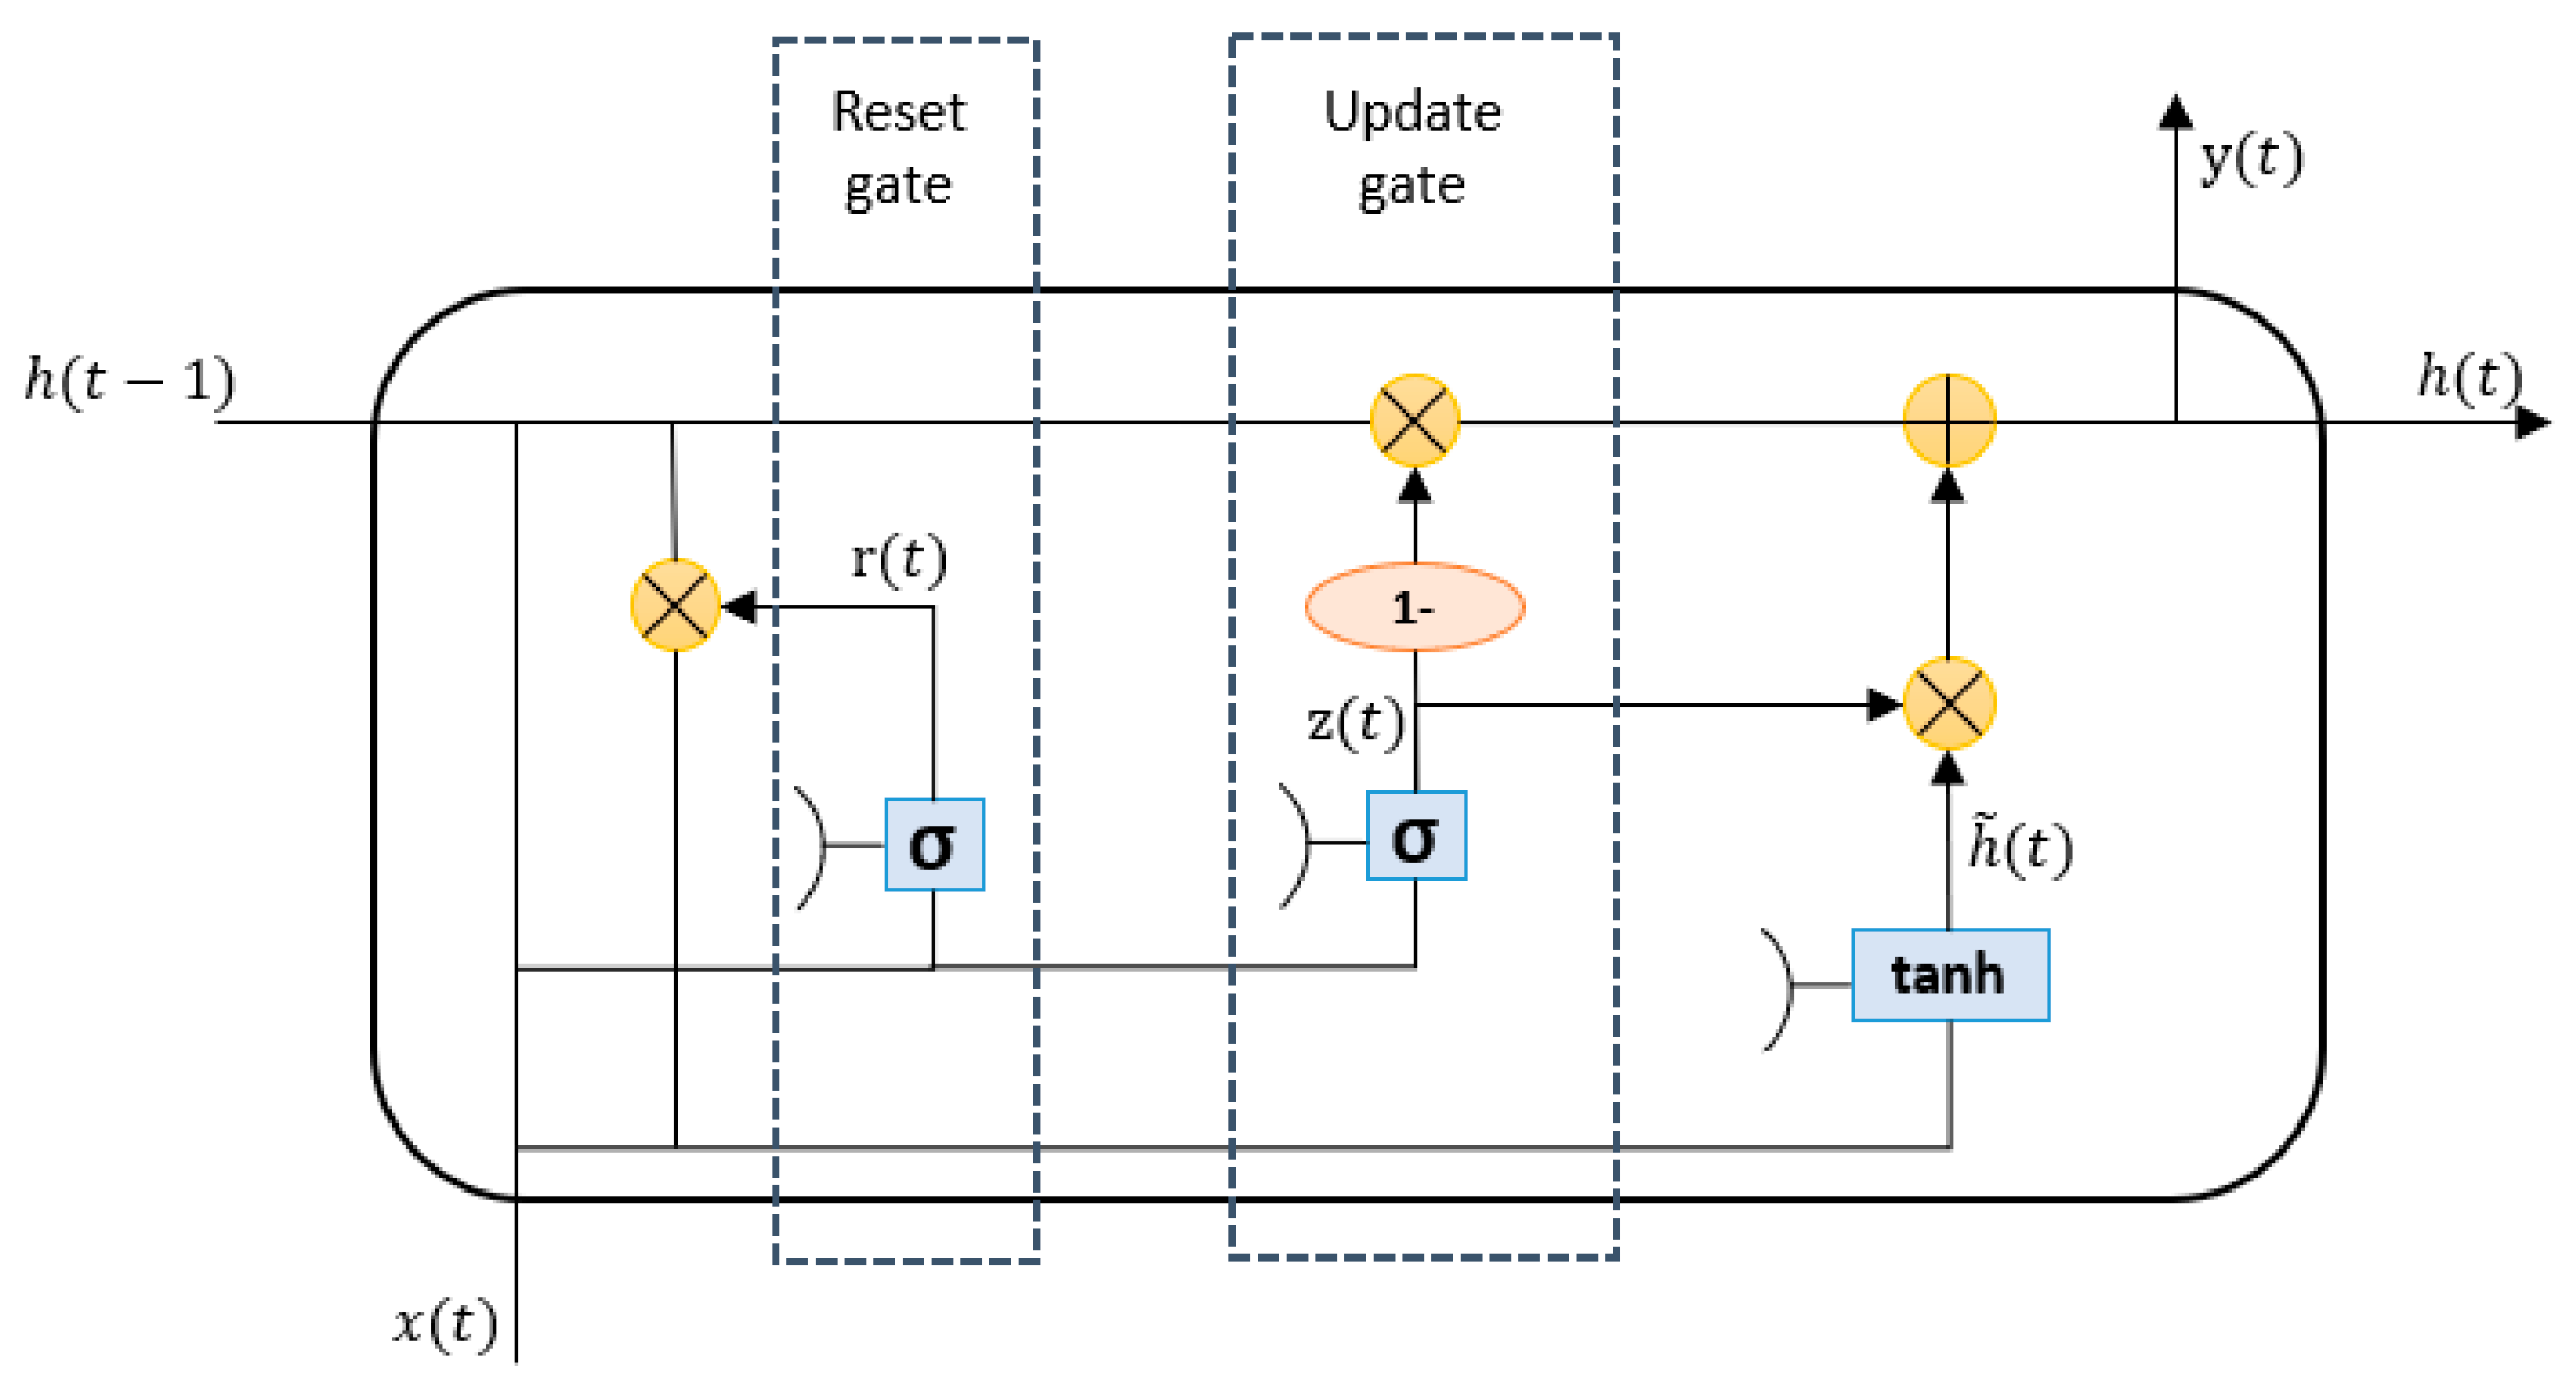
GRU is another type of RNN. The critical difference between the GRU and LSTM is that the GRU does not have a cell state and only has two gates, which are the update gate z t and reset gate r t , as observed in Figure 4. Therefore, it provides the ease of training a model since they are a more straightforward representation of the LSTM. Instead, the GRU has the hidden state h t that runs through the top of the cell, where the hidden state information is updated at each time step through a gating mechanism. The GRU takes two entries, which are the previous hidden state h t 1 and current input x t . These are processed by two gates that determine what information is helpful to update the hidden state.
The reset gate reduces the past information by deciding how much of the previous hidden state should be kept. First, the entries h t 1 and current input x t are combined and passed through the sigmoid function that outputs the values between 0 and 1 in Equation (4). This value is then multiplied by h t 1 (Equation (6)) to decide what information should be discarded, where a value closer to 0 means to forget and a value closer to 1 means to keep.
The update gate controls how much Information from the past is used to compute the new hidden state h t . To do so, h t 1 and x t are combined and passed through the sigmoid function that outputs the values between 0 and 1 in Equation (5). This value is then subtracted from 1 and multiplied by h t 1 in Equation (7) to decide how much information should be updated. The candidate values h ˜ t are calculated in Equation (6), which will be used to compute the final hidden state h t .
r t = σ ( W r h h t 1 + W r x x t + b r )
z t = σ ( W z h h t 1 + W z x x t + b z )
h ˜ t = tan h ( W h ˜ h ( r t · h t 1 ) + W h ˜ x x t + b z )
h t = ( 1 z t ) · h t 1 + z t · h ˜ t
in which W r h , W r x , and b r represent the parameters of the reset gate and W z h , W z x , and b z . Figure 5 demonstrates the architecture of the GRU model for predicting electricity demand.

2.4. Extreme Gradient Boosting (XGBoost)

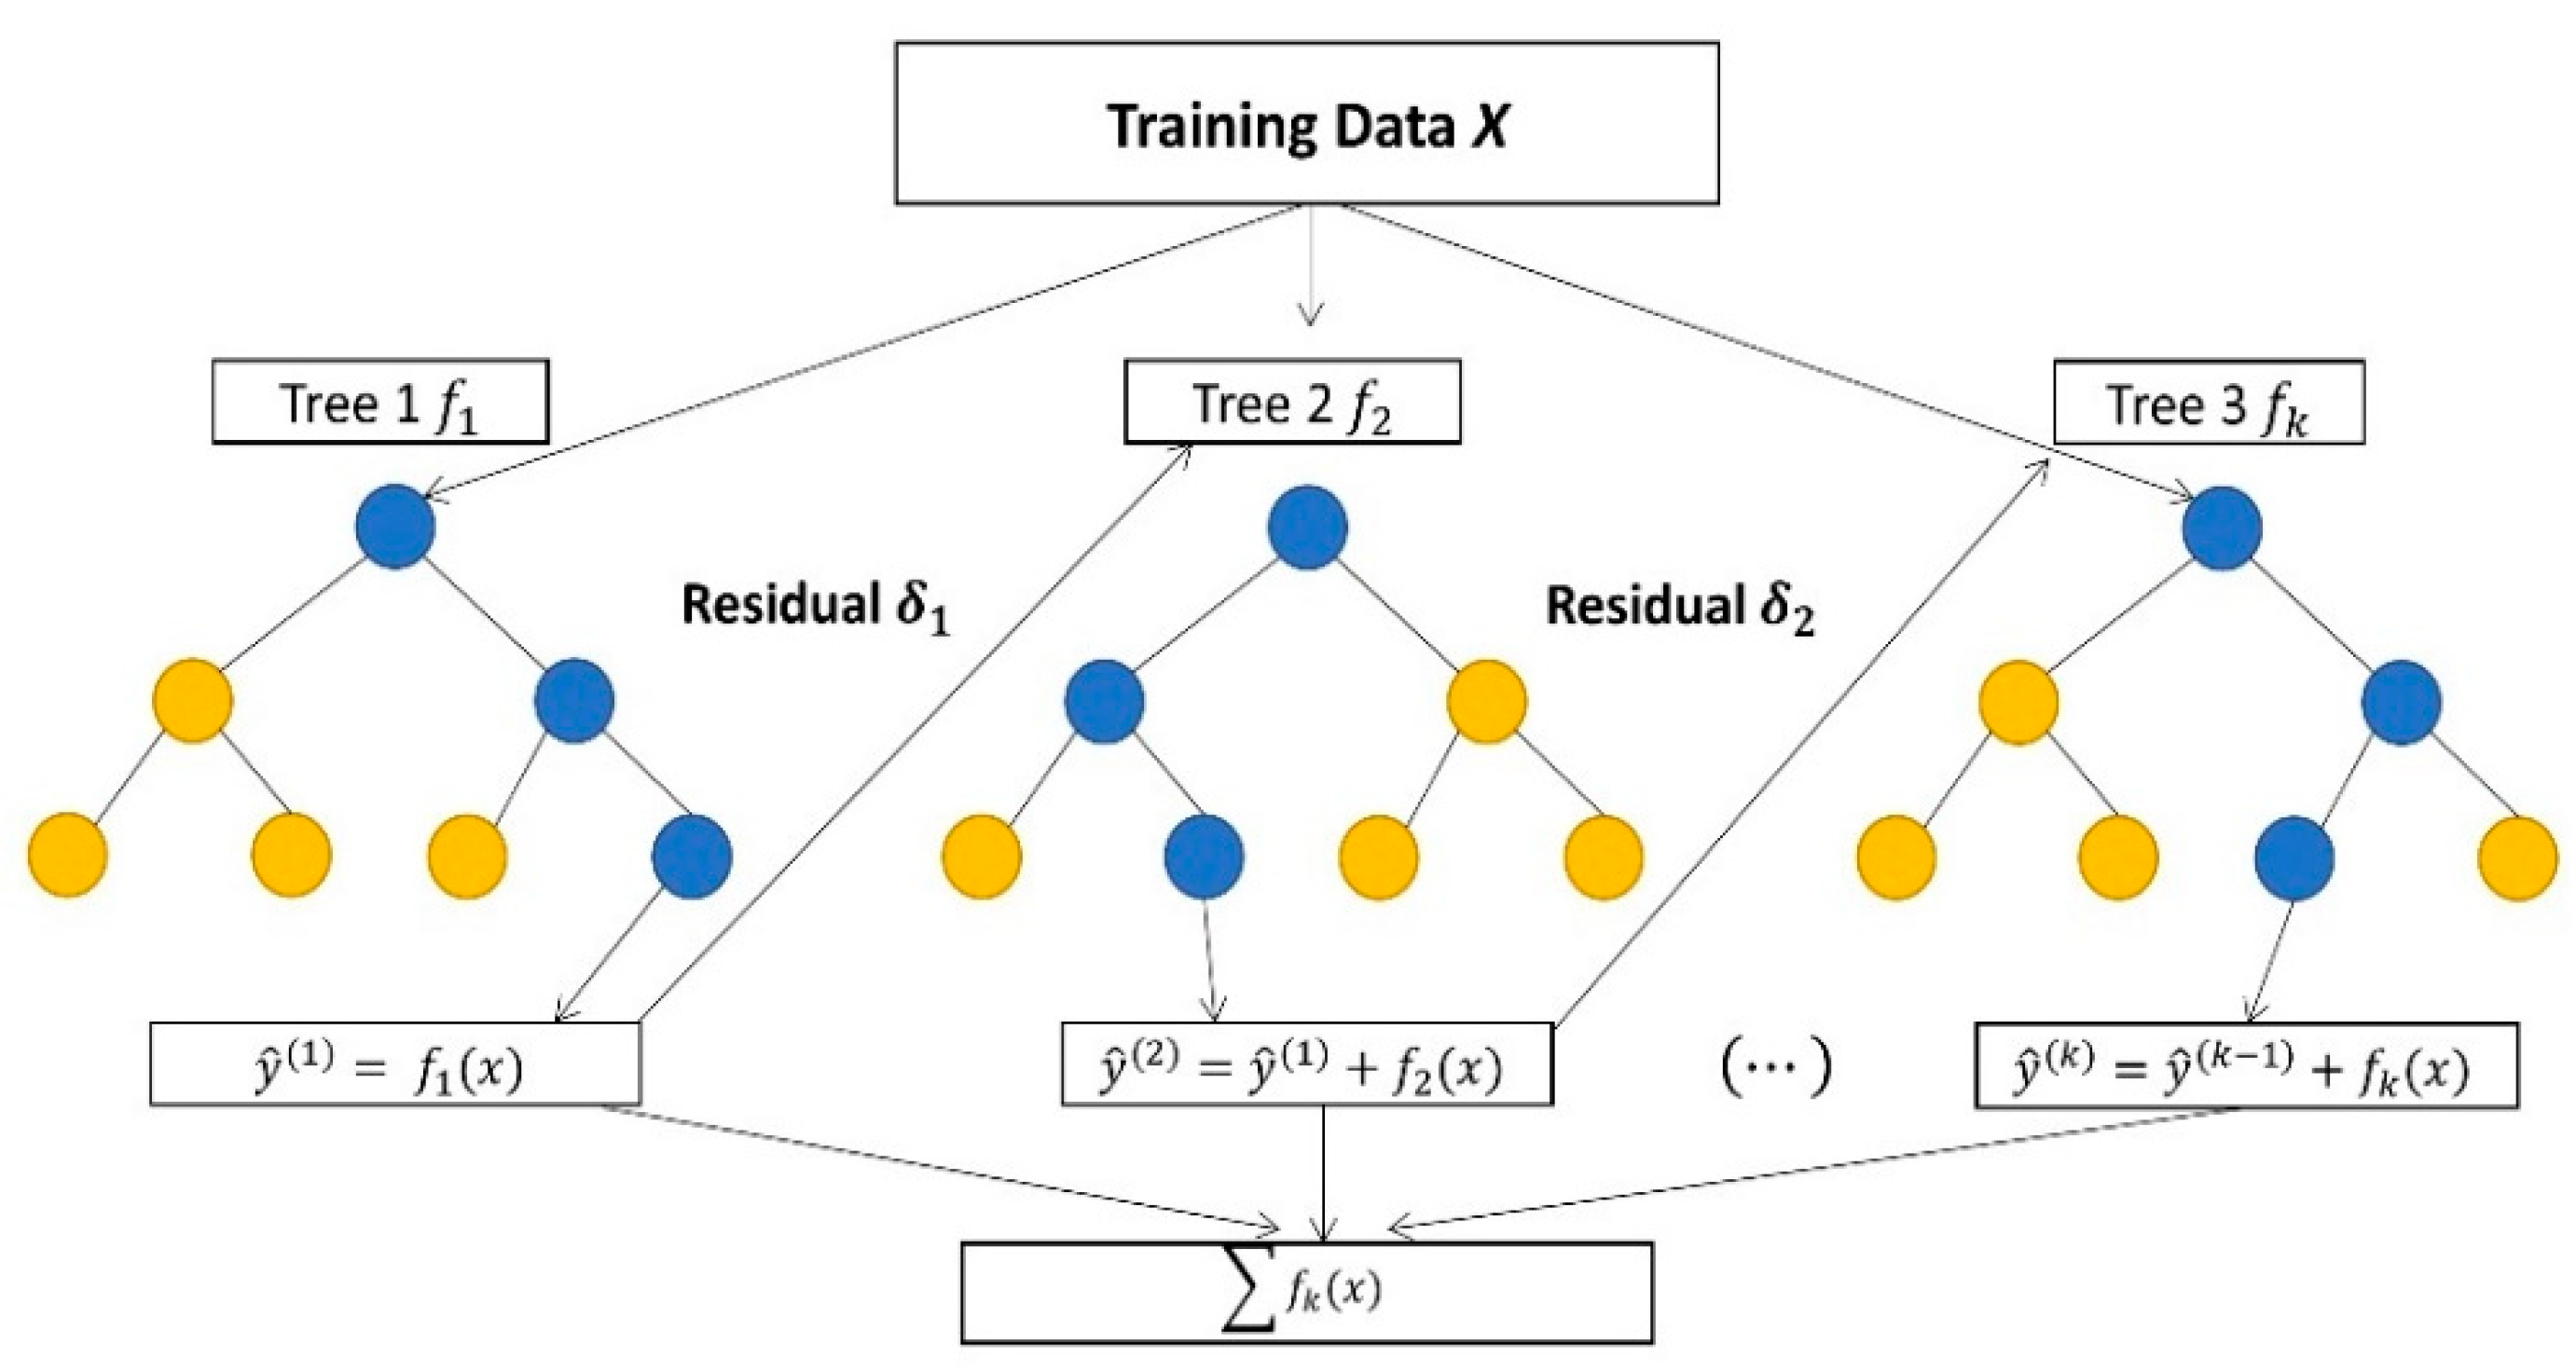
Extreme gradient boosting (XGBoost) is an ensemble machine learning method based on gradient boosting. It has become popular due to its success in Kaggle competitions. It uses a regularization term that helps to improve model generalization and overfitting. Some advantages of XGBoost are scalability, cache optimization, and the handling of missing data. In addition, XGBoost can be run on distributed platforms such as Spark to accelerate the training of massive datasets. In boosting, the decision trees are built sequentially until no improvements can be made, as demonstrated in Figure 6. XGBoost consists of several steps:
  • First, the algorithm makes an initial prediction by taking the average of the data.
  • The residuals are calculated based on the predicted and target values.
  • Then, the first decision tree is built to predict the residual.
  • The residual is multiplied by the learning rate and added to the initial prediction to achieve a new prediction.
  • The residual is recalculated for the new predictions, and the second decision tree is built to predict the new residuals.

2.5. Adaptive Boost (AdaBoost)

Adaptive Boosting (AdaBoost) is an improved ensemble machine learning model that combines multiple weak learners to form a strong learner. It builds weak learners sequentially, often decision trees based on one node and two leaves known as stumps. AdaBoost aims to improve weak learners’ performance by assigning more weight to the samples incorrectly predicted or classified so that the subsequent base learner can focus more on them.

2.6. Random Forest

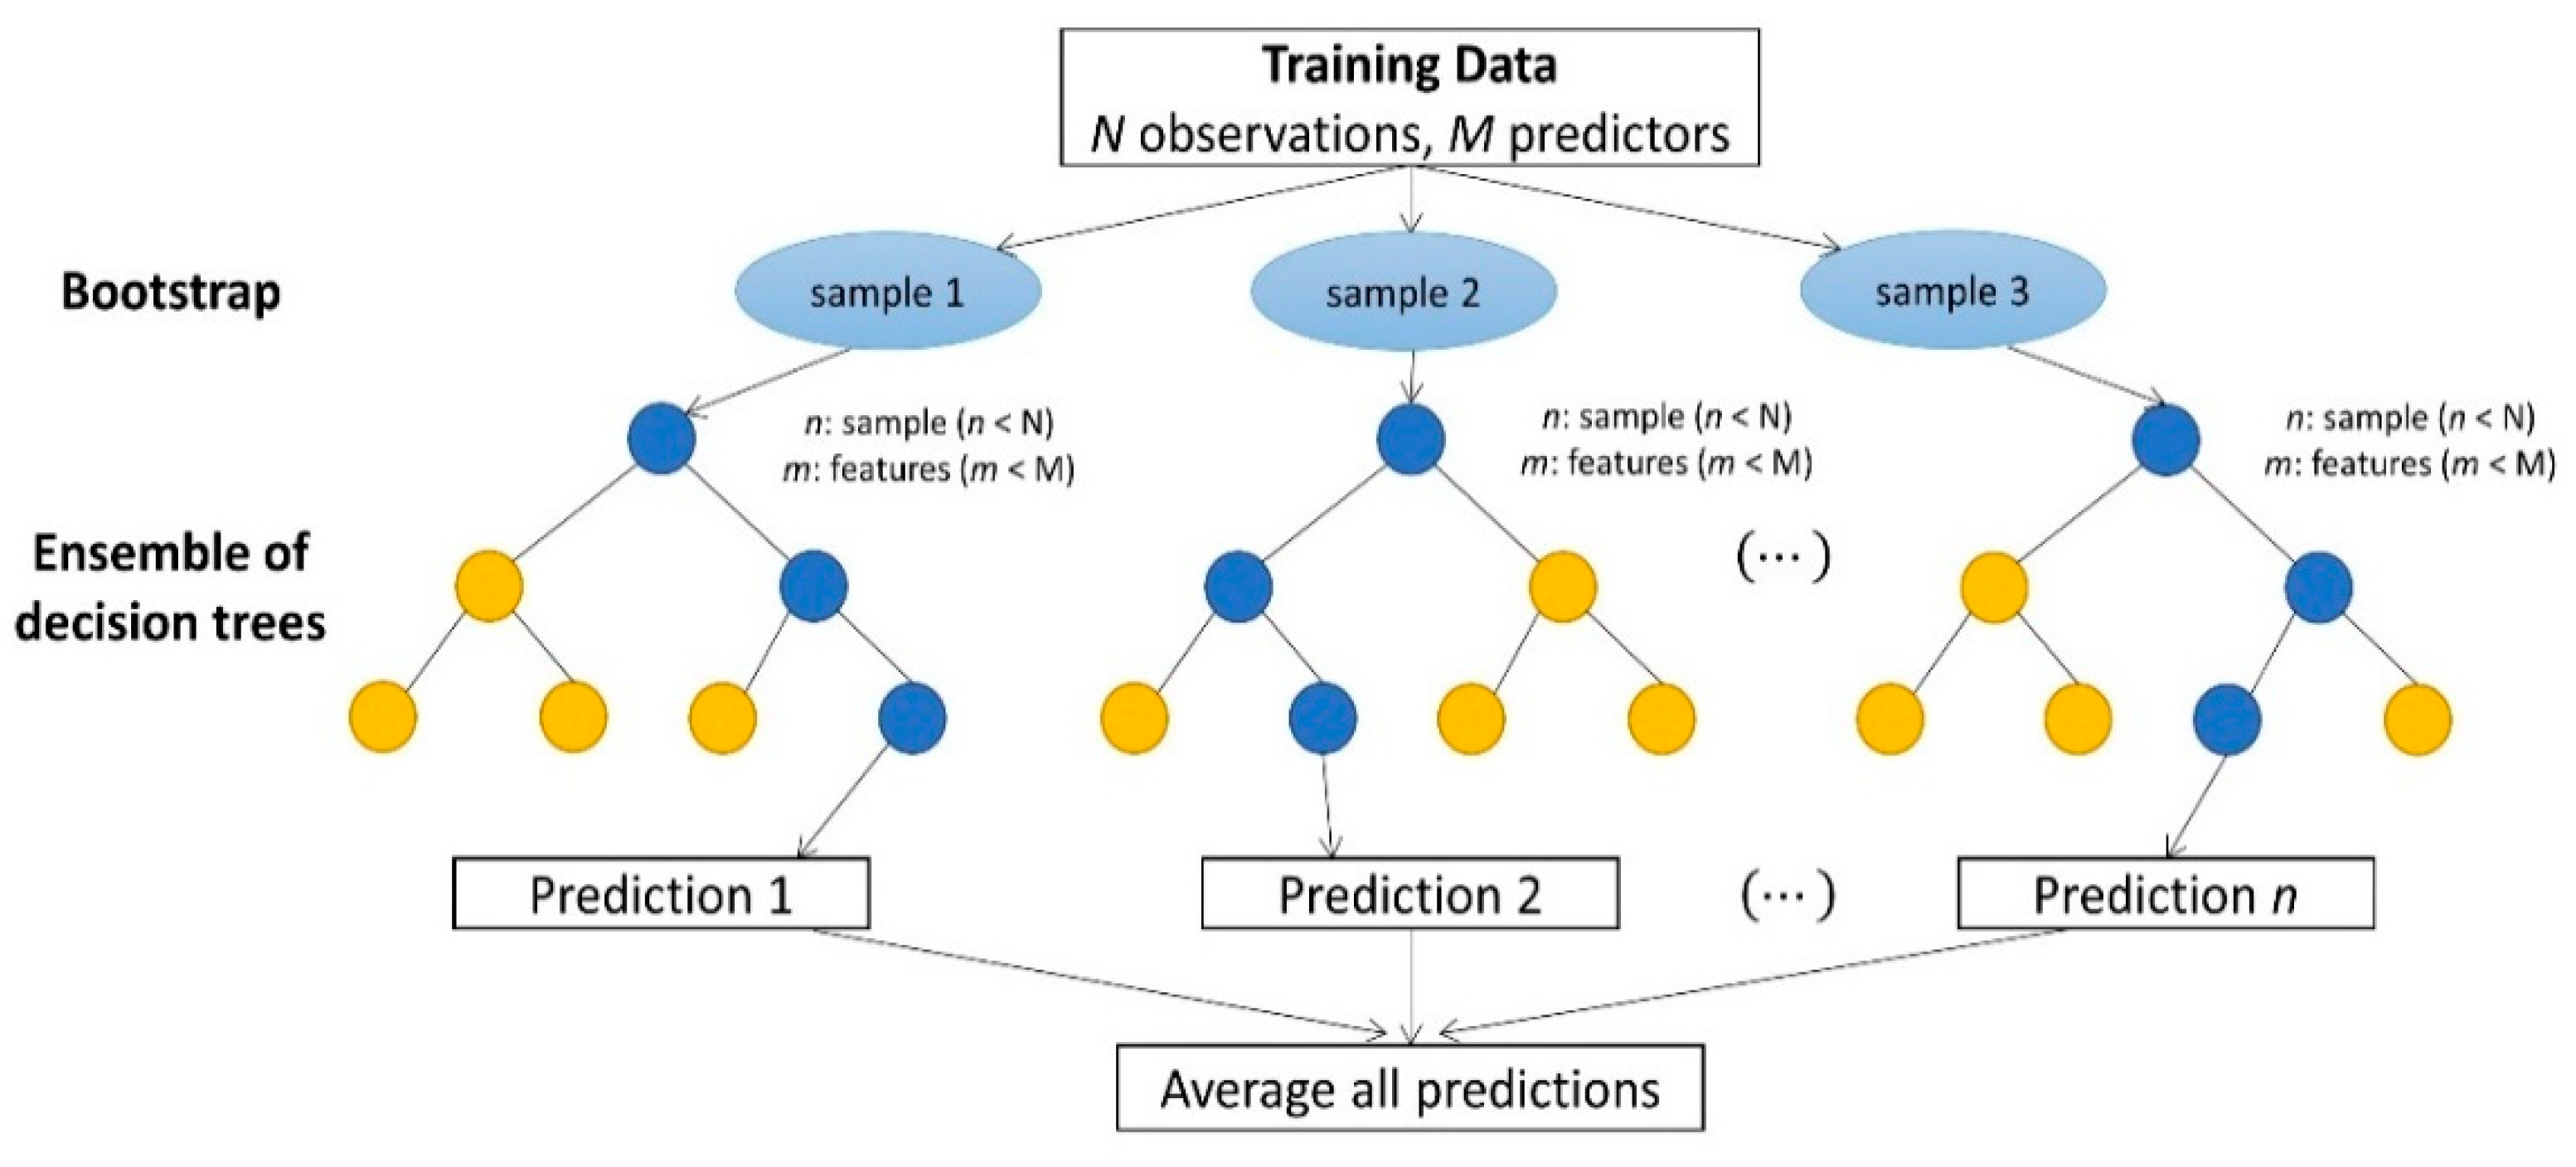
Random forest is a popular algorithm widely used for classification and regression problems. It is an ensemble machine learning method that trains several K decision trees (base learners) based on a bagging technique called bootstrap aggregation. First, n samples are taken from the training data using row and feature sampling with replacement. Therefore, only some of the features m<M of the training data will be used as predictors (see Figure 7). Next, each decision tree will be trained on the particular sample. Then, a data point from the test set is given to each corresponding decision tree to predict. Finally, the predictions of each decision tree are aggregated, resulting in the final output.

2.7. Light Gradient Boosting Machine (LightGBM)

LightGBM is a popular gradient-boosting decision tree. It was introduced by [28] to solve scalability issues and train large datasets with high feature dimensions. Therefore, it is a highly efficient gradient-boosting algorithm that has become more popular in training large datasets with low memory usage.

3. Case Study

Panama’s electric grid is a complex system with the features mentioned above. Therefore, it will be used as a case study to help us understand the complexity of managing large-scale power systems. Panama is a relatively small country with a population of more than 4.2 million. It is described as one of the fastest-growing economies in Latin America. Panama’s electric grid has been described as a reliable system that has expanded its network capacity to meet its growing consumer demand over the past years. Panama’s electric grid is undergoing a rapid transformation as it starts integrating more renewable wind and solar into the grid. Panama has set high goals to promote more renewable energy projects to reduce environmental impact and contribute to global sustainability. For years, the country has relied on a balance of hydroelectric and thermal power plants to meet consumer demand. However, thermal power plants present a disadvantage that they have high emissions and operating costs; therefore, the grid cannot entirely depend on these sources. Hydroelectric plants also create a problem during the dry season since there is insufficient water to fill the reservoirs, producing less energy. Therefore, Panama has decided to diversify its energy matrix with more sustainable energy sources such as wind, solar, and natural gas to meet customer needs.
Similar to many countries worldwide, Panama faces challenges operating the power grid reliably and sustainably due to changes in supply and demand patterns. The electric grid has evolved into a more complex network of energy suppliers that serves a wide range of growing consumers, such as residential, commercial, and large clients with different consumption patterns. According to the National Secretary of Energy, Panama has an average of 1,152,300 electricity clients as of 2019. The electricity demand has exhibited an upward trend over the years, driven by the increase in population and foreign investments that have boosted the country’s economic growth.

3.1. Data Collected for the Case Study

The data collection process involved open relationships with several entities in Panama. Some of the data were available to the public, while these organizations provided others. Different types of information were collected to build and validate the models, as demonstrated in Table 1.
This study collected historical data on electricity demand for Panama’s power system from January 2016 to October 2019. The data were provided as an excel file containing 33,600 data points of hourly demand collected from the commercial measurement systems. Each data point represents the total hourly demand of Panama’s different electricity consumption sectors, including residential, industrial, commercial, big clients, government use, and others.

3.2. Data Analysis

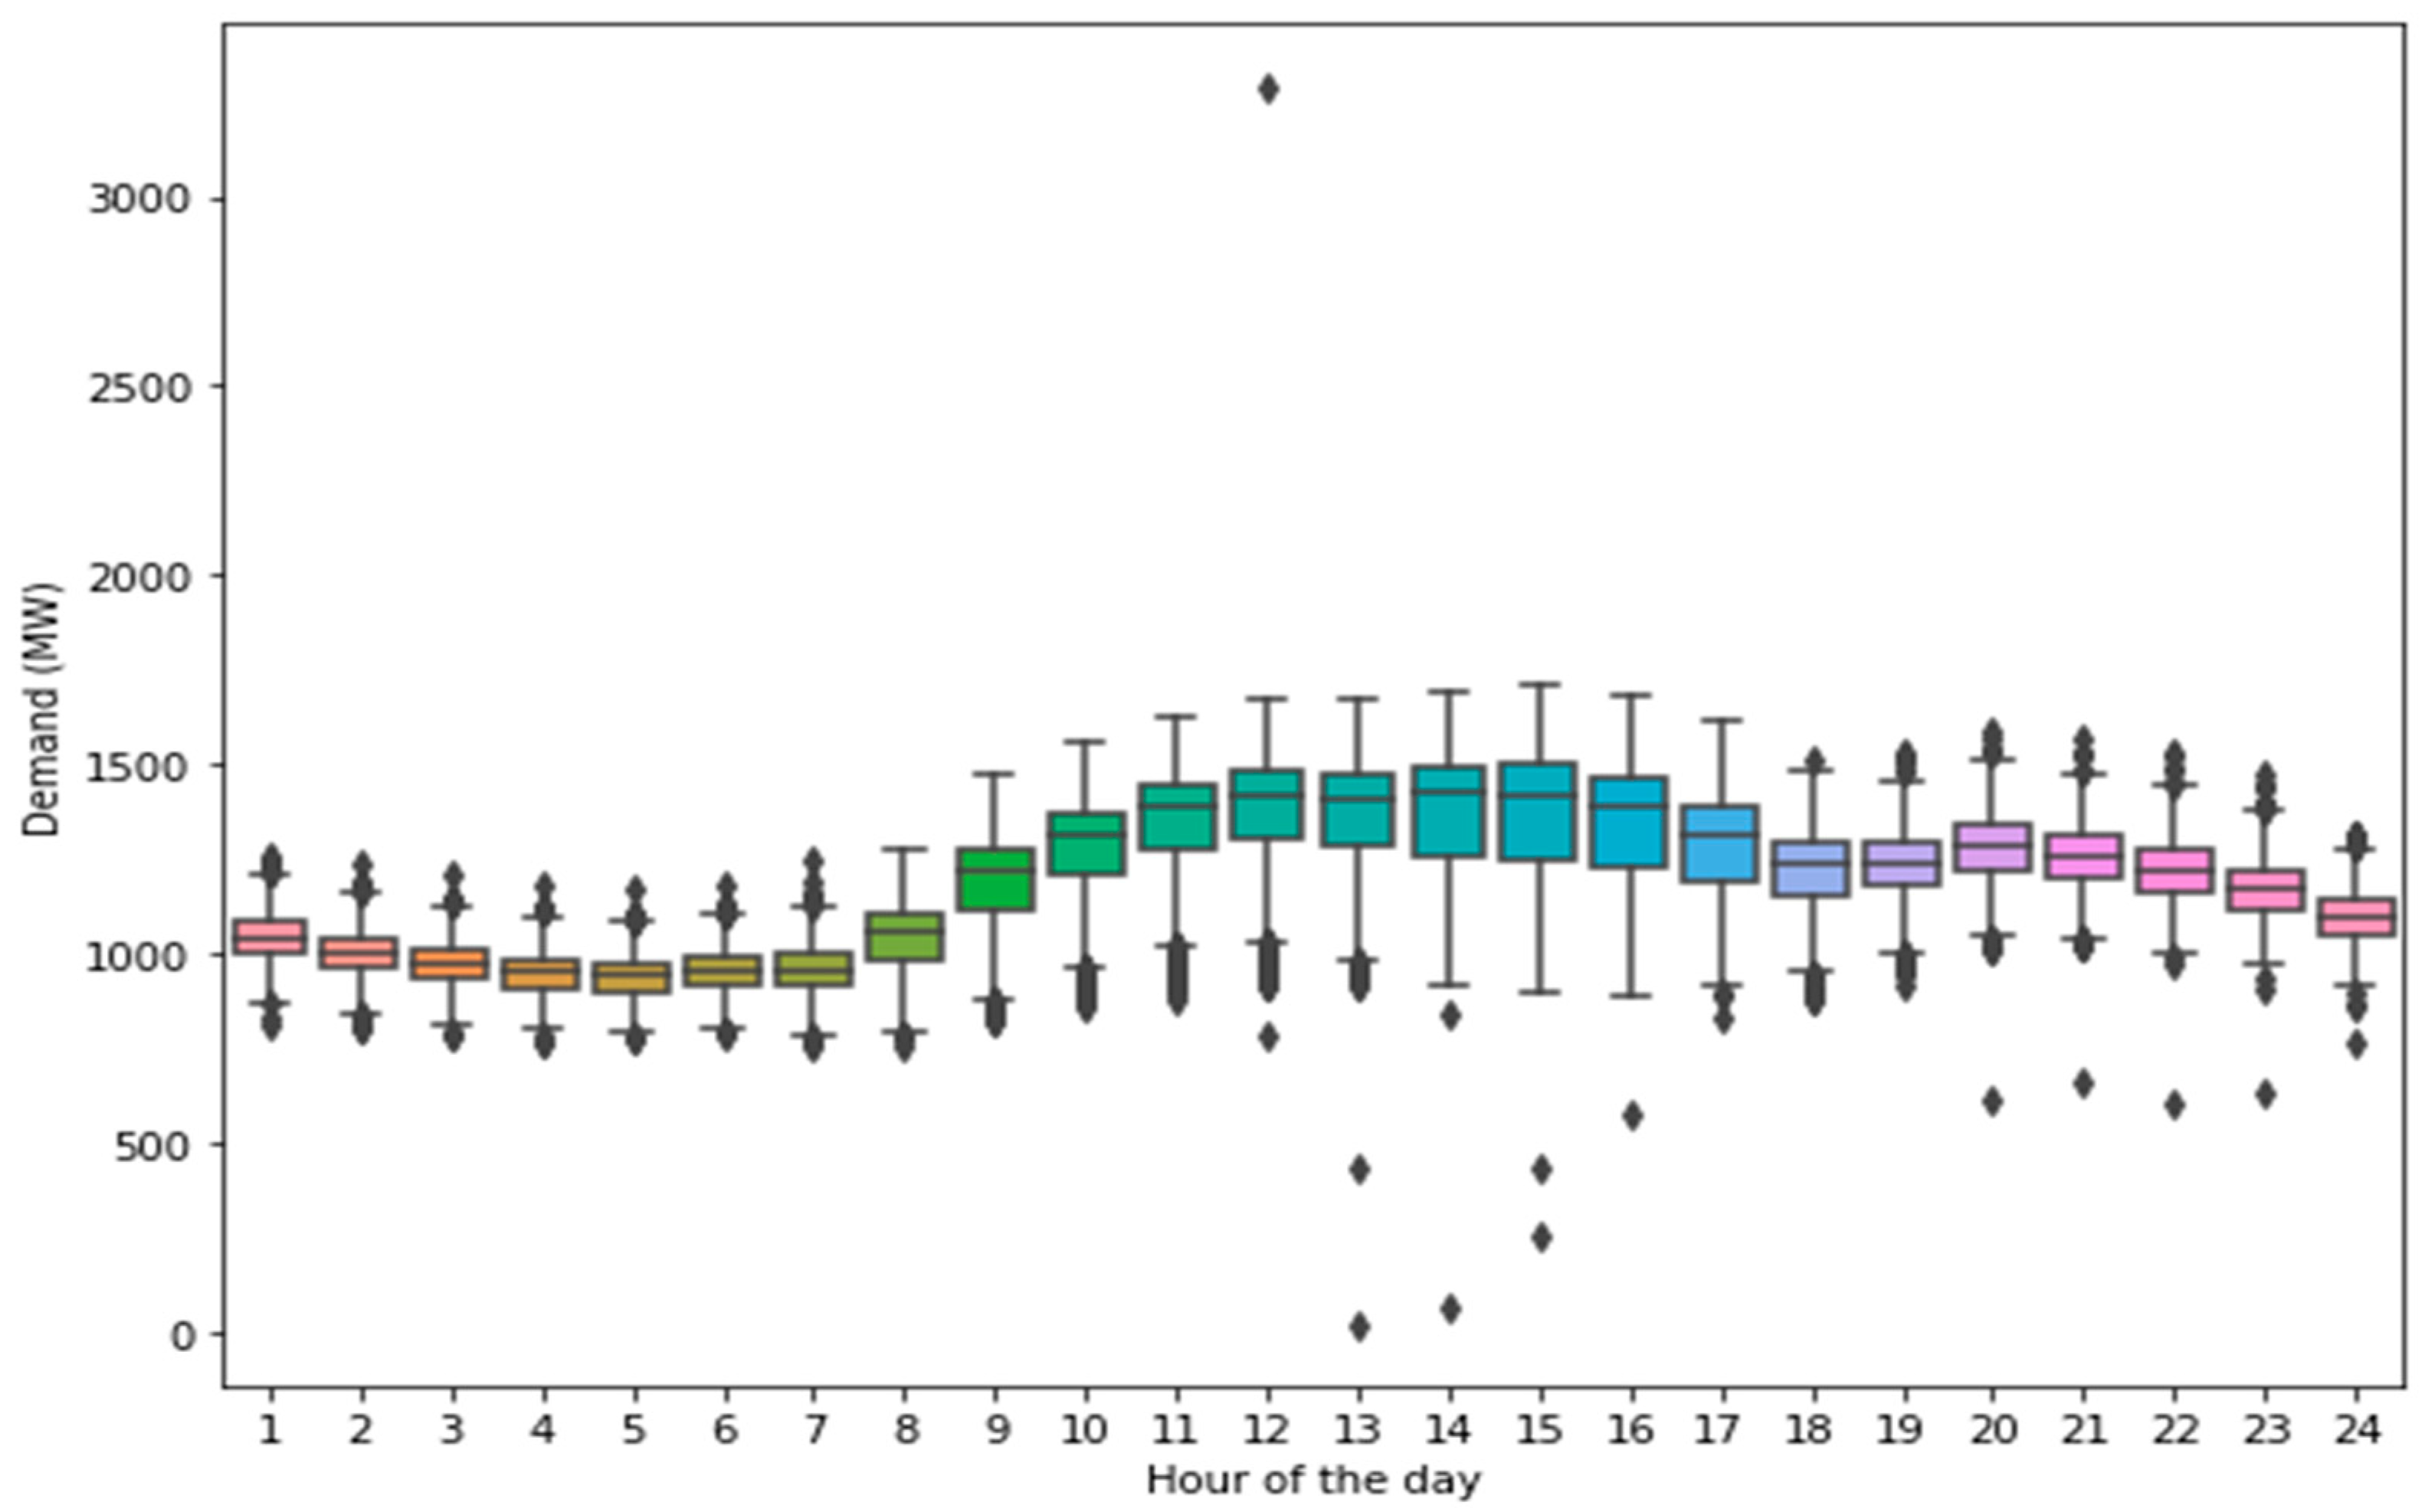
A boxplot was constructed to observe the hourly distribution of the electricity demand. Figure 8 presents the boxplot of the average hourly electricity demand from 2016 to 2019. The electricity demand varies throughout the day, with a prolonged peak period. For example, Figure 8 below shows that the peak period occurs between the 12th hour (noon) and the 15th hour (3:00 p.m.).

3.3. Feature Selection

Several input features were studied and evaluated for this study to understand the most significant for predicting electricity demand. A total of eight input features were studied for predicting electricity demand one hour and 24 h ahead, shown in Table 2.

3.4. Correlation Heatmap

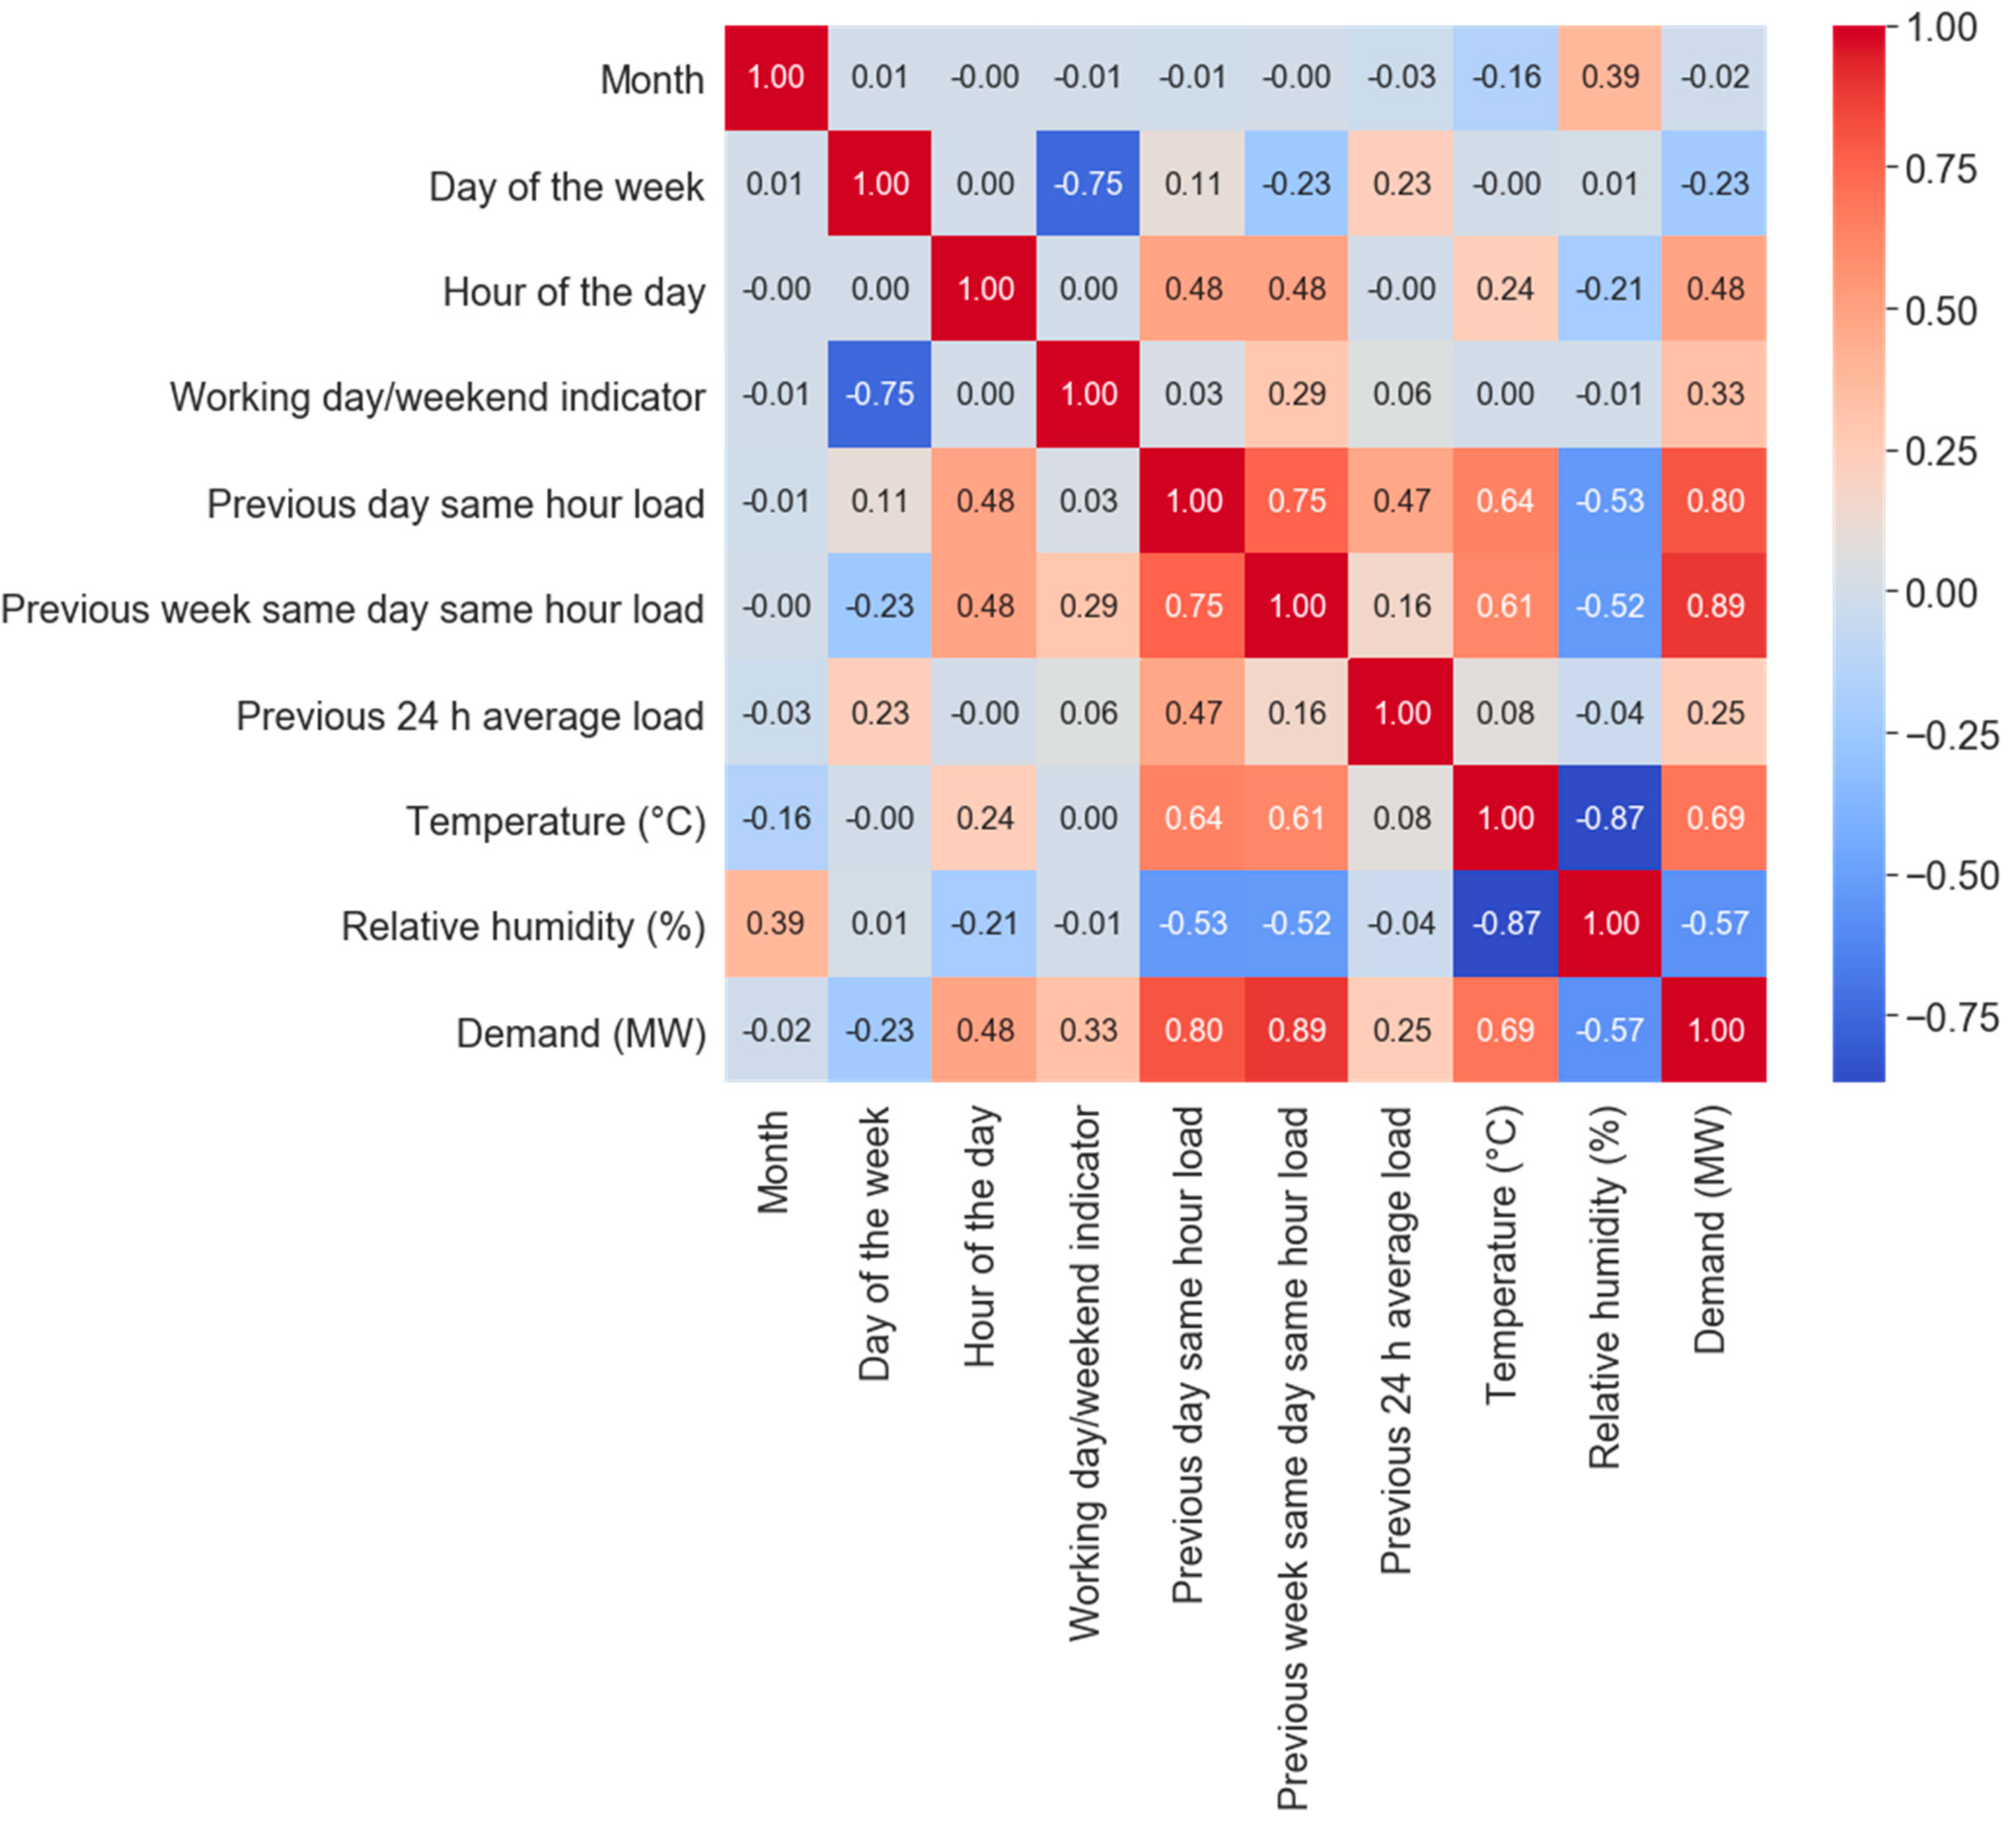
The correlation heatmap is another data exploration tool that helps visualize which features are highly correlated with the electricity demand. For example, based on Figure 9, it can be observed that electricity demand has a strong linear relationship with the following variables: the previous week’s same day same hour load (0.89) and the previous day’s same-hour load (0.8); and a moderate relationship with temperature (0.69).

3.5. Feature Importance

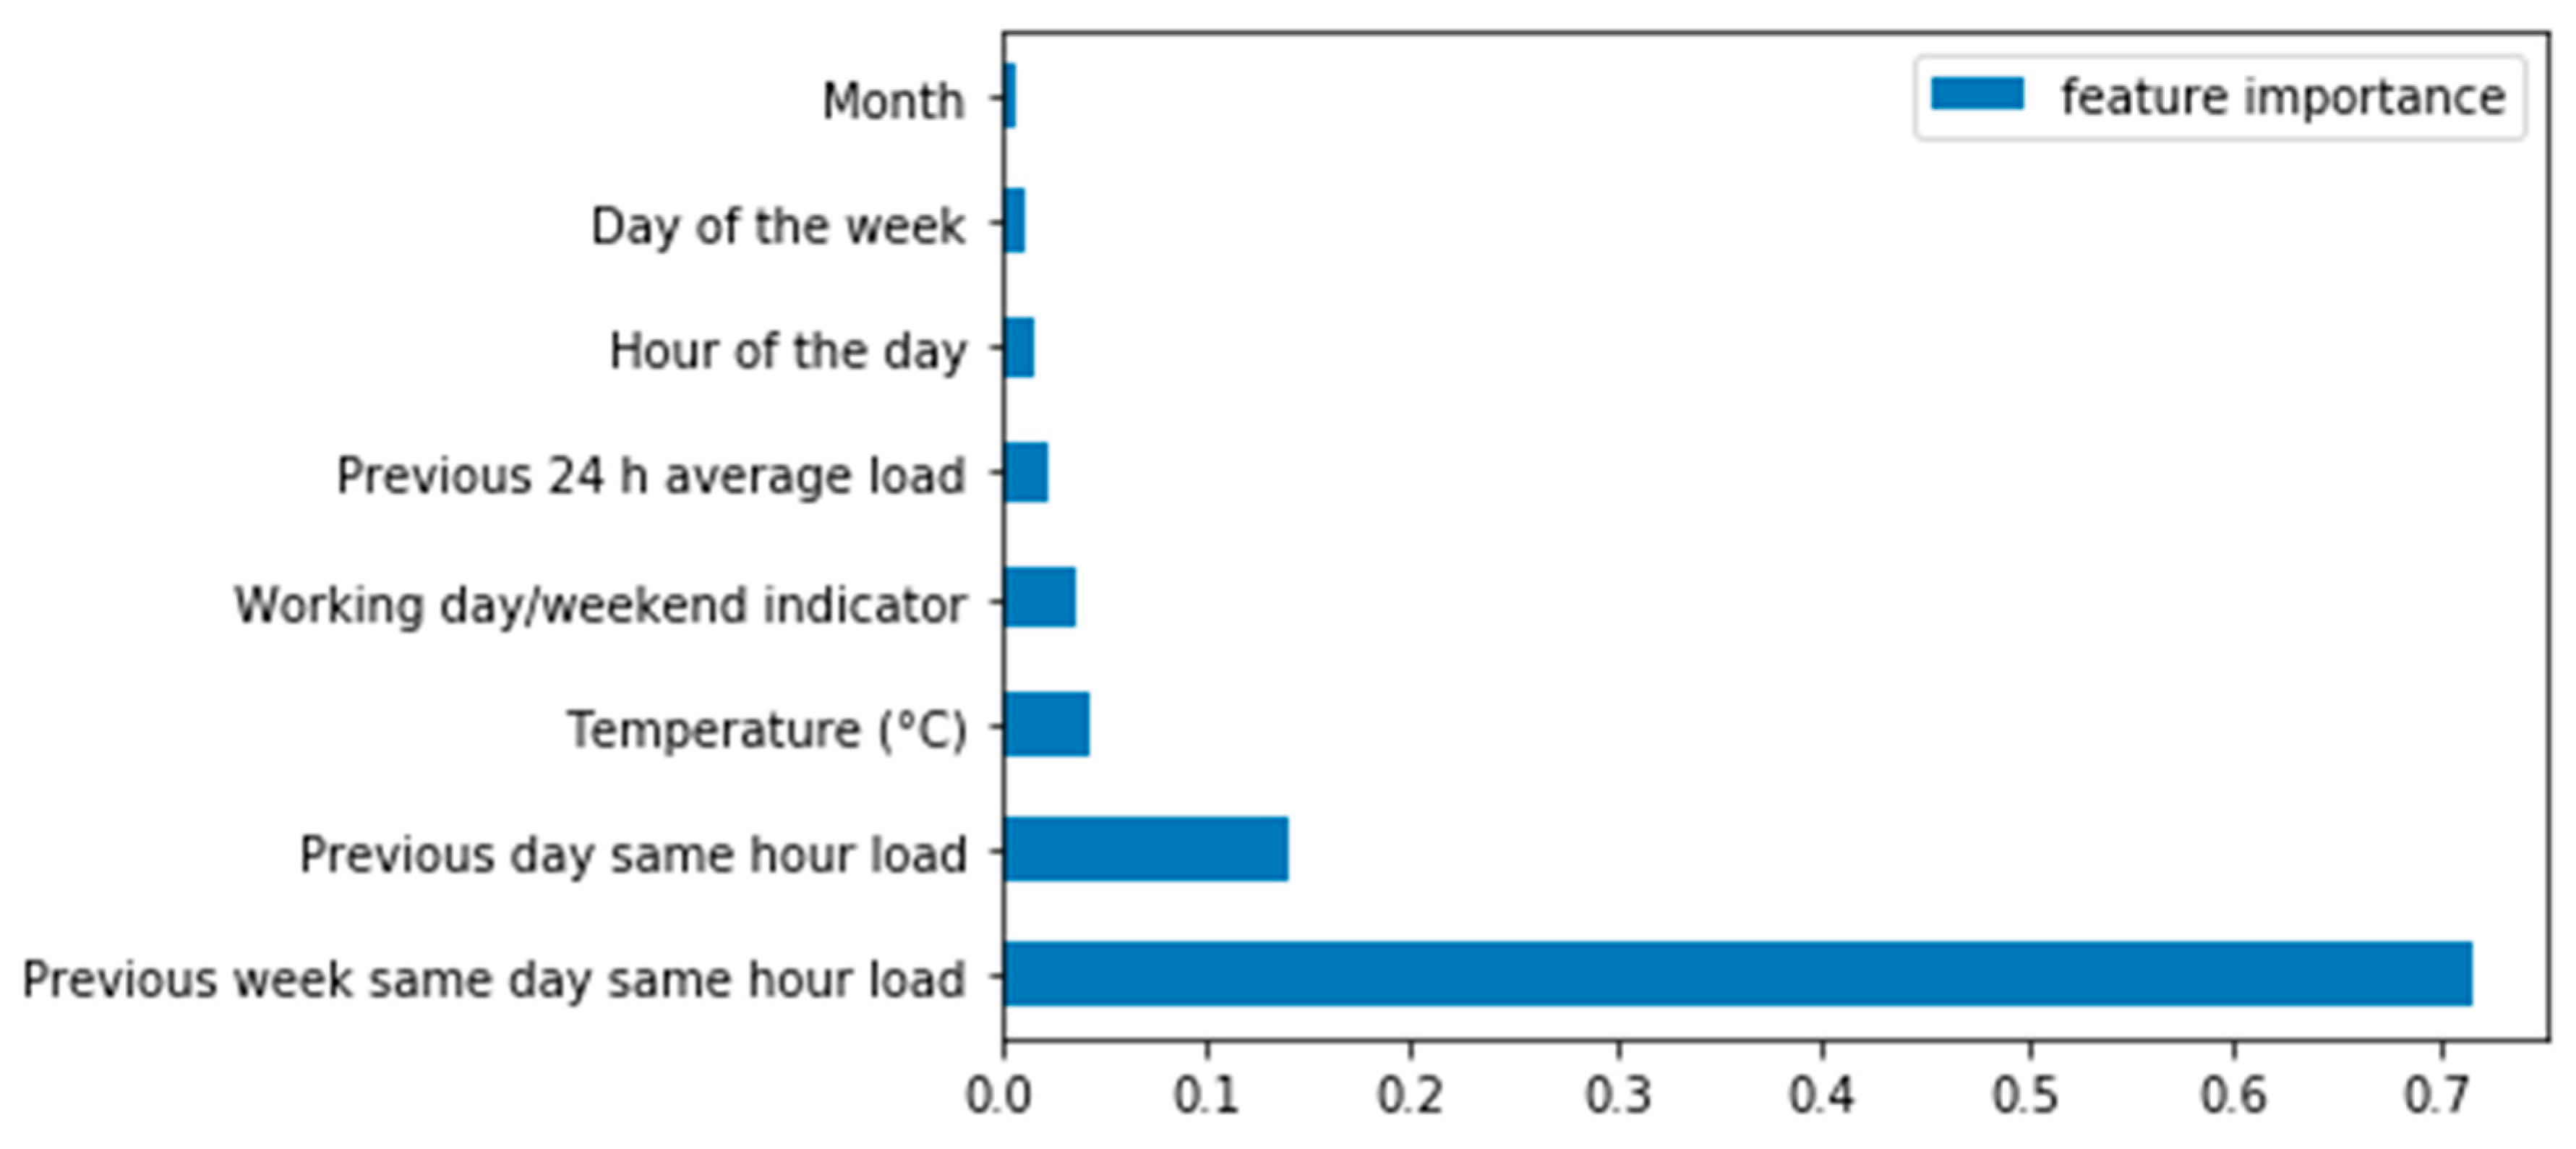
In addition to the correlation heatmap, the Random Forest Regressor was another tool to evaluate feature importance. This built-in tool from the Scikit-learn package is useful for computing feature importance. The results are demonstrated in Figure 10. Once again, the most significant features were the previous week’s same day same hour load (0.72), the previous day’s same-hour load (0.14), and temperature (0.04).

3.6. Building and Training of Models

This study compared and benchmarked several machine learning and deep learning models to predict short-term electricity demand in Panama. Machine learning methods included SVR, XGBoost, AdaBoost, random forest, and LightGBM. On the other side, deep learning methods consisted of deep learning regression, Bi-LSTM, and GRU. As part of this study, it was essential to investigate the performance of Bi-LSTM and GRU networks for making multiple time step predictions 24 h ahead. The models were built and trained using open-source software such as Knime and Anaconda Python (https://www.anaconda.com/products/distribution (accessed on 10 September 2021)). The experiments were conducted using a Dell Inc. (Round Rock, TX, USA) Inspiron 15 7000 laptop with Intel® Core™ i7-8565U [email protected] GHz, 64-bit Windows 10 operating system, and 8 GB memory. Most models were built in Python 3.7.6 and Keras with Tensorflow as the backend. Table 3 provides the input features that were used for predicting electricity demand.

3.7. Data Partitioning and Model Architecture for Machine Learning Models

The data were split into a training (80%) and test set (20%) while maintaining the temporal order of the data. The data from 1 January 2016, to 25 January 2019, were used as the training set. The data from 26 January 2019, to 31 October 2019, were used as the test set. Table 4 presents the model architecture for the machine learning models using several methods from the literature. For the random forest model, important parameters such as the number of decision trees used were set to 100, the minimum number of samples required to be a leaf node was set to 1, and the minimum number of samples required to split an internal node was set to 2.

3.8. Model Architecture for Deep Learning Models

It was important for the deep learning models to define the hyperparameters, such as the number of dense layers and hidden units, learning rate, activation function, batch size, and epochs.

3.8.1. Deep Learning Regression

Table 5 presents the architecture for building the deep-learning regression model in Knime. To effectively learn the complex nonlinear patterns and relationship between the several input features and the output (demand), a neural network of three dense layers with 95 hidden units each was considered. The model was trained for 500 epochs with a batch size of 50. The Stochastic Gradient Descent optimizer was selected with a learning rate of 0.01.

3.8.2. Bi-LSTM

The Bi-LSTM model architecture consists of three stacked Bi-LSTM layers, with 70 hidden units, each followed by a dense layer of 24 hidden units (Table 6). The model was trained for 500 epochs with small batch sizes of 30. The model receives an input sequence of the 48 previous electricity demand hours comprising seven input features.

3.8.3. GRU

The GRU model architecture consists of three stacked GRU layers, with 80 hidden units each, followed by a dense layer of 24 hidden units (Table 7). The model was trained for 500 epochs with small batch sizes of 30.

4. Results

Table 8 and Figure 11 provide the results of the models on the test set. The models were benchmarked and compared regarding training time and four performance metrics. The performance metrics include R-squared (R2), mean squared error (MSE), MAPE, and mean absolute error (MAE). The deep learning regression performed the best for predicting demand one hour ahead, with an R2 value of 0.93 and MAPE of 2.90%. This model consisted of three dense layers with 95 hidden units each. The model required an average training time of 20 min due to the number of hidden layers used. On the other side, Bi-LSTM and GRU had low R2 values of 0.40 and 0.31. Therefore, it became evident that multi-step predictions 24 h ahead are more challenging to perform. The GRU model was more computationally intensive, requiring a training time of 7560 s. Random Forest and LightGBM performed the best among the machine learning models, with an R2 value of 0.92. However, LightGBM provided the fastest training time of 0.8 s. AdaBoost had the worst performance among the machine learning models, with an R2 value of 0.75 and MAPE of 5.70%.
5. Conclusions

Electricity forecasting is essential in supporting the reliable transitioning of power systems in this rapid digital era. The advances in big data, IoT, and machine learning have provided researchers and the industry with numerous opportunities to support more robust forecasting. However, challenges still exist for delivering more accurate forecasts due to the granularity and quality of the data collected from sensors and SCADA systems, the nonlinear and noisy patterns presented in the data, and the complex features that affect it.
To validate the methodology, this research introduced a case study on Panama’s power system. This case study was significant to understanding where power systems currently stand, their challenges, and how they are beginning to prepare for the future. The case study revealed that energy managers are becoming more concerned about the grid’s reliability.
The methodology first addressed two research questions: (1) Which features are the most significant for predicting electricity demand in the short term? Additionally, (2) Which methods are the most effective for capturing hourly demand? Therefore, we evaluated nine input features for forecasting hourly demand. These were the month, day of the week, the hour of the day, the previous 24 h average load, working day/weekend indicator, temperature (°C), relative humidity, previous day’s same-hour load, and previous week’s same day’s same-hour load. Feature importance based on random forest regressor revealed that the most significant features were the previous week’s same day same-hour load (0.72), the previous day same-hour load (0.14), and temperature (0.04). Several models were proposed for the complex nonlinear mapping between the nine input features and electricity demand (target variable). The deep learning regression model performed the best for predicting demand one hour ahead, with an R2 value of 0.93 and MAPE of 2.90%. The reason behind this was that the deep learning regression model uses a more robust approach by stacking multiple hidden layers, allowing it to learn complex patterns presented in the data.
Furthermore, deep learning tends to perform better when trained with large datasets. Therefore, to improve the predictive performance, we used a deep learning model consisting of three dense layers with 95 hidden units each. Unfortunately, the model required an average training time of 20 min due to the number of hidden layers used. Among the deep learning models, the GRU multi-step model performed the worse because it uses a long input sequence of 72 h to predict electricity demand 24 h ahead, which can lead to the vanishing gradient problem. Therefore, it became evident that multi-step prediction problems remain a challenging research area. The study also found that AdaBoost had the worst performance among the machine learning models, with an R2 value of 0.75 and MAPE of 5.70%.
Author Contributions

Conceptualization, methodology, software, validation, formal analysis, investigation, resources, data curation, writing—original draft preparation, B.I. and L.R.; writing—review and editing, E.G.-F. and N.C.-B.; supervision, project administration, funding acquisition, L.R. All authors have read and agreed to the published version of the manuscript.

Funding

This research received no external funding.

Data Availability Statement

The data is not available to the public.

Conflicts of Interest

The authors declare no conflict of interest.

References

  1. Kabalci, E.; Kabalci, Y. Introduction to Smart Grid Architecture. In Smart Grids and Their Communication Systems; Kabalci, E., Kabalci, Y., Eds.; Springer: Singapore, 2019; pp. 3–45. [Google Scholar] [CrossRef]
  2. Next-Gen Industrial AI Energy Sector. 2020. Available online: https://assets.new.siemens.com/siemens/assets/api/uuid:fef90d09-6876-4510-b29b-bb6d60374793/siemens-next-gen-industrial-ai-energy-sector.pdf (accessed on 18 October 2022).
  3. Goswami, R.C.; Joshi, H.; Gautam, S.; Om, H. Applications of Big Data and Internet of Things in Power System. In Architectural Wireless Networks Solutions and Security Issues; Das, S.K., Samanta, S., Dey, N., Patel, B.S., Hassanien, A.E., Eds.; Springer: Singapore, 2021; pp. 209–225. [Google Scholar] [CrossRef]
  4. Kulkarni, S.N.; Shingare, P. Decision Support System for Smart Grid Using Demand Forecasting Models. In Network Inspired Paradigm and Approaches in IoT Applications; Springer: Singapore, 2019; pp. 47–62. [Google Scholar]
  5. Mir, A.A.; Alghassab, M.; Ullah, K.; Khan, Z.A.; Lu, Y.; Imran, M. A Review of Electricity Demand Forecasting in Low and Middle Income Countries: The Demand Determinants and Horizons. Sustainability 2020, 12, 5931. [Google Scholar] [CrossRef]
  6. Solyali, D. A Comparative Analysis of Machine Learning Approaches for Short-/Long-Term Electricity Load Forecasting in Cyprus. Sustainability 2020, 12, 3612. [Google Scholar] [CrossRef]
  7. Ahmad, W.; Ayub, N.; Ali, T.; Irfan, M.; Awais, M.; Shiraz, M.; Glowacz, A. Towards Short Term Electricity Load Forecasting Using Improved Support Vector Machine and Extreme Learning Machine. Energies 2020, 13, 2907. [Google Scholar] [CrossRef]
  8. Yang, L.; Yang, H. Analysis of Different Neural Networks and a New Architecture for Short-Term Load Forecasting. Energies 2019, 12, 1433. [Google Scholar] [CrossRef] [Green Version]
  9. Xu, L.; Li, C.; Xie, X.; Zhang, G. Long-Short-Term Memory Network Based Hybrid Model for Short-Term Electrical Load Forecasting. Information 2018, 9, 165. [Google Scholar] [CrossRef] [Green Version]
  10. Xu, J.; Baldick, R. Day-Ahead Price Forecasting in ERCOT Market Using Neural Network Approaches. In Proceedings of the Tenth ACM International Conference on Future Energy Systems, Phoenix, AZ, USA, 25–28 June 2019; pp. 486–491. [Google Scholar] [CrossRef]
  11. Bouktif, S.; Fiaz, A.; Ouni, A.; Serhani, M.A. Single and Multi-Sequence Deep Learning Models for Short and Medium Term Electric Load Forecasting. Energies 2019, 12, 149. [Google Scholar] [CrossRef] [Green Version]
  12. Kong, W.; Dong, Z.Y.; Jia, Y.; Hill, D.J.; Xu, Y.; Zhang, Y. Short-Term Residential Load Forecasting Based on LSTM Recurrent Neural Network. IEEE Trans. Smart Grid 2019, 10, 841–851. [Google Scholar] [CrossRef]
  13. Wang, H.; Zhao, Y.; Tan, S. Short-term load forecasting of power system based on time convolutional network. In Proceedings of the 2019 8th International Symposium on Next Generation Electronics (ISNE), Zhengzhou, China, 9–10 October 2019; pp. 1–3. [Google Scholar] [CrossRef]
  14. Zou, M.; Fang, D.; Harrison, G.; Djokic, S. Weather Based Day-Ahead and Week-Ahead Load Forecasting using Deep Recurrent Neural Network. In Proceedings of the 2019 IEEE 5th International forum on Research and Technology for Society and Industry (RTSI), Florence, Italy, 9–12 September 2019; pp. 341–346. [Google Scholar] [CrossRef]
  15. Atef, S.; Eltawil, A.B. Assessment of stacked unidirectional and bidirectional long short-term memory networks for electricity load forecasting. Electr. Power Syst. Res. 2022, 187, 106489. [Google Scholar] [CrossRef]
  16. Hossain, M.S.; Mahmood, H. Short-Term Load Forecasting Using an LSTM Neural Network. In Proceedings of the 2020 IEEE Power and Energy Conference at Illinois (PECI), Champaign, IL, USA, 27–28 February 2020; pp. 1–6. [Google Scholar] [CrossRef]
  17. Ciechulski, T.; Osowski, S. High Precision LSTM Model for Short-Time Load Forecasting in Power Systems. Energies 2021, 14, 2983. [Google Scholar] [CrossRef]
  18. Pramono, S.H.; Rohmatillah, M.; Maulana, E.; Hasanah, R.N.; Hario, F. Deep Learning-Based Short-Term Load Forecasting for Supporting Demand Response Program in Hybrid Energy System. Energies 2019, 12, 3359. [Google Scholar] [CrossRef] [Green Version]
  19. Alhussein, M.; Aurangzeb, K.; Haider, S.I. Hybrid CNN-LSTM Model for Short-Term Individual Household Load Forecasting. IEEE Access 2020, 8, 180544–180557. [Google Scholar] [CrossRef]
  20. Rafi, S.H.; Nahid-Al-Masood; Deeba, S.R.; Hossain, E. A Short-Term Load Forecasting Method Using Integrated CNN and LSTM Network. IEEE Access 2021, 9, 32436–32448. [Google Scholar] [CrossRef]
  21. Farsi, B.; Amayri, M.; Bouguila, N.; Eicker, U. On Short-Term Load Forecasting Using Machine Learning Techniques and a Novel Parallel Deep LSTM-CNN Approach. IEEE Access 2021, 9, 31191–31212. [Google Scholar] [CrossRef]
  22. Singh, N.; Vyjayanthi, C.; Modi, C. Multi-step Short-term Electric Load Forecasting using 2D Convolutional Neural Networks. In Proceedings of the 2020 IEEE-HYDCON, Hyderabad, India, 11–12 September 2020; pp. 1–5. [Google Scholar] [CrossRef]
  23. Kong, Z.; Zhang, C.; Lv, H.; Xiong, F.; Fu, Z. Multimodal Feature Extraction and Fusion Deep Neural Networks for Short-Term Load Forecasting. IEEE Access 2020, 8, 185373–185383. [Google Scholar] [CrossRef]
  24. Ünal, F.; Almalaq, A.; Ekici, S. A Novel Load Forecasting Approach Based on Smart Meter Data Using Advance Preprocessing and Hybrid Deep Learning. Appl. Sci. 2021, 11, 2742. [Google Scholar] [CrossRef]
  25. Fatema, I.; Kong, X.; Fang, G. Analysing and Forecasting Electricity Demand and Price Using Deep Learning Model During the COVID-19 Pandemic. In Parallel Architectures, Algorithms and Programmin; Springer: Singapore, 2021. [Google Scholar]
  26. Feras, A.; Khaled, N.; Lina, A.; Eyad, Z. Impact of the COVID-19 Pandemic on Electricity Demand and Load Forecasting. Sustainability 2021, 13, 1435. [Google Scholar] [CrossRef]
  27. Yu, Z.; Yang, J.; Wu, Y.; Huang, Y. Short-Term Power Load Forecasting under COVID-19 Based on Graph Representation Learning with Heterogeneous Features. Front. Energy Res. 2021, 9, 865. [Google Scholar] [CrossRef]
  28. Ke, G.; Meng, Q.; Finley, T.; Wang, T.; Chen, W.; Ma, W.; Ye, Q.; Liu, T.Y. Lightgbm: A highly efficient gradient boosting decision tree. Adv. Neural Inf. Process. Syst. 2017, 30, 3146–3154. [Google Scholar]
Figure 1. Experiment for Short-Term Electricity Demand Forecasting.
Energies 15 08079 g001
Figure 2. Deep Learning Regression workflow.
Energies 15 08079 g002
Figure 3. Bi-LSTM architecture for multi-step prediction of electricity demand.
Energies 15 08079 g003
Figure 4. GRU network.
Energies 15 08079 g004
Figure 5. GRU architecture for predicting electricity demand.
Energies 15 08079 g005
Figure 6. XGBoost Structure.
Energies 15 08079 g006
Figure 7. Random Forest method.
Energies 15 08079 g007
Figure 8. Boxplot of hourly consumption. The diamond symbol represents the outliers.
Energies 15 08079 g008
Figure 9. Correlation Heatmap.
Energies 15 08079 g009
Figure 10. Feature Importance.
Energies 15 08079 g010
Figure 11. Performance on the Models on the test set.
Energies 15 08079 g011
Table 1. Data Collected.
ModelData CollectedSource
Short-term
electricity forecasting
Historical electricity demandNational Dispatch Center of Panama
TemperaturePanama Canal Authority
Relative humidityPanama Canal Authority
Table 2. Feature Selection.
Input FeaturesDescription
TemperatureTemperature (°C) of Panama City
Relative humidityRelative humidity (%) of Panama City
MonthMonth 1 to 12 (January to December)
Day of the weekDay of the week 1 to 7 (Monday to Sunday)
Hour of the dayHour of the day (1 to 24)
Working day/weekendIndicates whether it is a working day or holiday/weekend in Panama
Previous day same-hour demandElectricity demand from the previous day at the same hour
Previous 24 h average demandThe average electricity demand from the previous 24 h
Electricity demand (Target variable)Electricity demand (MW) of Panama
Table 3. Input features used for Models.
MethodInput Features
Deep Learning
models
Deep learning regressionMonth
Day of the week
Hour of the day
Previous 24 h average load
Working day/weekend indicator
Temperature (°C)
Relative humidity (%)
Previous day same-hour load
Previous week same day same-hour load
Bi-LSTM
GRU
Month
Day of the week
Hour of the day
Working day/weekend indicator
Temperature (°C)
Relative humidity (%)
Electricity demand (Time lags)
Machine learning
models
SVR
XGB
AdaBoost
Random Forest
LightGBM
Month
Day of the week
Hour of the day
Previous 24 h average load
Working day/weekend indicator
Temperature (°C)
Relative humidity (%)
Previous day same-hour load
Previous week same day same-hour load
Table 4. Model Architecture for Machine Learning Models.
Machine Learning ModelParameters
SVRkernel= radial basis function (RBF)
c = 0.1
degree = 3
XGBoostlearning rate = 0.1
max depth = 3
n estimators = 100
n jobs = 1
AdaBoostn estimators = 100
learning rate = 0.01
Loss = linear
Random forestn estimators = 100
min samples leaf = 1
min samples split = 2
LightGBMlearning rate = 0.1
max depth = −1
n estimators = 100
n leaves = 31
Table 5. Model Architecture for Deep Learning Regression in Knime.
Number of
Dense Layers
Number of Hidden UnitsActivation FunctionOptimization
Algorithm
Batch SizeEpochs
395ReLUStochastic Gradient
Descent
50500
Table 6. Model Architecture for Bi-LSTM.
LayerNumber of Hidden UnitsActivation FunctionOptimization AlgorithmBatch SizeEpochsInput Shape
Bi-LSTM70ReLUAdam30500(48,7)
Bi-LSTM70ReLU
Bi-LSTM70ReLU
Dense24
Table 7. Model Architecture for GRU.
LayerNumber of Hidden UnitsActivation FunctionOptimization AlgorithmBatch SizeEpochsInput Shape
GRU80ReLUAdam30500(72,7)
GRU80ReLU
GRU80ReLU
Dense24
Table 8. Results of the models for Short-term Electricity Forecasting.
MethodR2RMSEMSEMAPE (%)Training Time (s)
Bi-LSTM0.4070.544976.104.253600
GRU0.3173.265366.684.437560
Deep learning regression0.9350.342534.692.901200
SVR0.8182.386786.334.9022
XGBoost0.9158.013365.013.453.3
AdaBoost 0.7594.578943.165.704.8
Random forest0.9255.053030.903.227.1
LightGBM0.9251.692672.083.070.8
Publisher’s Note: MDPI stays neutral with regard to jurisdictional claims in published maps and institutional affiliations.