Abstract
The freight sector is expected to keep, or even increase, its fundamental role for the major modern economies, and therefore actions to limit the growing pressure on the environment are urgent. The use of electricity is a major option for the decarbonization of transports; in the heavy-duty segment, it can be implemented in different ways: besides full electric-battery powertrains, electricity can be used to supply catenary roads, or can be chemically stored in liquid or gaseous fuels (e-fuels). While the current EU legislation adopts a tailpipe Tank-To-Wheels approach, which results in zero emissions for all direct uses of electricity, a Well-To-Wheels (WTW) method would allow accounting for the potential benefits of using sustainable fuels such as e-fuels. In this article, we have performed a WTW-based comparison and modelling of the options for using electricity to supply heavy-duty vehicles: e-fuels, eLNG, eDiesel, and liquid Hydrogen. Results showed that the direct use of electricity can provide high Greenhouse Gas (GHG) savings, and also in the case of the e-fuels when low-carbon-intensity electricity is used for their production. While most studies exclusively focus on absolute GHG savings potential, considerations of the need for new infrastructures, and the technological maturity of some options, are fundamental to compare the different technologies. In this paper, an assessment of such technological and non-technological barriers has been conducted, in order to compare alternative pathways for the heavy-duty sector. Among the available options, the flexibility of using drop-in, energy-dense liquid fuels represents a clear and substantial immediate advantage for decarbonization. Additionally, the novel approach adopted in this paper allows us to quantify the potential benefits of using e-fuels as chemical storage able to accumulate electricity from the production peaks of variable renewable energies, which would otherwise be wasted due to grid limitations.
Keywords:
heavy-duty; Well-To-Wheels; electric vehicles; e-fuels; RFNBO; renewables; hydrogen; freight 1. Introduction
The increasingly urgent need to cope with global warming, alongside the growing worldwide energy demand, has been leading countries to adopt measures to reduce their greenhouse gas emissions. Among the various sectors, transportation is definitely one of the largest global contributors in terms of Greenhouse Gases (GHG) [1]. Although transport is the most fossil-reliant sector, several emissions reduction strategies have been considered and applied, such as stringent regulations, electrification, and the use of alternative fuels. Most of these schemes focus on passenger Light-Duty Vehicles (LDVs), as these constitute the main share of vehicles on the road [2].
Although Heavy-Duty Vehicles (HDVs) represent a limited percentage of the vehicular traffic, their impact is anything but negligible, and therefore their decarbonization is crucial. The transport sector currently accounts for about 37% of total CO2 emissions [1]. According to the International Energy Agency (IEA) [3], when summing up 2018 emissions from road Heavy-Duty (HD) and international maritime traffic, the resulting amount of global emissions is comparable to that of road passenger transport. Additionally, demand in the freight sector is projected to grow in the next years [4], and emissions to rise proportionally, unless mitigated.
Specific policies aiming at reducing GHG emissions from HD have been issued in various regions of the world; in the European Union (EU), a specific regulation for HD vehicles aims at curbing average CO2 emissions by 15% by 2025, and to achieve a further 30% reduction by 2030, compared to 2019 levels [5].
Among the technically viable solutions to meet GHG reduction in the heavy-duty sector, electrification is key, albeit complex to implement at large industrial scale. Besides electric powertrain vehicles, including Battery Electric Vehicles (BEV)-HD and Catenary Road (CR), electricity can also be used to produce e-fuels (also referred to as Power-to-X, Renewable Fuels of Non-Biological Origin (RFNBO) [6], low-carbon fuels or synthetic fuels).
Several high-quality studies have investigated future sustainable scenarios for HDV [4,7,8,9]. These studies report, with a certain alignment, the important role that both direct and indirect electrification can play in the decarbonization of the HD sector. However, as has often been pointed out in relevant studies ([4,7,10,11]), the electrification per se of the HD does not entail an overall reduction in emissions. The general view of the reported studies is that the transport and power sectors will become increasingly integrated, and the Carbon Intensity (CI) of the electricity used as feedstock in the production process may become the major factor driving fuel cycle emissions. In particular, several studies [4,9,12] provide evidence that a comparison of low-carbon pathways limited to the Tank-to-Wheels (TTW) analysis could lead to misleading results [13].
Provided that both direct and indirect use of electricity can contribute to help curb HD emissions, it is worth noticing that the above-mentioned EU legislation is based on a TTW approach, which considers only tailpipe emissions. Under this legislative framework, electricity-driven vehicles are considered zero-emissions, while the GHG benefits of e-fuels are not accounted for. A proper, full evaluation of possible options for using electricity in the HD sector should therefore adopt a technology-neutral Well-To-Wheels (WTW) approach in which emissions and savings due to fuel/energy vector are also accounted for. The possibility to properly account for the GHG savings provided by e-fuels can be relevant.
The aim of this work is to carry out an assessment of the potential for decarbonization of e-fuels and direct electrification, based on a WTW approach. The article thus presents estimates of the CI (gCO2,eq/MJ) of several relevant pathways for using electricity, either directly to supply specific powertrains, or as feedstock to produce drop-in e-fuels. Then, these WTT figures are combined with typical TTW efficiencies to show the potential benefits and limitations of the various options versus BEV-HD and CR. Additionally, the assessment is complemented by considerations of the need for new infrastructures, and of the technological maturity of some options. These are fundamental barriers/enablers to obtain a real deployment of a technological option.
2. Materials and Methods
In this section, the methodologies adopted to evaluate and compare the different pathways are described. First, the Life Cycle Analysis (LCA)-based methods, commonly used in the literature, are described, and definitions of the TTW and WTT methodologies is provided. The main sources of data used as inputs for the analysis are introduced. Section 2.2 presents the type of truck used as representative for long-haul services, and the values for energy efficiency used for TTW calculations. Section 2.3 explains how the WTT emissions of the different fuels and energy vectors considered were derived. The carbon intensity of electricity was assumed from literature values, while the WTT emissions of the various e-fuel pathways were calculated using an in-house tool. Finally, Section 2.4 shows how WTT and TTW figures can be coupled to allow computing the overall WTW emissions.
2.1. LCA-Based Tools for HD Sector GHG Assessments
Besides a rich body of literature dedicated to passenger and light-duty vehicles (e.g., [14,15,16,17]), a smaller number of studies specifically address the reduction of GHG emissions for the heavy-duty sector [10,11,18]. The literature comparing the various options to reduce the impact of this sector covers multiple aspects, such as: techno-economic feasibility [4,7,8,9,19,20], technical limitations [21,22,23,24,25], and finally the environment and air quality contributions [9,12].
The LCA tool is used to assess the potential benefits of each solution. In this regard, key works for the EU context are RICARDO [26] and JEC [27], while a comparison with the US approach is discussed in [28]. In the scientific literature, the GHG impact of the fuels is commonly assessed under a WTW approach [29], which allows estimating the total GHG emissions of fuel production and use in a specific powertrain. The WTW approach encompasses all the stages of the life cycle of the fuel, from the extraction of resources to the final use in a vehicle. The calculations of the emissions are grouped into two parts: the WTT, covering the stages of production and distribution of the fuel, and the TTW, accounting for the tailpipe emissions resulting from the end-use of the fuel. Contrarily to a full LCA, the WTW analysis excludes the stages of production and end-of-life treatment of the vehicle, as well as the infrastructural changes across the transport system. The impact of these stages on the life cycle emissions can be significant [30,31,32], but it only varies slightly for different vehicle technologies [27]. Therefore, the WTW approach is usually accepted for analyses which focus on comparing alternative fuels and energy vectors [27].
2.2. TTW of the Reference Truck
A reference truck has been selected to compare powertrain options and fuels. The modelling of the engine efficiency for a truck is a complex exercise, which requires taking into consideration a large number of variables, often owned by producers, such as: number of axles, average payload, aerodynamic efficiency, etc. A reference study, able to provide accurate truck efficiency for various powertrains and fuels is the JEC v5 TTW [33]. This energy efficiency, expressed in MJ per tonne kilometre, are used in Equation 1 (Section 2.4) for determining TTW emissions.
A rigid truck of the “group 5” [34] is considered for deriving the engine efficiency. The chosen type of truck is used for long-haul services, which are believed to continue relying on liquid fuels due to the need for high-energy-density carriers. It is worth noticing that this choice is in line with other relevant studies [26,27].
The truck is a 325-kW vehicle, with a chassis configuration, 4 × 2 axles, and a total payload of about 16 t for long-haul applications. Table 1 reports the efficiencies expressed in MJ/t km, where the tonne moved for 1 km is the function unit of service provided. The selected powertrains are BEV, CR, FC, GE, and DE. The catenary electric vehicles use overhead lines (CR) or conductive tracks.

Table 1.
Efficiencies of various powertrains.
2.3. WTT of the e-Fuels
Estimating emissions related to fuel production requires accounting for all the energy and mass input, and to distribute the emissions among the outputs of the process. The methodology here proposed is based on the ISO standard [35] and tuned according to the JEC v5.
The pathways are here described in terms of technologies, and the suggested methodology to calculate GHG is provided, indicating the relevant assumptions to be made, input data used, and data sources. Technological considerations have been presented to introduce the fuel pathways where relevant.
It is worth mentioning that at the European level, a specific Delegated Act is under discussion providing a methodology for calculating the GHG intensity of RFNBO, which is a terminology including e-fuels.
For obtaining the CI of the various fuels, an Excel-based, in-house tool has been developed, able to match the inputs and allocate the emissions according to the defined methodology. Comparison with figures from other relevant studies (e.g., JEC v5 and Ricardo LCA) is used as a means of validation.
Results are expressed in terms of gCO2e per tonne km: the tonne moved for 1 km is the unit of service provided. The CI is reported in grams of CO2 equivalent, as N2O, CH4 and other GHG have been accounted for, by means of the conversion factors proposed in IPCC AR5.
Detailed tables for the inputs are available in Appendix A.
2.3.1. Electricity
The first energy vector to be considered is electricity. The average EU carbon intensity is taken from Scarlat et al. [36], as well as the carbon intensities for PV and wind electricity. In the EU REDII annexes, renewable energy is usually set as zero GHG emission. The approach of neglecting the emissions from renewable energy generation is scientifically debatable, as for renewable plants the GHG impact of the energy embedded in the material can hardly be negligible. Moreover, setting electricity input to zero does not allow for identifying the major energy inputs for a certain process, thus losing resolution for the analysis. In light of the abovementioned considerations, the carbon intensities for the various options are reported in the following Table 2.
Table 2.
Carbon intensity of electricity (from Scarlat et al. [36]).
2.3.2. Liquefied Hydrogen
The production of Liquefied Hydrogen (LH2) was assumed to take place in a medium-size plant via electrolysis. Different primary sources for the electrical energy used in the electrolysis process were considered. The location of the Hydrogen production plant, and the deployment of such a kind of infrastructure, has been considered in a scenario with high penetration of LH2 for the road sector. This implies having relatively short transportation distances and a widespread distribution infrastructure. The CI of liquefied Hydrogen production via electrolysis can be calculated under a pure attributional approach, which only requires one to estimate the emission factors for the electricity input and to decide the allocation criteria for the inputs between the two products: H2 and O2. Specifically, on this point, we propose to allocate all the emissions to the Hydrogen, as a benchmark scenario, and in line with the energy allocation criteria followed in relevant regulations for alternative fuels, e.g., REDII and CORSIA [37]. This is consistent with the current approach taken for the realization of new plants, where the focus is on Hydrogen production and Oxygen can be considered a by-product. On the other hand, it is true that liquefied Oxygen (four bar) has many industrial applications and it holds a clear economic value. Therefore, as also Oxygen may have a relevant economic value, emissions could be allocated to both H2 and O2 streams, on the basis of the ratio of the relative economic value €_tH2/€_tO2. The economic allocation allows us to tackle the issue of energy allocation between streams with no Lower Heating Value (LHV), also considering the economic values of the stream which is not captured by mass allocation.
The resulting WTT carbon intensity for LH2 (as a function of the electricity used) is reported in Table 3. All the details of the modelling performed are reported in the additional material.
Table 3.
Carbon Intensity of LH2.
The values here presented are in line with the estimations proposed by RICARDO [26], while they slightly diverge from JEC v5, since in the latter study the electricity from renewables is considered as having a zero carbon intensity.
2.3.3. eLNG
Liquefied Natural Gas (LNG) appears today to be a fairly diffused option for trucks [38]. However, the environmental benefits of using natural gas instead of diesel are minor if no alternatives to fossil NG are considered. The power to methane technology, or Power-to-Gas (PtG), allows for considering the production of LNG using renewable energy (eLNG). PtG, as proposed and developed over the past three decades, has recently gained momentum: methanation can be considered as a means to valorize carbon dioxide streams, and store renewable energy in the form of a gaseous vector. Catalytic methanation could be considered technologically mature; however, current costs are limiting its diffusion. In this regard, the Jupiter1000 project [39] launched by SNAM in 2018 is an interesting initiative. Once the methane is produced, it can be liquefied to eLNG.
The boundaries of this pathway are defined considering the electricity, the H2, and the CO2 as the main inputs for the process. As regards H2, the figures calculated in the previous pathway are used. The results of the simulations carried out for this study are reported in Table 4.
Table 4.
Carbon intensity of eLNG.
In the JEC v5 WTT also the RELG1 pathway is given: synthetic methane (SLNG) from renewable electricity (CO2 from flue gases), with a WTT figure of 6.7 gCO2eq/MJ. This value, in between our PV and wind values, is linked to the assumption of zero GHG emissions for the renewable energy used. This JEC value derives only from the emissions of the liquefaction and transport stages.
As for the other e-fuel pathways, it is worth remarking that these figures do not consider the combustion of the fuel. This is an important caveat, as the CO2 used in the production process is assumed to be from a fossil feedstock and, therefore, when eventually released in combustion, results in a net emission. These carbon atoms, when oxidized and released in the atmosphere, may contribute to increase the CO2 concentration in the atmosphere. The way to address the final CO2 emissions for the fuel use implies considering a counterfactual scenario, which can lead to different results. In the case that Carbon Capture and Storage (CCS) is added to a net emitter (i.e., emission from a cement plant, or a refinery), the CO2 from combusting the fuels is not going to alter the CO2 balance, as the CO2 emission would have occurred anyway. An example of this approach is in the Alcohol-to-Jet pathways via waste gas in the CORSIA initiative [40]. The main advantage of using CO2 from a concentrated stream is that the resulting fuels actually displace a fossil fuel unit, thus avoiding the emissions related to the extraction, refining, and use of new crude.
2.3.4. eDiesel
eDiesel, also known as synthetic diesel, can be produced following several pathways. According to a recent study published by TNO [41], among the possible routes for producing e-diesel, of particular interest are:
- Fischer–Tropsch (FT) technology and hydrocracker, from e-syngas produced on green hydrogen and CO2;
- production starting from e-methanol, this is produced from green hydrogen and CO2.
The TNO study reports similar production costs for the two routes. We decided to address the FT option, as this is the one proposed by several industrial developers, such as the AUDI research centre [42], which recently tested a pilot plant in partnership with a company named Sunfire [43]. In line with other e-fuel pathways, the definition of the source for the primary energy used is crucial for the definition of the CI performances.
Based on the same electricity figures as for the previous pathways, the resulting GHG emissions are reported in Table 5.
Table 5.
Carbon intensity of eDiesel.
In the WTT JEC v5 study, where the CI of renewable energy is set at zero, the value proposed for eDiesel is 0.8 gCO2eq/MJ for the RESD2x: Renewable Electricity to SynDiesel high temperature electrolysis based on Solid Oxide Electrolyzer and FT route (CO2 from flue gases, biogas upgrading, and direct air capture); in the RICARDO LCA study, the value is instead slightly lower than 50 gCO2/MJ, based on a renewable energy supply.
2.3.5. Fossil Diesel
The fossil diesel is here taken as the benchmark against which the GHG emissions of the alternative options are compared. The complexity of modelling the refinery, and allocating the emissions to the various outputs, requires the use of advanced Linear Programming tools (LP models). This suggests considering the CI of the regular fossil diesel from relevant studies instead of proposing a poorly reliable model. Here, the CI has been derived from JEC WTT v5 [13]: 92.1 gCO2eq/MJ.
2.4. WTW Integration
By integrating WTT and TTW values, it is possible to estimate the net gCO2eq emissions per unit of service, expressed in tonne transported per km. The WTT and TTW can be coupled to depict the possible fuel/powertrain options. These are reported in Figure 1.
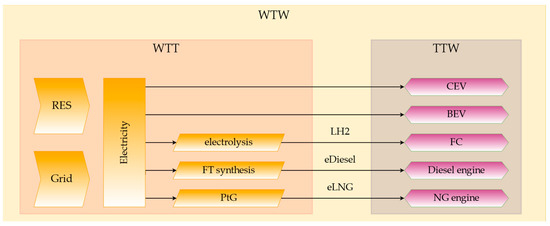
Figure 1.
Schematic of the WTW integration process.
The equation to integrate WTW values is therefore:
3. Results and Discussion
In this section, the model previously described is applied to derive the WTW emissions for the various pathways under study. The WTW emissions of the conventional, fossil-fuel-supplied heavy-duty vehicle is used as reference to derive the emission savings attainable from each pathway. The emissions savings are firstly reported under different levels of CI of the electricity which is used as feedstock for the production of the fuels. In particular, the case in which electricity is taken from the grid (using an average CI for EU countries) is compared to the scenario in which fuels are produced using renewable energy from solar and wind resources. Subsequently, the emission savings achievable by single EU countries is reported, using the specific CI values of the national grids. Finally, the technical and non-technical enablers and barriers are presented, and the different pathways are qualitatively evaluated according to these criteria.
3.1. GHG Savings Assessment
The WTW emissions for the different HD alternatives can be calculated by applying Equation (1). Table 6 summarizes the results obtained for all the alternative pathways, under different CIs for the electricity used as feedstock for the production of the fuels.
Table 6.
Resulting WTW emissions (gCO2e/tonne km) for the selected fuel–powertrains couples.
The figures show that a net savings can be always obtained compared to the fossil fuel benchmark when electricity is used either in a BEV or on a CR (see Figure 2). When electricity is used to produce a fuel/energy vector (e.g., Hydrogen), for all LH2, eLNG, and eDiesel, the GHG savings can be achieved if the electricity production is decarbonized.
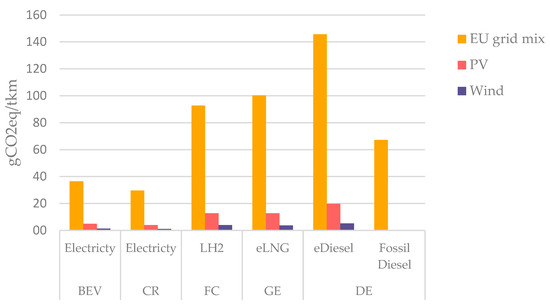
Figure 2.
WTW results for the investigated fuel–powertrains options.
It is worth highlighting that the use of LH2 in a fuel-cell-powered vehicle reaches almost the same benefits as those achieved by eLNG in a gas engine (Table 7). The findings of this work are in line with other evaluations, such as Gustafson at al. [10].
Table 7.
Perceptual GHG saving for the selected fuel–powertrains couples.
As expected, the effect of the origin of electricity on the fuel cycle emissions is crucial, leading to potential GHG savings of up to 98%. On one hand, this consideration leads to the need for accounting for the potential effect of lowering the CI of the grid in the WTT assessment. This can be done by using the specific targets set by many countries or regions, e.g., the expected 55% reduction in 2030 set in the European Fit-for-55 package [44]. At the same time, this analysis could be carried out at the country level, where the grid may have a significantly lower GHG intensity.
The effect of the CI of the electricity used for the various pathways is reported in Figure 3. The bars represent the variability that can be observed in the EU27 member states, with the purple line being the value corresponding to the EU27 grid mix.
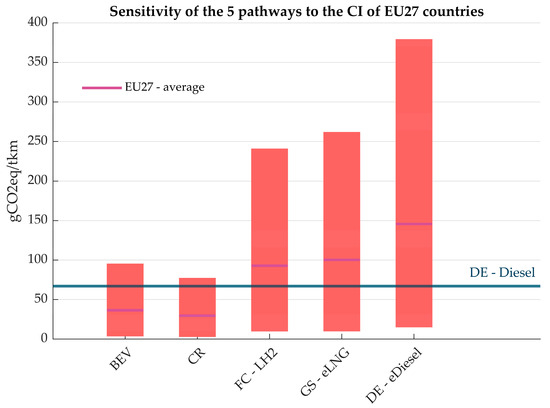
Figure 3.
WTW results as function of the electricity Carbon Intensity.
An example of the achievable advantages, as a function of the CI of the national grid, is reported in Figure 4 using the figures from Scarlat et al. In this figure, the central black line shows the CI of the national grid. The higher the grid CI is, the lower are the potential benefits of using electricity as an alternative to current standard fuel–powertrain options. Conversely, for countries with very low CI grids, the shift toward electricity can deliver a significant savings; similarly, also for e-fuels, the higher the grid CI, the lower the potential benefits.
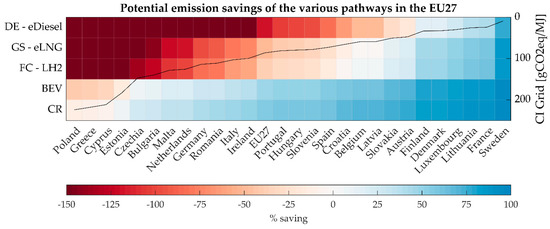
Figure 4.
WTW results for the investigated e-fuels-powered powertrain options.
3.2. Potential Technical and Non-Technical Barriers for the Alternative Options
The real market penetration of the various options analyzed will certainly be driven by the potential GHG savings, but will also be enhanced/limited by other relevant technical and non-technical factors.
In defining such potential enablers/barriers for the deployment of an alternative fuel value chain for the transport sector, production costs are usually recognized as a key parameter. However, besides this fundamental factor, the fuel market penetration is affected by several other elements that need to be taken into consideration, including specific engine requirements, regulatory drivers, fuel supply availability, energy density, operators’ expertise, etc. In particular, we would like to stress the importance of:
- GHG emissions potential: to be considered in the framework of the regulatory expectations.
- Costs: the importance of costs is linked to current and future price differentials with existing, oil-based options.
- Marginal abatement cost potential: defined as the ratio between the two abovementioned parameters, which allows for determining the CO2 marginal abatement cost (€/tCO2saved) of the various options. This is a key parameter for adopting one technological option over others.
- Sustainability: defined as per the REDII.
- Supply availability (or Commercial Readiness Level) of the fuel.
- Capital investment intensity: level of investment required for developing a production site and/or a specific infrastructure.
- Specific need for infrastructure and refuelling points.
- Expertise of the operators along the supply chain: this relates to safety of the handling.
- Regulations: expected to contribute to shape some of the framework conditions in which the sector will operate and develop.
- Expected competition with other sectors (e.g., industry demand for green electricity and/or aviation and maritime fuel demand): this may lead to price increase and/or reduced availability.
A graphical representation of our evaluation is provided in Table 8. We have used color coding to differentiate whether a certain factor is an enabler or, rather, a barrier.
Table 8.
Technical and non-technical enablers/barriers.
4. Discussion
As shown in Table 8, all the analyzed fuel–powertrain options provide relevant GHG savings when compared with the current fossil-based powertrains; this is therefore a clear enabler for the market deployment of all these options.
The production costs are instead a relevant topic for all the alternatives. The different grades assigned to the e-fuels with respect to the direct use of the electricity is related to fact that, for any scenario of electricity cost, the e-fuels will have a longer value chain and a lower conversion efficiency.
The two last elements, when put together, give the results for the CO2 marginal abatement cost, usually expressed in € per tonne of saved CO2. This marginal abatement cost is used to compare technologies in order to prioritize/incentivize the most cost-effective ones. It has to be noted that due to the current level of information from pilot initiatives, and the uncertainty about production costs, the value for the marginal abatement cost can only be broadly estimated.
As far as sustainability is concerned, all the options are expected to comply with the existing standards. There are for e-fuel medium-term risks related to the specific provisions contained in the draft Delegated Act of the REDII: the need for creating new renewable power capacity to supply production, and the progressive phasing out of the possibility of using fossil-derived CO2 from point sources.
Regarding investments, the e-fuels technologies are generally recognized as expensive in terms of CAPital EXpenditures (CAPEX). In particular, for eLNG and eDiesel, when supplied through the Direct Air Capture technology (DAC), the expected CAPEX intensity per unit of product is very high. On the other hand, it has to be noted that such a level of investments would enable economies of scale in production, and drive production costs down. Boosting the production and uptake of e-fuels is expected to attract important investments in the EU, and this would be an important lever for the policy support that is clearly needed for these technologies. Conversely, as a result of a lack of investment supported by a proper policy context, the production costs remain high and production levels may be negligible.
A major element which distinguishes the direct use of electricity and the e-fuels, as tools for the HD sector decarbonization, is the need for new infrastructures. The use of electricity in a BEV requires, apart from the development of new battery technologies, new, widely distributed refuelling stations. This is connected to the improvement of the distribution grid. For CR, the need for infrastructure is also evident. Possibly, the use of both solutions in a coordinated manner could limit this significant bottleneck, expected in the short term. Conversely, e-fuels are fully drop-in fuels, capable to be blended at various percentages with existing fuels, and therefore without relevant issues related to infrastructure availability and operators’ expertise. Additionally, it is worth remarking that e-fuels can act as chemical storage, allowing the storage of variable renewable electricity from the production peaks that cannot be handled by the grid, and thus providing a balancing service and reducing the need for improving the distribution grid.
Specifically, for e-fuels, despite the great interest shown by the transport sector, the current produced volumes are negligible. This low availability does not allow for pilot initiatives at relevant scale, and in a moment of a strong push towards decarbonization, other technological options may fill the existing need.
At the time of writing, the policy context and the regulations under development seem to be favorable to both potential uses of electricity. However, in spite of the general support from the policy side for low-carbon fuels, the road sector does not have specific mandates; e-fuels (RFNBO in REDII) are not part of the specific sub-target for advanced fuels under REDII, even if they will possibly be added during the ongoing revision of such relevant directives. It is worth noticing that the revision of the EU-ETS scheme contains the inclusion of all the transport modes (road, maritime, and aviation). Under the ETS, the value of a fuel is going to be linked to the value of the GHG savings provided by its use. The price of the tonne of CO2 is today around 80 € [45], which is determined by means of auctions on allowances auctioned or sold (EUAs and EUAAs), as per the European Energy Exchange (EEX) and the Intercontinental Exchange (ICE).
This last consideration allows us to mention the last column of Table 8, related to competition with other sectors. For the direct use of green electricity in the road sector, the main competitors will be other industrial and civil segments. Many industrial and civil uses are today transitioning towards electricity, with the clear goal of reducing the carbon footprint of its production and final uses. We could imagine that the price of the electrical unit will be determined by the complex interactions between hourly production and demand. For e-fuels—the production of which is expected to be mostly supplied by dedicated renewable-based plants—the main competition will be the demand of other hard-to-abate sectors, namely maritime and aviation. The aviation sector, in particular, already sets a specific mandate for e-fuels; the ReFuelEU regulation sets mandates on a volume basis, growing over time.
5. Conclusions
The freight sector will remain a fundamental asset for any modern economy, but the increasing GHG impact of heavy-duty vehicles needs to be tackled. In particular, road HD is expected to benefit from the technological development deriving from the passenger cars electrification wave, even if liquid fuels may play a significant role in the short-/medium-term, especially for long-haul services. Nonetheless, while e-fuels are ready to be taken up in blends with regular fuels, the need for new and complex infrastructures is often an issue not sufficiently addressed and investigated in the developed electrification scenarios.
The e-fuels (or PtX, or RFNBO, low-carbon or Synthetic Fuels in the EU context) are expected to significantly contribute to the decarbonization of the hard-to-abate sectors, such as road, maritime, and aviation, as they do not require changes in infrastructures or engines. However, in the EU, the current legislative framework—based on a TTW approach—does not allow for catching the benefits of using sustainable alternative fuels, such as e-fuels.
According to our modelling of the various options for HD, apart from the direct use of electricity, LH2, eLNG, and eDiesel can all provide significant GHG savings (>94%). Clearly, when assessed on a WTW basis, the e-fuels are particularly interesting options when low CI electricity is used.
If the WTW analysis suggests that BEV and CR can provide relevant GHG savings (>98%), it is true that the former needs additional research to be able to provide the autonomy required by the freight sector, while the latter needs significant investments in infrastructures. To that extent, the advantages of using a liquid drop-in, energy-dense fuel are clear and substantial for the sector, without losing GHG performance.
Additionally, it is worth remarking that e-fuels can act as chemical storage, allowing storage of the variable renewable electricity from production peaks that cannot be handled by the grid, thus providing a balancing service.
Author Contributions
Conceptualization and methodology, M.P.; validation, D.C.; resources, M.P. and L.T.; data curation, M.P. and L.L.; writing—original draft preparation, M.P.; writing—review and editing, L.L. and L.T.; visualization, L.L.; supervision and revision, D.C. All authors have read and agreed to the published version of the manuscript.
Funding
This research received no external funding.
Data Availability Statement
Data are contained within the article or in the Appendix A.
Conflicts of Interest
The authors declare no conflict of interest.
Abbreviations
| BEV | Battery Electric Vehicles |
| CAPEX | Capital Expenditures |
| CCS | Carbon Capture and Storage |
| CEV | Catenary Electric Vehicles |
| CI | Carbon Intensity |
| CR | Catenary Road |
| DAC | Direct Air Capture |
| DE | Diesel Engine |
| eDiesel | Synthetic Diesel |
| eLNG | Synthetic Liquefied Natural Gas |
| EU | European Union |
| FC | Fuel Cell |
| FT | Fischer–Tropsch |
| GE | Gas Engine |
| GHG | Greenhouse Gas |
| HD | Heavy-Duty |
| HDV | Heavy-Duty Vehicle |
| IEA | International Energy Agency |
| LCA | Life Cycle Analysis |
| LDV | Light-Duty Vehicle |
| LH2 | Liquified Hydrogen |
| LNG | Liquefied Natural Gas |
| LP | Linear Programming |
| PtG | Power-to-Gas |
| RFNBO | Renewable Fuels of Non-Biological Origin |
| SLNG | Synthetic Methane |
| TTW | Tank-To-Wheels |
| WTT | Well-To-Tank |
| WTW | Well-To-Wheels |
Appendix A. WTT Inputs for the Proposed Pathways
Appendix A.1. Liquefied Hydrogen (LH2)
Considering the state of the art of Hydrogen production technologies, here an Alkaline water electrolyzer (AWE) has been modelled. An average electrolyzer of about 150 kW, with a production of H2 ranging between 100–950 Sm3/H2, has been considered. According to industrial plants data and literature [46], a specific consumption of 4.6 kWh/Sm3 (184 MJ/kgH2) is therefore proposed for the simulations. The assumed specific consumption for liquefaction is 10 kWh/kgH2 (36 MJ/kgH2) [47].
Liquefied Hydrogen (here assumed at 1 bar and −253 K) can be transported in large tankers, which have been here assumed supplied by the LH2 itself. From JEC WTT v5, the consumption of a VECTO group 5 truck with fuel cell powertrain is reported as 0.5829 MJ per tonne per km. Data on the LH2 production chain are reported in Table A1.
Table A1.
Main inputs for LH2 production.
Table A1.
Main inputs for LH2 production.
| Input Name | U.M. | Value |
|---|---|---|
| Input for electrolyzer | MJ/kgH2 | 4.6 |
| Input for liquefaction | MJ/kgH2 | 36 |
| Input for transport | MJ/kgH2 | 0.09 |
Appendix A.2. eLNG
The production of eLNG is based on the use of electrical energy, concentrated C2, and pure H2. Methanation can be considered as a means to valorize carbon dioxide streams. However, for CO2-concentrated feed the thermodynamic limitations are very strong, and the reaction is highly exothermal. A challenge involved in methanation is therefore the temperature control of the exothermic reactions, meaning an efficient heat removal, which is closely linked to reactor design. A schematic of the process can be found in works such as Qi et al. (2022) [48]. An input usually not considered is the energy required for heat removal; assuming removal of the excess heat (0.25 MJ/MJCH4) [49], the energy for water pumping and heat dissipation has to be considered.
The H2 for feeding the methanation stage is required to be pressurized. However, as the methanation process is carried out at operating pressures between 10 and 30 bar, using appropriate conditions for the electrolyzer may reduce the need for additional compression stages. The hydrogen input is considered at feeding pressure, so no additional energy demand is foreseen for this stage.
For the CO2, the energy consumption for the CCS has been considered according to Jackson, S., and Brodal, E. (2019) [50]: the authors report an energy demand for the capture plant within the range of 250–300 kWh of electrical energy per tonne of CO2 captured, and estimate the energy consumption for CO2 compression typically falling in the range 80–120 kWhe/tCO2.
Liquefying natural gas is a high energy consumption process, and it is estimated that for producing one kg of LNG, assuming the composition of CH4 and considering a higher pressure for the process of 55 bar (the critical pressure of CH4 is 46 bar), a compression of about 800–860 kJ/kg is necessary (considering a compression efficiency in the range between 0.8 and 0.85); however, in real configurations the energy consumption could be sensibly higher than the value considered before. Quiang et al. [51] considered an amount of energy required of 850 kWh/kg, corresponding to about 3 MJ/kg. Gerasimov et al. proposed a plant in which the amount of energy consumed is about 700–800 kWh/kg (2.5–2.8 MJ/kg) [52].
For the transport stage, the typical truck for liquid fuel transport has been considered, with the values for the specific consumption taken from the JEC TTW v5 report. The fuel used for the transport is the eLNG itself, so the impact of the transport stage needs to be calculated iteratively. Data are summarized in Table A2.
Table A2.
Main inputs for eLNG production.
Table A2.
Main inputs for eLNG production.
| Step | Value | UM |
|---|---|---|
| H2 compression for the intermediate storage | 0 | kWh/kgH2 |
| H2 input | 1.15 | MJ/MJCH4 |
| CO2 input | 0.056 | kg/MJCH4 |
| Energy for heat removal (reactor cooling) | 0.0027 | MJ/MJCH4 |
| LNG compression | 2.8 | MJ/kgLNG |
| Transport | 0.000657 | MJ/MJfuel |
Appendix A.3. eDiesel
Production of eDiesel from concentrate CO2 and pure H2 has been modelled considering a FT conversion technology. The FT process can be carried out within a wide range of conditions that impact the final product’s composition. The generic output from an FT process could be similar to a crude cut, with different average carbon number and a specific distribution dispersion. High temperature (270 °C) and pressure (27 atm) favors the production of heavy waxes, needing additional steps to be converted to liquid fuels through hydrocracking. The selectivity towards liquid fuels is favored by low temperature (240 °C) and higher pressure (30 atm). Given the abovementioned pressure levels, no additional compressions stages have been considered for H2 supply, as electrolyzers can operate in this range.
For the CO2, the energy consumption for the CCS has been considered according to Jackson, S., and Brodal, E. (2019) [50]: an energy demand for the capture plant within the range of 250–300 kWhel. per tonne of CO2 captured, and an estimate for the energy consumption for CO2 compression typically falling in the range 80–120 kWhe/tCO2.
For the main process, Concawe [53] in 2020 proposed a literature review: the mass balance to produce 1 liter of liquid e-fuel is estimated at 3.7–4.5 liters of water, 82–99 MJ of renewable electricity, and 2.9–3.6 kg of CO2. The input data for eDiesel production are summarized in Table A3.
Table A3.
Main inputs for eDiesel production.
Table A3.
Main inputs for eDiesel production.
| Stream | U.M. | Quantity |
|---|---|---|
| H2O | liter | 4.0 |
| CO2 | kg | 3.2 |
| Electricity | MJ | 85 |
| eDiesel | liter | 1 |
References
- IEA. Transport—Topics—IEA. Available online: https://www.iea.org/topics/transport (accessed on 16 June 2022).
- Fleming, K.L.; Brown, A.L.; Fulton, L.; Miller, M. Electrification of Medium- and Heavy-Duty Ground Transportation: Status Report. Curr. Sustain. Energy Rep. 2021, 8, 180–188. [Google Scholar] [CrossRef]
- IEA. Transport Sector CO2 Emissions by Mode in the Sustainable Development Scenario, 2000–2030—Charts—Data & Statistics—IEA. Available online: https://www.iea.org/data-and-statistics/charts/transport-sector-co2-emissions-by-mode-in-the-sustainable-development-scenario-2000-2030 (accessed on 16 June 2022).
- Keller, V.; Lyseng, B.; Wade, C.; Scholtysik, S.; Fowler, M.; Donald, J.; Palmer-Wilson, K.; Robertson, B.; Wild, P.; Rowe, A. Electricity system and emission impact of direct and indirect electrification of heavy-duty transportation. Energy 2019, 172, 740–751. [Google Scholar] [CrossRef]
- Verger, T.; Azimov, U.; Adeniyi, O. Biomass-based fuel blends as an alternative for the future heavy-duty transport: A review. Renew. Sustain. Energy Rev. 2022, 161, 112391. [Google Scholar] [CrossRef]
- Directive (EU) 2018/2001 of the European Parliament and of the Council of 11 December 2018 on the promotion of the use of energy from renewable sources. Off. J. Eur. Union 2018, L328, 82–209.
- Helgeson, B.; Peter, J. The role of electricity in decarbonizing European road transport—Development and assessment of an integrated multi-sectoral model. Appl. Energy 2020, 262, 114365. [Google Scholar] [CrossRef]
- Mulholland, E.; Teter, J.; Cazzola, P.; McDonald, Z.; Gallachóir, B.P. The long haul towards decarbonising road freight—A global assessment to 2050. Appl. Energy 2018, 216, 678–693. [Google Scholar] [CrossRef]
- Zhang, X.; Lin, Z.; Crawford, C.; Li, S. Techno-economic comparison of electrification for heavy-duty trucks in China by 2040. Transp. Res. Part D Transp. Environ. 2022, 102, 103152. [Google Scholar] [CrossRef]
- Gustafsson, M.; Svensson, N.; Eklund, M.; Öberg, J.D.; Vehabovic, A. Well-to-wheel greenhouse gas emissions of heavy-duty transports: Influence of electricity carbon intensity. Transp. Res. Part D Transp. Environ. 2021, 93, 102757. [Google Scholar] [CrossRef]
- Smallbone, A.; Jia, B.; Atkins, P.; Roskilly, A.P. The impact of disruptive powertrain technologies on energy consumption and carbon dioxide emissions from heavy-duty vehicles. Energy Convers. Manag. X 2020, 6, 100030. [Google Scholar] [CrossRef]
- Liu, X.; Elgowainy, A.; Vijayagopal, R.; Wang, M. Well-to-Wheels Analysis of Zero-Emission Plug-In Battery Electric Vehicle Technology for Medium- and Heavy-Duty Trucks. Environ. Sci. Technol. 2021, 55, 538–546. [Google Scholar] [CrossRef]
- Prussi, M.; Yugo, M.; de Prada, L.; Padella, M.; Edwards, R.; Lonza, L. JEC Well-to-Tank Report v5. 2020, p. 248. Available online: https://ec.europa.eu/jrc/en/publication/eur-scientific-and-technical-research-reports/jec-well-tank-report-v5 (accessed on 16 June 2022).
- ACEA. Position Paper—Life Cycle Assessment in the Automotive Industry. 2021. Available online: www.acea.auto (accessed on 16 June 2022).
- Bieker, G. A Global Comparison of the Life-Cycle Greenhouse Gas Emissions of Combustion Engine and Electric Passenger Cars. 2021. Available online: www.theicct.orgcommunications@theicct.org (accessed on 16 June 2022).
- Lalwani, R.; Saravanan, N.; Veeraputhiran, A.; IlavarasIi, D. Life Cycle Assessment of a Passenger Vehicle to Analyze the Environmental Impacts Using Cradle to Grave Approach; SAE Technical Paper 2019-28-2581; SAE International: Warrendale, PA, USA, 2019. [Google Scholar] [CrossRef]
- Ternel, C.; Bouter, A.; Melgar, J. Life cycle assessment of mid-range passenger cars powered by liquid and gaseous biofuels: Comparison with greenhouse gas emissions of electric vehicles and forecast to 2030. Transp. Res. Part D Transp. Environ. 2021, 97, 102897. [Google Scholar] [CrossRef]
- Lao, J.; Song, H.; Wang, C.; Zhou, Y.; Wang, J. Reducing atmospheric pollutant and greenhouse gas emissions of heavy duty trucks by substituting diesel with hydrogen in Beijing-Tianjin-Hebei-Shandong region, China. Int. J. Hydrogen Energy 2021, 46, 18137–18152. [Google Scholar] [CrossRef]
- Gunawan, T.A.; Monaghan, R.F. Techno-econo-environmental comparisons of zero- and low-emission heavy-duty trucks. Appl. Energy 2022, 308, 118327. [Google Scholar] [CrossRef]
- Zhao, F.; Liu, F.; Liu, Z.; Hao, H. The correlated impacts of fuel consumption improvements and vehicle electrification on vehicle greenhouse gas emissions in China. J. Clean. Prod. 2019, 207, 702–716. [Google Scholar] [CrossRef]
- Çabukoglu, E.; Georges, G.; Küng, L.; Pareschi, G.; Boulouchos, K. Battery electric propulsion: An option for heavy-duty vehicles? Results from a Swiss case-study. Transp. Res. Part C Emerg. Technol. 2018, 88, 107–123. [Google Scholar] [CrossRef]
- Çabukoglu, E.; Georges, G.; Küng, L.; Pareschi, G.; Boulouchos, K. Fuel cell electric vehicles: An option to decarbonize heavy-duty transport? Results from a Swiss case-study. Transp. Res. Part D Transp. Environ. 2019, 70, 35–48. [Google Scholar] [CrossRef]
- Forrest, K.; Mac Kinnon, M.; Tarroja, B.; Samuelsen, S. Estimating the technical feasibility of fuel cell and battery electric vehicles for the medium and heavy duty sectors in California. Appl. Energy 2020, 276, 115439. [Google Scholar] [CrossRef]
- El Helou, R.; Sivaranjani, S.; Kalathil, D.; Schaper, A.; Xie, L. The impact of heavy-duty vehicle electrification on large power grids: A synthetic Texas case study. Adv. Appl. Energy 2022, 6, 100093. [Google Scholar] [CrossRef]
- Zhao, H.; Wang, Q.; Fulton, L.; Jaller, M.; Burke, A. A Comparison of Zero-Emission Highway Trucking Technologies; Institute of Transportation Studies University of California, Davis: Davis, CA, USA, 2018. [Google Scholar] [CrossRef]
- European Commission; Nikolas, H.; Sofia, A.; Samantha, M.-P.; Tom, N.; Judith, B.; Hinrich, H.; Horst, F.; Kirsten, B.; Nabil, A.; et al. Determining the Environmental Impacts of Conventional and Alternatively Fuelled Vehicles through LCA: Final Report; Publications Office of the European Union: Luxembourg, 2020. [CrossRef]
- Prussi, M.; Yugo, M.; de Prada, L.; Padella, M.; Edwards, M. JEC Well-To-Wheels Report v5. 2020, p. 135. Available online: https://publications.jrc.ec.europa.eu/repository/handle/JRC121213 (accessed on 16 June 2022).
- Cai, H.; Prussi, M.; Ou, L.; Wang, M.; Yugo, M.; Lonza, L.; Scarlat, N. Decarbonization potential of on-road fuels and powertrains in the European Union and the United States: A well-to-wheels assessment. Sustain. Energy Fuels 2022, 6, 4398–4417. [Google Scholar] [CrossRef]
- Nordelöf, A.; Messagie, M.; Tillman, A.-M.; Söderman, M.L.; Van Mierlo, J. Environmental impacts of hybrid, plug-in hybrid, and battery electric vehicles—What can we learn from life cycle assessment? Int. J. Life Cycle Assess. 2014, 19, 1866–1890. [Google Scholar] [CrossRef]
- Bandivadekar, A.; Bodek, K.; Cheah, L.; Evans, C.; Groode, T.; Heywood, J.; Kasseris, E.; Kromer, M.; Weiss, M. On the Road in 2035; Massachusetts Institute of Technology: Cambridge, MA, USA, 2008. [Google Scholar]
- Marmiroli, B.; Venditti, M.; Dotelli, G.; Spessa, E. The transport of goods in the urban environment: A comparative life cycle assessment of electric, compressed natural gas and diesel light-duty vehicles. Appl. Energy 2020, 260, 114236. [Google Scholar] [CrossRef]
- Nordelöf, A.; Romare, M.; Tivander, J. Life cycle assessment of city buses powered by electricity, hydrogenated vegetable oil or diesel. Transp. Res. Part D Transp. Environ. 2019, 75, 211–222. [Google Scholar] [CrossRef]
- Röck, M.; Rexeis, M.; Hausberger, S. JEC Tank-to-Wheels Report v5: Heavy Duty Vehicles; Publications Office of the European Union: Luxembourg, 2020. [CrossRef]
- European Commision. Vehicle Energy Consumption Calculation TOol—VECTO. Available online: https://ec.europa.eu/clima/eu-action/transport-emissions/road-transport-reducing-co2-emissions-vehicles/vehicle-energy-consumption-calculation-tool-vecto_en (accessed on 16 June 2022).
- ISO 14044:2006; Environmental Management—Life Cycle Assessment—Requirements and Guidelines. International Organization for Standardization: Geneva, Switzerland, 2006.
- Scarlat, N.; Prussi, M.; Padella, M. Quantification of the carbon intensity of electricity produced and used in Europe. Appl. Energy 2022, 305, 117901. [Google Scholar] [CrossRef]
- Prussi, M.; Lee, U.; Wang, M.; Malina, R.; Valin, H.; Taheripour, F.; Velarde, C.; Staples, M.D.; Lonza, L.; Hileman, J.I. CORSIA: The first internationally adopted approach to calculate life-cycle GHG emissions for aviation fuels. Renew. Sustain. Energy Rev. 2021, 150, 111398. [Google Scholar] [CrossRef]
- NGVA Europe, Green Industry: LNG-Trucks Offer New Solutions for Heavy Loads and Long Distances. Available online: https://www.ngva.eu/medias/green-industry-lng-trucks-offer-new-solutions-for-heavy-loads-and-long-distances/ (accessed on 16 June 2022).
- GRTgaz, Jupiter1000. Available online: https://www.jupiter1000.eu/english (accessed on 16 June 2022).
- CORSIA. CORSIA Supporting Document—CORSIA Eligible Fuels-Life Cycle Assessment Methodology; ICAO: Montreal, QC, Canada, 2021. [Google Scholar]
- Saric, M.; Detz, R.; van Kranenburg, K. Evaluation of Different Routes for E-Diesel and E-Kerosine Supply in the Port of Rotterdam. 2021. Available online: https://publications.tno.nl/publication/34639115/MybRuD/TNO-2021-R12731.pdf (accessed on 30 August 2022).
- Audi Media Center, Production Process E-Diesel. Available online: https://www.audi-mediacenter.com/en/photos/detail/production-process-e-diesel-55305 (accessed on 16 June 2022).
- Sunfire, E-Fuel. Available online: https://www.sunfire.de/en/e-fuel (accessed on 16 June 2022).
- European Council. Fit for 55—The EU’s Plan for a Green Transition—Consilium. Available online: https://www.consilium.europa.eu/en/policies/green-deal/fit-for-55-the-eu-plan-for-a-green-transition/ (accessed on 16 June 2022).
- EU Carbon Price Tracker | Ember. Available online: https://ember-climate.org/data/data-tools/carbon-price-viewer/ (accessed on 16 June 2022).
- Buttler, A.; Spliethoff, H. Current status of water electrolysis for energy storage, grid balancing and sector coupling via power-to-gas and power-to-liquids: A review. Renew. Sustain. Energy Rev. 2018, 82, 2440–2454. [Google Scholar] [CrossRef]
- Bossel, U.; Eliasson, B. Energy and the Hydrogen Economy. Available online: https://www.google.com.hk/url?sa=t&rct=j&q=&esrc=s&source=web&cd=&ved=2ahUKEwjbiKOSjoj7AhUQ-jgGHbS1DW8QFnoECAoQAQ&url=https%3A%2F%2Fafdc.energy.gov%2Ffiles%2Fpdfs%2Fhyd_economy_bossel_eliasson.pdf&usg=AOvVaw3d9Ipp6KLMoFwj9NVpbfid (accessed on 27 October 2022).
- Qi, M.; Park, J.; Landon, R.S.; Kim, J.; Liu, Y.; Moon, I. Continuous and flexible Renewable-Power-to-Methane via liquid CO2 energy storage: Revisiting the techno-economic potential. Renew. Sustain. Energy Rev. 2022, 153, 111732. [Google Scholar] [CrossRef]
- Helmeth, Methanation Process. Available online: http://www.helmeth.eu/index.php/technologies/methanation-process (accessed on 17 June 2022).
- Jackson, S.; Brodal, E. Optimization of the Energy Consumption of a Carbon Capture and Sequestration Related Carbon Dioxide Compression Processes. Energies 2019, 12, 1603. [Google Scholar] [CrossRef]
- Qiang, W.; Yanzhong, L. Analysis of power cycle based on cold energy of liquefied natural gas and low-grade heat source. Appl. Therm. Eng. 2004, 24, 539–548. [Google Scholar] [CrossRef]
- Gerasimov, V.E.; Kuz’Menko, I.F.; Peredel’Skii, V.A.; Darbinyan, R.V. Introduction of Technologies and Equipment for Production, Storage, Transportation, and Use of LNG. Chem. Pet. Eng. 2004, 40, 31–35. [Google Scholar] [CrossRef]
- Soler, A. Role of e-Fuels in the European Transport System—Literature Review; Concawe: Brussels, Belgium, 2020. [Google Scholar]


Publisher’s Note: MDPI stays neutral with regard to jurisdictional claims in published maps and institutional affiliations. |
© 2022 by the authors. Licensee MDPI, Basel, Switzerland. This article is an open access article distributed under the terms and conditions of the Creative Commons Attribution (CC BY) license (https://creativecommons.org/licenses/by/4.0/).