Abstract
The authors compare the energy consumption and CO2 emissions from vehicles using internal combustion engines (ICE), battery electric vehicles (BEV), fuel cell electric vehicles (FCEV), and two types of hybrid vehicles, BEV-ICE hybrid and BEV-FCEV hybrid. This paper considers several scenarios for four countries’ electricity production from primary energy sources to estimate total CO2 release. Energy consumption of the vehicle per 100 km, emissions during manufacturing, battery production, and lifecycle of the vehicle are considered in the total amount evaluation of CO2 released. The results show that with current technologies for battery manufacturing, and a significant proportion of national grid electricity delivered by fossil fuels, BEV is the best choice to reduce carbon emissions for shorter driving ranges. In the case of electricity generation mainly by low-carbon sources, FCEV and BEV-FCEV hybrid vehicles end up with lower carbon dioxide emissions. In contrast, with electricity mainly generated from fossil fuels, electric vehicles do not reduce CO2 emissions compared to combustion cars.
1. Introduction
One of humanity’s main tasks in the 21st century is to significantly reduce global CO2 emissions that cause climate change [1]. Those harmful emissions have resulted from decades of using carbon-based fuels as the primary energy source, leading to significant global warming [2]. Nowadays, energy use per capita is far more than the earlier generations [3]. The reserve of fossil fuels on planet earth is found in various locations, and the predictions are that global energy demand will soon exceed supply. The need for alternative energy sources has become a priority during the last decades. This issue has acquired more attention by EU by focusing on alternative energy implemented through political compromise in Paris agreement 2016 [4]. The Intergovernmental Panel on Climate Change emphasised that greenhouse gas (GHG) emissions, including CO2, must be reduced by 45% before 2030 to limit severe environmental impacts [5]. Worldwide, the transport sector produces approximately a quarter of GHG emissions (24% in 2018) [6]. With increasing energy demand, global CO2 emissions are set to increase significantly. The need for sustainable and more efficient transportation systems is growing worldwide.
New alternative vehicles have been developed in recent years to mitigate the impact of harmful emissions in the transport sector. One type of alternative vehicle powertrain is the “hybrid car”. Gasoline-powered hybrid electric vehicles (HEV) and plug-in hybrid electric vehicles (PHEV) propelled by rechargeable batteries combined with an internal combustion engine (ICE). PHEVs can be recharged from the electric grid in addition to partial recharging from the IC engine, whereas HEVs (sometimes referred to as ‘mild hybrids’) are charged from the ICE engine and any kinetic energy recovery systems built into the vehicle. Biofuel contributes to limitations in oil consumption, but appear to be a temporary solution due to biomass availability limitations and insufficient annual production [7,8].
One step in decarbonising the transport sector has been performed by introducing battery electric vehicles (BEVs) and fuel cell electric vehicles (FCEV), so familiar as “zero emissions” cars. Those alternative vehicles don’t produce any harmful gases from their tailpipes, but GHGs are emitted while producing their fuels (electricity and hydrogen) on a large scale.
Battery electric vehicles (BEV) are fully powered by the energy stored in a large onboard lithium-ion battery (LIB). LIB is a type of battery of complex chemistry, which include lithium as a primary element, used as electrode and electrolyte components. A BEV’s performance is based on its battery pack’s power and energy capacity. An automotive battery pack typically consists of many cells (a few hundred to thousands), to meet the required energy of a BEV. LIB provides the highest energy density of all commercially available batteries [9,10,11]. It is about 0.876 MJ/kg, which results in a battery mass of at least 100 kg per 100 km driving range when fully charged [12]. Although LIB-based packs allow up to about 400 km driving range on a single charge, the cost of such car is nearly twice the price of the standard economy car [13].
Although BEVs appear to be less emitting than petrol-driven vehicles during operation, factors like mining/manufacturing to driving to disposal or recycling will significantly affect the total lifetime CO2 emissions from BEVs. Analysis suggests that mid-size BEVs will bring a 50% reduction in CO2 emission during operation compared to gasoline-driven vehicles of the same size [13,14]. The assumed CO2 reduction depends on how the electricity is produced during manufacturing, battery charging and during operation. The total emissions will be higher if the electricity is generated from non-renewable carbon-based primary sources.
Fuel cell electric vehicles (FCEV) have gradually penetrated the market since their advent 20 years ago. Fuel cells are typically classified according to the type of their electrolyte [15]. Most road transport fuel cells in use are proton exchange membrane fuel cells (PEMFC). PEMFCs are widely used due to their higher power-to-weight ratio and shorter start-up time. Phosphoric acid fuel cells (PAFC) have also seen some road transport applications and were first commercialised in buses in the early stage of their development [15].
Hydrogen production, storage and transport are essential elements in the total CO2 emissions. Most of the global industrial hydrogen demand is met by steam methane reforming (SMR). The other hydrogen production methods, such as water electrolysis, are likely to dominate in the future. In the electrolysis process, an electrical potential difference splits water molecules into hydrogen and oxygen. Until the recent surge in global methane prices, renewably powered alkaline electrolysis was not economically competitive with SMR-hydrogen due to the high electrical power demand for electrolysis. However, the hydrogen gas produced by electrolysis is of very high purity and ideal for PEMFC applications, as contaminations in hydrogen can inhibit the durability of the FC due to Pt catalyst poisoning.
Storing and transporting hydrogen can be performed by compressing the gas to very high pressures, by liquification at a temperature of about 20 K using cryotechnical methods. The third method is storing in different chemicals, where hydrogen is chemically or physically bonded to the host material. The last technology is still under significant research. Today’s existing and preferred method for storing and utilizing hydrogen is high-pressure compression in specially designed high-pressure containers. Liquification is typically applied for large-scale transportation due to the shorter storage time for cryogenic fluids. Ognissanto et al. [16] have investigated different scenarios for hydrogen generation, distribution and usage in FCEV and concluded that hydrogen produced by electrolysis using electricity from renewable (or nuclear) energy sources is the lowest CO2 emitting. Indeed, it appears to be competitive with BEV in terms of CO2 emissions. However, hydrogen refuelling requires significant investment in infrastructure. Investigating and evaluating alternative vehicles’ energy efficiency and CO2 emissions as well as considering the use of primary energy and different hydrogen and electricity production pathways is essential in future de-carbonisation discussions.
Well-to-wheel (WTW) GHG emissions comparison of alternative and currently used types of passenger cars, according to electricity and hydrogen production for South Korea for 2017 and future scenario 2030, was performed by Choi et al. [17]. The CO2 emissions generated by vehicle production and installation of the infrastructure were not included. South Korea imports about 94% of its total primary energy, and it still involves petroleum, natural gas, coal, uranium and about 5.7% (2017) of renewable energy. The lowest GHG emissions of 55 g CO2 eq./km were observed for FCEV due to the low GHG emissions of hydrogen production by naphtha cracking, while BEVs were found to emit 109 g CO2 eq./km.
Several other studies have concluded that BEVs are superior to FCEVs in terms of well-to-wheel efficiency and GHG emissions; if grid electricity, based on hydrocarbons or a mix of renewable and carbon-rich sources, is the energy source [18]. Many other works discuss that electric passenger vehicles have a limited driving range with a one-time battery charge [12,19,20].
It is generally assumed that using battery electric vehicles significantly reduces CO2 output compared to cars running on ICEs and that fuel cell electric vehicles do not (significantly) reduce CO2 output because of the energy conversion from electricity to hydrogen and back. While this will be true in many cases, it does not take into account that the production of the battery releases a lot of CO2 and that the CO2 released by electricity generation varies extremely depending on the energy source.
The present work aims to study the effect of varying the cruising range and thus the size of the power train and the battery and calculating the CO2 output during the lifetime of the car in four different European countries with different sources of energy ranging from nearly pure renewable energy (in Norway) to a coal-based generation (in Poland) to compare the effects of various sources of energies.
2. Materials and Methods
Calculations of total CO2 emissions in the lifetime of vehicles of the same size with different drive systems were performed, comparing battery electric vehicles (BEV) and fuel cell electric vehicle (FCEV) with cars using internal combustion engines (ICE) as well as two kinds of hybrids, the (BEV-ICE) hybrid car combining a battery motor with a combustion engine and the newer idea of combining a battery with a fuel cell car (BEV-FCEV).
The calculation includes CO2 emissions released due to the production of the car and its battery and running the vehicle throughout its life cycle. The latter strongly depends on the total mileage and (for electric vehicles) on the source of electricity production. The total mileage was arbitrarily set to 200,000 km. The influence of the source of electricity generation was studied by using mixtures of sources from different countries ranging from dominantly renewable sources in Norway to mainly coal in Poland.
One factor that has to be considered for a detailed calculation is the weight of the vehicle, as it has a significant influence on its energy consumption: The dependence of the consumption C(m) can be calculated as [12]:
C(m) = C(m0) (m/m0)0.6
The consumption C(m0) is assumed to be 0.557 kWh/km for an ICE-driven vehicle of m0 = 1200 kg weight corresponding to 6 L petrol per 100 km. The primary energy consumptions of the different cars are calculated from this value using Equation (1). Values for the different efficiencies of the driving systems, energy conversions and energy transport are listed in Appendix A.
As batteries have a significantly lower energy density than petrol, methane or hydrogen tanks, a heavy battery will be needed for a long cruising range, which increases the weight of the car compared to other driving systems. This increased weight requires more robust and thus heavier components (chassis, brakes, etc.), which makes it even heavier (Figure 1). The increased vehicle weight also increases energy consumption and reduces performance in terms of range and acceleration.
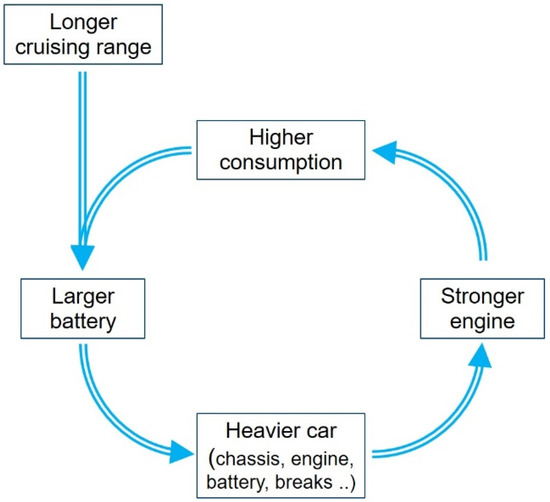
Figure 1.
Factors leading to higher vehicle weight.
For a fair comparison between power train types, the cars should have the same acceleration and speed. This can be achieved by keeping the power-to-weight ratio constant (set arbitrarily to 0.05 kW/kg). At the same time, the cruising range has to be kept constant by increasing the tank/battery according to the calculated consumption. A more powerful motor increases the vehicle’s weight again with the consequences described above. So, a second iteration of the same procedure is executed: updated consumption and engine power corresponding to the new weight, larger battery/tank giving a new weight, then the third iteration, a.s.o. until all values are stable within 4 or 5 digits. The calculation follows a procedure described earlier [21]. The exact formulae and values for masses and efficiencies needed for the analysis are given in Appendix A.
While batteries based on current Li-ion technology are heavier than a filled petrol or hydrogen tank, the electric motor is lighter than a combustion engine of the same power. Therefore, the additional battery weight is compensated by a lighter drive section for short cruising ranges. However, for long cruising ranges the BEV will be significantly heavier (see Table 1).

Table 1.
CO2 output for the production and use of cars of different driving systems during the lifetime of the car assuming 200,000 km mileage, 3 kg CO2 release per kg car mass and 150 kg CO2 release per kWh of the Li-ion battery based on the electricity production.
For fuel cell electric vehicles (FCEV), high-pressure vessels for gaseous hydrogen and hydrogen stored in solid-state materials were considered. As the resulting values are comparable, the average of both is given in Table 1.
Two types of hybrid cars were studied: (BEV-ICE) hybrid car combining a battery motor with a combustion engine and a (BEV-FCEV) car combining a battery with a fuel cell drive system. In both cases, the idea is to have a low-carbon option and a long-range backup. In this study, they are designed to run 100 km on battery but to enable 500 km using the backup mode of driving. As typical car journeys are significantly shorter than 100 km, it is assumed that 50% of the total distance is run on batteries. (This should be easily feasible, though it is currently not reached by most users). The BEV-petrol hybrid car has the drawback that it needs two motors and associated driving systems making it heavier and more expensive, while the BEV-FCEV can use the same motor and driving system.
The calculation of the CO2 release for the different sources of electricity production follows values taken from database electricity maps [22] and are present in Table 2. Data on the energy sources for power generation in Europe and some particular countries (Romania, Germany, Poland) for the year 2021 are taken mostly from the database Statista [23]. The data were compared with official statistical data for different countries: Norway [24], Europe [25], Romania [26] and Poland [27].

Table 2.
Different sources for electricity production and the corresponding CO2 release in g/kWh.
Mean values of CO2 release for the production of cars and batteries have been calculated using data taken from different sources, cited in a review article [28]. They are shown in Table 1. The CO2 release due to operation of the vehicle depends on the energy source for electricity production and varies from country to country. The calculated values are shown in Figure 2, Figure 3, Figure 4, Figure 5 and Figure 6, presented in the Section 3. Combined with the values for the production of car and battery, they give the total CO2 output. However, the following contributions have not been considered in the calculation:
- -
- The CO2 release for dismantling/recycling the car and the battery.
- -
- Additional power consumption for heating or cooling
Cooling increases fuel consumption for all cars, while heating can be done using excess heat from the ICE of the petrol car or the fuel cell of the FCEV, while it causes additional consumption for the BEV.
3. Results and Discussion
A comparison of the total CO2 emission of medium-sized cars with different drive trains was performed for different countries. The analysis includes CO2 emissions during the production of the car including its drive system, and the CO2 released over its lifetime with an assumed 200,000 km of use. A petrol car serves as the reference, for which 33 t of total CO2 emissions were calculated.
Figure 2a, Figure 3a, Figure 4a, Figure 5a and Figure 6a present the different mixtures of electricity production and, accordingly, different CO2 releases per kWh for Norway (Figure 2a), Romania (Figure 3a), Europe (Figure 4a), Germany (Figure 5a) and Poland (Figure 6a). The values for CO2 emissions for different primary energy source production were used in Table 2. The percentage mix for each source from Figure 2a, Figure 3a, Figure 4a, Figure 5a and Figure 6a was taken into consideration in calculating the total amount of CO2 emissions for the corresponding country. Figure 2b, Figure 3b, Figure 4b, Figure 5b and Figure 6b illustrate the total CO2 emissions for different drivetrains for each country, calculated by taking into consideration the CO2 equivalents for car and battery production from Table 1. Those values are kept constant for each type of powertrain, expressed in Figure 2b, Figure 3b, Figure 4b, Figure 5b and Figure 6b. For each case, the values for vehicle operation, calculated for each primary energy mix were added to car and battery production in order to show the car run contribution to the total CO2 release. Battery production significantly contributes to the total CO2 release, especially for long driving ranges and green electricity production (Table 1). As a result, the total CO2 emission and even the choice of the best (least emitting) option depend on the national grid electricity production in each country (Figure 7).
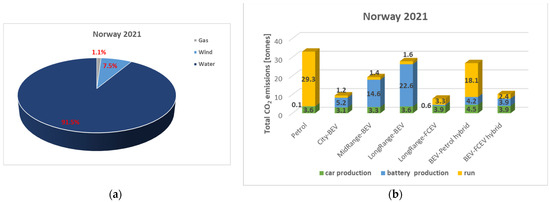
Figure 2.
(a) Energy production from primary sources for Norway for 2021. (b) total CO2 emissions for 2021 for Norway for different types of cars, including car and battery production, as well as running of the vehicle considering different sources for energy production.
Figure 2.
(a) Energy production from primary sources for Norway for 2021. (b) total CO2 emissions for 2021 for Norway for different types of cars, including car and battery production, as well as running of the vehicle considering different sources for energy production.
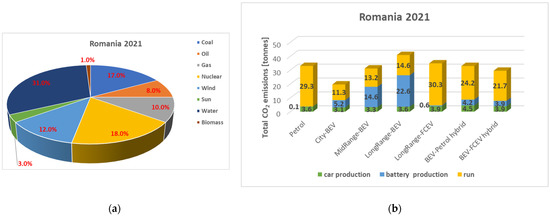
Figure 3.
(a) Energy production from primary sources for Romania for 2021. (b) total CO2 emissions for 2021 for Romania for different types of cars, including car and battery production, as well as running of the vehicle considering different sources for energy production.
Figure 3.
(a) Energy production from primary sources for Romania for 2021. (b) total CO2 emissions for 2021 for Romania for different types of cars, including car and battery production, as well as running of the vehicle considering different sources for energy production.
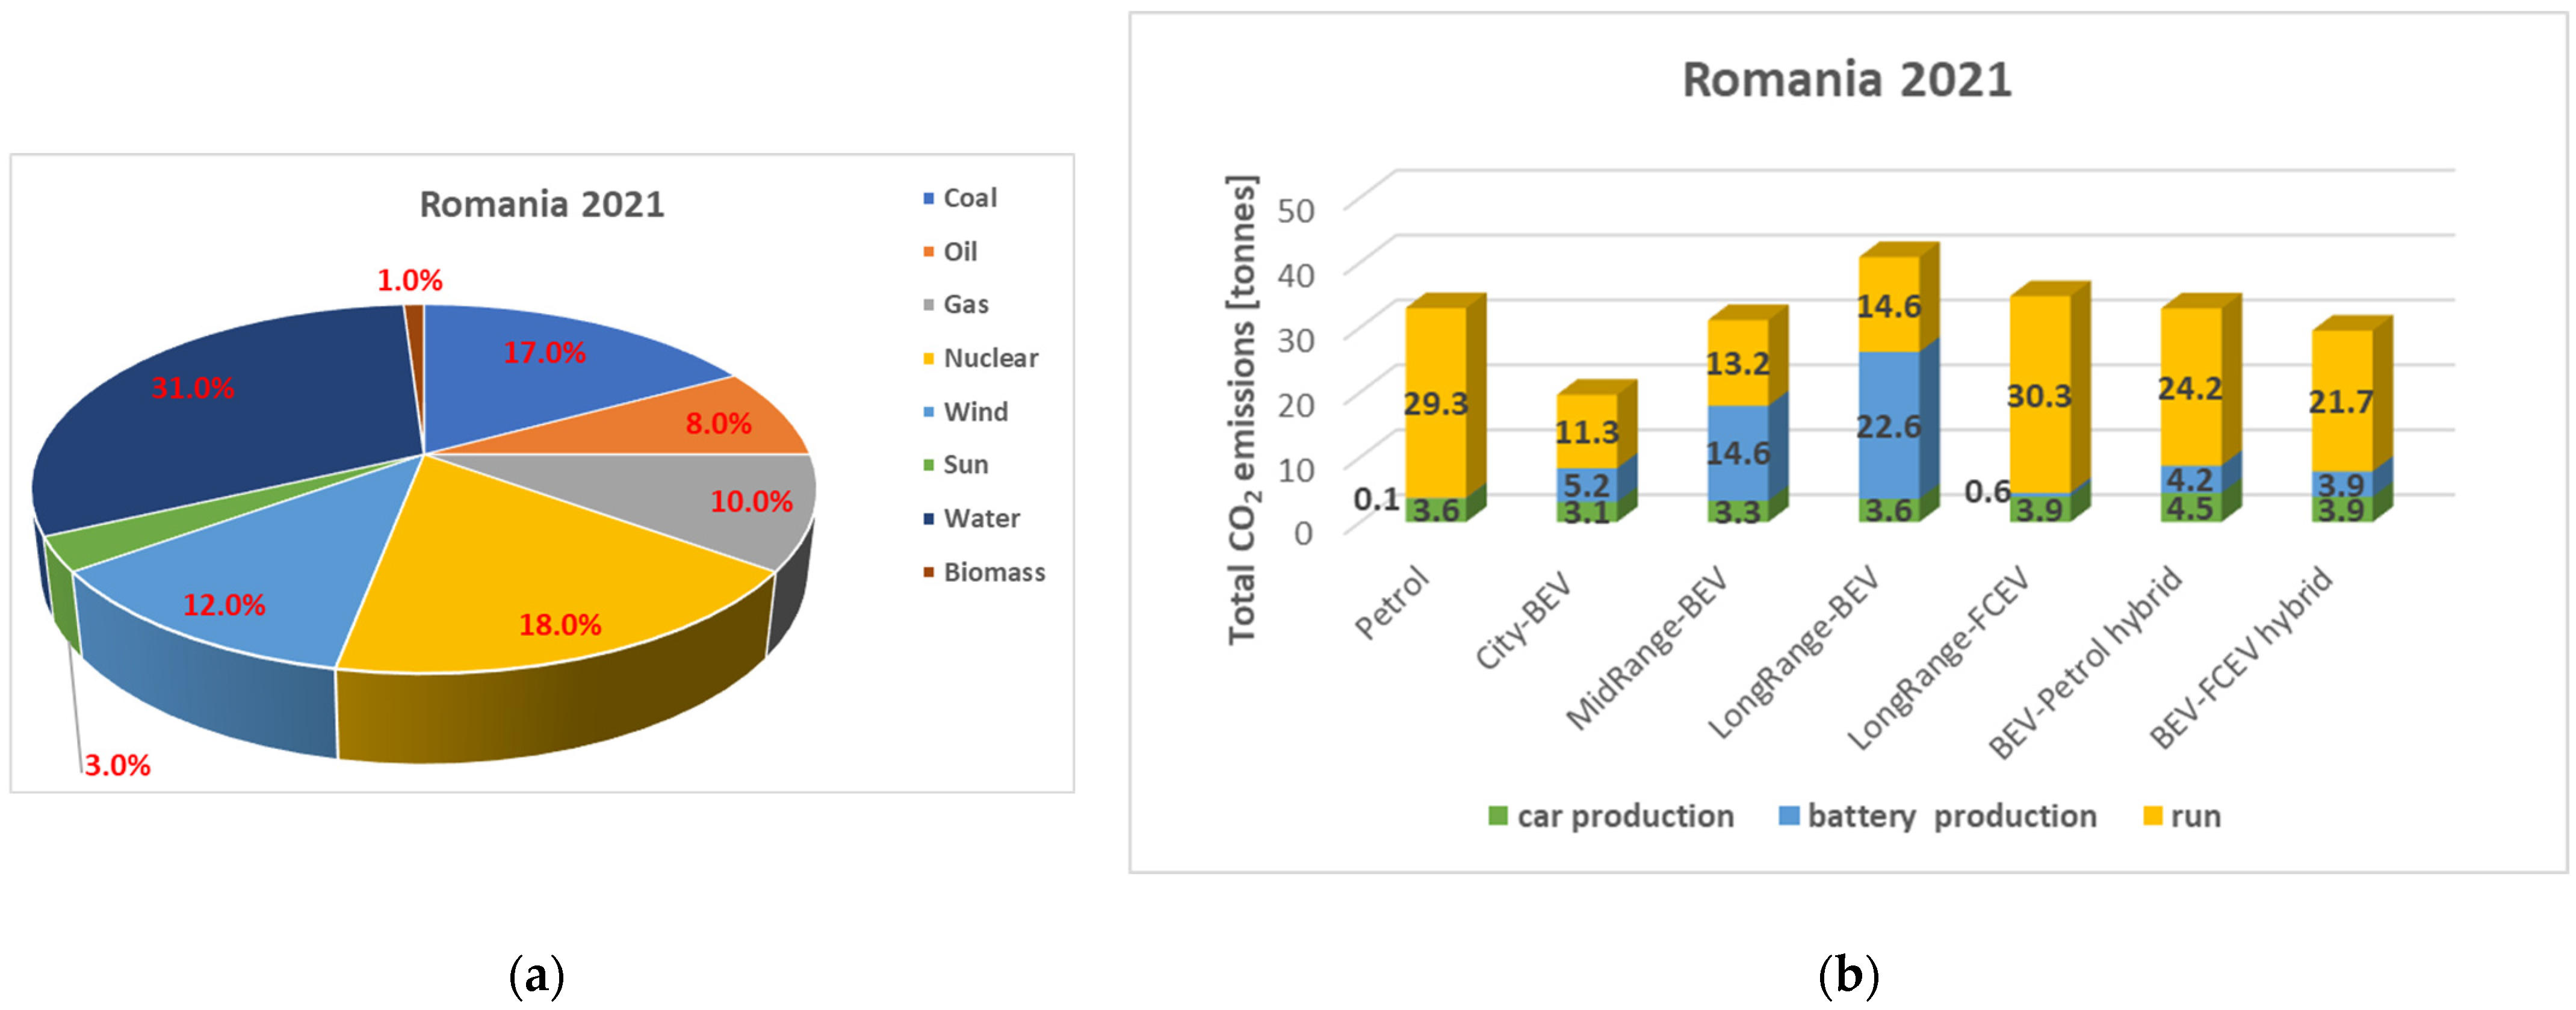
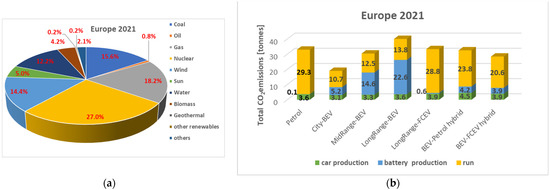
Figure 4.
(a) Energy production from primary sources for Europe for 2021. (b) total CO2 emissions for 2021 for Europe for different types of cars, including car and battery production, as well as running of the vehicle considering different sources for energy production.
Figure 4.
(a) Energy production from primary sources for Europe for 2021. (b) total CO2 emissions for 2021 for Europe for different types of cars, including car and battery production, as well as running of the vehicle considering different sources for energy production.
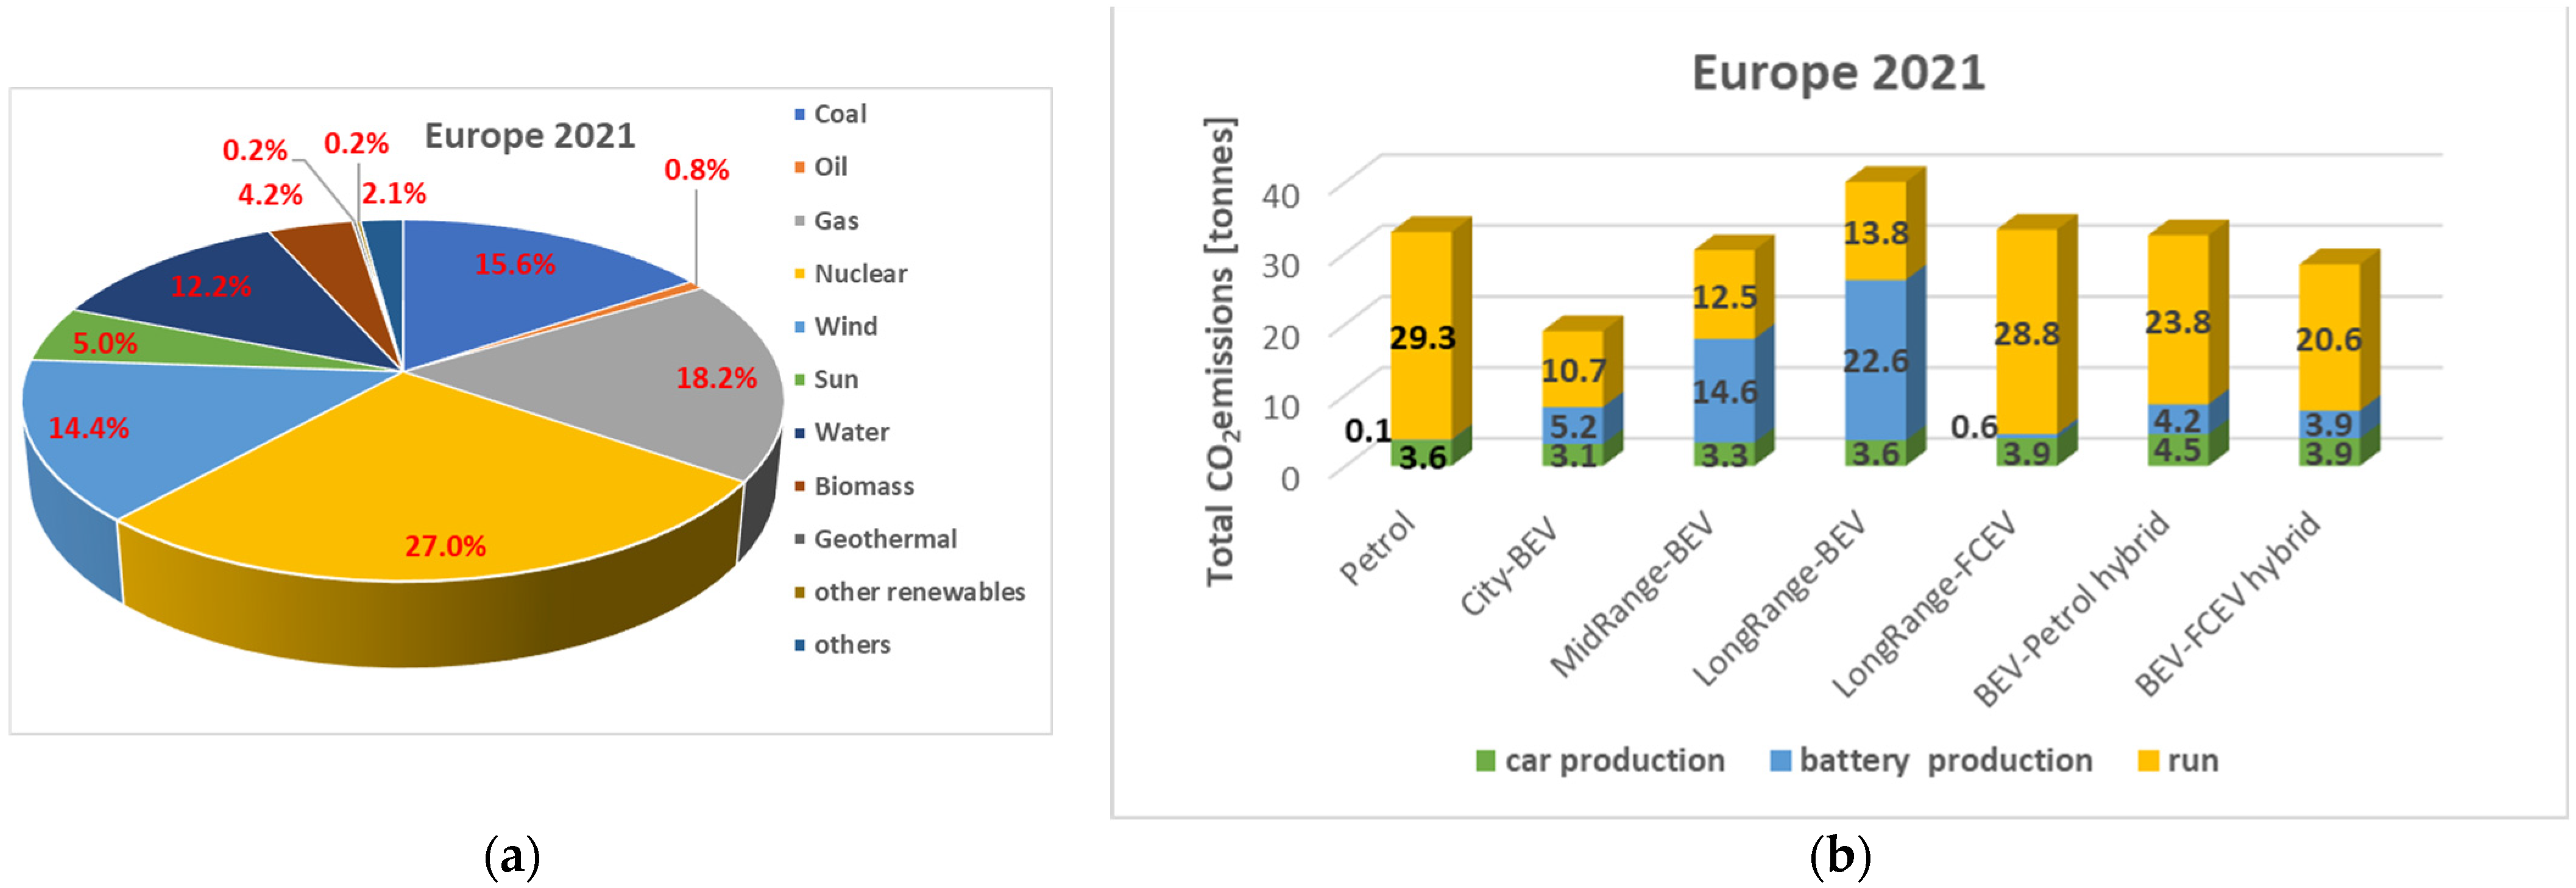
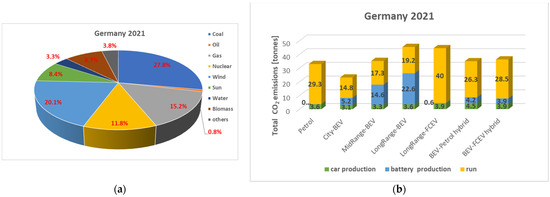
Figure 5.
(a) Energy production from primary sources for Germany for 2021. (b) total CO2 emissions for 2021 for Germany for different types of cars, including car and battery production, as well as running of the vehicle considering different sources for energy production.
Figure 5.
(a) Energy production from primary sources for Germany for 2021. (b) total CO2 emissions for 2021 for Germany for different types of cars, including car and battery production, as well as running of the vehicle considering different sources for energy production.
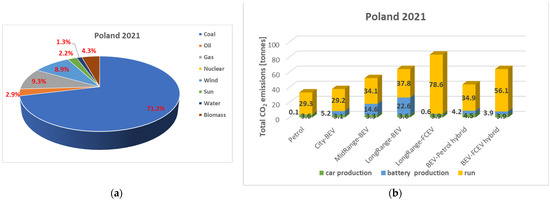
Figure 6.
(a) Energy production from primary sources for Poland for 2021. (b) total CO2 emissions for 2021 for Poland for different types of cars, including car and battery production as well as running of the vehicle considering different sources for energy production.
Figure 6.
(a) Energy production from primary sources for Poland for 2021. (b) total CO2 emissions for 2021 for Poland for different types of cars, including car and battery production as well as running of the vehicle considering different sources for energy production.
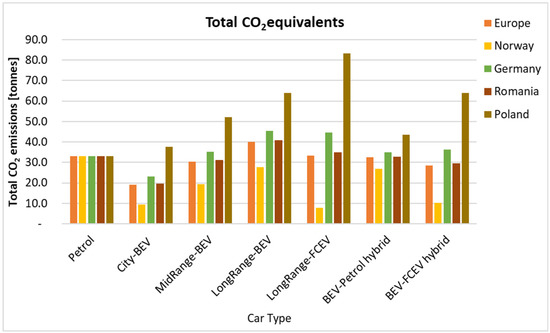
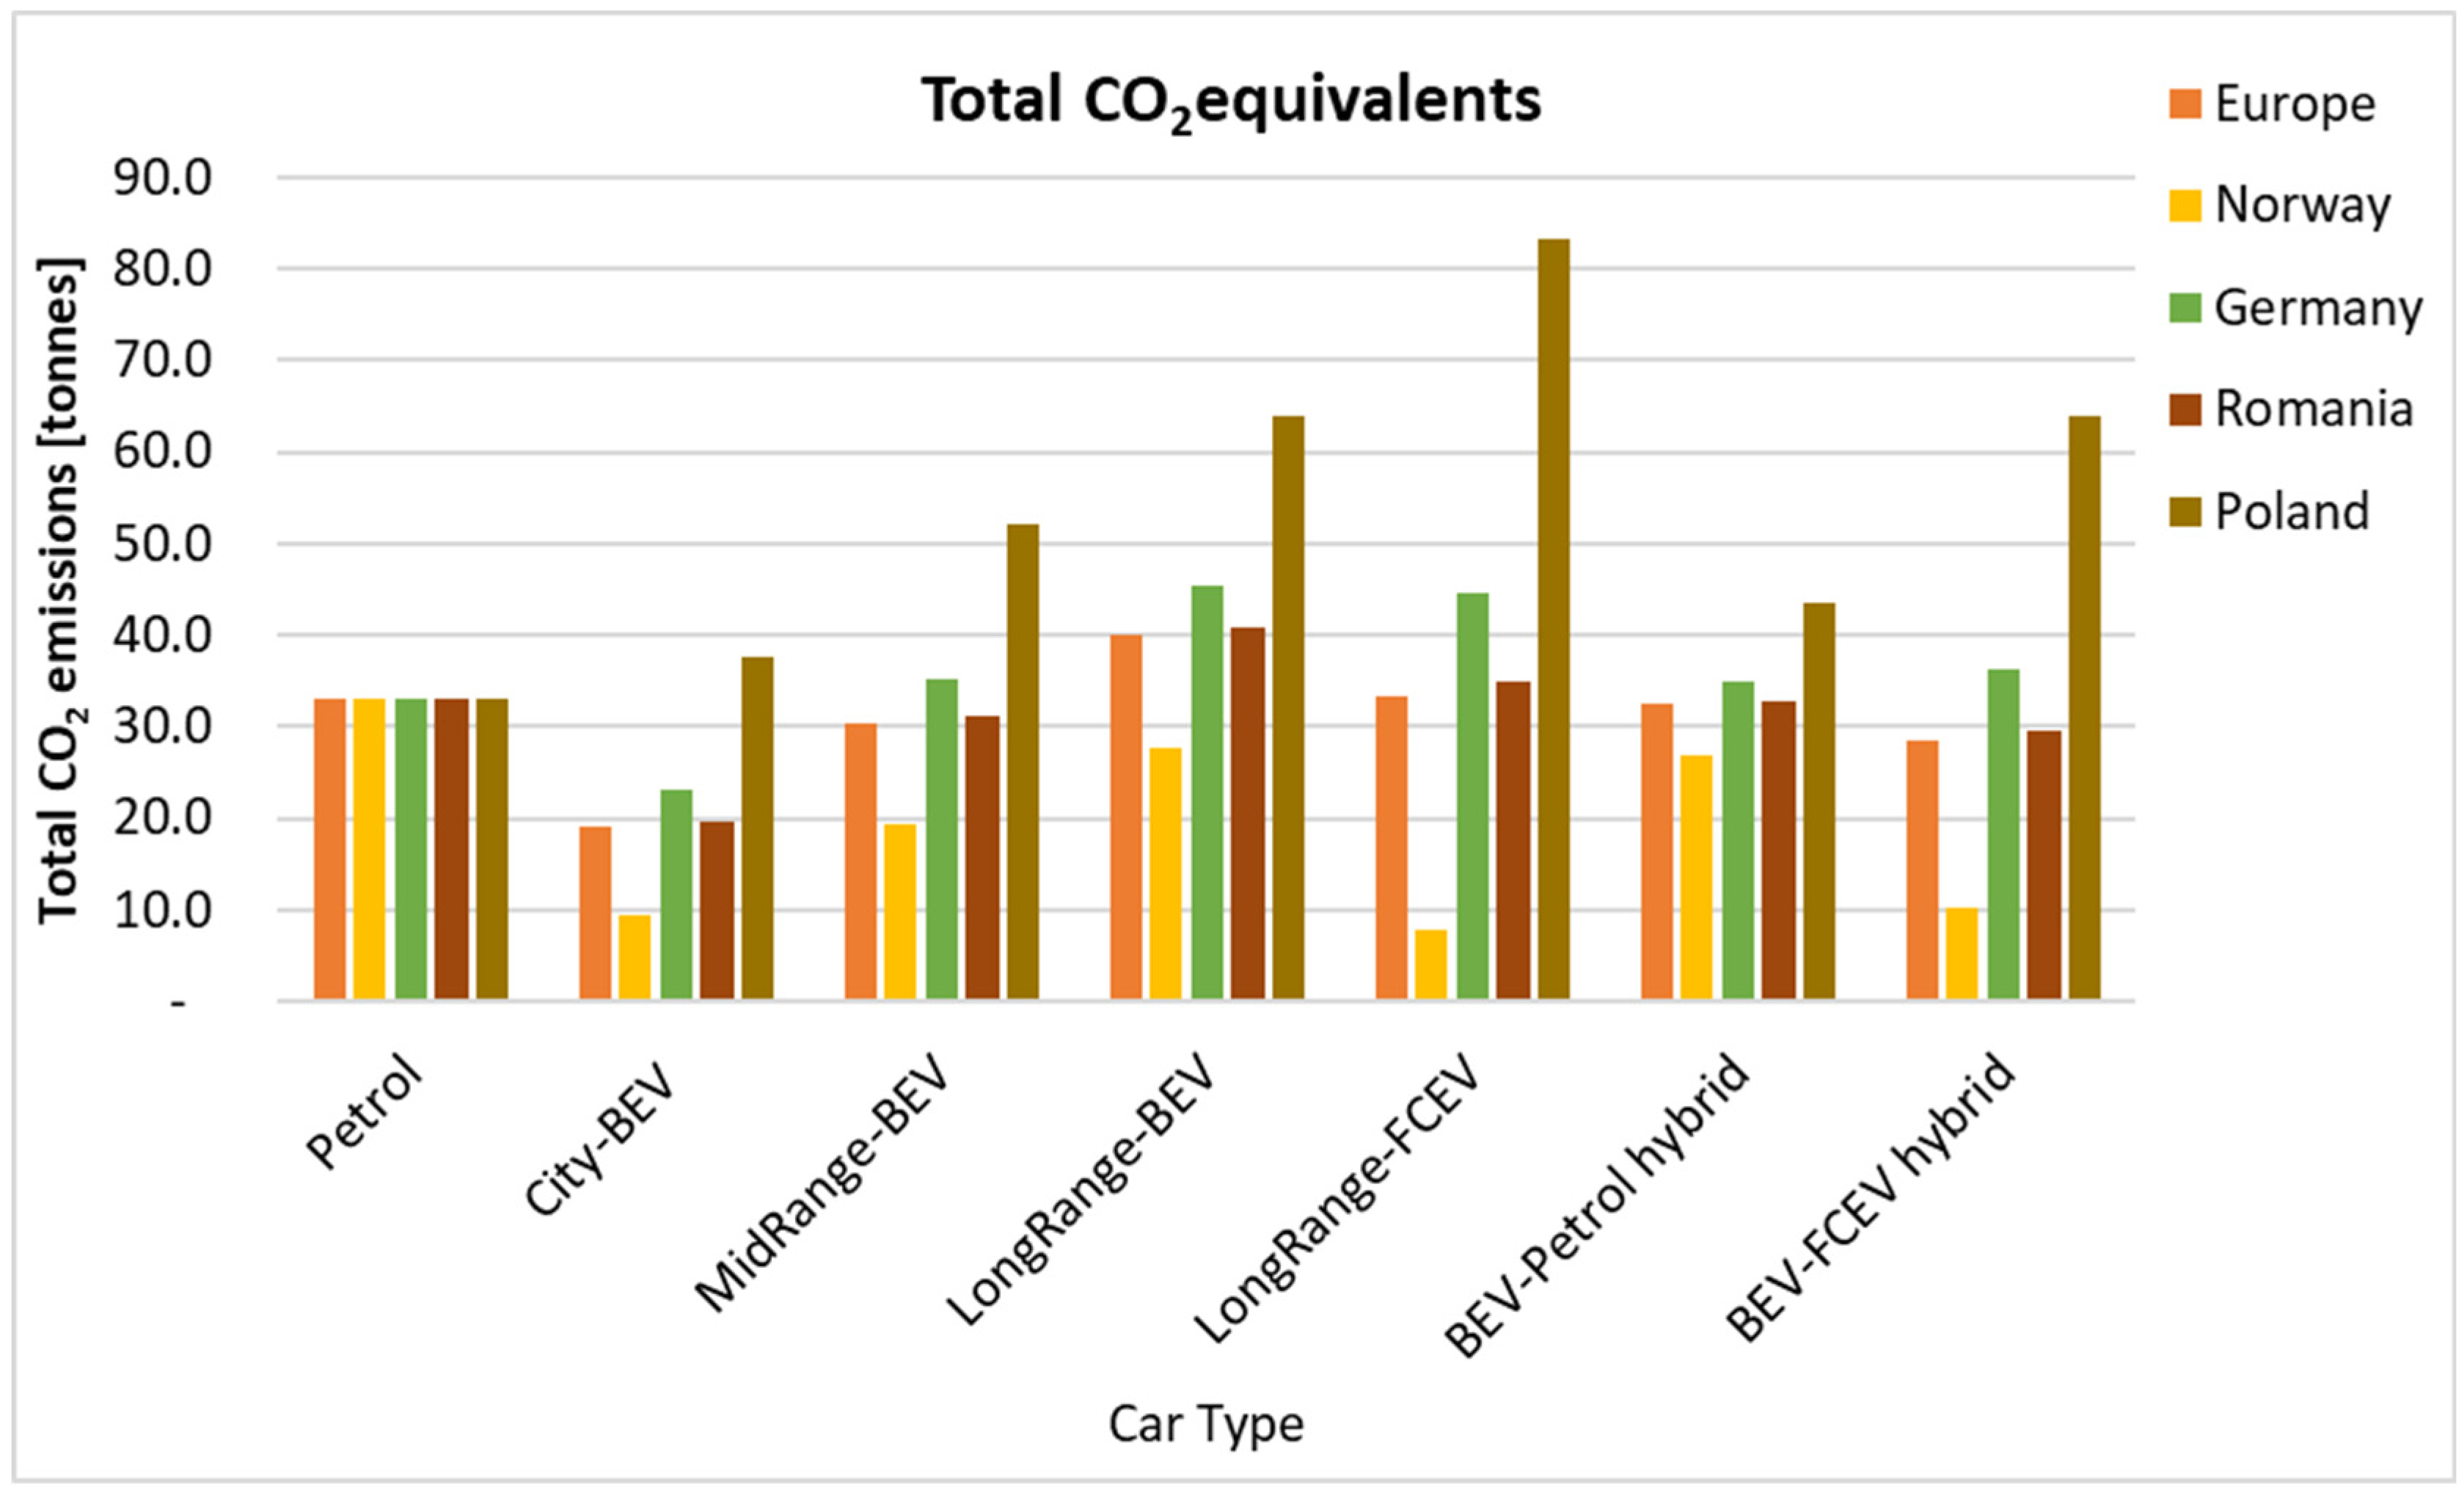
Figure 7.
Comparative CO2 equivalent emissions for Norway, Germany, Romania, Poland and Europe for 150 and 500 km cruising range for BEVs and 500 for all other vehicle types.
Figure 7.
Comparative CO2 equivalent emissions for Norway, Germany, Romania, Poland and Europe for 150 and 500 km cruising range for BEVs and 500 for all other vehicle types.
3.1. Dependency of CO2 Output on Electricity Production
3.1.1. Scenario 1: Green Electricity Production (Example: Norway)
According to Statistic Norway [24], the country has produced only 1.1% of its electricity by burning fossil fuels (gas), 7.5% from wind and the rest 91.5% from hydropower for year 2021 (Figure 2a). The calculated amount of CO2 output is 28 g/kWh. This results in only 1.2 to 1.6 tons of CO2 for running a battery electric vehicle over the chosen 200,000 km distance (Figure 2b). On the other hand, the production of the battery releases between 5 and 22.6 tons of CO2 in addition to the 3 to 4 tons for the car production (Table 1). The total CO2 emissions in tonnes are 33 t for petrol car, 9.5 t for city BEV, 19.3 for mid-range-BEV, 27.8 t for long-range-BEV, 7.8 t for long-range FCEV, 26.8 t for BEV-petrol hybrid and 10.2 t for BEV-FCEV hybrid (Figure 1b). As a result, all electric vehicles have a lower CO2 footprint than petrol car (see Figure 2b). However, while the difference is significant for a battery car with a small battery, the difference is reduced to 15% for the BEV with the longest cruising range of 500 km because of the high CO2 output for battery production. This also has the consequence that the fuel cell electric vehicle (FCEV) has a lower CO2 release than any BEV, though its efficiency for running the vehicle (in comparison to a BEV power train) is by far lower [12]. FCEVs release 1.7–2.1 t more CO2 for the 200,000 km but have no significant contribution from the battery production.
A well-to-wheel study comparison between different types of passenger cars for Norway has been reported in a previous study and came to similar conclusions [19]. They considered that about 99% of electricity production is based on renewable energy (hydropower). The results suggest that under those regional circumstances, medium-sized BEVs appear to be the best choice regarding GHG emissions and efficiency. The use is limited due to the shorter driving range with one-time charging. In this study, the authors showed that in the case of the energy production average mix taken for Europe, electric vehicles’ efficiency and harmful emissions are similar to fossil-fuel cars. The same study concludes that hydrogen must be produced from renewable energy sources or natural gas with carbon capture and storage (CCS) to achieve higher well-to-wheel energy efficiency and lower GHG emissions than hybridized diesel and gasoline vehicles. Similar results were reported for Sweden by Larsson [29]. The authors concluded that for the country delivering most of the electricity by renewable sources, BEV appears to be the better choice due to their high energy efficiency, but they have to be complemented by FCEV in order to fulfil all the needs in the light-duty transport sector.
3.1.2. Scenario 2: Intermediate CO2 Output by Electricity Generation (Example: Romania, Europe)
The average use of fossil fuels for electricity generation for Europa for 2021 is about 35% (from coal, oil and gas expressed in Figure 4a), 27% from nuclear, and the rest from renewable sources (Figure 4a). This results in about 250 g/kWh of CO2 release. Romania, with its mixture of electricity production from different sources for 2021, is very close to this value. The country produces 35% of its energy from fossil fuels (Figure 3a), the rest from renewable and nuclear sources and current data yield in 255 g/kWh (Figure 3a). Figure 3b shows the results for running different cars, added to the car and battery production for Romania. The total CO2 emissions release for different car drive systems for Romania are as follows: 33 t for petrol, 19.6 t for city-BEV, 31.1 t for mid-range-BEV, 40.8 t for long-range-BEV, 34.8 t for long-range-FCEV, 32.9 t for BEV-petrol hybrid and 29.5 t for BEV-FCEV hybrid (Figure 3b). The results calculated in this study indicate that all cars produce about the same amount of CO2 during their lifetime, except for the battery car with only a 150 km cruising range (city-BEV), which releases significantly less CO2, and the long-range BEV of 500 km cruising range, which has the highest CO2 output (in the total lifetime of the car). Hybrid cars perform slightly better than cars with only one driving system, with the lowest CO2 release of all vehicles of 500 km driving range found for the BEV-FCEV hybrid car, this can be attributed to less dependence on battery, which reduces emissions due to battery production (see Figure 3b).
3.1.3. Scenario 3: Elevated CO2 Output by Electricity Generation (Example: Germany)
Germany generates about 44% of its electricity from fossil fuels (27.8% coal, 0.8% oil and 15.2% gas, Figure 5a) yielding a CO2 release of 336 g/kWh. The total CO2 emissions for different types of powertrains are: 33 t for petrol, 23.1 t for city-BEV, 35.2 t for midrange-BEV, 45.4 t for long-range-BEV, 44.5 t for long-range-FCEV, 35 t for BEV-petrol hybrid and 36.3 t for BEV-FCEV hybrid. As for scenario 2, the city-BEV clearly has the lowest CO2 release. The long-range BEV and FCEV have the highest CO2 release, while the mid-range BEV and the hybrid solutions have about the same CO2 output as the petrol car (Figure 5b). This shows that with an elevated CO2 output for electricity generation, the hybrid solutions are better options for long-range cars-provided the battery is used 50% of the mileage (or even more). Compared to the BEV, the hybrid cars profit from the much smaller battery which causes less CO2 output in its production. Compared to the FCEV, they profit from low emission while running on battery. The calculations also show that, under these conditions, electric cars do not have a significant advantage over ICE cars, unless the cruising range of the battery car is less than 360 km (on the highway).
Comparing Romania (Scenario 3) and Germany (Scenario 3) in terms of dependence on fossil fuels in electricity production, it is observed that Romania is using 35% and Germany 44% of carbon-based fuels for electricity production. This leads to differences in the total CO2 emissions for different powertrains for both countries. The results are clearly visible for long-range vehicles, where a difference of 10 tonnes of CO2 emissions is calculated for the operation of the vehicle in its lifetime.
Similar results are obtained by Bossel [18] and Haugen [30]. In the case where the electricity grid is a mixture of different sources including both renewable and carbon-based, BEV turns out to be the best solution. On the other hand, using FCEVs appears to be unfavourable [18]. In the case the electric grid is mostly dominated by natural gas; light-duty BEV appears to be a better solution in terms of less GHG emissions. The optimisation of renewable sources in energy production appears to be mandatory in reducing harmful emissions in the transport sector [30].
3.1.4. Scenario 4: High CO2 Output by Electricity Generation (Example: Poland)
In Poland, 83% of the electricity is generated from fossil fuels (71.2% coal, 2.9% oil and 9.3% gas, Figure 6a. That corresponds to 660 g CO2/kWh. The total CO2 emissions for different powertrains are as follows: 33 t for petrol, 37.5 t for city-BEV, 52 t for mid-range BEV, 64 t for long-range BEV, 83.1 t for long-range-FCEV, 43.6 t for BEV-petrol hybrid and 63.9 t for BEV-FCEV hybrid (Figure 6b). In this situation, the petrol car has the lowest CO2 release. Even the city BEV has a higher total CO2 output because running the battery car releases about as much CO2 as a petrol vehicle (because of the CO2-rich electricity generation), and the CO2 contribution from battery production adds to the emission. The fuel cell car has the highest CO2 output since the energy conversions require high primary energy consumption, which is realised by a CO2-rich national grid electricity generation. Hybrid solutions give advantages, especially the BEV-petrol hybrid car performs quite well (Figure 6b). This confirms the result of Varga that electric cars are only environmentally beneficial if the production of electricity is based on low-carbon techniques [31]. The authors also point out that if nuclear and green energy (like wind and hydropower) do not dominate electricity generation in the future, the application of electric cars will not benefit the environment. Another study on life cycle analysis for BEV and FCEV from China’s perspective suggests that fuel cell cars, using hydrogen produced by electrolysis from the electricity grid, dominated by coal-based sources, cannot achieve energy saving and CO2 emission reduction. It can lead to more severe energy and environmental issues than petrol-driven cars. The concern about the origins of national grid-based electricity also applies to BEVs, because they are more dependent on the electricity mix [32]. The same study found that when nuclear energy occupies more than 90% of the Chinese electricity mix, BEV and FCEV using hydrogen from electrolysis can achieve less particulate matter (PM) emissions than petrol vehicles. Similar results and conclusions are also obtained for India [33].
3.1.5. Summary
A comparison between different drivetrains in terms of the total CO2 emissions in tonnes, calculated for 2021, based on different electricity mixes for each country is presented in (Figure 7). Petrol cars give the same performance in all countries, but the operation of “zero emission” vehicles gives diverse results of the calculated total CO2 emissions for different regions. For Norway, where electricity is mostly generated from green sources, it is found that the city-BEV and long-range FCEV are more favourable than using a petrol car. In the case of Germany, where electricity is generated using a decent percentage of carbon-based fuels, it is found that the utilization of short-range city-BEV rather than petrol-driven cars is more environmentally friendly. In the case of Romania, with less fossil fuel utilisation in electricity generation than Germany, short-range and long-range BEVs appear to be a better choice in terms of less pollution. For Poland, where the generation of electricity is mostly by carbon-based fuels, it is found that huge CO2 emissions are released by using “zero emissions” cars, like short-, mid- and long-range BEV and FCEV, as well as hybrids.
3.2. Influence of Mileage
Interestingly, it is found that when the mileage of the vehicle is reduced, the amount of CO2 released during a car operation is better in the case of petrol cars compared to BEVs. This decrease in CO2 release varies linearly with mileage reduction. The (relative) reduction is much smaller for the BEV as the contribution from battery manufacturing remains dominant. The CO2 release of FCEVs depends on the energy mix for electricity generation used for hydrogen production. If this causes a high CO2 release, the reduction is comparable to the petrol engine. Otherwise, it is lower.
If we assume a mileage of 100,000 km instead of 200,000 km, the CO2 release of a petrol car in Norway is comparable to that of a mid-range BEV. In Europe, it is between the mid-range BEV and the City-BEV, and in Germany, it is even close to the city-BEV. Hybrid cars become preferable, as they profit from the reduced CO2 output of the small battery.
A mileage of 300,000, favours the use of BEV even for longer driving ranges, except for the case of high CO2 output like in Poland. Interestingly, for this mileage, all solutions for a 500 km driving range have about the same total CO2 output for electricity production as in Europe (250 g CO2/kWh), except for the FCEV-BEV hybrid, which has a significantly lower output (39 tons compared to about 47 tons).
3.3. Frequency of Battery Use
While hybrid cars often perform better than either of the driving systems alone, this advantage disappears or even becomes a disadvantage if the use of BEV is significantly lower than the assumed 50%, e.g., only 25%.
4. Conclusions
Total CO2 release of a battery car depends strongly on its battery size. While the city BEV (150 km range) is usually the best, the long-range BEV (500 km range) is often the worst. So, the cruising range is of high importance. The performance of the fuel cell car (FCEV) with respect to CO2 emissions depends strongly on the energy mix used for electricity generation, which is used to produce hydrogen. Using renewable energy, the FCEV has the lowest CO2 output, and using coal—the highest. So, the choice of the best car in terms of CO2 release depends strongly on electricity generation: for generation from renewable sources, it is a fuel cell car. For generation from fossil fuels, it is the petrol car. For a mixture of both, a battery car is the best if a short cruising range is sufficient. Otherwise, a battery-fuel cell hybrid car is the car of choice.
To summarise, low-carbon electricity production is a prerequisite for electric cars to be ecological. If this is achieved, switching from petrol cars to battery or fuel cell cars brings additional reduction of CO2 release.
Author Contributions
Conceptualization, K.L. and A.V.B.; methodology, K.L.; software, K.L. and N.M.; validation, K.L., A.V.B., N.M. and M.M. and I.I.; investigation, K.L. and A.V.B.; resources, K.L., A.V.B., I.I. and N.M.; data curation, K.L.; writing—original draft preparation, K.L. and A.V.B.; writing—review and editing, N.M., M.M. and I.I.; visualization, K.L., A.V.B. and N.M.; supervision, M.M.; project administration, A.V.B.; funding acquisition, M.M. All authors have read and agreed to the published version of the manuscript.
Funding
This research received no external funding.
Data Availability Statement
The data presented in this study are available on request from the corresponding author.
Conflicts of Interest
The authors declare no conflict of interest.
Appendix A
| Efficiencies, Physical and Technical Data Used in the Calculations for This Article and Their References | |||
| Drive train petrol car | 25.6% | [12,34] | |
| Drive train electric car | 79.2% | [12] | |
| Fuel cell | 51.8% | [12] | |
| Hydrogen production from electricity | 75.0% | [12] | |
| Hydrogen storage/transport in pipeline | 99.0% | [16,35] | |
| Electricity transport (national) | 95.0% | [12] | |
| Fuel transport by truck | 98.0% | calculated | |
| Battery charging | 94.0% | [12] | |
| Battery discharging | 90.0% | [12] | |
| H2 tank filling gas 700 bar | 85.0% | [34] | |
| H2 tank filling in NaAlH4 | 85.1% | calculated | |
| Petrol distillation | 98.0% | ||
| Usable capacity for Li ion batteries | 85.0% | average from [34] and car producer | |
| Energy density of petrol | 44.0 | MJ/kg | [36] |
| Energy density of H2 | 120.0 | MJ/kg | [36] |
| Energy density of Li-ion batteries | 0.875 | MJ/kg | [12] |
| Base mass of the chassis mchassis,0 | 735 | kg | estimated |
| Chassis mass increase per engine power | 3 | kg/kW | estimated |
| Motor mass increase per engine power (combustion) | 4 | kg/kW | estimated |
| Motor mass increase per engine power (electro) | 2 | kg/kW | estimated |
| Ratio tank mass/fuel mass for large compressed H2 gas | 18,300 | [37,38] | |
| Ratio tank mass/fuel mass for NaAlH4 H2 tank | 10,000 | estimated | |
| Recyclable H2 density in NaAlH4 | 0.050 | ||
| Fuel cell power per mass | 0.694 | kW/kg | [39] |
| Mass of a petrol tank | 7000 | kg | assumed |
| Values, Written in Text or Table | |||
| Power | 60 | kW | assumed |
| Total mass mtot,0 | 1200 | kg | assumed |
| Weight per power | 20 | kg/kW | assumed |
| Consumption C0 | 6 | L/100 km | assumed |
| Exponent in mass-consumption relation | 0.600 | [12] | |
| Mass of battery for fuel cell car | 16,000 | kg | estimated |
| Mass of the battery for a combustion engine | 15,000 | kg | assumed |
References
- IPCC. Climate Change 2013: The Physical Science Basis, Working Group 1 Contribution to the 5th Assessment Report of the IPCC; Cambridge University Press: Cambridge, UK, 2014; p. 166. [Google Scholar]
- Stips, A.; Macias, D.; Coughlan, C.; Garcia-Gorriz, E.; Liang, X.S. On the causal structure between CO2 and global temperature. Sci. Rep. 2016, 6, 21691. [Google Scholar] [CrossRef] [PubMed]
- Tverberg, G. BP Data Suggests We Are Reaching Peak Energy Demand. Available online: https://ourfiniteworld.com/2015/06/23/bp-data-suggests-we-are-reaching-peak-energy-demand/ (accessed on 2 June 2022).
- United Nations Framework Convention on Climate Change. 2016. Available online: http://unfccc.int/paris_agreement/items/9485.php (accessed on 4 June 2022).
- Intergovernmental Panel on Climate Change. Global Warming of 1.5 °C. 2018. Available online: http://www.ipcc.ch/sr15/ (accessed on 4 June 2022).
- International Energy Agency. CO2 Emissions Statistics. 2018. Available online: http://iea.org/statistics/co2emissions/ (accessed on 4 June 2022).
- International Energy Agency. Sustainable Development Scenario. Available online: https://www.iea.org/reports/world-energy-model/sustainable-development-scenario (accessed on 5 June 2022).
- International Energy Agency. Transport Biofuels. Available online: https://www.iea.org/reports/tracking-transport-2019/transport-biofuels (accessed on 5 June 2022).
- Omar, N.; Daowd, M.; van den Bossche, P.; Hegazy, O.; Smekens, J.; Coosemans, T.; van Mierlo, J. Rechargeable Energy Storage Systems for Plug-in Hybrid Electric Vehicles—Assessment of Electrical Characteristics. Energies 2012, 5, 2952–2988. [Google Scholar] [CrossRef]
- Deng, D. Li-ion batteries: Basics, progress, and challenges. Energy Sci. Eng. 2015, 3, 385–418. [Google Scholar] [CrossRef]
- Cairns, E.J.; Albertus, P. Batteries for Electric and Hybrid-Electric Vehicles. Annu. Rev. Chem. Biomol. Eng. 2010, 1, 299–320. [Google Scholar] [CrossRef] [PubMed]
- Thomas, C.E. Fuel cell and battery electric vehicles compared. Int. J. Hydrogen Energy 2009, 34, 6005–6020. [Google Scholar] [CrossRef]
- Chiluwal, S.; Rao, A.M.; Podila, R. Strategies for improving rechargeable lithium-ion batteries: From active materials to CO2 emissions. Nanotechnol. Rev. 2021, 10, 1993–2026. [Google Scholar] [CrossRef]
- Nealer, R.; Reichmuth, D.; Anair, D. Cleaner Cars from Cradle to Grave; Union of Concerned Scientists: Cambridge, MA, USA, 2015; pp. 1–54. [Google Scholar]
- Larminie, J.D.A. Fuel Cell Systems Explained; John Wiley & Sons Ltd.: Hoboken, NJ, USA, 2003. [Google Scholar]
- Ognissanto, F.; Landen, T.; Stevens, A.; Emre, M.; Naberezhnykh, D. Evaluation of the CO2 emissions pathway from hydrogen production to fuel cell car utilisation. IET Intell. Transp. Syst. 2017, 11, 360–367. [Google Scholar] [CrossRef]
- Choi, W.; Yoo, E.; Seol, E.; Kim, M.; Song, H.H. Greenhouse gas emissions of conventional and alternative vehicles: Predictions based on energy policy analysis in South Korea. Appl. Energy 2020, 265, 114754. [Google Scholar] [CrossRef]
- Bossel, U. Does a Hydrogen Economy Make Sense? Proc. IEEE 2006, 94, 1826–1837. [Google Scholar] [CrossRef]
- Mari Svensson, A.; Møller-Holst, S.; Glöckner, R.; Maurstad, O. Well-to-wheel study of passenger vehicles in the Norwegian energy system. Energy 2007, 32, 437–445. [Google Scholar] [CrossRef]
- Campanari, S.; Manzolini, G.; Garcia de la Iglesia, F. Energy analysis of electric vehicles using batteries or fuel cells through well-to-wheel driving cycle simulations. J. Power Sources 2009, 186, 464–477. [Google Scholar] [CrossRef]
- Lieutenant, K.; Borissova, A. A landscape of hydride compounds for off-board refilling of transport vehicles. Int. J. Hydrogen Energy 2020, 45, 2954–2966. [Google Scholar] [CrossRef]
- Electricity Maps. Available online: https://electricitymaps.com/ (accessed on 7 February 2022).
- Statista. Available online: www.statista.com (accessed on 8 March 2022).
- Statistisk Sentralbyrå. Available online: www.ssb.no (accessed on 18 March 2022).
- Eurostat Data. Available online: https://ec.europa.eu/eurostat/data/database (accessed on 5 April 2022).
- ANRE Raport Anual (Annual Report). Available online: https://www.anre.ro/ro/despre-anre/rapoarte-anuale (accessed on 5 April 2022).
- Statistics Poland. Available online: https://stat.gov.pl/ (accessed on 22 March 2022).
- Schrader, C. Die Ökobilanz der E-Mobilität. Spek. Wiss. 2018, 5, 12–19. [Google Scholar]
- Larsson, M.; Mohseni, F.; Wallmark, C.; Grönkvist, S.; Alvfors, P. Energy system analysis of the implications of hydrogen fuel cell vehicles in the Swedish road transport system. Int. J. Hydrogen Energy 2015, 40, 11722–11729. [Google Scholar] [CrossRef]
- Haugen, M.J.; Paoli, L.; Cullen, J.; Cebon, D.; Boies, A.M. A fork in the road: Which energy pathway offers the greatest energy efficiency and CO2 reduction potential for low-carbon vehicles? Appl. Energy 2021, 283, 116295. [Google Scholar] [CrossRef]
- Varga, B.O. Electric vehicles, primary energy sources and CO2 emissions: Romanian case study. Energy 2013, 49, 61–70. [Google Scholar] [CrossRef]
- Wang, D.; Zamel, N.; Jiao, K.; Zhou, Y.; Yu, S.; Du, Q.; Yin, Y. Life cycle analysis of internal combustion engine, electric and fuel cell vehicles for China. Energy 2013, 59, 402–412. [Google Scholar] [CrossRef]
- Patil, V.; Shastry, V.; Himabindu, M.; Ravikrishna, R.V. Life-cycle analysis of energy and greenhouse gas emissions of automotive fuels in India: Part 2—Well-to-wheels analysis. Energy 2016, 96, 699–712. [Google Scholar] [CrossRef]
- von Helmolt, R.; Eberle, U. Fuel cell vehicles: Status 2007. J. Power Sources 2007, 165, 833–843. [Google Scholar] [CrossRef]
- Using the Existing Natural Gas System for Hydrogen. Available online: https://web.archive.org/web/20120118102741/http://www.naturalhy.net/docs/Naturalhy_Brochure.pdf (accessed on 12 August 2022).
- Weidenthaler, C.; Felderhoff, M. Solid-state hydrogen storage for mobile applications: Quo Vadis? Energy Environ. Sci. 2011, 4, 2495–2502. [Google Scholar] [CrossRef]
- Ahluwalia, R.K.; Hua, T.Q.; Peng, J.K. On-board and Off-board performance of hydrogen storage options for light-duty vehicles. Int. J. Hydrogen Energy 2012, 37, 2891–2910. [Google Scholar] [CrossRef]
- James, B.D.; Houchins, C.; Huya-Kouadio, J.M.; Desantis, D.A. Final Report: Hydrogen Storage System Cost Analysis; Strategic Analysis Inc.: Arlington, VA, USA, 2016. [Google Scholar]
- Sinha, J.; Lasher, S.; Yang, Y.; Kopf, P. Direct Hydrogen PEMFC Manufacturing Cost Estimation for Automotive Applications; Slide 22, Fuel Cell Team Review; TIAX LLC.: Cambridge, MA, USA, 2008. [Google Scholar]
Publisher’s Note: MDPI stays neutral with regard to jurisdictional claims in published maps and institutional affiliations. |
© 2022 by the authors. Licensee MDPI, Basel, Switzerland. This article is an open access article distributed under the terms and conditions of the Creative Commons Attribution (CC BY) license (https://creativecommons.org/licenses/by/4.0/).

