Article

Geothermal Heat Pump Production Sustainability—The Basis of the Swiss GHP Success Story

by
Ladislaus Rybach
1,2
1
Institute of Geophysics, ETH Zurich, Sonneggstrasse 5, CH-8092 Zurich, Switzerland
2
Geowatt AG Zurich, Regina-Kägi-Strasse 50, CH-8050 Zurich, Switzerland
Energies 2022, 15(21), 7870; https://doi.org/10.3390/en15217870
Submission received: 6 August 2022 / Revised: 18 October 2022 / Accepted: 19 October 2022 / Published: 24 October 2022
(This article belongs to the Special Issue The Advancement of Geothermal Energy Utilisation by New Developments)

Abstract

:
Geothermal heat pump systems (GHP) are the spearhead of geothermal achievement and development, and one of the fastest growing applications of renewable energy technologies worldwide. When Swiss GHP activities started in the late 1970s, market introduction and penetration needed science-based proof of reliable, stable, long-term GHP operation. A special, extended project, realized in a field-laboratory setting, provided this proof. Detailed measurements, as well as numerical model simulations, proved the sustainable operation of the installed GHP system. The measurement setup, the recording of the various time series, and their interpretation are presented. Furthermore, basic perceptions were elaborated concerning geothermal resources behavior in production and regeneration. The Swiss GHP was developed from nothing. Early GHP installation costs halved within 20 years; GHP growth was nearly exponential from 1980 to 2020 (8.5% annually). Drilled borehole heat exchanger (BHE) meters are today around 300,000 m per year; heat delivery of GHPs in Switzerland amounted to 3280 GWh 2020—over 85% of Swiss geothermal direct uses (among others like thermal spas, district heating). Large installations with hundreds of BHEs are now common, and are also used for heating and cooling. The international ranking of Swiss GHP realizations is excellent in terms of annual energy use (TJ/yr/area), and is number one worldwide. Switzerland is a global GHP leader, and the Swiss success story is well documented.

1. Introduction

The great importance of GHP technology, which uses ubiquitous shallow geothermal resources, must be emphasized.
Today, GHP systems are the spearhead of geothermal energy and are successfully operating worldwide. These systems utilize the heat content of the so-called “Shallow Resources”. They are properly described in [1], as: “The top 400 m of the subsurface (=The shallow resources) is warmer in winter and colder in summer than outside air; thus, it provides heating in winter and cooling in summer, with GHP systems. These decentral, ground-coupled systems provide space heating, cooling, and domestic warm water production with the same installation. GHPs are nowadays applied in buildings of all kinds, types, sizes, and numbers in many countries, for homes, schools, factories, public, and commercial buildings. Actually, this technology is one of the fastest growing applications of renewable energy technologies worldwide and definitely the fastest growing segment in geothermal technology”.
The global development and growth of GHPs are documented in Figure 1. It is evident that growth is exponential. For the globally installed GHP capacity (in GWth), the growth rate from 1995 to 2010 was 19.4%, and from 2010 to 2020 it was 8.5%; for the heat delivered by GHPs (in PJ/yr), the growth rate from 1995 to 2010 was 17.4%, and from 2010 to 2020 it was 11.0%.
Furthermore, the GHP systems are the primary contributors to global geothermal direct use, as shown in Figure 2. All other direct use varieties (bathing and swimming, space (district) heating, greenhouse heating, industrial uses, aquaculture pond heating, etc.) contribute less taken together than GHPs. This majority developed from 13.0% of all geothermal direct-uses in 1995 to 59% in 2020 [2].
Since the term sustainability is used throughout this study, a brief summary of sustainability is given below:
Sustainability is a goal of many domains. Its original definition dates back to the Brundtland Commission (1987; reinforced at the Rio 1991, Kyoto 1997, and Johannesburg 2002 United Nations Summits):
“Meeting the needs of the present generation without compromising the needs of future generations”.
Generally, sustainability extends to three dimensions: the environmental, economic, and social dimensions.
The three dimensions are certainly important, but when it comes to using resources soon the question arises regarding how long they can last. In relation to geothermal resources, and especially to their use for geothermal energy utilization, sustainability means the ability of the applied production system to sustain the production level over long periods. Unlike mineral resources, where the mined-out ores are not renewable, geothermal resources regrow like biomass. Details are shown further below.
The oil crisis in the 1970s initiated a growing interest in alternative energies in Switzerland. Among these, geothermal energy came into consideration. In the beginning, GHPs were generally unknown, and only very few companies provided such service (KWT Kälte & Wärme AG Berne (Oberhofen, Switzerland), ENFOG AG (Gossau, Switzerland)). Other than issues of cost, prospective customers mainly asked about the long-term production capability of this new technology. Reliable, stable operation was a key requirement, and science-based knowledge was demanded. Switzerland started by elaborating the key cognitions in GHP production sustainability. The demonstration of research-based reliability and stability of heat delivery over long periods of time was needed for strong market penetration of GHPs in Switzerland.
In this study, it was intended to describe the introduction and growth of the GHP technology in Switzerland. The first part describes the efforts needed for elaborating the science-based proofs of reliable GHP operation, and also in the long term. This was accomplished by field measurements and numerical modeling. The demonstration of research-based reliability and stability of heat delivery over long time-periods was needed for strong market penetration of GHPs in Switzerland. As a byproduct of this, basic perceptions have been established concerning the natural recovery of shallow geothermal resources. In Section 2 and Section 3, a review of these special and successful research efforts and their results are presented.
The second part of the study presents an overview of the dissemination and growth of GHPs in Switzerland, starting from zero; the Swiss GP success story is documented. Past achievements, the present situation, as well as perspectives, are specified. This also includes achieved international status and rankings. Unique data acquisition, basis studies, and findings form a “field laboratory”.

2. The Field Laboratory

2.1. The Experimental Setup

In 1986, an opportunity arose to plan and establish a special, well-instrumented research facility in the neighborhood of Zurich, situated outdoors to investigate the dynamic operational behavior of a BHE-based GHP system and its effects on the surroundings. Therefore, it became possible to install, at a given site, all the necessary equipment to collect data regarding GHP system performance and its effects on the surroundings.
The research was designed over several years and was generously financed mainly by the Swiss Energy Research Fund NEFF and the PSEL (Fund for Projects and Studies of the Swiss Electric Utility Companies). The Swiss Federal Office of Energy (SFOE) remains an avid supporter of geothermal development, both domestically and internationally (especially within the IEA).
The project commenced with a careful site selection. For this, various locations were selected and evaluated following geologic and hydrogeologic criteria. From the proposed four sites (Elgg, Neftenbach, Uitikon, and Wettswil), Elgg was selected. The main selection criteria were local geology at the four sites. All sites were situated in the Tertiary Swiss Molasse Basin’s Upper Sweetwater Molasse formations, with uniform and favorable thermal conductivities. In most places in the basin, unconsolidated, Quaternary gravels (with highly varying thermal conductivities) are located on top of the Molasse sediments. This non-uniform layer was the thinnest (just 1 m) at Elgg. Another reason to select Elgg was the highly cooperative Rubitschon family.
The Rubitschon family were refurbishing and expanding a former farm house, and included a new GHP system for space heating. The first heating season was planned to start in autumn, 1986. Over the following years, the family was highly cooperative.
First, the BHE borehole was drilled (to a depth of 105 m), and then two observation boreholes, at 0.5 m and 1.0 m distances. Special care was taken to maintain the verticality of the boreholes by detailed inclination measurements. After installing the double-U-tube PE pipes in the BHE for circulation during GHP operation, the two observation boreholes were instrumented by Pt100 temperature sensors, at different depths (1, 2, 5, 10, 20, 35, 50, 65, 85, and 105 m), and backfilled with a bentonite/cement mixture, like the BHE itself. Furthermore, many other temperature and operational parameter sensors were installed. Figure 3 shows the complete setup of the measuring devices. Special attention was given to pre-age, and to individually calibrate the Pt100 temperature sensors for the boreholes. The connections of all sensors to the data acquisition system were all well-shielded. Data measurement and recording of the various time series were conducted every 30 min.
The data acquisition system included a scanner, a digital multimeter, and a PC; the acquisition was steered by special software. The software and many other particulars of the above-mentioned system components, along with their functioning and interfacing, are described extensively in the PhD Thesis of Walter E. Eugster [4].

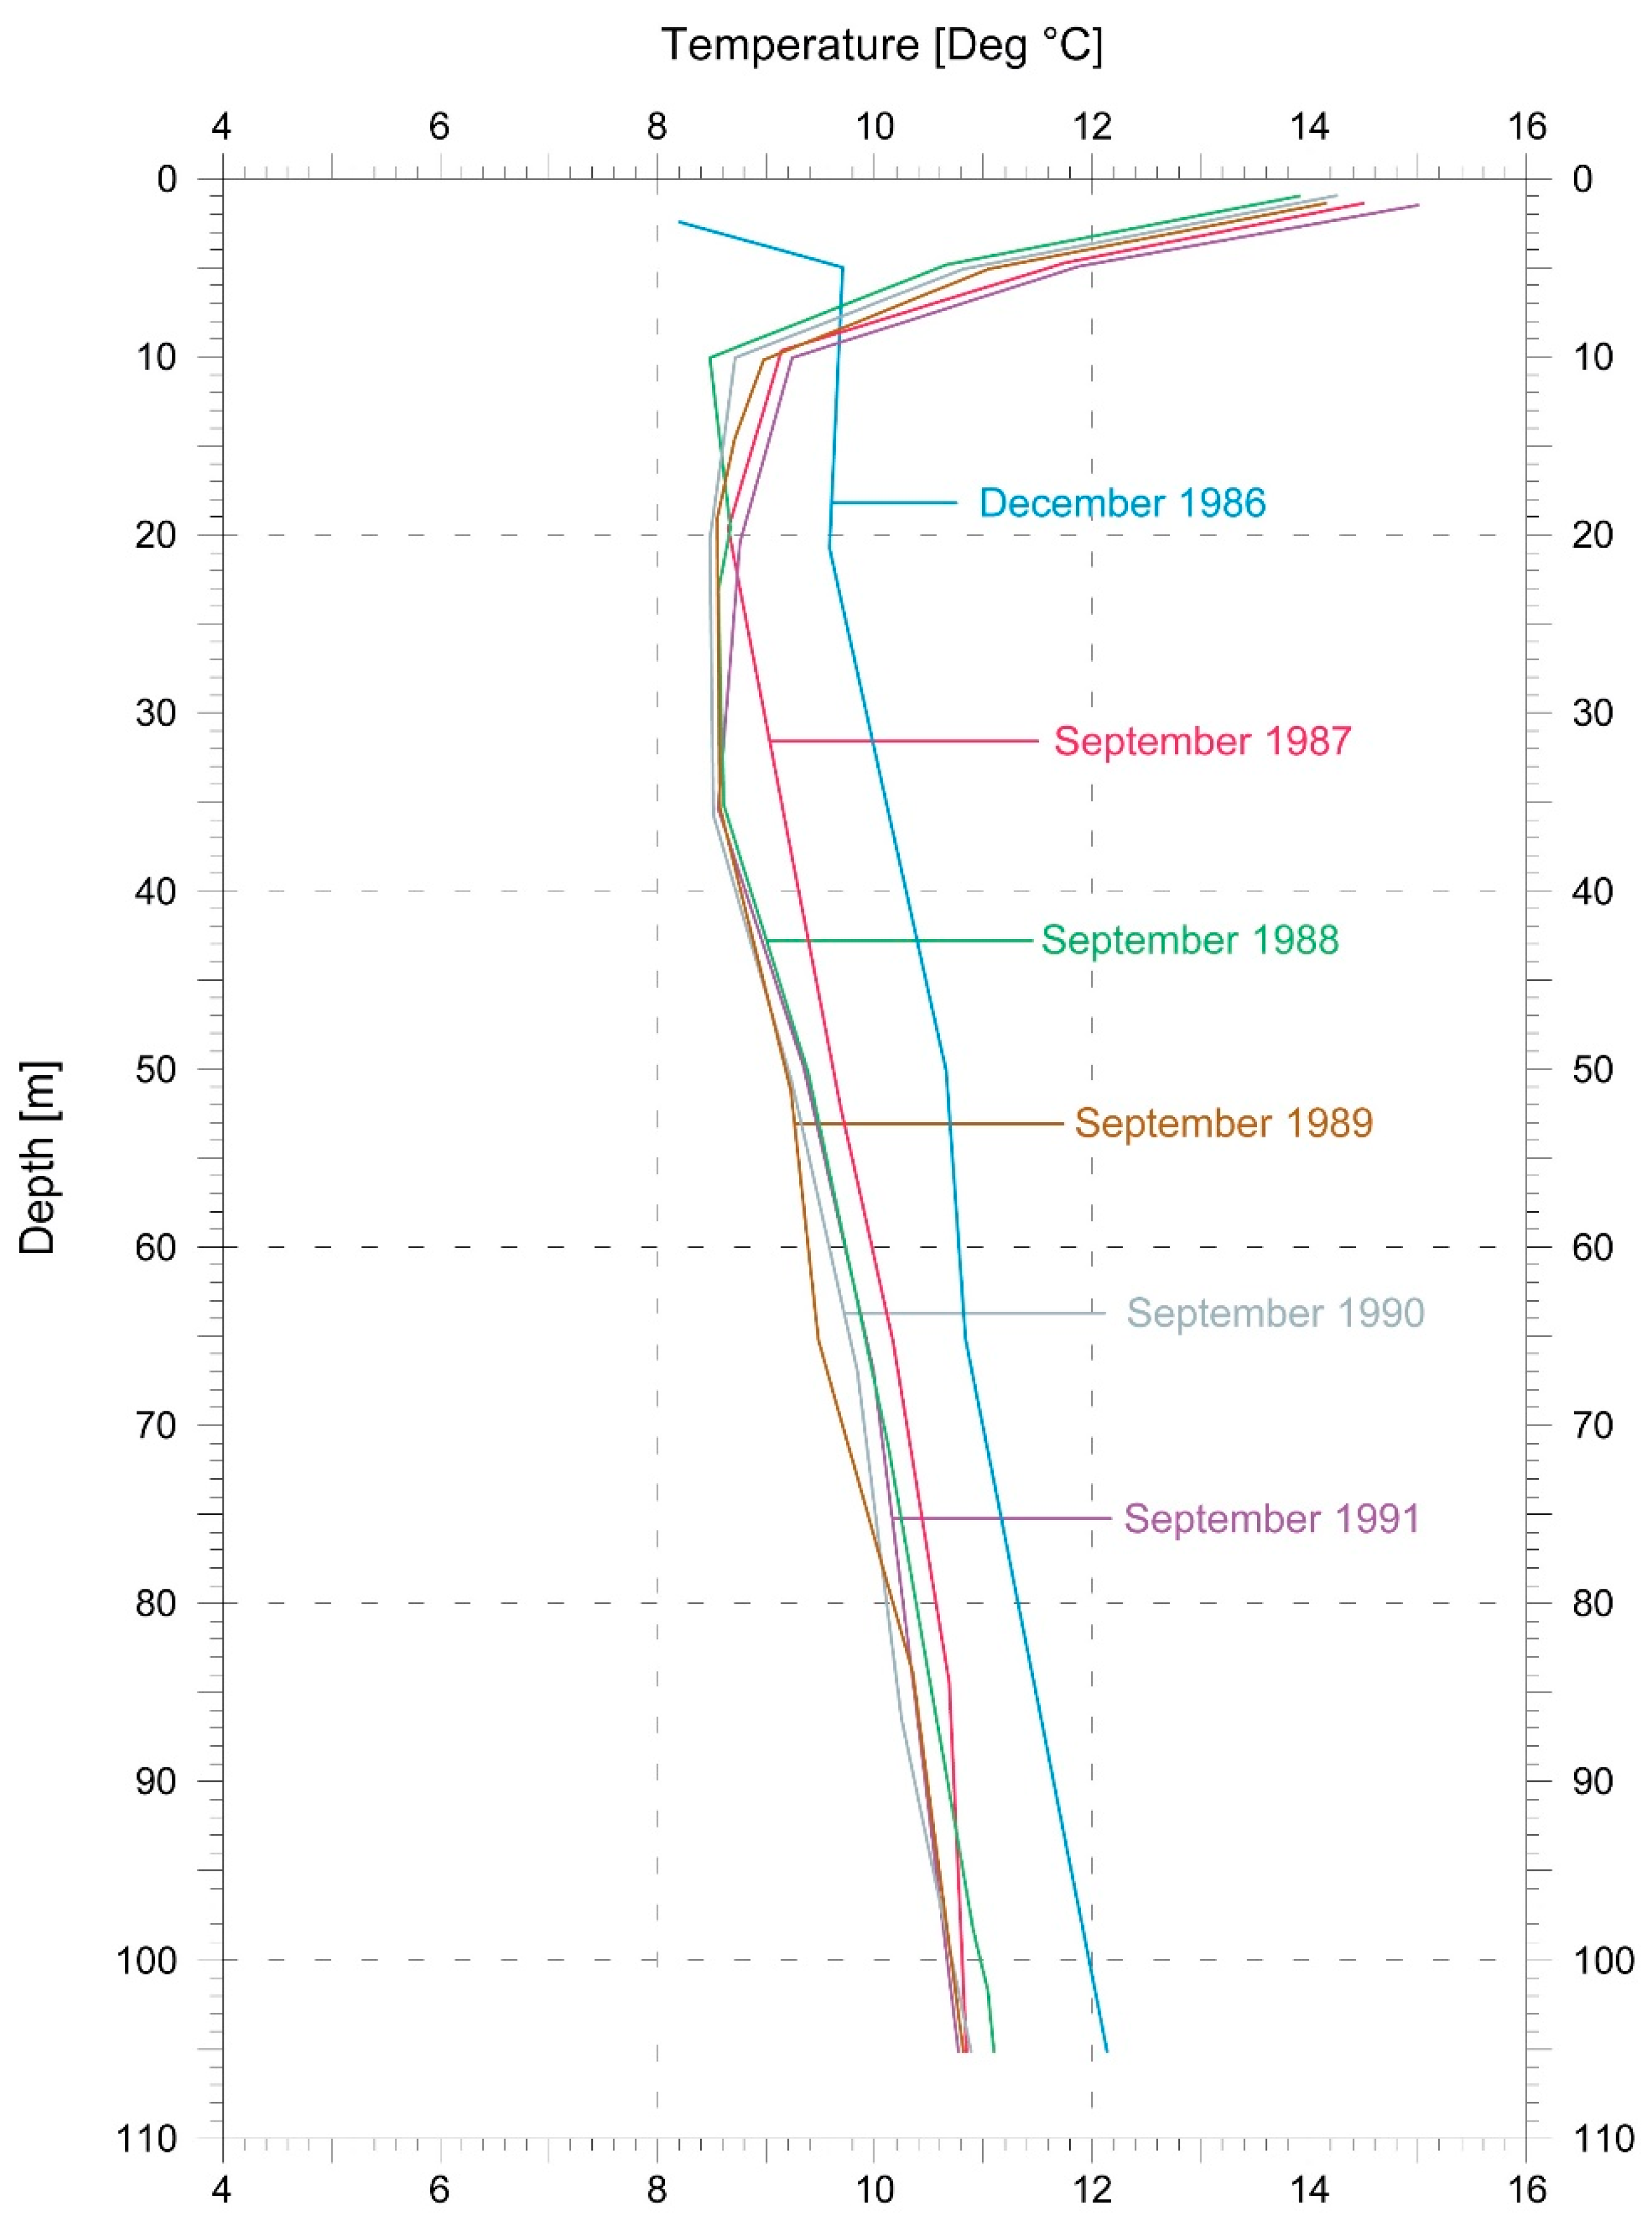
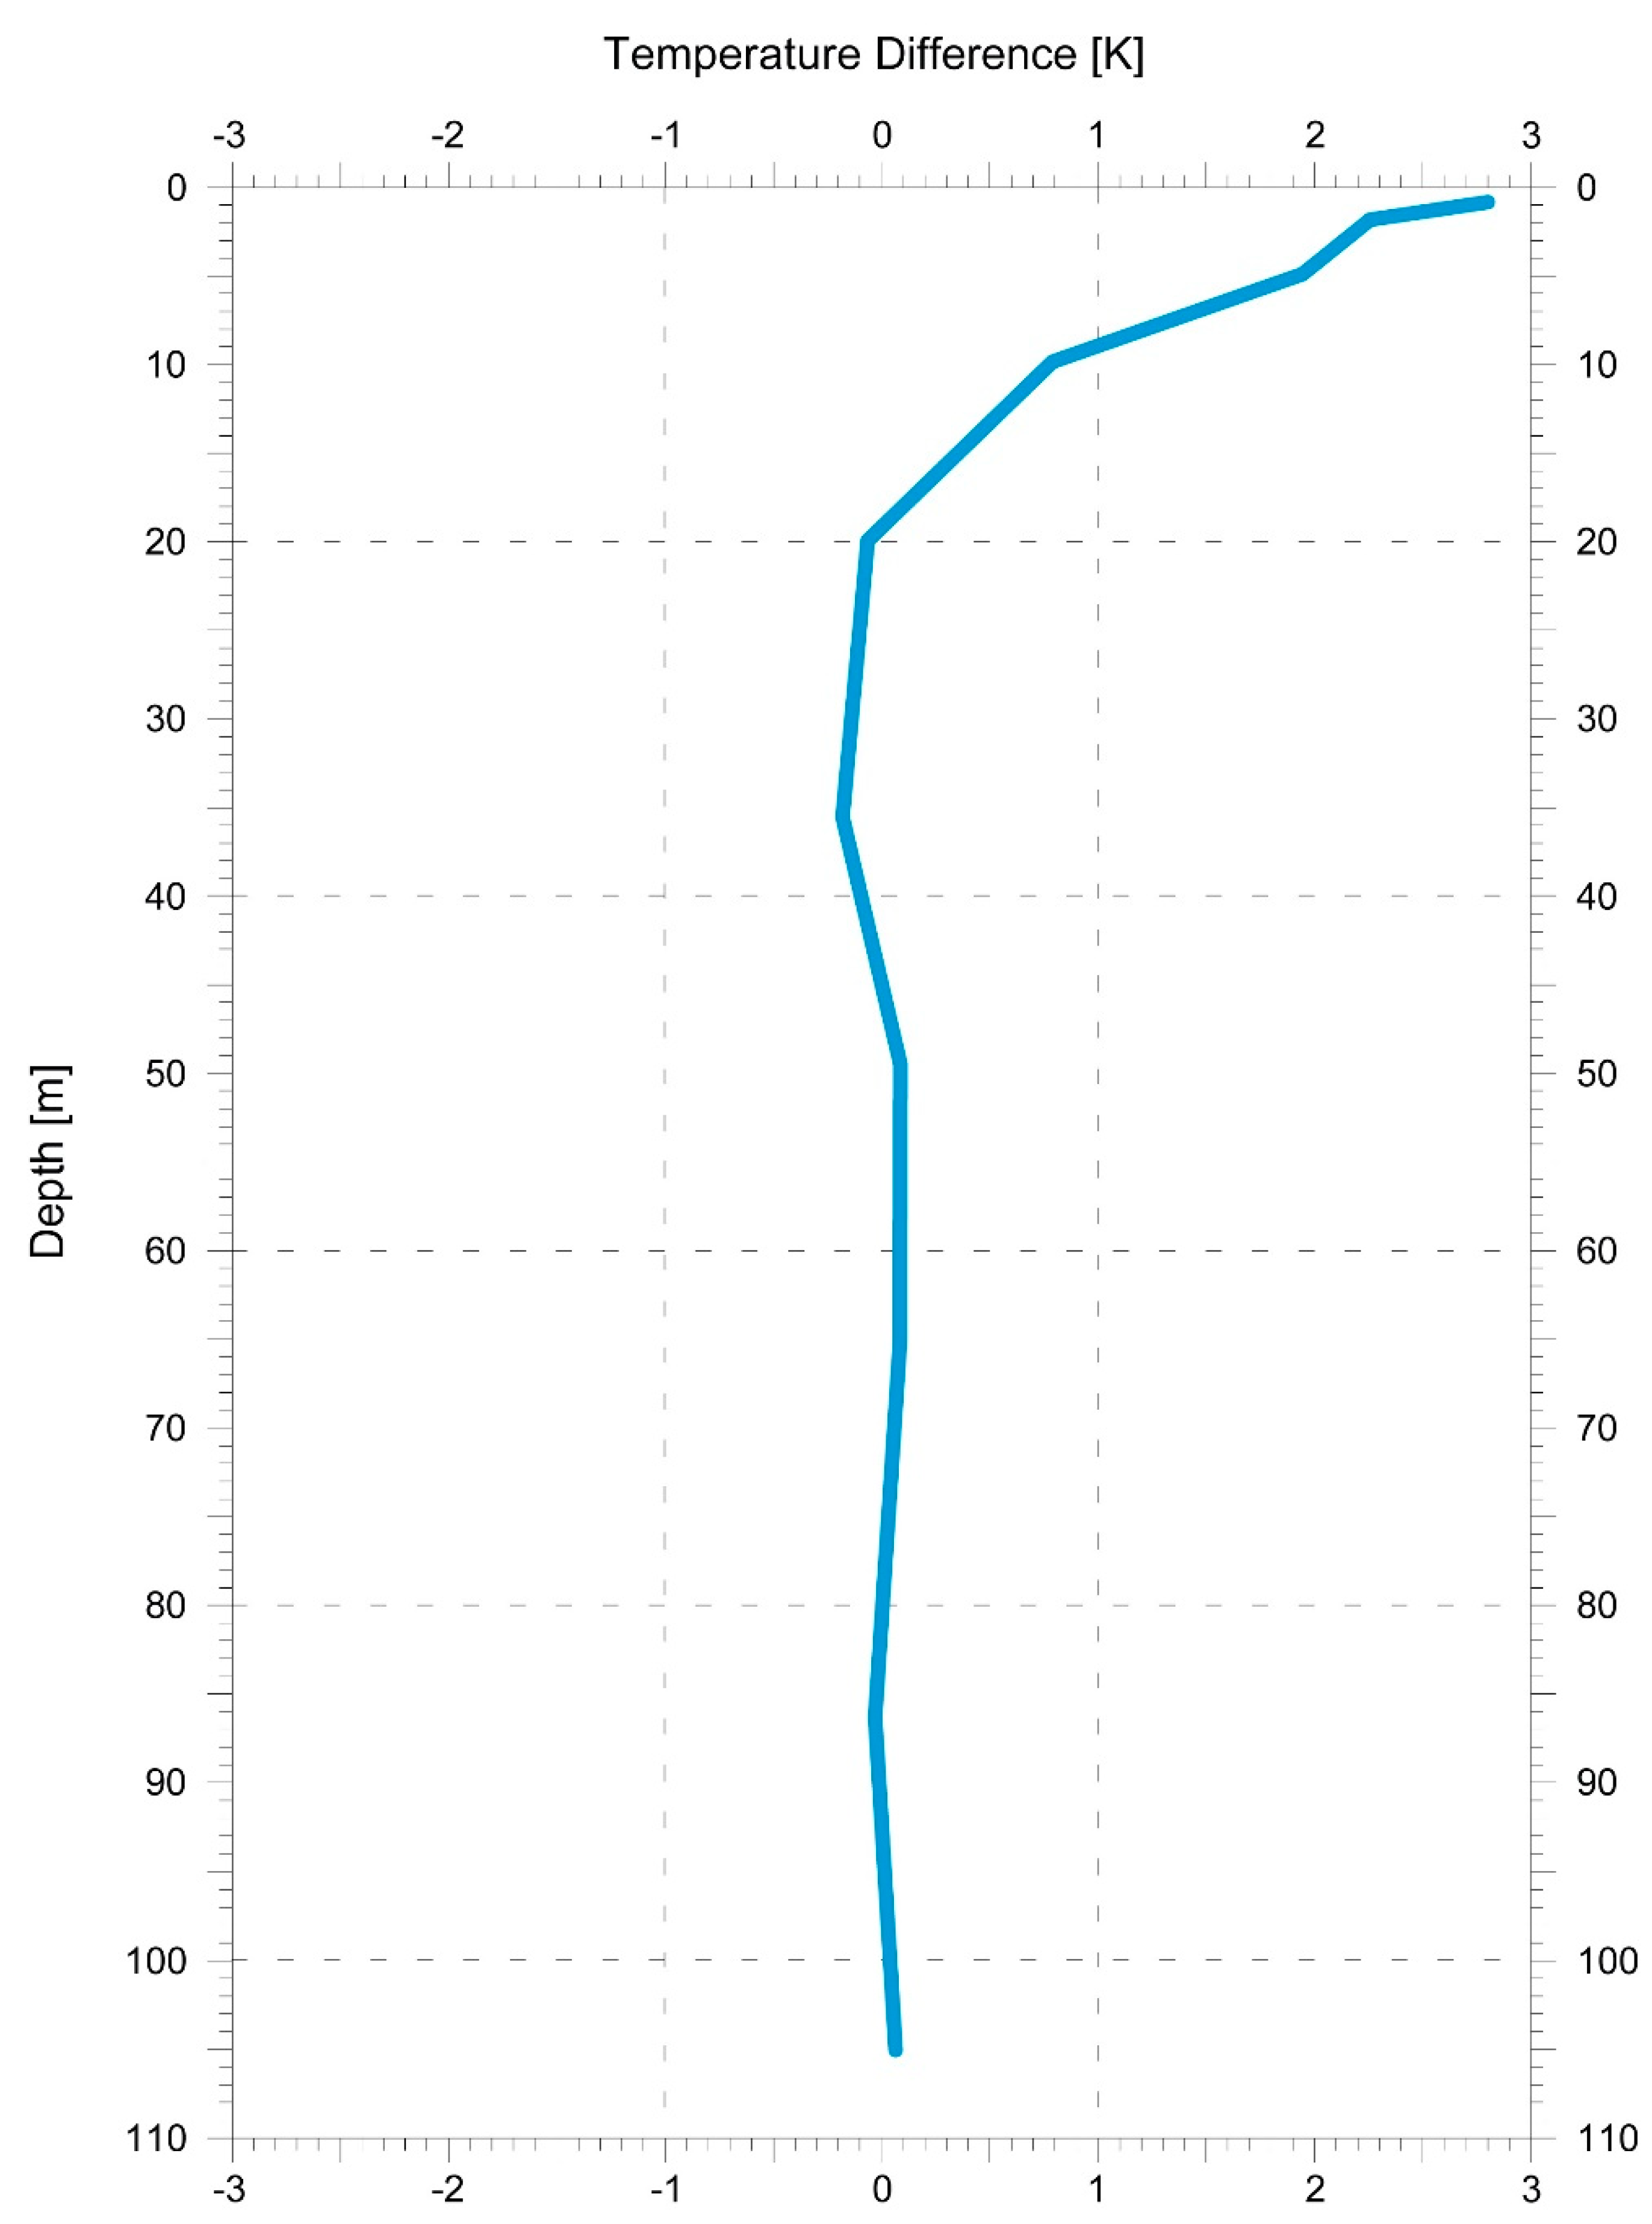
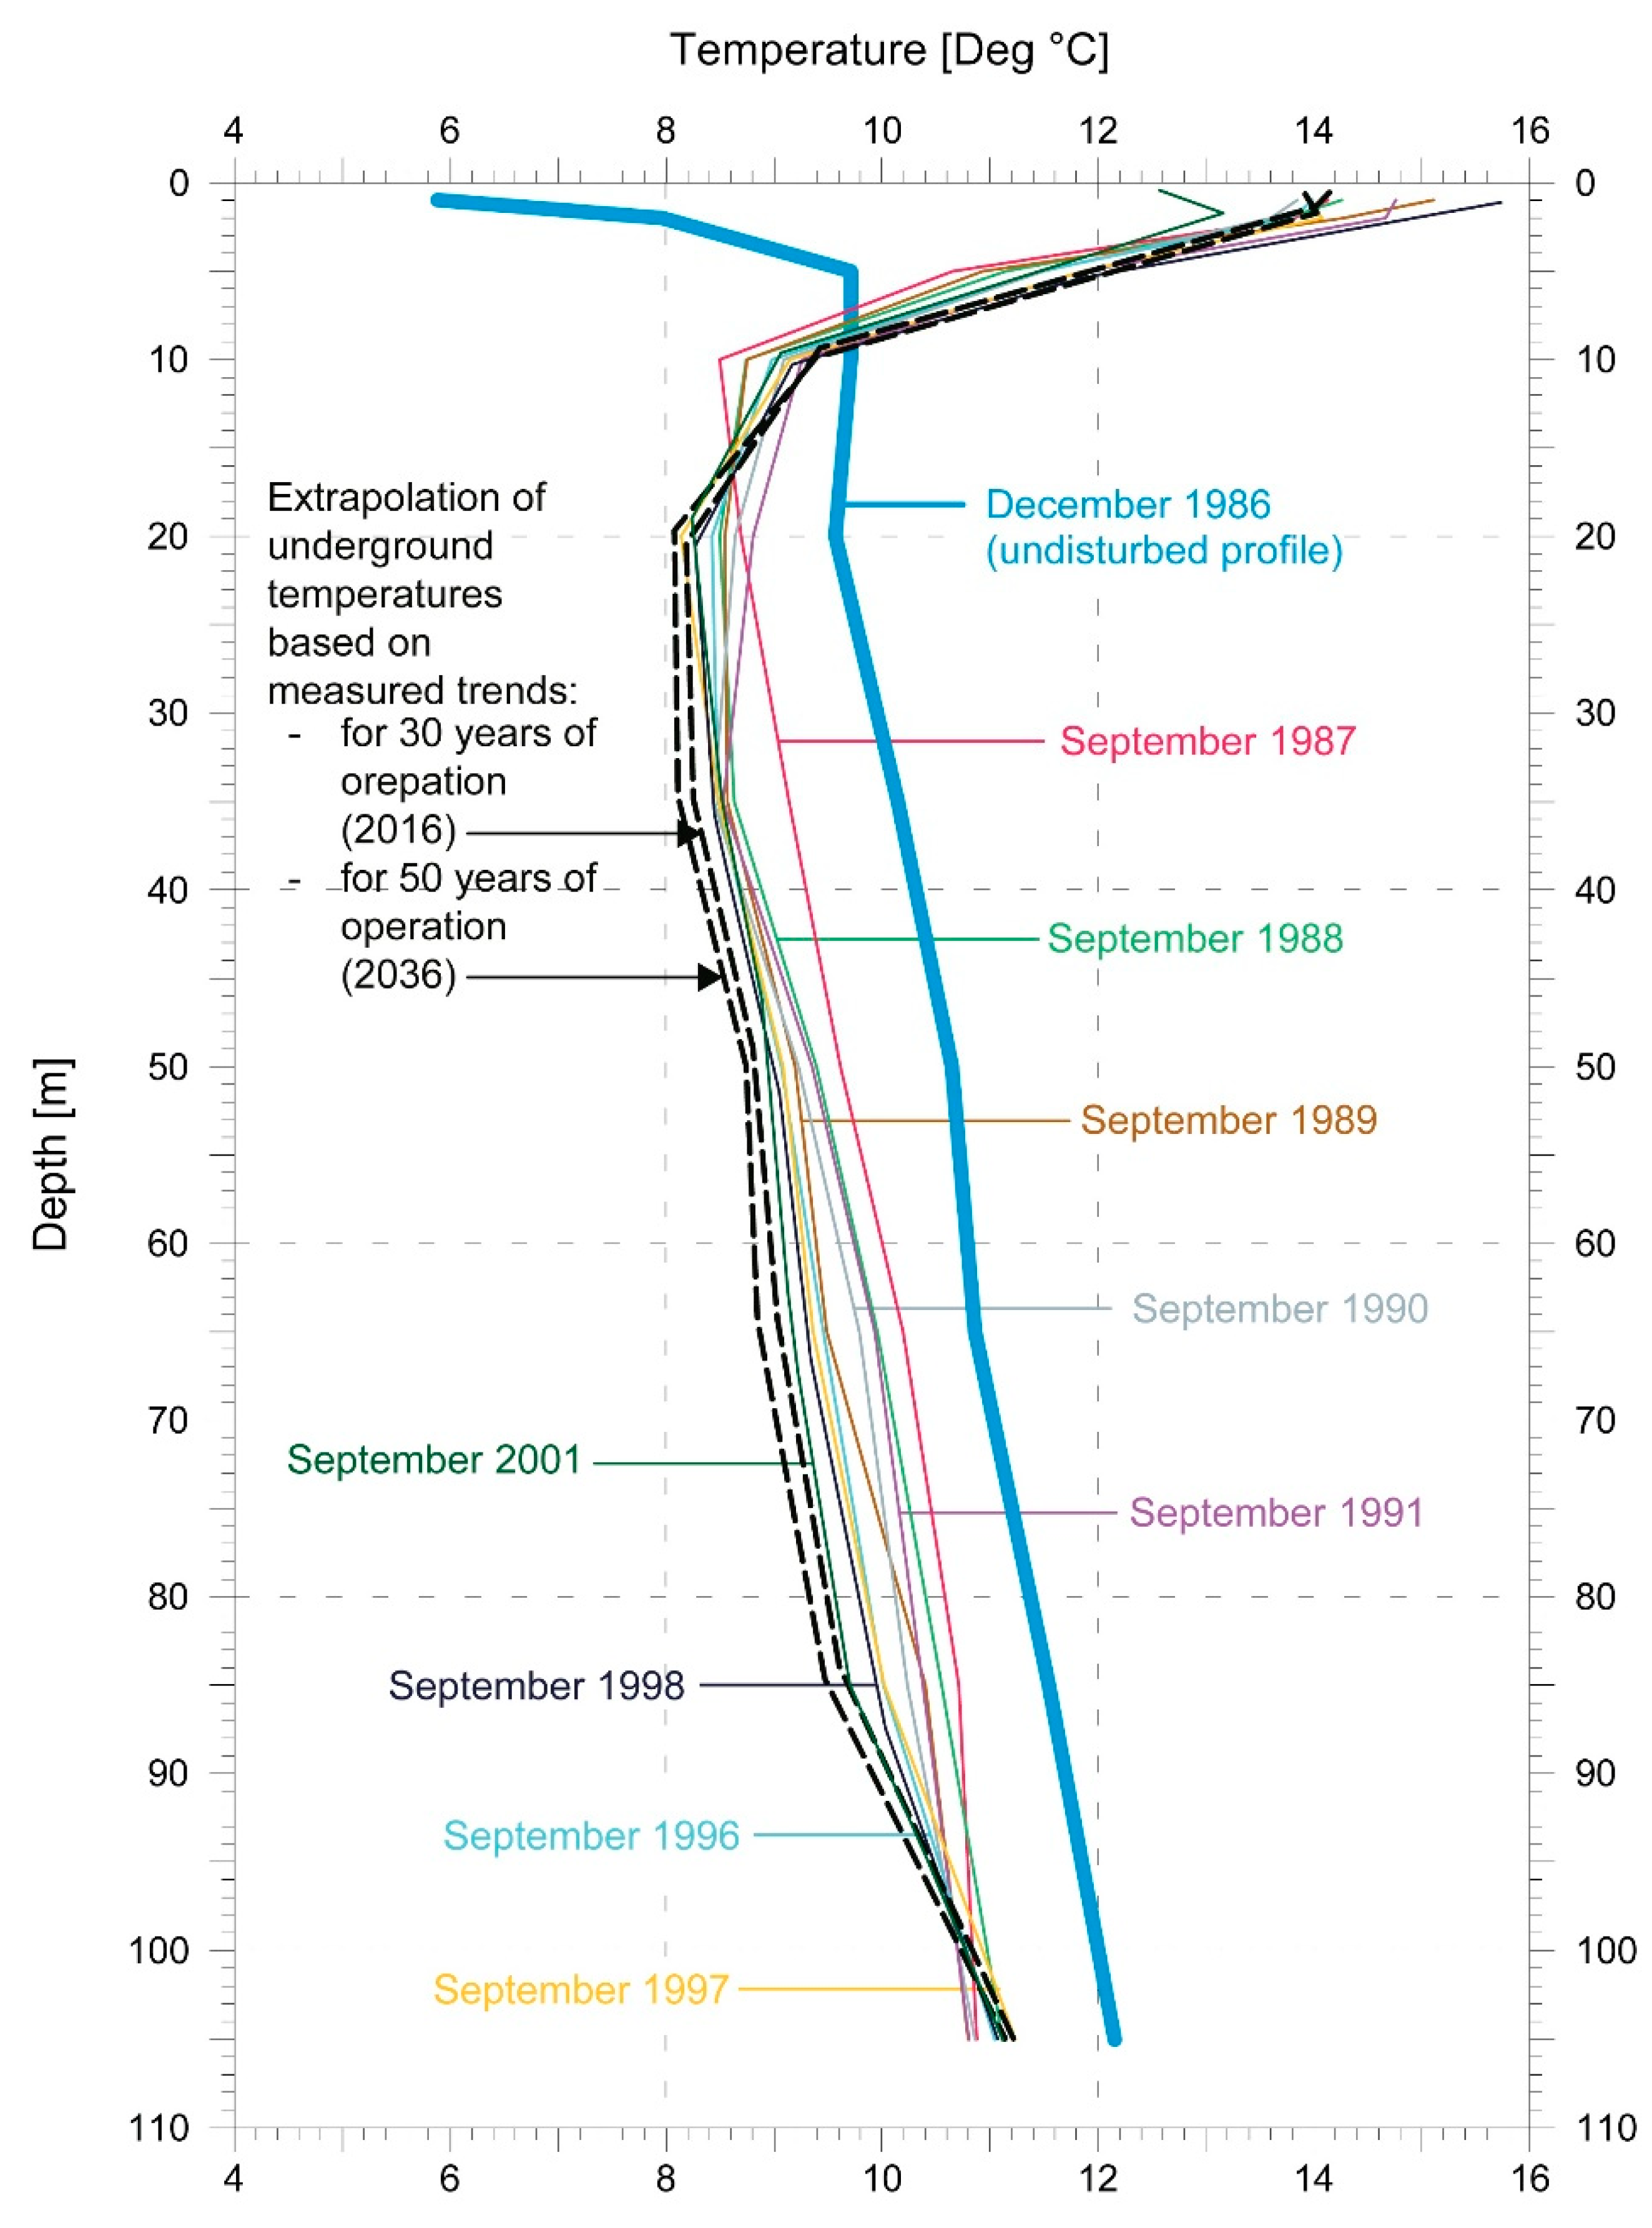
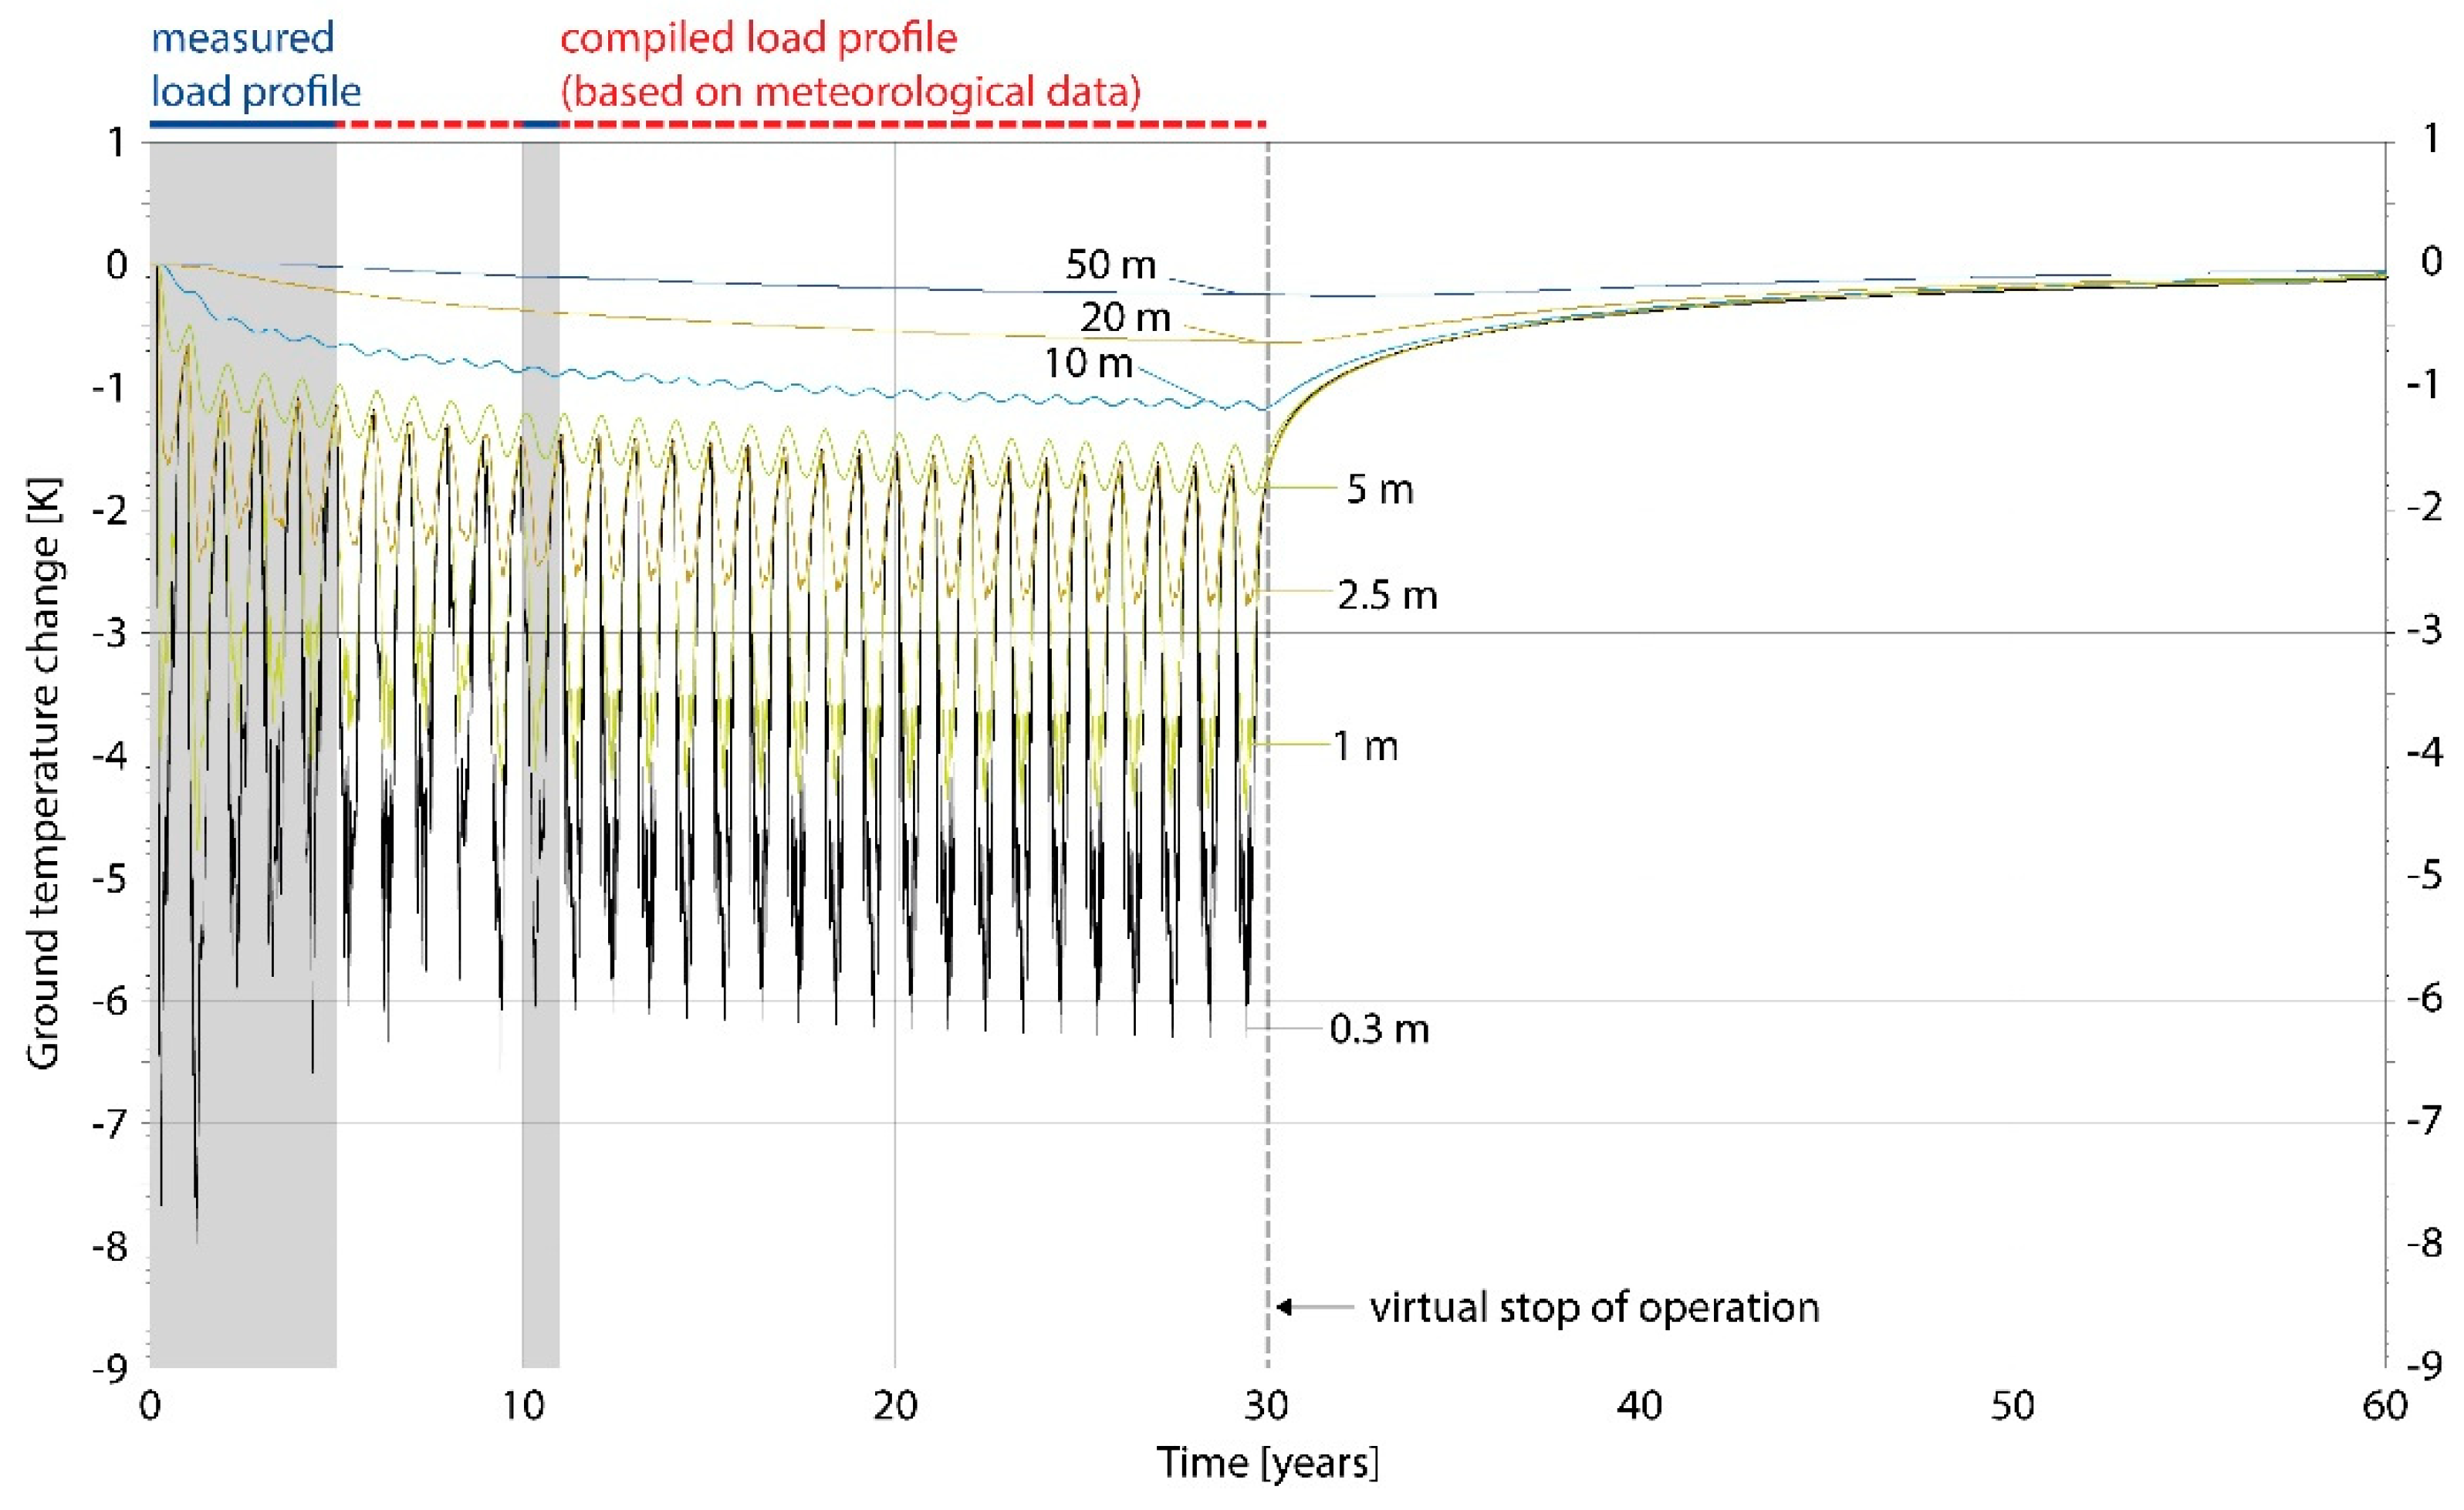
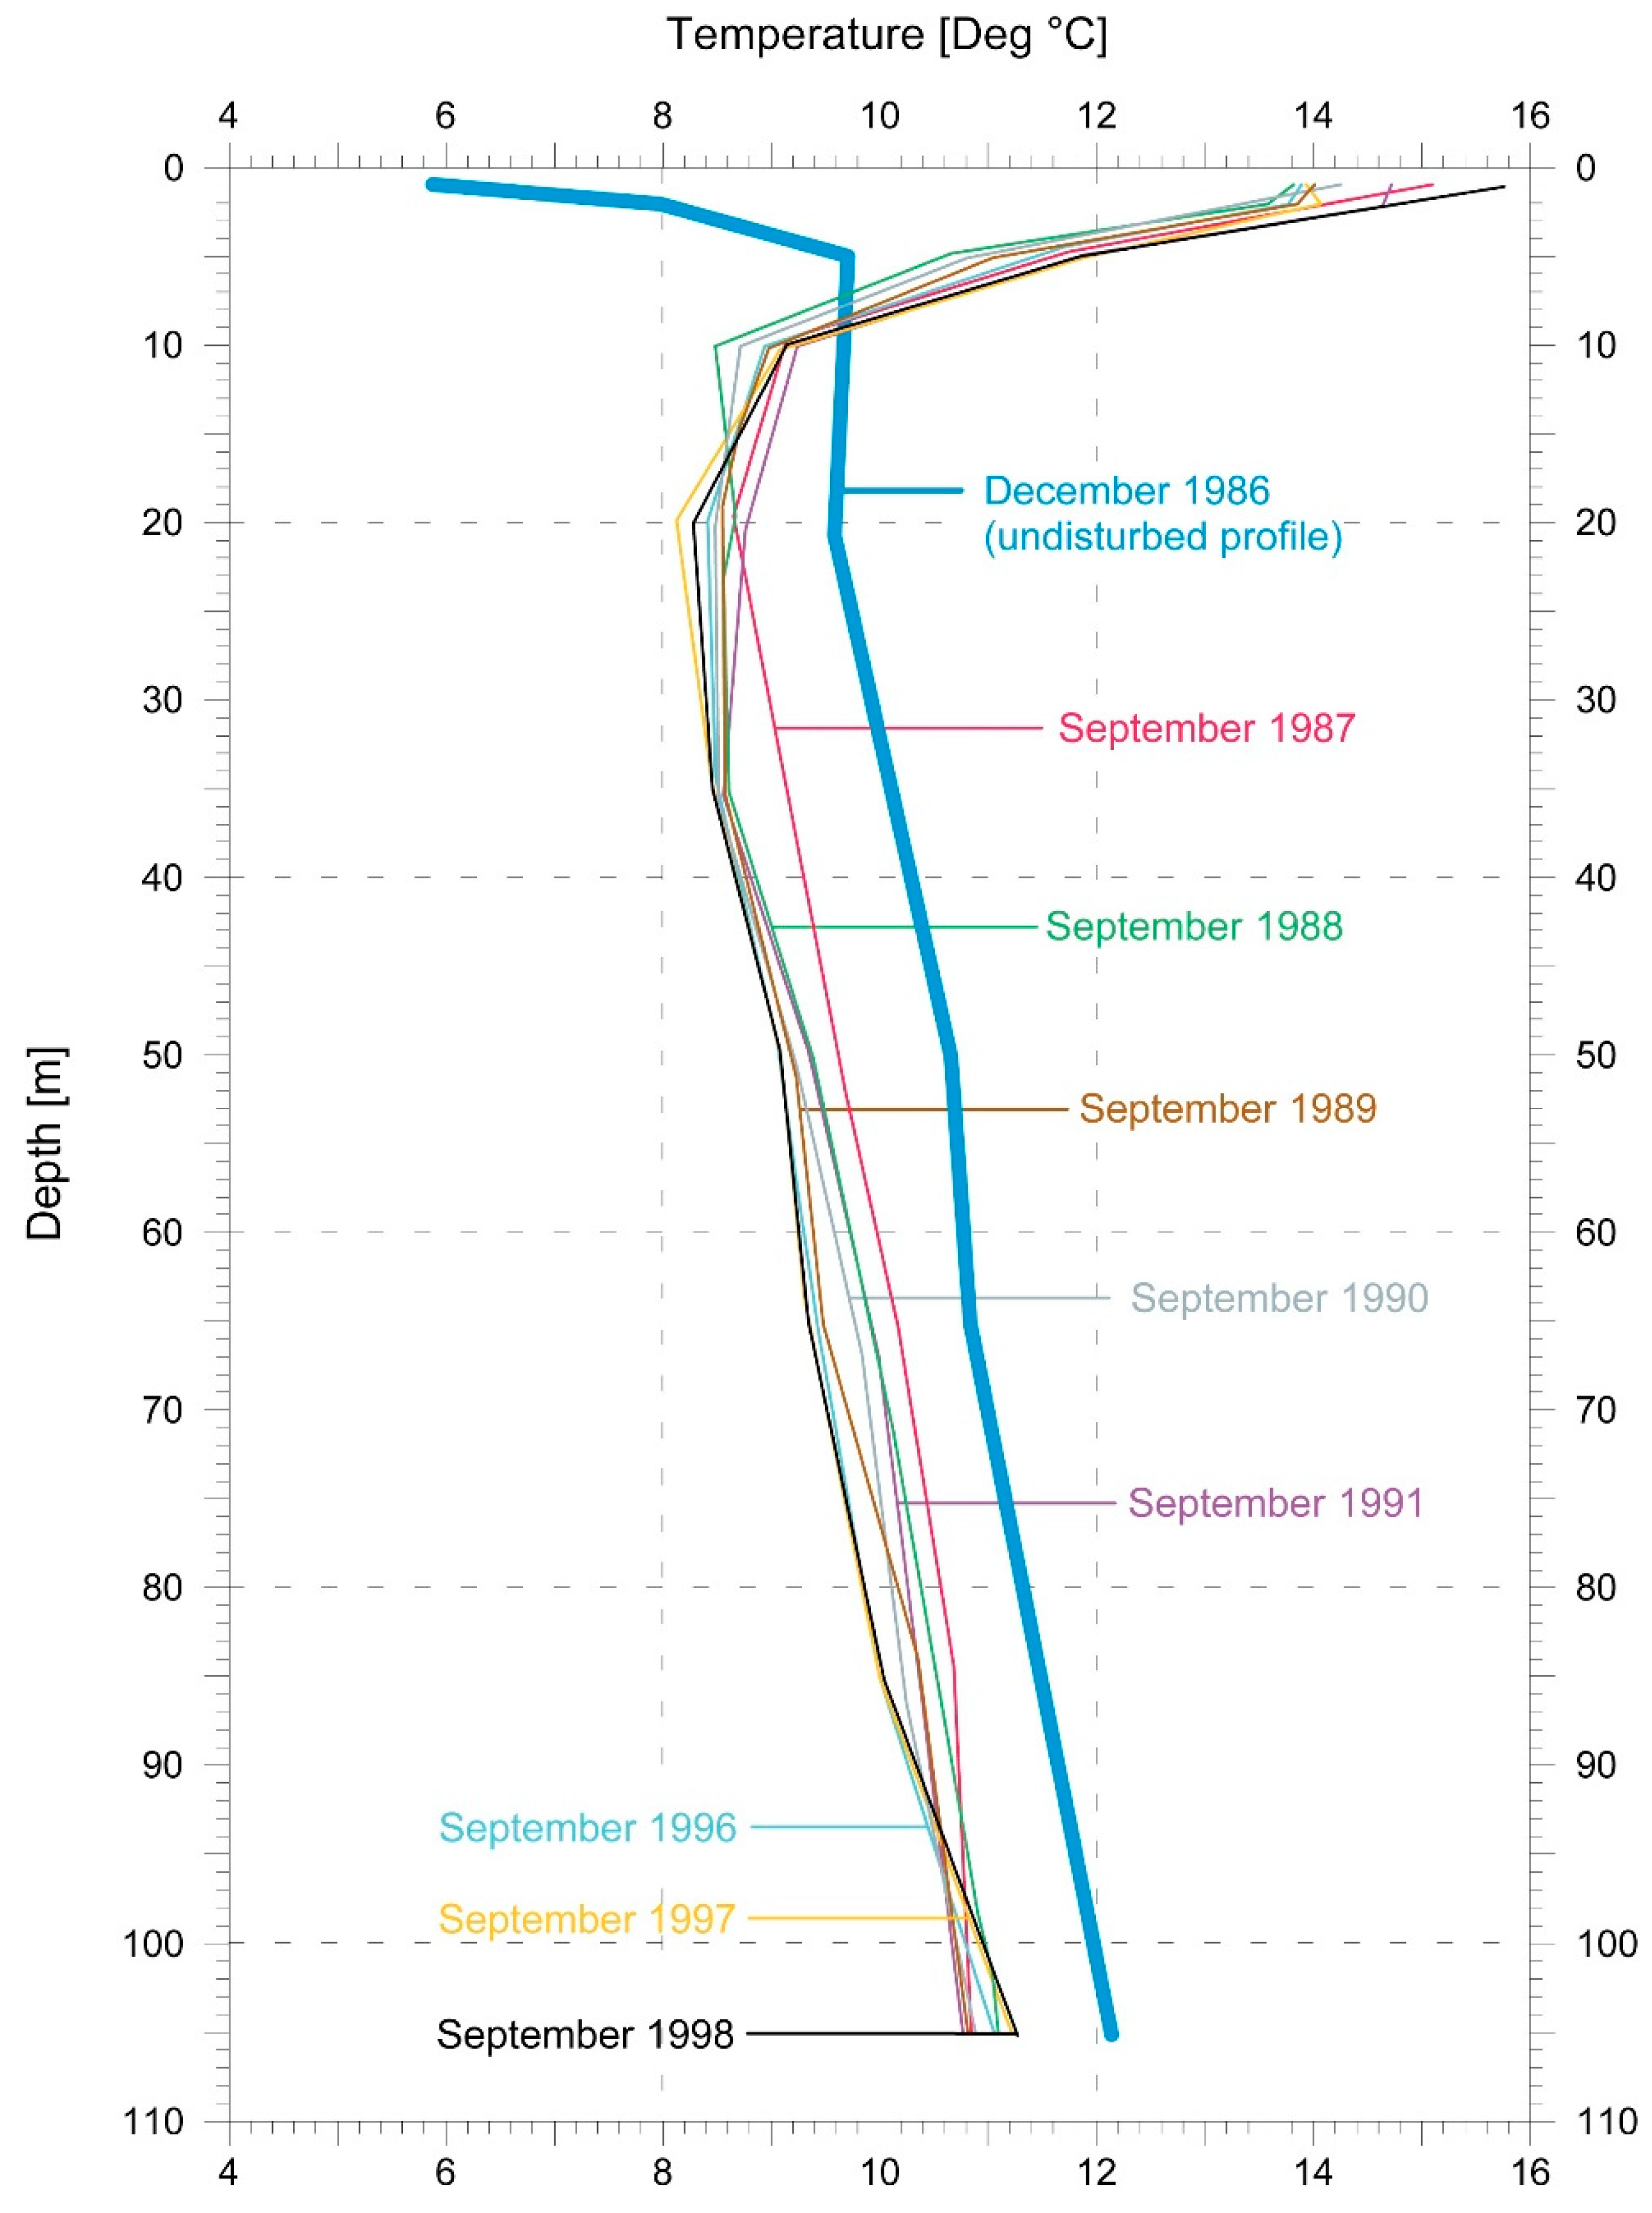
2.2. Key Results and Findings

This unique measuring setup delivered a wealth of data; their processing and interpretation provided a wealth of information about the operation characteristics of a BHE-coupled GHP system. Some key results of the setup are presented below.
The first measurement campaign extended from 1986 to 1991 (details in [4]). Figure 4 shows a number of temperature-depth profiles, measured at different times in the borehole located at a 0.5 m distance from the BHE axis. The profile marked with 1986 was taken at the start of the heating season from 1986 to 1987; i.e., the undisturbed thermal condition along the BHE. The following profiles to the left were taken in the autumn of the indicated year, just before the start of the heating season.
The effect of seasonal ground temperature changes was visible in the depth range 0–15 m. The first heating season caused a uniform temperature drop by nearly 1.0 °C along the whole BHE. In addition, ref. [5] notes: “It is clear that the near field around the BHE cools down in the first 2–3 years of operation. However, the temperature deficit decreases from year to year until a new stable thermal equilibrium is established between BHE and ground, at temperatures, which are some 1–2 °C lower than originally”.
In a second campaign, the measuring setup was restarted in autumn, 1996, until autumn, 1998; the temperature profiles are shown in Figure 5. Then, the formation temperature was predicted along the BHE for the heating season starting in 1996 and 1998 by the computer code COSOND, in cylindrical coordinates, based on the surface temperature history from 1986 to 1991.
The COSOND code and its operation are explained in [5], as follows: “The numerical 2D finite difference code treats diffusive heat transfer in the ground, advection in the BHE, heat transfer between the BHE fluid and the wall materials, as well as heat transfer between atmosphere and ground. The program flow is controlled by a load profile, which contains the atmospheric temperatures and the operational data of the heat pump”. Further details are given in [5,6].
The difference between the measured profile and the modeled profile in 1998 is plotted in Figure 6: The temperature difference is negligible, except for the top 20 m, which is influenced by seasonal temperature changes and is within measurement error. The software became well calibrated (for details, see [6]). The proven software capability gave confidence for further modeling; first, regarding the season-starting profile 2001, and then 30 and 40 years ahead; i.e., for the autumn of 2016 and 2036 (Figure 7). The temperature decreases were minimal.
The ground temperatures around the BHE decreased during the heating season; between its end and the start of the next season, the ground temperatures recovered and increased. This is shown in a horizontal plane at mid depth (50 m) around the BHE (horizontal, dashed yellow line in Figure 3), and at various distances in Figure 8. The increases and decreases of the temperatures were significant. Near the BHE, the amplitude of the temperature changes was highest; with increasing horizontal distance the amplitudes decrease. The shorter the distance from the BHE axis, the larger the amplitude of the temperature changes. It must be noted that the figure shows measured data during the first six heating seasons (1986/87–1991/92); the rest (1992/93–1995/96) were calculated by taking nearby meteorological data (covering the annual surface temperature changes).
With this modeling, it was challenging to consider longer time periods of successive annual fluctuations. For these model calculations, regarding conductive heat transfer, the system operated for 30 years and then it stopped. In the current model, an “average meteorology” was taken for the rest of the 30 years. Figure 9 shows the results. The labels 0.3 m, 1.0 m, 2.5 m, etc., indicate the distance of the point from the BHE axis. Here, again it can be seen the larger this distance is, the smaller the temperature change amplitudes. To clarify, different colors were used for the distances: black (0.3 m); blue (1.0 m); red (2.5 m); and green (5 m).
Figure 4. Temperature profiles measured in 0.5 m distance from the BHE in Elgg during the first data acquisition campaign. The December 1986 curve marks the undisturbed profile at the start of the first heating season. The following curves show the temperatures after winter heat extraction and summer recovery, just before the start of the next heating season. The data in the top 10 m reflect the seasonal changes. Data from [7] are plotted.
Energies 15 07870 g004
Figure 5. Measured ground temperature profiles, including those in the second campaign (from 1996 to 1998) at a distance of 0.5 m from the BHE in Elgg. Data from [5] are plotted.
Energies 15 07870 g005
Figure 6. Difference in the measured and predicted ground temperatures (measured minus calculated values) in 0.5 m distance from the BHE after 12 years of operation. The deviations were generally within measurement error (±0.1 K). Data from [5] are plotted. For details, see text.
Energies 15 07870 g006
Figure 7. Further modeled temperature profiles (at a distance of 0.5 m from the BHE in Elgg), in addition to the measured profiles in the first and second campaigns; for the autumns of 2001, 2016, and 2036. Data from [8] are plotted. For details, see text.
Energies 15 07870 g007
Figure 8. Cooling and recovery of the ground in 50 m depth, at different distances from the BHE. Shows measured data during the first six heating seasons (1986/87–1991/92), the rest (1992/93–1995/96) were calculated by taking nearby meteorological data. The dynamics of the funnel-shaped temperature changes is eminent. Data from [5] are plotted.
Energies 15 07870 g008
Figure 9. Measured and model-simulated ground temperature changes at 50 m depth around the BHE at Elgg at various distances, over 30 years of operation and 30 years of recovery. Data from [9] are plotted. For details, see text.
Energies 15 07870 g009
Finally, it was imagined that the measurement system still operates after the heat extraction stops and the corresponding temperature recovery is calculated (years 30–60). After the shutdown of heat extraction, regeneration of the ground begins. During the production period, the drawdown of the temperature around the BHE is strong during the first few years of operation. Later, the yearly deficit decreases more and more. Here, a kind of basic finding results, which is recorded in [5] as follows: “During the recovery period after a virtual stop-of-operation, the ground temperature shows a similar behavior: during the first years, the temperature increase is strong and then less and less”.
These effects are shown in Figure 10. Principally, the recovery period equals the operation period, the changing speed of recovery is similar to that of the decrease. In mathematical form, the decrease looks like y = e−αx, the recovery like y = 1 − e−αx.
All of the above was elaborated for a single BHE; nevertheless, the findings are of general importance. Later studies elaborated additional information concerning arrays with multiple BHEs [7,10,11,12,13,14,15].
The numerous measurements and model simulations prove that sustainable heat extraction can be achieved with GHP systems. In fact, the BHE installation in Elgg showed stable and reliable performance and supplied, on average, about 47 GJ of heating per year, which can be considered sustainable production. Thus, reliable long-term performance provides, in general, a solid base for problem-free application. The favorable results have been regularly communicated to the few Swiss commercial GHP actors.
Besides, the results above enable the clarification of, in a more general sense, the renewability aspects of shallow geothermal resources. These issues are further described below.

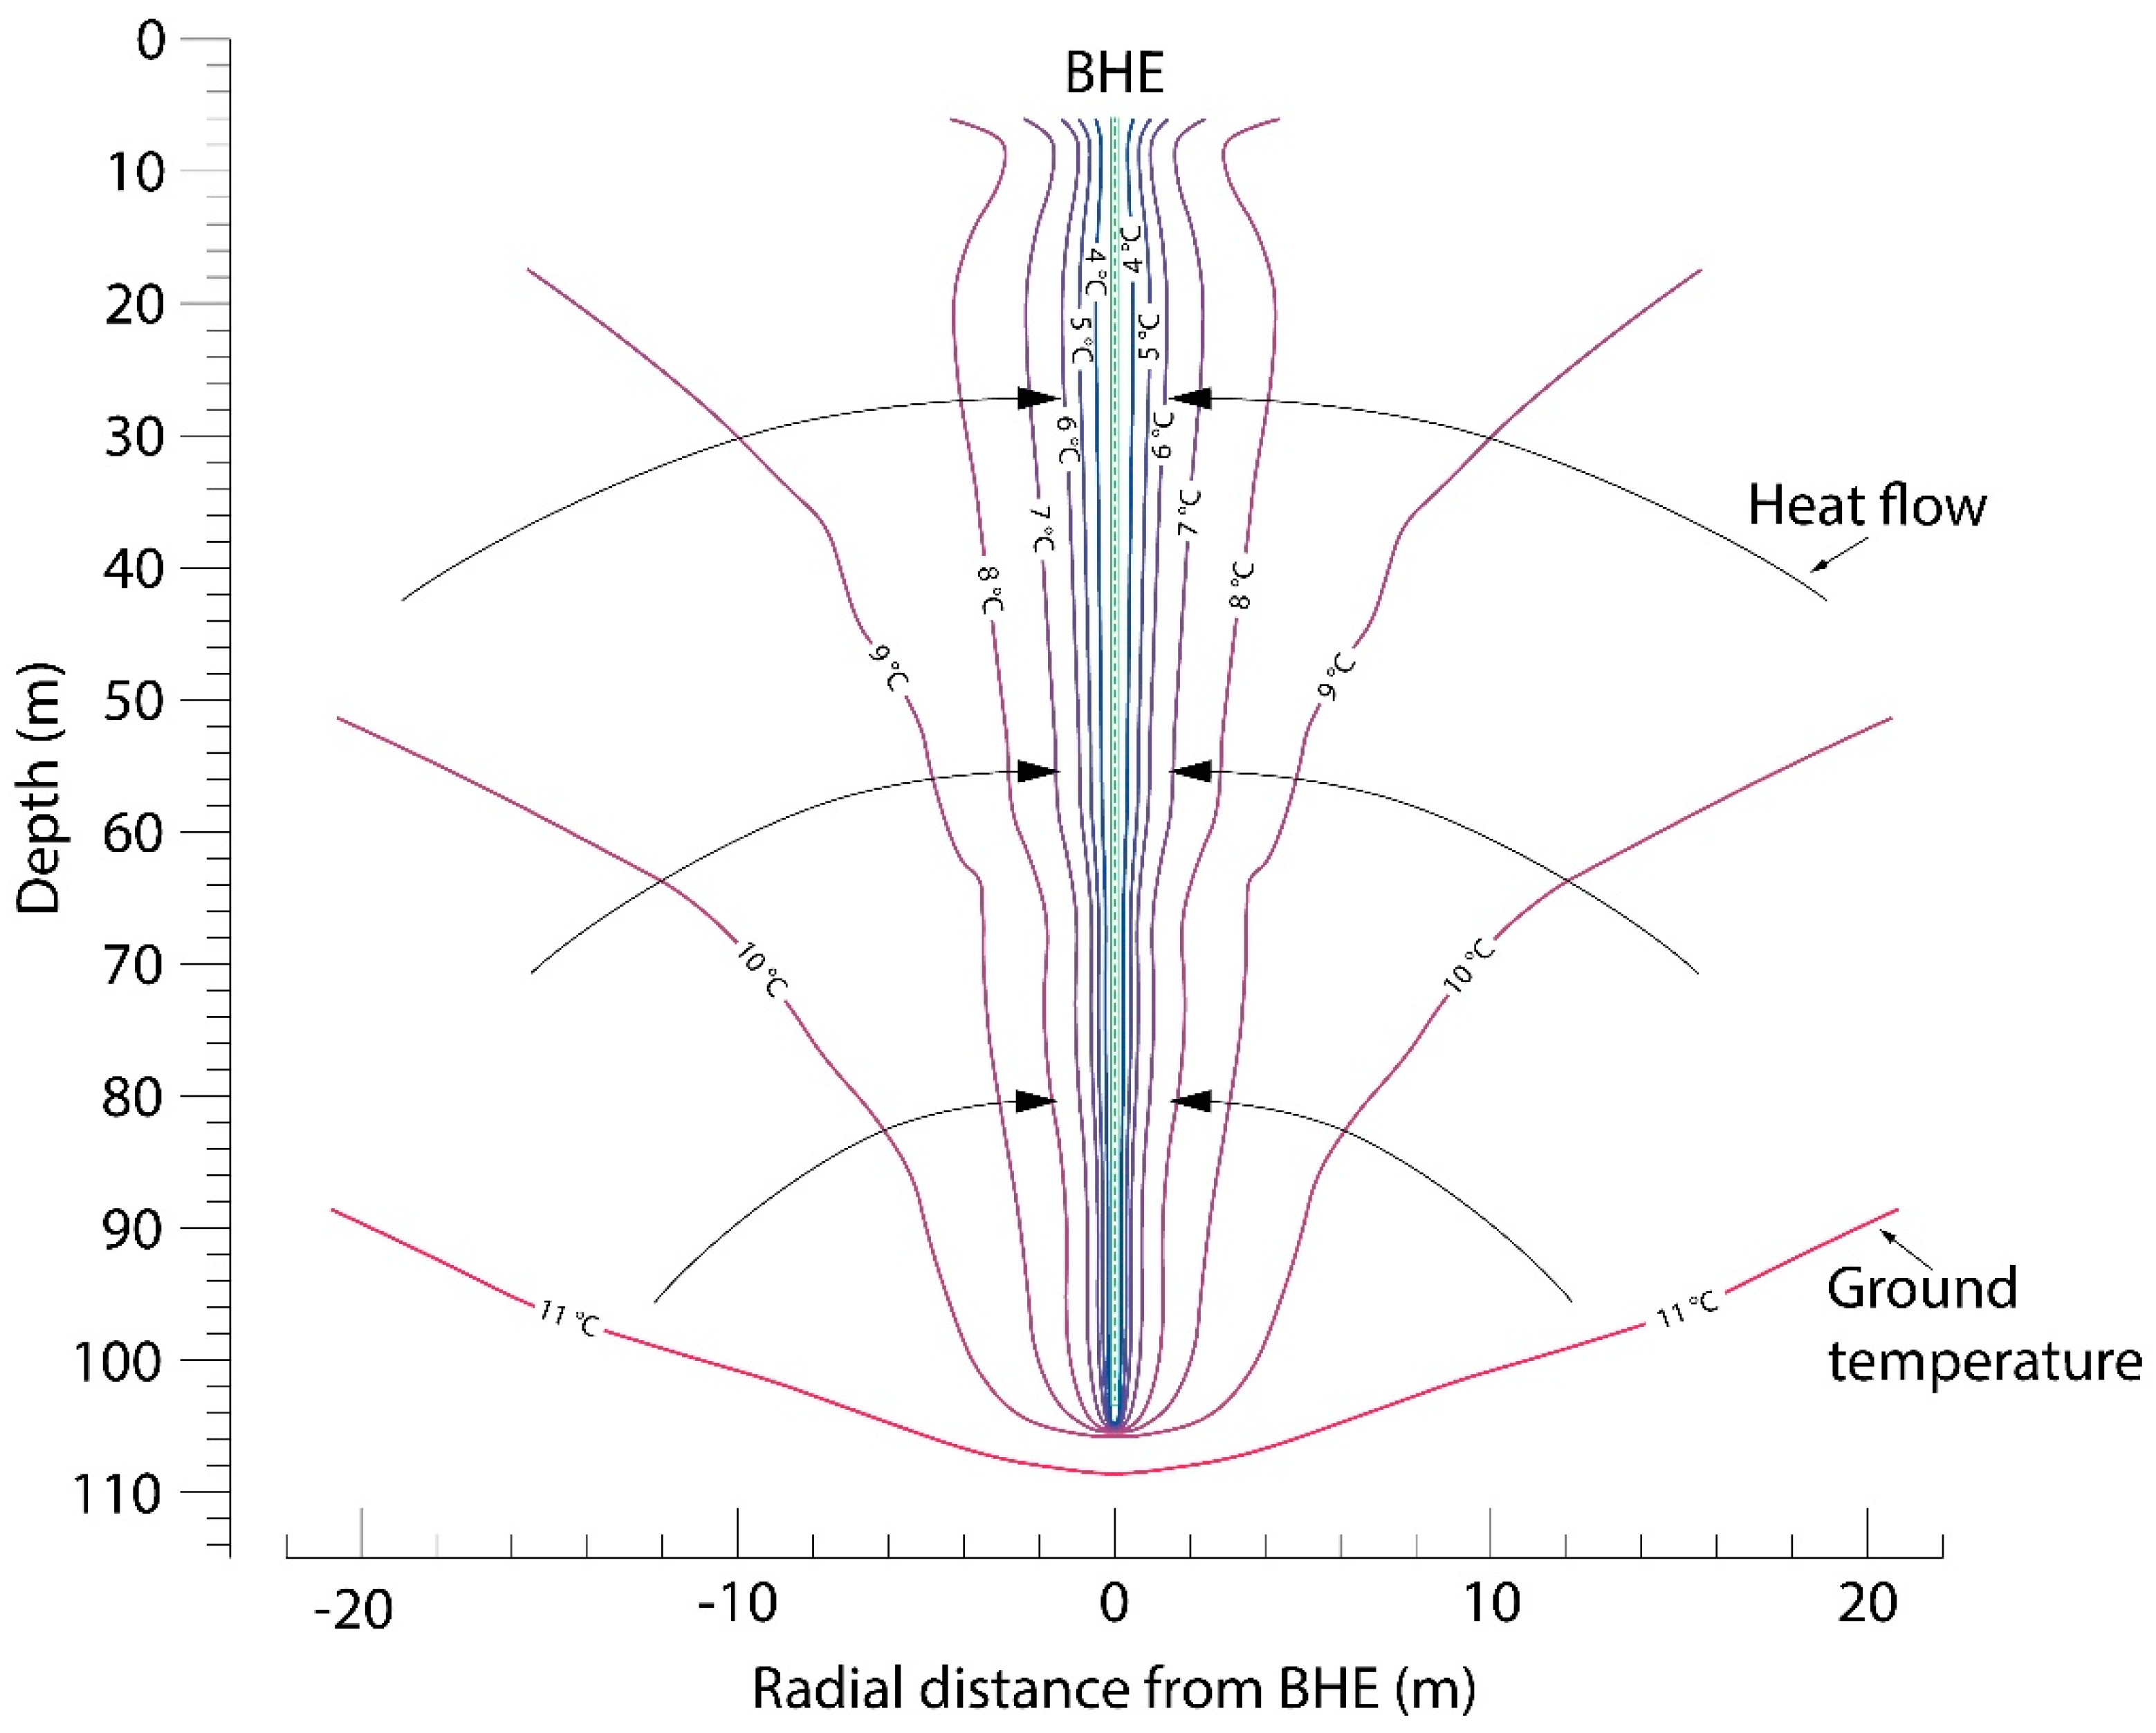
3. Use and Replenishment of Shallow Geothermal Resources

In the following, it is shown in detail how the temperature distribution in the subsurface behaves in general during and after heat extraction. First, the situation using shallow resources is shown (Figure 11, left). Below flat ground, the isotherms are parallel and horizontal. The terrestrial heat flow from below (represented by arrows) is perpendicular to the isotherms. Globally speaking, the Earth, as a planet, can afford to give away heat with about 40 million MWth capacity (equal to the terrestrial heat flow integrated over the surface of the globe) to the atmosphere [10]. This is equivalent to the thermal power of 13,000 nuclear power plans of the 1 GWe category.
What happens with isotherms when heat extraction takes place by utilizing the shallow resource? This has been investigated using the example of a borehole heat exchanger (BHE); a key component of a GHP. The BHE extracts heat along its full length. Through heat extraction (conductive heat transfer), a heat sink is created, which deforms the isotherms. Instead of being horizontal, as before, they arrange themselves in cylindrical symmetry, similar to the leaves of a cigar, around the BHE axis (Figure 11, right). In other words, without utilization the terrestrial heat flow is lost to the atmosphere. In the case of heat extraction, the heat flow can be captured, the isotherms are deformed, and the heat flow lines divert towards the heat sink. The heat inflow density can be very high (several W/m2).
A specific temperature field situation with a 100 m long BHE with 10 cm diameter was simulated for the middle of a heating season by numerical modeling (Figure 12; details in [7]). The BHE extracts heat along its full length; the cylindrical isotherms along the BHE are now vertical and very close to each other. The heat flow vectors are perpendicular to the temperature isolines; with a thermal conductivity of 2.5 W/mK the heat flow is over 2 W/m2, which is, by order of magnitude, higher than the global average terrestrial heat flow (82 mW/m2; details in [11]). This “induced” heat flow replenishes the heat deficit created by the heat extraction (details are included later).
There is proof of the “cigar-leaf” isotherm pattern attained through measurements. In an experimental setup at Schöffengrund-Schwalbach, near Frankfurt/Main, Germany, a test system has been installed and operated. A 50-m deep BHE was surrounded by nine monitoring boreholes at 2.5, 5, and 10 m distances, and at also 50 m deep. In each of these monitoring boreholes, as well as in the BHE, 24 sensors at 2 m vertical distances measured temperatures. This arrangement yielded a total of 640 data points to depict the temperature field in the subsurface around the BHE. The temperature isotherm pattern, constructed from this data base, is shown in Figure 13.
It shows the cigar-shaped isotherm result; the temperature gradient exceeds the value of 1000 °C/km and the heat flow was about 4 W/m2. This is clear proof that the cylindrical isotherm pattern in fact develops around BHEs. For more details, see [9].
The above-described fundamental perceptions prove GHP production sustainability, and are valid for other kinds of geothermal utilizations at greater depths, and also for power generation (from hydrothermal or petrothermal resources) and direct use (from deep aquifers), e.g., for district heating. In particular, the replenishment of a heat sink has its analogy in fluid production, and replenishment in a hydrothermal reservoir; the fluid extraction creates a hydraulic minimum, which leads to strong hydraulic gradients and corresponding inflow to refill the resource. In other words, as mentioned, geothermal resources regrow, like biomass.
These findings regarding resource use and replenishment on one hand, and regarding production sustainability on the other, have been further developed and, from the findings, a whole series of international publications have presented numerous details [13,14,15,16,17,18].

4. The Swiss GHP Success Story

4.1. The Very Beginnings

With GHPs, Switzerland had to start from zero. Though not so with heat pumps, as the first European heat pumps were realized in Switzerland. The first heat pump was installed in 1938 (100 kW) to supply the City Hall of Zurich. The heat source was the nearby river Limmat, the refrigerant R-12. It still operates, and has done since 2001 with R-134a. Other, larger heat pump systems were installed shortly afterwards: Zurich-City Indoor Swimming pool (1025 kW; 1941); Walche Plant for the Zurich University Area District Heating System (5860 kW, 1942), which are still operational, having had numerous improvements.
GHP use and development started in 1974, when Jürg Rechsteiner implemented the first coaxial BHE. Later, along with Ernst Rohner Sen. (GRUNDAG AG, Gossau, Switzerland), he developed the BHE with double U-tube polyethylene. In around 1980, Kurt Trüssel, the founder of the KWT company in Belp, installed the first commercial ground coupled heat pump for a home in Hettiswil. These and many other early and later technical and commercial developments can be found in [19].

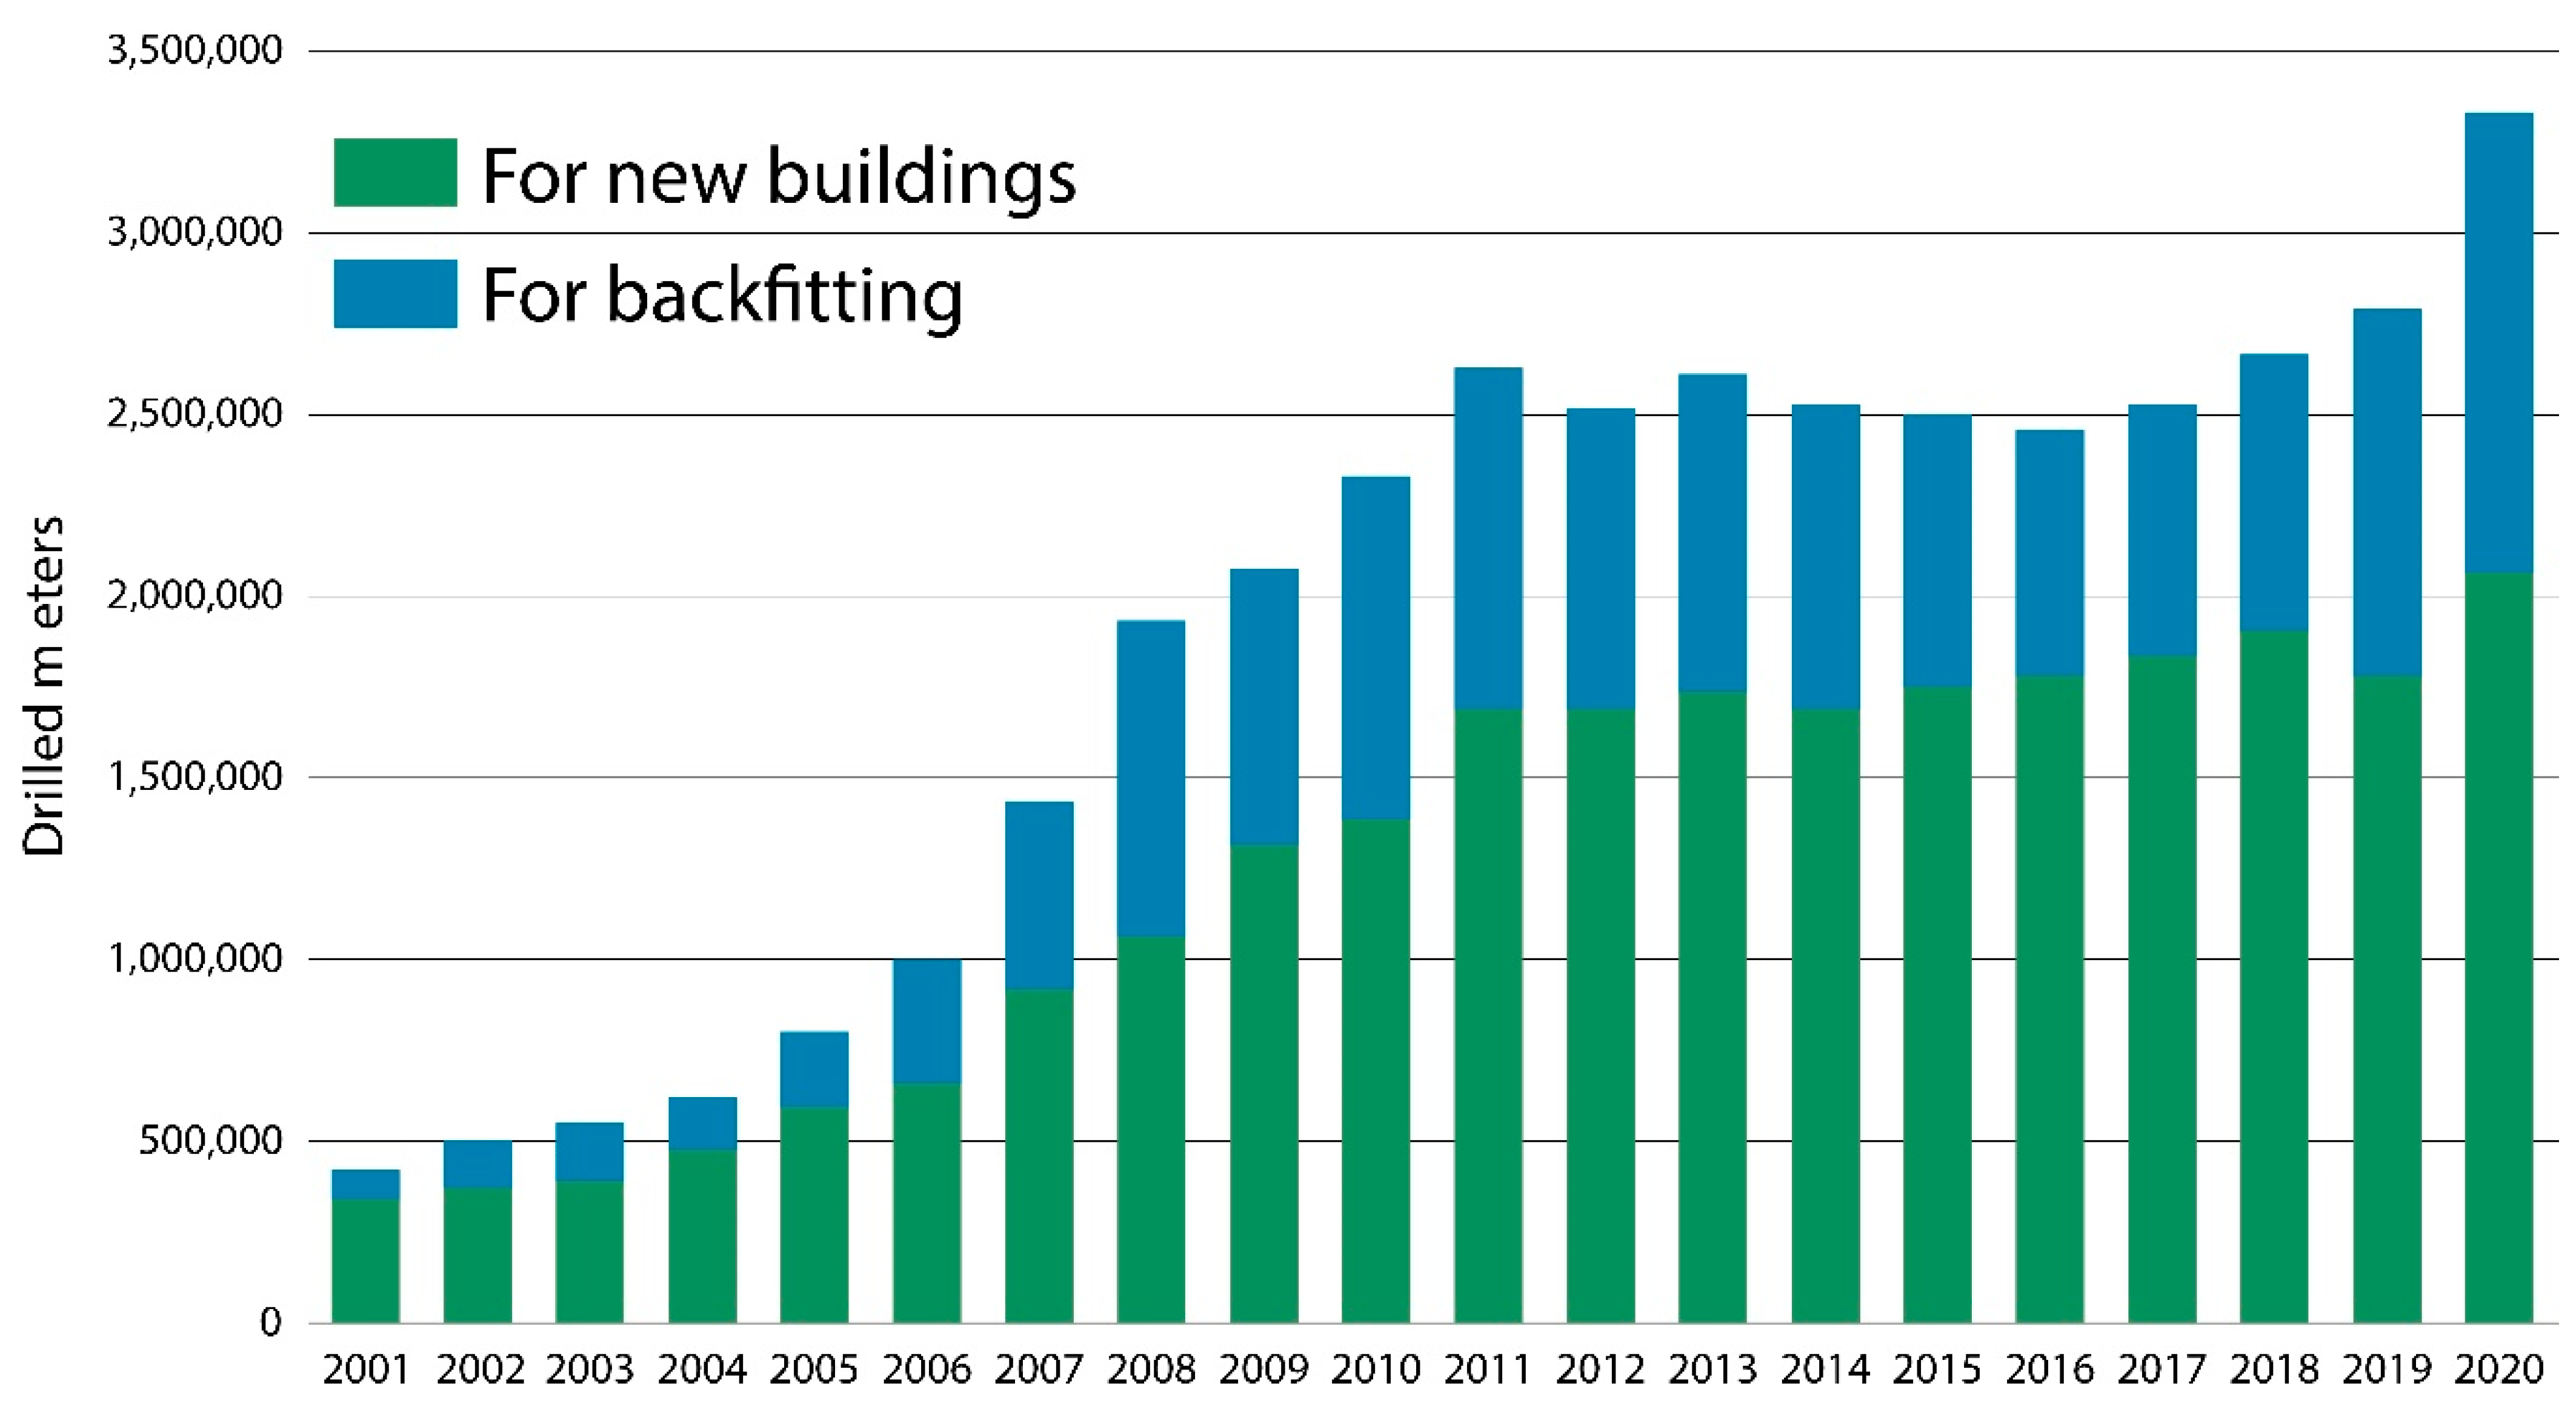
4.2. Rapid GHP Development and Growth

The above-presented positive results of the extensive investigation at the field laboratory in Elgg, acquired over several years, are fully science-based. The elaborated indicators of the reliability and stability of GHP operation and delivery laid the groundwork for market introduction and growth. For this, numerous publications served as arguments and stimulus for architects and planners in the late 1980s for selecting and realizing a new technology of the time, predominantly in new buildings. These articles were especially placed in various journals pertaining to the construction industry [20,21,22]. Additionally, two key players need to be mentioned: the Swiss Federal Commission for Geothermics and Subsurface Heat Storage KGS, and The Swiss Geothermal Association SVG. Both organizations were strongly engaged in the promotion of geothermal development and utilization. The KGS operated from 1975 to 1994, and the SVG was founded in 1990 and was later renamed as GEOTHERMIE-SCHWEIZ.
The siting and distribution of GHP installations was first mapped in 1991. At that time, it documented around 4000 GHP installations of various sizes, with about 9000 BHEs (see Figure 14). The majority of the installations were in private houses. The area distribution corresponded roughly to population density. In the years after 1991, the rapidly growing number of GHP installations made their plotting on a map impossible. Today, growth is reported annually in detail (see below).
Figure 14 shows that most of the installations are located in a SW-NE-oriented belt, and this trend has continued. In addition, most of the Swiss population lives and works in this belt. Remarkably, and in geologic terms, this area coincides with the Molasse Basin in the Norther foreland of the Alps. The subsurface structures are generally simple and flat; the Tertiary sediment fill of the basin consists mainly of sandstones, marls, and sometimes conglomerates. These rock types are generally rather uniform, and thus, with favorable thermal conductivities. In addition, they are easy to drill into for installing BHEs. Therefore, it is no surprise that most of the Swiss GHPs are located in this belt.
In order to further document the Swiss geothermal direct use development over the years, a report was produced upon request of the Swiss Federal Office of Energy (SFOE), by the Institute of Geophysics ETHZ—covering the period from 1990 to 1999 [23].
From 2002 onwards, annual reports have been elaborated, for the SFOE, by the company GEOWATT AG Zurich—with its specially designed format. The author was involved in the documentation of Swiss geothermal utilizations from 1990 to 2014. Since 2015, Katharina Link (Geo-Future GmbH) and her coworkers have produced the annual reports. More details and information about the current GHP market promotion and installation subsidies can be found in [24].
The market success of the GHP systems over the years can be clearly demonstrated by their diagrammed growth from 1990 to 2020; see Figure 15. It shows the percentages of the various Swiss geothermal direct use categories. Most of the heat delivery stems from heat pump systems (ground-coupled and groundwater-based). Groundwater-based heat pump systems are much less prevalent since groundwater-protection legislation restricts their installation in many areas. The generally growing tendency toward geothermal direct use over decades is evident; it is based solely on the ground-coupled GHP variety.
The GHP situation in 2020 was the following (according to [25]): The heating energy produced mainly came from ground-coupled systems, with a share of 95.2% (3823.6 GWh). Of this, 85.1% was accounted for by BHE systems (3253.7 GWh). The rest were near-surface groundwater-based heat pumps (12.6%, 482.7 GWh) and geostructures (1.6%, 61.5 GWh; for details, see below).
Another success factor was the economic improvement of GHP installations; Figure 16 shows the major installation cost reduction (more than 50%) over the years, a kind of learning curve. The three main cost components (for a typical single-family house) are depicted: (1) Drilling and installing the BHE; (2) connections; (3) heat pump (HP). The costs in Swiss francs (CHF) were inflation-corrected in 2004; the US$ equivalent is also from 2004. Installation costs remained constant until 2019. The most common and frequently installed BHEs in Switzerland have 0.1 m diameter and are equipped with grouted-in double polyethylene pipes.
Here, the various and excellent activities of the Swiss Association for Heat Pumps (FWS) must be highlighted and emphasized. This association promotes the application of various heat pump systems in Switzerland. Figure 16 is taken from the FWS website http://www.fws.ch/ (accessed on 5 October 2005). It must also be emphasized that the FWS is instrumental in Swiss BHE quality assurance. The FWS issues quality certificates to drilling and heat pump provider companies.
A further development is also remarkable: the length of the mostly vertical BHEs have increased with time. Figure 17 shows a continuous trend: the length started at 50 m and reached 300 m (and not more); this can be due to the fact that more and more GHP systems are designed to provide also space cooling in the buildings to be supplied. Certainly, a BHE can produce (with a very general average value of 50 W per meter length) more heat the longer it is, and is warmer depending on the fluid output temperature. However, BHEs that are too long reach depth levels of the subsurface that are too warm for cooling. More details can be found below.

4.3. Combined Space Heating and Cooling by GHPs

GHP systems can also provide space cooling. Concerning this issue, [2] states: “In moderate climate, in summer, the ground below about 15 m depth is significantly colder than outside air. Thus, a large geothermal store with favorable heat capacity is available where the heat can be “exchanged” (extracted from the building and deposited in the ground store in summer, extracted from the ground and supplied to the building next winter). The thermal capacity of a GHP system depends -besides the volume- on the thermal and hydrogeologic characteristics of the installation site; these must be carefully considered in system dimensioning. In summer, most of the time, the HP can be bypassed and the heat carrier fluid circulated through the ground by the BHEs and through the heating/cooling distribution (e.g., floor or ceiling panels). This is “free cooling”. In moderate climate, BHEs deeper than about 200 m cannot cool enough in summer. When free cooling alone cannot satisfy the cooling needs, HPs can be reversed for cooling since they can operate in normal (heating) and reverse (cooling) mode (“forced cooling”)”.
Currently, in Switzerland, more newly installed GHP systems are designed and installed for space heating, as well as for cooling in buildings. An early example of a GHP-based space heating and cooling system is from Untersiggenthal, Canton Aargau. Long-term monitoring data exists for this single-family home. The owner assembled and reported all the data in [27]. Their concentrated compilation is given in Figure 18. The temperature permanence of the BHE delivery, over 20 years, is impressive.

4.4. BHEs below Buildings

Historically, GHPs were mainly installed for already existing singe houses, usually just next to the buildings. Nowadays, BHEs are placed below the buildings to be erected (in the construction pit, below the base plate). Another, useful solution are the “Energy Piles”. Ref. [2] describes them as follows: “Energy piles are foundation piles equipped with heat exchanger piping. The piles are installed in grounds with poor load-bearing properties. The energy piles use the ground beneath buildings as heat source or sink, according to the season. The systems need careful design, taking into account especially the spacing between the piles, the ground thermal properties, and possible static influence of temperature changes in the piles. Figure 19 shows installation and system sketch of energy piles”. A special application of energy piles was realized at Zurich airport; the main characteristics are summarized in Figure 20.

4.5. Large GHP Systems

GHPs were first installed for single-family houses. Then, multi-family buildings, smaller enterprises, etc., followed. This trend has expanded more and more; currently, large complexes are supplied by correspondingly larger GHP systems. The increasing complexity requires more sophisticated design.
Figure 21 shows a large urban GHP system realization, the Richti-Areal in Wallisellen, next to Zurich city, with eight complexes with internal courtyards. The large buildings accommodate many facilities that people need and use in cities. The figure indicates the supplied varieties, along with the covered heating and cooling loads, as well as the number and length of the BHEs.
The city of Zurich itself also has a large and strongly increasing number of GHP systems. Figure 22 depicts the kind and distribution of GHP systems in the Zurich area. Their total number in August 2016 was over 2600. Since then, the number has increased so much that the symbols (red: heating; blue: heating and cooling) cannot be plotted. The GHP units are located at the valley flanks of the Limmat river; (flowing from the bottom left into the Lake of Zurich on the top). The valley bottom is flat and consistent to some depth of loose Quaternary sediments (mainly gravels). Their groundwater is protected, correspondingly without GHP systems. The size of the symbols is indicative of the system size. The largest blue symbols are on the bottom left; these symbolize the very substantial installation at the Hönggerberg campus of the ETH Zurich.
The campus accommodates a great number of buildings for education, laboratories, services, and some (mainly student) accommodation. The basic elements of the heating, cooling, and service water-supplying system, as shown in Figure 23, are the BHE blocks; the total BHE number was 434 in 2019, and the rest (330) were subsequently installed. The various units shown are assembled in a distributer network, which allows balancing between the various buildings. For the time being, this is by far the largest GHP installation in Switzerland. Currently, an extension to serve a floor-space of 15,000 m2 is being planned and will be soon implemented.
The remarkable GHP distribution and growth in Switzerland is facilitated by various factors. First, there exist various supportive legislative conditions, such as engineering norms, to be followed in GHP system design (SIA Norm 384/6 2010—Ground-coupled heat pumps, SIA Norm 384/7 2015—Groundwater-based heat pumps). Then, there exist guidelines regarding obtaining permissions from regulating authorities. Lastly, significant measures exist in subsidizing new GHP installations by local administrations (for details, read in Section 4.7).

4.6. Environmental Benefits

Global warming is a fact; it endangers environmental living conditions as well as the global economy. Ref. [28] clearly states: “It is widely recognized that the most probable cause of climatic warming is the increasing content of greenhouse gases (fore-mostly CO2) in the atmosphere. Any reduction of CO2 emissions can thus contribute to the attempts undertaken in order to mitigate the effects of global warming. Since buildings with their supply-systems (especially in moderate and cold climate) are key CO2 producers, the reduction or at least avoidance of further emission by buildings is a basic goal.Therefore, new solutions and technologies are urgently needed; technologies which operate CO2-free or at least CO2-poor. For the building sector, especially for space heating, cooling, domestic hot water production, GHPs provide such a technology. GHP systems have the great advantage that they can replace fossil-fired systems. GHP installations need no fossil fuel, do not use combustion processes to generate heat, and thus produce no air polluting substances. This is the environmental advantage of GHP systems”.
No burning means “saving” fossil fuels and the corresponding CO2 emissions. However, one should not fall into the trap of thinking that it would also mean CO2 emission reduction; it only avoids additional emissions. It must be emphasized that new GHP installations do not provide any emission reduction—unless they replace old, fossil-fueled systems. More details can be found in [28,29].
The Swiss authorities increasingly stress replacing (“refurbishing”). The replacing can be subsidized by local authorities, or at least the replacement costs are tax-deducible. Currently, the replacement of fossil-fueled systems is being documented, as seen in Figure 24. The figure summarizes the Swiss BHE drilling activities for GHPs; the drilled borehole meters, year by year. These are not cumulative drill-meters; the columns show the drilled meters in the indicated years. In Switzerland, over the last few years, over 300,000 m boreholes were produced. This translates to 300, 1 km deep boreholes every year. A significant, increasing portion of the drillings were conducted for refurbishing; and refurbishing leads to CO2 emission reduction.
Overall, it must be considered that GHPs are electricity consumers; in this, it is essential to consider the source of electricity. Ideally, the needed current should originate from renewable sources, e.g., local solar PV panels. In reality, the required electricity comes from local outlets of the electric grid. That network usually carries a mix of various origins and generators. Decisively, CO2 emissions originate from certain types of electricity generation. Hydropower will generate much less CO2 per produced kWh than fossil-fueled power plants. This is reflected in a given country’s CO2 emissions from inland electricity generation. CO2 emissions can greatly depend on the country’s main generation technology; hydroelectric power generation produces much less CO2 than coal-based power plants.
The national values (in g CO2 per generated kWh) can greatly vary from country to country. Globally in 2020, Lesotho with 20.0 g CO2/kWh had the lowest number, while Botswana had the highest with 800.0 g/kWh (according to [30]). Usually, a country’s grid has a mixture of domestic and imported electricity. Switzerland is part of the European Network of Transmission System Operators for Electricity UCTE. Switzerland imports electricity from Poland (647.3 g CO2/kWh in 2020). Switzerland had a low amount, 55.2 g/kWh, in 2020 (58.1% of its generated electricity originates from hydropower). The global average in 2020 was 442.4 g/kWh.

4.7. Regulations, Licensing, Financial Support

Numerous regulations govern Swiss GHP development; these need to be strictly followed. For example, the Water Protection Law (“Gewässerschutzgesetz, GSchG”) also includes the subsurface waters (groundwater, deeper aquifers) and their protection. Based on the GSchG, GHPs installations are not permitted in groundwater protection zones, in zones of high hydraulic conductivity (karstified, fractured), and in landslide zones. Local and regional authorities, especially those responsible for groundwater, as well as for licensing GHP installations, routinely register information regarding approved new BHE placements. These are marked on continuously updated maps, which are accessible to the public on the internet. Figure 25 shows an example of mapped BHE locations within the community of Zumikon, near Zurich, together with the local water protection zones where BHE installations are restricted or even prohibited.
GHPs installations need authority permits, assigned by the cantonal authorities. A very useful aid in preparing applications (filling forms, giving technical details, etc.) are available in an extensive guideline of the Swiss Federal Office for the Environment FOEN), in German: “Wärmenutzung aus Boden und Untergrund” (2008) [31]. It contains all the forms to be filled out, and gives instruction on how to complete and submit them. Based on the applications, the authorities assign the necessary permits and inform the applicant about obligations, controls, etc. Numerous Swiss legislative bases of several authorities, as well as various financial support measures, are described in [25].
In previous years, various subventions were made available for new GHP installations (these had substantial differences from canton to canton. Today, a general Swiss Federal policy is in power to reduce CO2 emissions by buildings, as a measure against Global Warming, by replacing fossil-fired systems with heat pumps. Furthermore, other special supporting measures and investments in refurbishing are tax-deducible.
Finally, a new special system of realizing GHP installations needs to be mentioned: the electricity supplying utilities of the canton Zurich and of the City Zurich, EKZ and EWZ, offer “Energy Contracting”. In such an arrangement, EKZ or EWZ installs, operates, and maintains the GHP systems and issues monthly invoices to the building(s) owner. The installations remain the property of the utilities. Some Swiss house owners do not like foreign devices in their property; in such cases, they can buy the equipment after ten years.

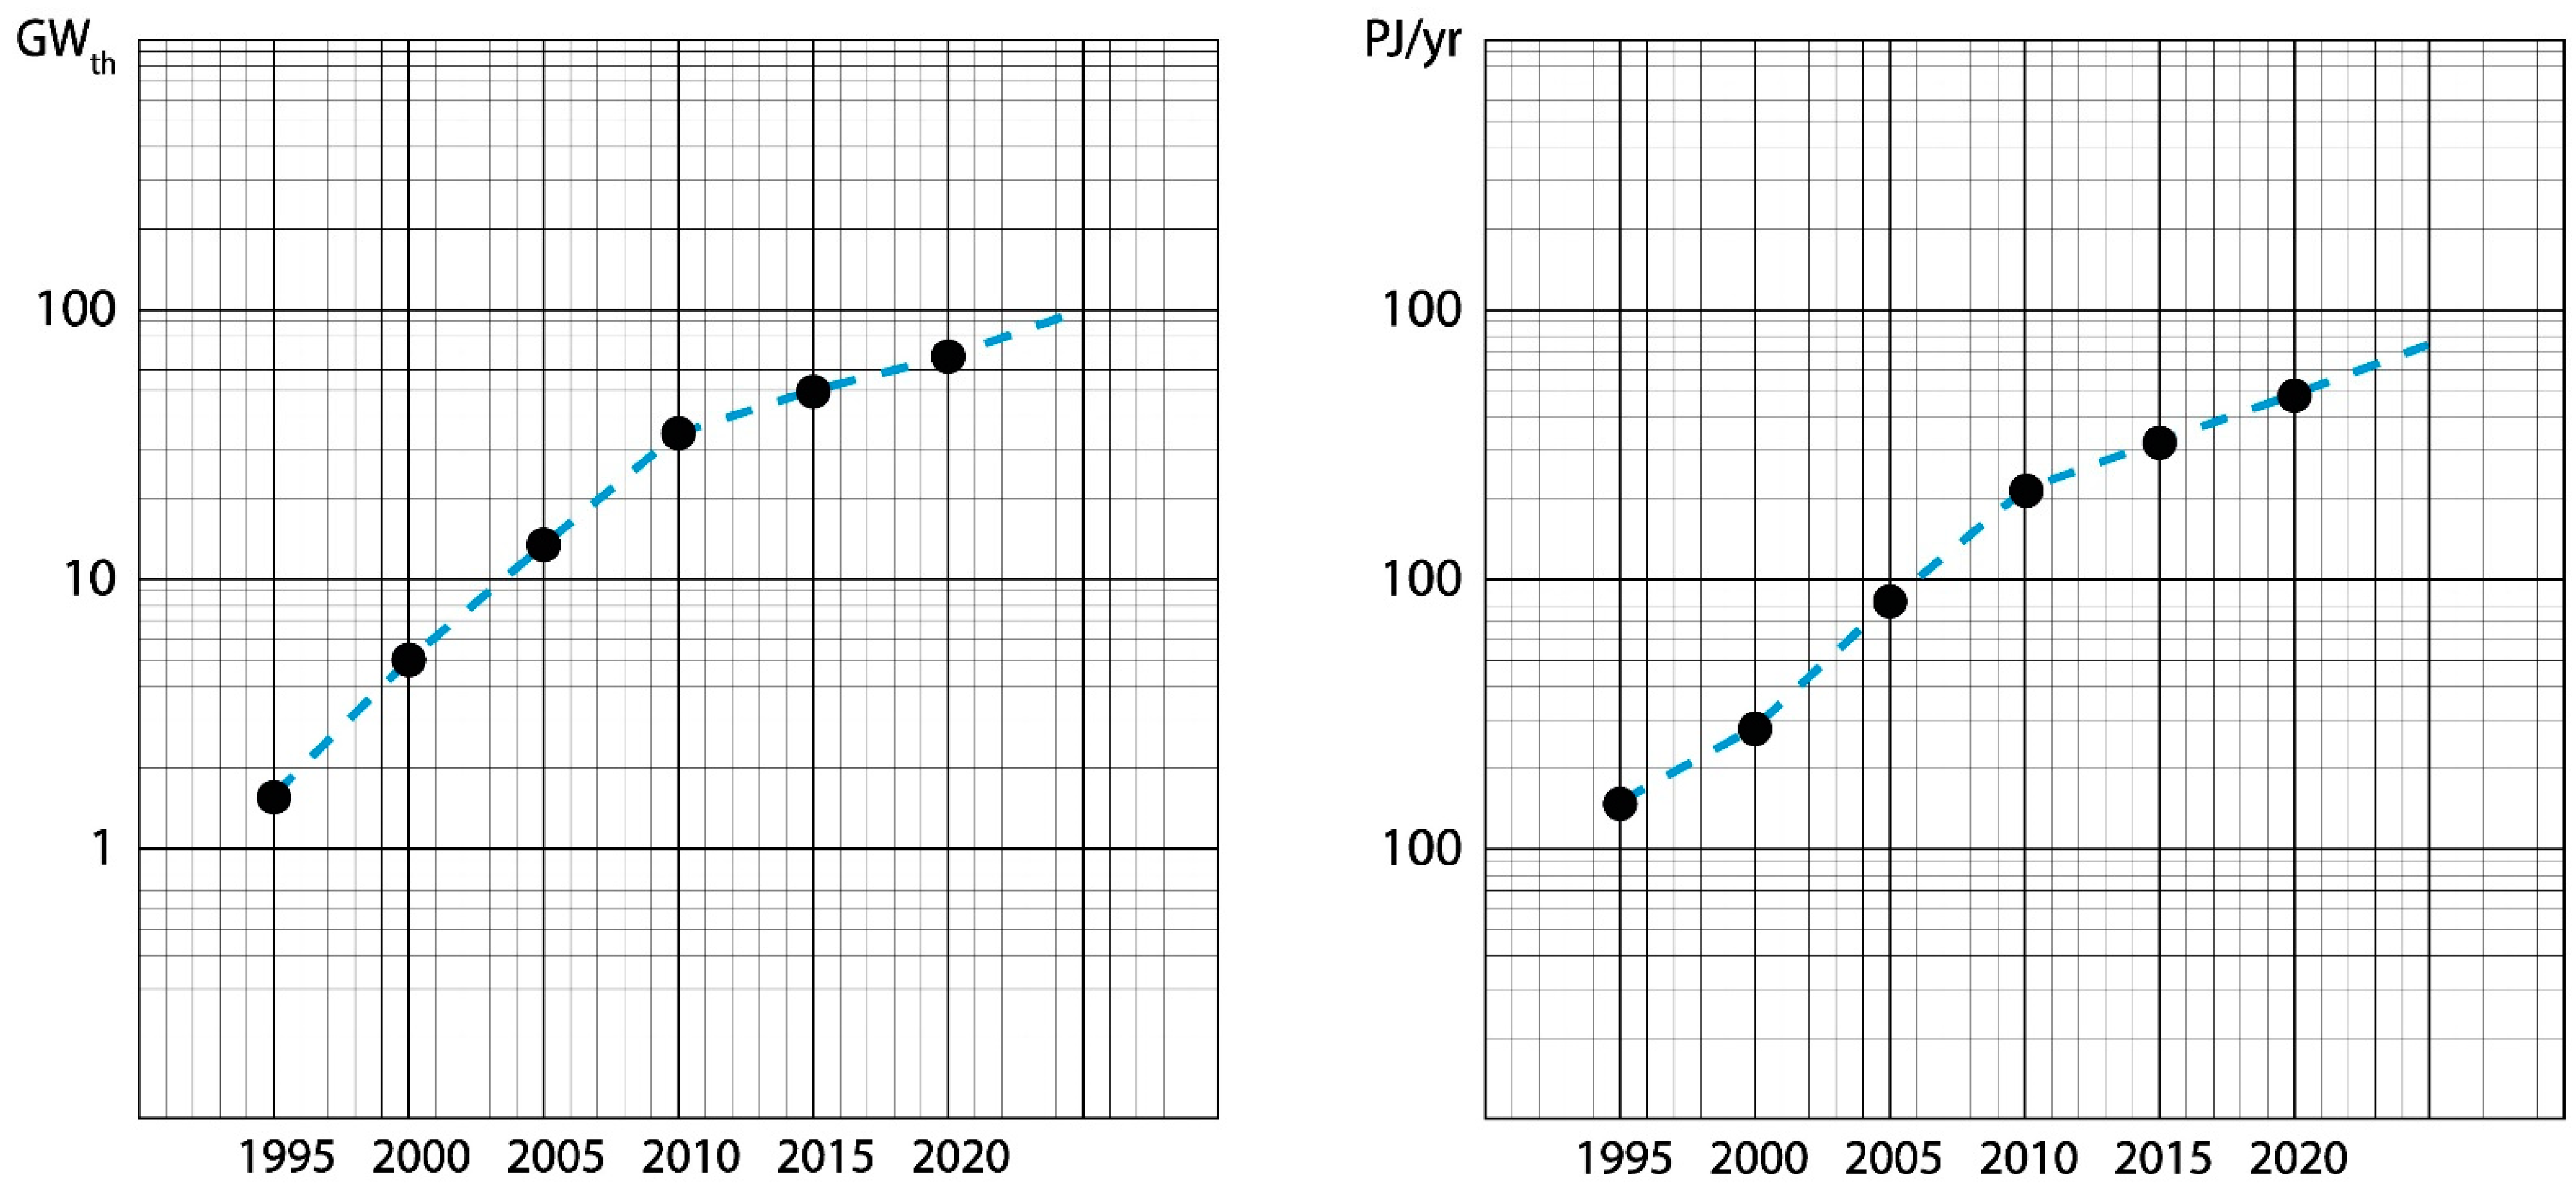
4.8. International Status and Ranking

In GHP systems application, Switzerland has achieved high international status and recognition. To prove this, a quantitative comparison between countries is necessary. Such a study of GHP was first elaborated in 2004 on a global scale (32 countries reported data about operating GHPs). For comparison, a ranking was designed in the following disciplines: installed capacity per area (W/km2); installed capacity per capita (W/capita); energy per area (GJ/yr, km2); energy per capita (GJ/yr, capita); and GHP units per area (12 kW equivalent units/km2). The comparison and ranking procedures are described in detail in [32]. The results are shown in Table 1. To highlight the results, a competition with medal-symbolized participants was performed, which yielded the following medalists (out of the 32 countries):
1st rank (“Gold“): Sweden and Denmark 3×, USA 1×;
2nd rank (“Silver“): Switzerland 2×; Denmark, Norway, Sweden, and USA 1×;
3rd rank (“Bronze“): Sweden and Switzerland 2×; China and Norway 1×.
Later, more countries embarked on GHP applications. In 2016, a ranking comparison of 17 European countries was performed. These were: installed capacity per country area (W/km2); installed capacity per capita (W/capita); annually produced heat per country area (GJ/yr, km2); and annually produced heat per capita (GJ/yr, capita). The ranking orders and the numbers of the medalist countries are given in Table 2 and Table 3. For details, see [33].
The latest, global GHP ranking was performed for the World Geothermal Congress in 2020 ([3]); a quote from [3] states the following: “The “top five” in terms of land area for installed capacity (MWt/area) are Switzerland, Netherlands, Iceland, Sweden and Austria; and in terms of annual energy use (TJ/yr/area) the leaders are: Switzerland, Iceland, Sweden, Hungary and Austria”.
According to this international ranking, Switzerland is one of the global leaders in GHP development.

5. Conclusions and Outlook

Installation and use of GHP systems are rapidly and globally advancing; currently one of the fastest growing applications of renewable energy technologies. GHP applications in Switzerland started in the 1970s, although pioneering heat pump installations (still operating on river waters in Zurich city) originate from the 1940s. For widespread market introduction of GHPs, their reliable operation, and also in the long term, had to be proven to be science-based. Fortunately, a well-planned and financed study, performed at a “field laboratory”, delivered the necessary proof. In a single-family house, heated by a single 100 m long BHE, the necessary instrumentation was installed to measure and register all the operational data, as well as the effects of the heat extraction in the BHE surroundings over years.
The key results prove that the GHP operation is fully reliable and its production sustainable over many years. With the measured data, numerical model simulations were calibrated. They enabled operational predictions and anticipations of their effect decades ahead. This also enabled a general insight into the behavior of shallow geothermal resources. During production, ground temperatures decreased, but, after production stops, they increased through regeneration; regeneration takes place at the same speed as the decrease. In other words, geothermal resources regrow, like biomass. This finding can be generalized and is also valid in hydrothermal resources.
After market introduction, rapid, nearly exponential growth of GHP applications started in Switzerland; a veritable Swiss success story. The number of installations and their size correspondingly grew, and the installation cost decreased. The drilled meters for BHEs are today around 300,000 m per year. New GHP installations avoid additional CO2 emissions; only the replacement of existing fossil-fired systems by GHPs can reduce CO2 emissions. Large installations with several hundred BHEs, as well as combined space heating and cooling, are steadily spreading. Various financial supporting measures foster GHP applications. In 2020, GHPs delivered 3280 GWh of heat to customers, which is over 85% of Swiss geothermal direct uses (among others like thermal spas, district heating).
Over the coming years, the rapid and substantial rise in oil and gas prices will certainly be a strong incentive to install more GHPs (although the electricity consumption of the HP compressor will also cost more). Ongoing global warming will cause an increase in combined heating and cooling with GHPs instead of heating alone. Global warming (besides the heat island effect in cities) increases the ground temperature of the top 200 m of the subsurface. This additional heat is beneficial. Due to the heat surplus, BHE meters can be saved for GHP installations. Energy contracting might also increase in other countries. Larger GHP installations, supplying numerous buildings, will also increase.
In general, GHPs have a bright future ahead, especially in Switzerland. The Swiss GHP success story will certainly continue, as well as the global status and recognition of the country in this key geothermal technology.

Funding

This research received no external funding.

Data Availability Statement

Data sources are indicated in the text.

Acknowledgments

Great thanks are due to three anonymous reviewers for their supportive, constructive and detailed comments and suggestions.

Conflicts of Interest

The author declares no conflict of interest.

References

  1. Rybach, L. Global Status, Development and Prospects of Shallow and Deep Geothermal Energy. Int. J. Terr. Heat Flow Appl. Geotherm. 2022, 5, 20–25. [Google Scholar] [CrossRef]
  2. Rybach, L. Shallow Systems—Geothermal Heat Pumps. In Comprehensive Renewable Energy, 2nd ed.; Letcher, T.M., Ed.; Elsevier: Oxford, UK, 2022; pp. 197–219. [Google Scholar]
  3. Lund, J.; Toth, A. Direct Utilization of Geothermal Energy 2020 Worldwide Review. In Proceedings of the World Geothermal Congress 2020+, Reykjavik, Iceland, 24–27 October 2021. [Google Scholar]
  4. Eugster, W.J. Erdwärmesonden Funktionsweise und Wechselwirkung mit dem geologischen Untergrund—Feldmessungen und Modellsimulation. Ph.D. Thesis, ETH Zurich, Zurich, Switzerland, 7 February 1991. [Google Scholar]
  5. Gilby, D.J.; Hopkirk, R.J. MC Trad-2D, A Multiple Coordate Computer Code for Calculation of Transport by Diffusion in Two Dimension; Nagra Technische Berichte NTB 85-37; Nagra: Baden, Switzerland, 1985. [Google Scholar]
  6. Rybach, L.; Eugster, W.J. Reliable long term performance of BHE systems and market penetration—The Swiss success story. In Proceedings of the 2nd Stockton International Geothermal Conference, Stockton, PA, USA, 16–18 March 1998; pp. 41–57. [Google Scholar]
  7. Rybach, L.; Eugster, W.J.; Hopkirk, R.J.; Kaelin, B. Borehole Heat Exchangers: Longterm Operational Characteristics of a Decentral Heating System. Geothermics 1992, 21, 861–867. [Google Scholar] [CrossRef]
  8. Rybach, L.; Eugster, W.J. Sustainability Aspects of Geothermal Heat Pumps. In Proceedings of the 27th Workshop on Geothermal Reservoir Engineering, Stanford University, Stanford, CA, USA, 28–30 January 2002. [Google Scholar]
  9. Rybach, L.; Eugster, W.J. Sustainability aspects of geothermal heat pump operation, with experience from Switzerland. Geothermics 2010, 39, 365–369. [Google Scholar] [CrossRef]
  10. Pollack, H.N.; Hurter, S.J.; Johnson, J.R. Heat flow from the Earth’s interior: Analysis of the global data set. Rev. Geophys. 1993, 31, 267–280. [Google Scholar] [CrossRef]
  11. Uyeda, S. Handbook of Terrestrial Heat Flow Density Determination; Haenel, R., Rybach, L., Stegena, L., Eds.; Kluver Academic Publishers: Dordrecht, Holland, 1986; p. 320. [Google Scholar]
  12. Rybach, L.; Sanner, B. Ground-Source Heat Pump Systems—The European Experience. GHC Bull 2000, 21, 16–26. [Google Scholar]
  13. Rybach, L.; Mégel, T.; Eugster, W.J. At what timescale are geothermal resources renewable? In Proceedings of the World Geothermal Congress 2000, Kyushu-Tohoku, Japan, 28 May–10 June 2000. [Google Scholar]
  14. Rybach, L. Geothermal energy: Sustainability and the environment. Geothermics 2003, 32, 463–470. [Google Scholar] [CrossRef]
  15. Signorelli, S.; Kohl, T.; Rybach, L. Sustainability of Production from Borehole Heat Exchanger Fields. In Proceedings of the World Geothermal Congress 2005, Antalya, Turkey, 24–29 April 2005. [Google Scholar]
  16. Rybach, L.; Kohl, T. Geothermal Energy and a Future Earth. In Global Change and Future Earth: The Geodetic and Geophysical Perspective; Beer, T., Li, J., Alverson, K., Eds.; Cambridge University Press: Cambridge, UK, 2018; pp. 364–376. [Google Scholar]
  17. Axelsson, G.; Rybach, L.; Júlíusson, G. Sustainable Management of Geothermal Production. In Proceedings of the World Geothermal Congress 2020, Reykjavik, Iceland, 26 April–2 May 2021; 13p. [Google Scholar]
  18. Rybach, L. Geothermal Sustainability or Heat Mining? Int. J. Terr. Heat Flow Appl. Geotherm. 2021, 4, 15–25. [Google Scholar] [CrossRef]
  19. Zogg, M. History of Heat Pumps—Swiss Contributions and International Milestones. Swiss Federal Office of Energy SFOE. Available online: https://heatpumpingtechnologies.org (accessed on 5 March 2010).
  20. Hopkirk, R.J.; Rybach, L. Erdwärmesonden für Raumheizungen; Neue Zürcher Zeitung, Beilage “Forschung und Technik”; Neue Zürcher Zeitung: Zürich, Switzerland, 1986; p. Nr. 71. [Google Scholar]
  21. Hopkirk, R.J.; Rybach, L. Erdwärmesonden für Raumheizungen. Schweizer Baublatt 1986, 87, 40–44. [Google Scholar]
  22. Hopkirk, R.J.; Rybach, L. Die Wirkungsweise von Erdwärmesonden. Architektur und Technik 1986, 9, 34. [Google Scholar]
  23. Rybach, L.; Signorelli, S.; Salton, M. Geothermie-Statistik Schweiz 1990–1999, Report to the Swiss Federal Office of Energy SFOE; Project Nr. 24843; Swiss Federal Office of Energy: Bern, Switzerland, 1999. [Google Scholar]
  24. Link, K.; Wyss, R. GmbH Deutschland. In Handbuch Oberflächennahe Geothermie; Bauer, M., Freeden, W., Jacobi, H., Neu, T., Eds.; Springer: Berlin, Germany, 2018. [Google Scholar]
  25. Link, K. Statistik der geothermischen Nutzung in der Schweiz—Ausgabe 2020. 2020. Available online: www.energieschweiz.ch (accessed on 3 May 2021).
  26. Dörig, L. Statistik zur Entwicklung von Erdwärmesonden in der Schweiz 1980–2017; ZHAW School of Management at Law: Winterthur, Switzerland, 2019; Available online: https://www.zhaw.ch/en/sml/ (accessed on 15 January 2020).
  27. Stärk, K. Umrüstung von alten Erdwärmesondenanlagen auf moderne Wärmepumpen. In Proceedings of the “Der Erdwärmekongress”, Karlsruhe, Germany, 11–13 November 2009; Geothermische Vereinigung: Geeste, Germany, 2009. [Google Scholar]
  28. Rybach, L. CO2 emission savings by using heat pumps in Europe. In Proceedings of the United Nations University Workshop for Decision Makers on Direct Heating Use of Geothermal Resources in Asia, Tianjin, China, 11–18 May 2008; pp. 355–361. [Google Scholar]
  29. Rybach, L. CO2 emission mitigation by geothermal development—Especially with geothermal heat pumps. In Proceedings of the World Geothermal Congress 2010, Nusa Dua, Bali, Indonesia, 25–30 April 2010. [Google Scholar]
  30. EMBER Global Electricity Review 2022—Global CO2 Emissions by Electricity Generation. Available online: https://ember-climate.org/insights/research/global-electricity-review-2022/ (accessed on 16 August 2022).
  31. Wärmenutzung aus Boden und Untergrund, FOEN. 2008. Available online: www.umwelt-schweiz.ch/publikationen (accessed on 31 May 2020).
  32. Rybach, L. The advance of geothermal heat pumps worldwide. IEA Heat Pump Cent. Newsl. 2005, 23, 13–18. [Google Scholar]
  33. Rybach, L.; Sanner, B. Geothermal Heat Pump Development Trends and Achievements in Europe. In Perspectives for Geothermal Energy in Europe; Bertani, R., Ed.; World Scientific Publishing Europe Ltd.: London, UK, 2017; pp. 215–253. [Google Scholar]
Figure 1. (Left) Worldwide installed capacity (GWt) of geothermal heat pumps. Annual growth rate 1995–2010 19.4%, and 2010–2020 8.5%. Data from [3] are plotted. (Right) Worldwide use for heating (PJ/year) of geothermal heat pumps. Annual growth rate 1995–2010 17.4%, and 2010–2020 11.0%. Data from [3] are plotted.
Energies 15 07870 g001
Figure 2. Various global geothermal direct uses in 2020. Data from [3] are plotted.
Energies 15 07870 g002
Figure 3. Measurement instrumentation setup at the GHP test facility at Elgg, with its 38 sensors. Outside: The two 105 m deep boreholes MS1 and MS2, each with ten temperature sensors (GT); the 1–m deep borehole MS3 with five sensors; the meteo-station with air-temperature sensors (AT). Inside: Basement: flowrate-meters (FM), flow-temperature meters (WT). Inside rooms: Various temperature sensors. Blue line left above HP and into BHE: heat carrier flow into BHE, red line: heat carrier flow from BHE into HP. Red line right above HP: heated fluid flow into space heating system, blue line: return flow. Dashed yellow line at 50 m depth marks the horizontal plane in which the model calculations in Section 2.2. were done. Data from [4] are plotted.
Energies 15 07870 g003
Figure 10. Measured and modeled ground temperature changes at a depth of 50 m and at a distance of 1 m from a 105 m long BHE during a production period and a recovery period of 30 years each. After 30 years of recovery the deficit (∆T) is marginal. The speed/duration of recovery is about the speed/duration of production impact. Data from [9] are plotted.
Energies 15 07870 g010
Figure 11. Schematic illustration of the principle of geothermal heat extraction and production. Arrows indicate direction of heat flow. The left panel refers to a scheme without heat extraction: The isotherms are horizontal; the terrestrial heat escapes to the atmosphere (globally with 40 × 106 MWth). The right panel refers to a scheme where heat inflow replenishes the heat sink, created by the heat extraction. In this case, the isotherms are increasingly deformed and the heat flow lines are diverted towards the heat sink. Figure from [1], modified.
Energies 15 07870 g011
Figure 12. Calculated isotherms around a 105 m deep BHE during the coldest period of the heating season 1997 in Elgg/ZH, Switzerland. The radial heat flow in the BHE vicinity is around 3 W/m2. Data from [7] are plotted.
Energies 15 07870 g012
Figure 13. Measured temperature distribution in the ground at the beginning of the monitoring period (left, on 1.10.1986, after a total of ca. 2 h of test operation) and at the end of the first heating season (right, on 1.5.1987), at GHP test plant, Schwalbach, Germany. The narrow, cylindrical isotherm pattern represents strong heat inflow. The red arrow shows the maximum. Data from [12] are plotted. For details, see text.
Energies 15 07870 g013
Figure 14. Location of BHE systems in Switzerland in 1990, with a total of about 4000 heating units. Data from [8] are plotted. For details and further explanations see text.
Energies 15 07870 g014
Figure 15. Development of geothermal direct use in Switzerland: Nearly exponential growth of heat delivery over three decades (by about 8% per year). The growth is due to GHP systems only. Data from [25] are plotted.
Energies 15 07870 g015
Figure 16. GHP installation cost reduction over the years. From the FWS (Förderverein Wärmepumpen Schweiz) statistics website https://www.fws.ch/statistiken/ (accessed on 5 October 2005). For details, see text.
Energies 15 07870 g016
Figure 17. Average length of authorized BHEs in Canton Zurich. Data from [26] are plotted.
Energies 15 07870 g017
Figure 18. Stability of fluid temperatures from BFE during the time period from 1987 to 2009, for a single-family house, from data in [27]. Ts: temperature of return fluid from BHE. For details, see text.
Energies 15 07870 g018
Figure 19. Energy pile system sketch (left). (1) Energy piles; (2) connections; (3) distributor; (4) general connection; (5) central unit. Installation of heat exchanger pipes (right).
Energies 15 07870 g019
Figure 20. Zurich Airport, Midfield Terminal E. Details: 200,000 m3 construction space, 58,000 m2 energy supply area, 2120 MWh/a heating, 1240 MWh/a cooling load; 300 energy piles 30 m long. Construction from 1997 to 2001.
Energies 15 07870 g020
Figure 21. Large-scale urban development in Richti-Areal, Wallisellen near Zurich. Details: 72,000 m2 construction size, 1200 inhabitants, 2500 jobs, 35% habitation, 55% services, 10% business. ≈50 km BHEs (250 BHEs, 200 m deep). Costs: 500 Mio CHF. For details, see https://de.wikipedia.org/wiki/Richti-Areal (accessed on 13 May 2015).
Energies 15 07870 g021
Figure 22. Geothermal heat pump installations in Zurich City. A total of 1399 GHP installations with 2681 BHEs (August 2016). Orange: heating; blue: heating and cooling. Bottom left: Largest blue symbols at Campus Hoenggerberg, ETH Zurich; details are displayed in Figure 23. Source: Zurich City Administration.
Energies 15 07870 g022
Figure 23. The largest Swiss GHP system with BHEs, currently in Zurich. For details, see https://ethz.ch/en/the-eth-zurich/sustainability/campus/environment/energy/anergy-grid.html (accessed on 15 September 2018).
Energies 15 07870 g023
Figure 24. BHE meters drilled per year in Switzerland. From the FWS (Förderverein Wärmepumpen Schweiz) Statistics website https://www.fws.ch/statistiken/. Backfitting means replacing fossil-fired systems with GPHs. For further details, see text.
Energies 15 07870 g024
Figure 25. Details of the BHE map of Canton Zurich, Switzerland. Colored areas: Red, blue are groundwater protections zones A, B, respectively (no BHEs installable, yellow: BHEs possible, with restrictions). Green circles are BHEs (full: with geologic profile, empty: without). Red squares are groundwater wells, red circles: spring captures (the fuller the symbol, the higher the flow-rate) From http://www.erdsonden.zh.ch, accessed on 7 September 2022.
Energies 15 07870 g025
Table 1. Worldwide ranking results of geothermal heat pump utilization in 2004, from [32].
Capacity Installed
(MWt)
Energy Use
(TJ/yr)
Capacity per Area
(Wt/km2)
Capacity per Capita
(Wt/Capita)
Energy per Area
(TJ/yr per km2)
Energy per Capita
(GJ/yr per Capita)
Units per Area
(12 kW Equivalent Units per km2)
1. USA1. Sweden1. Denmark1. Sweden1. Denmark1. Sweden1. Denmark
2. Sweden2. USA2. Switzerland2. Denmark2. Sweden2. Norway2. Switzerland
3. Denmark3. China3. Sweden3. Norway3. Switzerland3. Switzerland3. Sweden
4. China4. Denmark4. The Netherlands4. Switzerland4. Austria4. Denmark4. The Netherlands
5. Switzerland5. Switzerland5. Austria5. Finland5. The Netherlands5. The Netherlands5. Austria
Table 2. Top five European countries in ranking order in 2016, from [33].
RankMWth
per Area
MWth
per Capita
TJ/yr
per Area
TJ/yr
per Capita
1.SwitzerlandSwedenSwitzerlandSweden
2.The NetherlandsNorwayThe NetherlandsFinland
3.SwedenFinlandSwedenNorway
4.AustriaSwitzerlandDenmarkSwitzerland
5.DenmarkAustriaAustriaDenmark
Table 3. Ranking European medalists in 2016, from [33].
CountryFirst Rank:
Gold
Second Rank:
Silver
Third Rank:
Bronze
Finland 11
Norway 11
Sweden2 2
Switzerland2
The Netherlands 2
Publisher’s Note: MDPI stays neutral with regard to jurisdictional claims in published maps and institutional affiliations.

