Article

Analyzing Optimal Battery Sizing in Microgrids Based on the Feature Selection and Machine Learning Approaches

by
Hajra Khan
1,†,
Imran Fareed Nizami
1,†,
Saeed Mian Qaisar
2,3,*,†,
Asad Waqar
1,*,†,
Moez Krichen
4 and
Abdulaziz Turki Almaktoom
5,*
1
Department of Electrical Engineering, Bahria University, Islamabad 44000, Pakistan
2
Electrical and Computer Engineering Department, Effat University, Jeddah 22332, Saudi Arabia
3
Communication and Signal Processing Lab, Energy and Technology Center, Effat University, Jeddah 22332, Saudi Arabia
4
Department of Information Technology, Faculty of Computer Science and Information Technology (FCSIT), Al-Baha University, Al-Baha 65528, Saudi Arabia
5
Supply Chain Management Department, Effat University, Jeddah 22332, Saudi Arabia
*
Authors to whom correspondence should be addressed.
These authors contributed equally to this work.
Energies 2022, 15(21), 7865; https://doi.org/10.3390/en15217865
Submission received: 2 September 2022 / Revised: 22 September 2022 / Accepted: 13 October 2022 / Published: 24 October 2022

Abstract

:
Microgrids are becoming popular nowadays because they provide clean, efficient, and lowcost energy. Microgrids require bulk storage capacity to use the stored energy in times of emergency or peak loads. Since microgrids are the future of renewable energy, the energy storage technology employed should be optimized to provide power balancing. Batteries play a variety of essential roles in daily life. They are used at peak hours and during a time of emergency. There are different types of batteries i.e., lithium-ion batteries, lead-acid batteries, etc. Optimal battery sizing of microgrids is a challenging problem that limits modern technologies such as electric vehicles, etc. Therefore, it is imperative to assess the optimal size of a battery for a particular system or microgrid according to its requirements. The optimal size of a battery can be assessed based on the different battery features such as battery life, battery throughput, battery autonomy, etc. In this work, the mixed-integer linear programming (MILP) based newly generated dataset is studied for computing the optimal size of the battery for microgrids in terms of the battery autonomy. In the considered dataset, each instance is composed of 40 attributes of the battery. Furthermore, the Support Vector Regression (SVR) model is used to predict the battery autonomy. The capability of input features to predict the battery autonomy is of importance for the SVR model. Therefore, in this work, the relevant features are selected utilizing the feature selection algorithms. The performance of six best-performing feature selection algorithms is analyzed and compared. The experimental results show that the feature selection algorithms improve the performance of the proposed methodology. The Ranker Search algorithm with SVR attains the highest performance with a Spearman’s rank-ordered correlation constant of 0.9756, linear correlation constant of 0.9452, Kendall correlation constant of 0.8488, and root mean squared error of 0.0525.

1. Introduction

1.1. Background

Microgrids refer to a generation-mix of two or more micro-power sources feeding a local load. They can operate in both grid-connected and isolated modes. In both modes, instant balancing power is certainly required from additional sources like Batteries. In grid-connected mode, while the utility grid supplies the load in sharing with micro-power sources, and it also provides the charging power to the batteries, which could later be used for power balancing during isolated mode. The majority here points out how much the actual size of batteries should be to run the complete microgrid sustainably. In this context, the optimal battery sizing is a worthy problem to work on [1].
The conventional energy systems such as fossil fuels being used are causing environmental pollution and depletion of fossil fuels. Due to the increase in demand for electricity, there is a need for a new energy distribution systems such as batteries. Microgrids can supply load and provide backup when the main supply is insufficient with improved power quality. The different modes of operating in a microgrid use energy storage systems to meet the intermittent nature of load demand.
Battery sizing directly deals with the frame of total cost in a microgrid. The goal is to minimize the size of the battery and regulate the constraints such as voltage, reliability, and frequency to maintain the performance of the microgrid with a much smaller battery bank. For developing an energy storage system in a microgrid, the high cost of batteries is another key limiting factor [2]. Battery sizing should be considered to make the energy storage system economical and affordable to any consumer. Since the role of batteries in daily life is growing, importance is given to develop highly efficient and cost-effective storage devices. Optimal battery sizing would require taking non-invasive measurements of the battery in real time and analyzing the results [3].
Many techniques that aim to assess the optimal size of a battery have been proposed in the literature. Most of these techniques are heuristic-based. In [4], a multiobjective particle swarm optimization algorithm has been used to optimize the battery size using the lifetime of the battery bank parameter, but this method does not follow a data-driven based approach. A bi-level optimization problem based on the Karush–Kuhn–Tucker is proposed in [5] for optimal battery sizing using binary particle swarm optimization. This method is also not based on data-driven techniques. In [6], a multiple-cost function modeling is performed to optimize the power flow in the non-interconnected zone in Columbia. The flexibility of the proposed method is performed using three network topologies. In [7], a multiobjective slap swarm optimization algorithm is used to optimize the integration of hybrid renewable energy sources in a microgrid.

1.2. Research Problem Statement

The customer’s primary issue with installing batteries is the high cost, where batteries produced by LG Cam, Tesla, and Trojan are the most well-known battery manufacturers, and they have prices ranging between $148 to $158 per kWh. Batteries are more expensive in comparison to distributed generation market demand models (DGENs), but they have a faster response time when it comes to balancing. This offers a scenario for optimal battery sizing in microgrids, where renewable energy (RE) penetration is higher than in traditional grids. As a result, in most cases, a compromised joint venture of batteries and DGENs is used. Although machine learning-based techniques have been proposed earlier yet, to the best of the authors’ knowledge, no suitable datasets are available for studying the problem of battery sizing in microgrids. Moreover, there is still room for improvement in the performance of the machine learning based techniques, used to predict the optimal battery size. Furthermore, the selection of relevant features for the prediction of optimal battery size is imperative for optimal prediction of battery size. The proposed methodology uses a new MILP based generated dataset which is suitable for studying the problem of battery sizing in microgrids. The robust feature selection algorithms are employed for mining the most relevant features, from the considered dataset. Onward, the selected feature sets are processed with the SVR model for predicting the optimal battery size.

1.3. Related Works

Many studies have previously been investigated related to optimal battery sizing in microgrids. Some of them have utilized the concept of MILP-based optimization techniques. In addition, most researchers have introduced the concept of heuristic techniques for the same problem. Certain researchers have been seen to involve the data-driven approach in battery sizing. The detailed literature survey is as follows:
The Techno-Economic Method for the optimization of the annual demand forecast and the use of HOMER Pro allowed the researchers to analyze the advantages of renewable systems as compared to conventional grid application [8]. The drawback of this work is that it does not include future data and is only valid for one-year data of the plant at a rural site. The pattern search technique for the optimization of the RE hybrid system is done with the MATLAB Simulink Design Optimization with the help following algorithms Latin Hypercube, GA, and Nelder–Mead. It was observed with the help of HOMER Pro software that, following the Nelder–Mead Algorithm, decreases the optimal penetration of DG. The energy consumption and the demand with time are not analyzed in detail. The long-term demand forecasting and the habits of consumption are not analyzed.
The sizing and allocation of the BESS storage system in a microgrid help in regulating the parameters of a microgrid. The PSCAD Grid Modelling Software is proposed by Jagdesh Kumar in his research, where he used the software efficiently to predict the sizing constraints of BESS in isolated Renewable Plants [9]. The sizing characteristics of the battery bank were also analyzed with the help of simulations in MATLAB. The drawback of this work is that the battery aging phenomenon which can be considered along with designing strategies of BESS for future research is not considered. Hannan proposed methods and algorithms based on the filter-based battery sizing method, the Discrete Fourier transformbased ESS sizing method, and the Multiperiod decision-making model for optimum sizing. Grey Wolf’s optimization algorithm and swarm optimization technique helped in achieving optimization and sizing BESS. The model predictive control algorithm is also considered by Hannan to address and explore the optimum sizing of BESS [10]. The work proposes battery sizing for the efficient and cost-effective functionality of microgrids. El-Bidari proposed the Grey Wolf optimizer approach for optimal battery sizing and regulating the constraints in a microgrid by reducing the battery size [11]. The Optimizer approach along with the GWO algorithm is used as an efficient tool for battery sizing. GWO provided a high level of robustness and a meta-heuristic algorithm to deal with the issue of frequency deviation. Digsilent/POWERFACTORY software is used as a tool for simulation.
Yang et al. addressed the problem of battery sizing and fluctuations in the renewable systems by using sodium sulphur (NAS) batteries for size optimization and reducing the rate of fluctuations in the renewable system [12]. Yang also highlighted that Markov Decision Processes can no longer address this problem of BESS; therefore, there is a need for sensitivity-based optimization theory. An iterative optimization algorithm was developed. Although the research was a big step toward renewables stability, there is still room for many rapid and dynamic iterations to minimize the computational time of the system. Gao performed optimal battery sizing based on algorithmic approaches [13]. A model based on autoencoders and extreme learning machine is introduced for optimization of battery size. The work also addressed the use of a single-layer-feed-forward neural network and deep neural networks for optimization purposes. One drawback of the deep learning algorithm is that it requires a large amount of training data. For CNN and RNN models, this drawback of the deep learning algorithm may cause a decrease in training efficiency.
Boonluk in his work proposed GA and PSO for optimizing the size of the battery bank to be used. Fourier Coefficients were used to be processed in the algorithms and simulations were made accordingly on MATLAB and MATPOWER 7.0 [14]. It was also highlighted by Boonluk that the lifetime of each algorithm GA and PSO was the same i.e., 8.8 years. PSO in terms of objective function optimization was more efficient than GA. Talent et al. used the MILP and GAMS along with the CPLEX Algorithm for the sizing of the battery [15]. One drawback of the research is that it does not consider the temperature profile of the batteries for the calculation of panel efficiencies. Optimal Battery Sizing was done with the help of GA, PSO, and IEEE 30 Test System was used for the implementations for optimal BESS [16]. OpenDNS with COM interfaced by the integration of IEEE 30 Test System were used for optimization.
Gupta in his work proposed a technique for battery sizing where he designed a MATLAB algorithm where all the constraints regarding the comfort and need of the user are entered [17]. The sizing considerations are calculated, and the output is taken from the algorithm. Loss of Load Probability is also considered an important parameter. Higher reliability factors and economic benefits are considered to be important constraints for optimal battery sizing. In [18], a Genetic Algorithm (GA) was used for optimal sizing of the battery [18]. The main objectives of this research were to decrease the Net Present Cost (NPC) of the system and the consideration of the Equivalent Loss Factor for the index amount of reliability. In [19], convex programming, which is a mathematical optimization tool that helps in examining the problem of minimizing convex functions over convex sets, and is used to formulate co-optimization of battery size, energy management, and battery aging. The notion of battery modeling is explored; however, it had one flaw: the battery model was inaccurate, and it ignored critical elements such as state of charge, etc. Peiman Mirhoseini [20] has an MILP framework-based model to utilize and evaluate the operating and trading costs of a battery charging station, which increases the system’s reliability. However, because the model concentrates on installing a charging station as an MG and delivering clean electricity to meet its demands, dispatchable units (diesel generators, fuel cells, etc. are omitted.
Sampietro et al. [21] have studied the optimum sizing of batteries and supercapacitors in automobiles to achieve the lowest possible total cost. Dynamic programming is used to determine the best utilization of storage systems and fuel cells. This paper contributed to the investigation of the relationship between battery size and cost. The Terzimehic et al. [22] study is related to battery degradation, by using Support Vector Regression. The paper described how data-driven techniques can be used for battery forecasting. The author used data from various batteries operating at various temperatures and used that data to validate the machine learning results. Wu et al. [23] have researched the Feedforward neural network that is used to mimic the relationship between Remaining Useful Life and the charge curve because of its simplicity and effectiveness. The assessment of RUL for the battery under various charge current rates was neglected.
The operation plan entailed the Harmonious operation of fuel-powered generators and batteries, multi-unit DGen operation constraints, and reserve capacity to limit the number of hours the diesel generators are used. Sidra Kanwal et al. proposed [24] Linear Support Vector Regression and Rational Quadratic are used to train L-SVR, Gaussian Process Regression, and Rational Quadratic in this work. For qualitative examination of trained models, the RMSE is utilized as a critical performance metric. The basic design parameters of the battery are to be addressed to minimize the battery size to improve charge storage capacity in less space—thus making the model much more compact.
Jayashree proposed the approach of Mixed Integer Programming (Mathematical Models) and professional tools like MATLAB for BESS (Battery Energy Storage System) optimization [25]. Generic Algebraic Modelling System (GAMS) and CPLEX Optimization Studio were used in the domain of BESS in the research of Jayashree. Decision-making and multiple system simulations were considered the main part of the research to yield results and minimize the size of the battery by regulating the same criteria for a microgrid. Apart from the research done by Jayashree, there is still enough room available in this domain to use more efficient tools and come up with system optimization of BESS and explore multiple applications that include battery banks.
In support vector regression, integrated is used for photovoltaic renewable energy system’s ideal size by lowering the Annualized Cost of the System [26]. In terms of prediction accuracy, both hybrid SVR algorithms exceeded the single SVR method. Renewable energy resources should be used as much as feasible when generators are running. They also considered the unpredictability of wind speed and clearness index. Ahmed Elnozahy [27] proposed weather unpredictability, a probabilistic technique based on an artificial neural network is used. Complete eco-techno-economic optimization research is integrated with the established choices and strategy. The proposed model to use batteries instead of parallel generators in times of emergency reduces the overall pollution and number of emissions affiliated with the previous 13 models. The aim is to design a model which proves to help balance the system and can act as a backup power source in times of emergency. In [28], optimization of a large photovoltaic array for a single household has been performed while considering various environmental factors and different municipal rules. In [29], a genetic algorithm-based approach is used to assess the optimal size of a battery in an unbalanced distribution system.

1.4. Contribution

The traditional way of calculating battery size is by using battery autonomy. Battery autonomy is based on the energy provided by the battery in the given time interval. Since data are required for the computation of battery autonomy, it makes sense to utilize datadriven techniques to compute the battery size. Data-driven techniques are becoming popular because they are flexible and incremental i.e., the battery size prediction model can be updated with new data. Data-driven techniques employ data from a microgrid’s home load to automatically compute the battery size. The solution involves taking noninvasive measurements of the battery in real-time and combining these readings with regression-based machine learning algorithms to provide an accurate estimate of battery size without the use of any physical mechanism. A full dataset is utilized as an input to generate correct estimations by employing the essential variables and applying machine learning techniques. The proposed methodology can help in computing the optimal size of the battery for cost-effective implementation and a reliable microgrid battery system that can provide backup for a longer period.
To the best of the authors’ knowledge, there is no publicly available dataset for assessing the optimal battery size in microgrids. Furthermore, the feature selection for selecting the most relevant attributes for assessing the optimal battery size in microgrids in a machine learning based-technique is not explored in a manner as presented in this study. The major contributions of this work are:
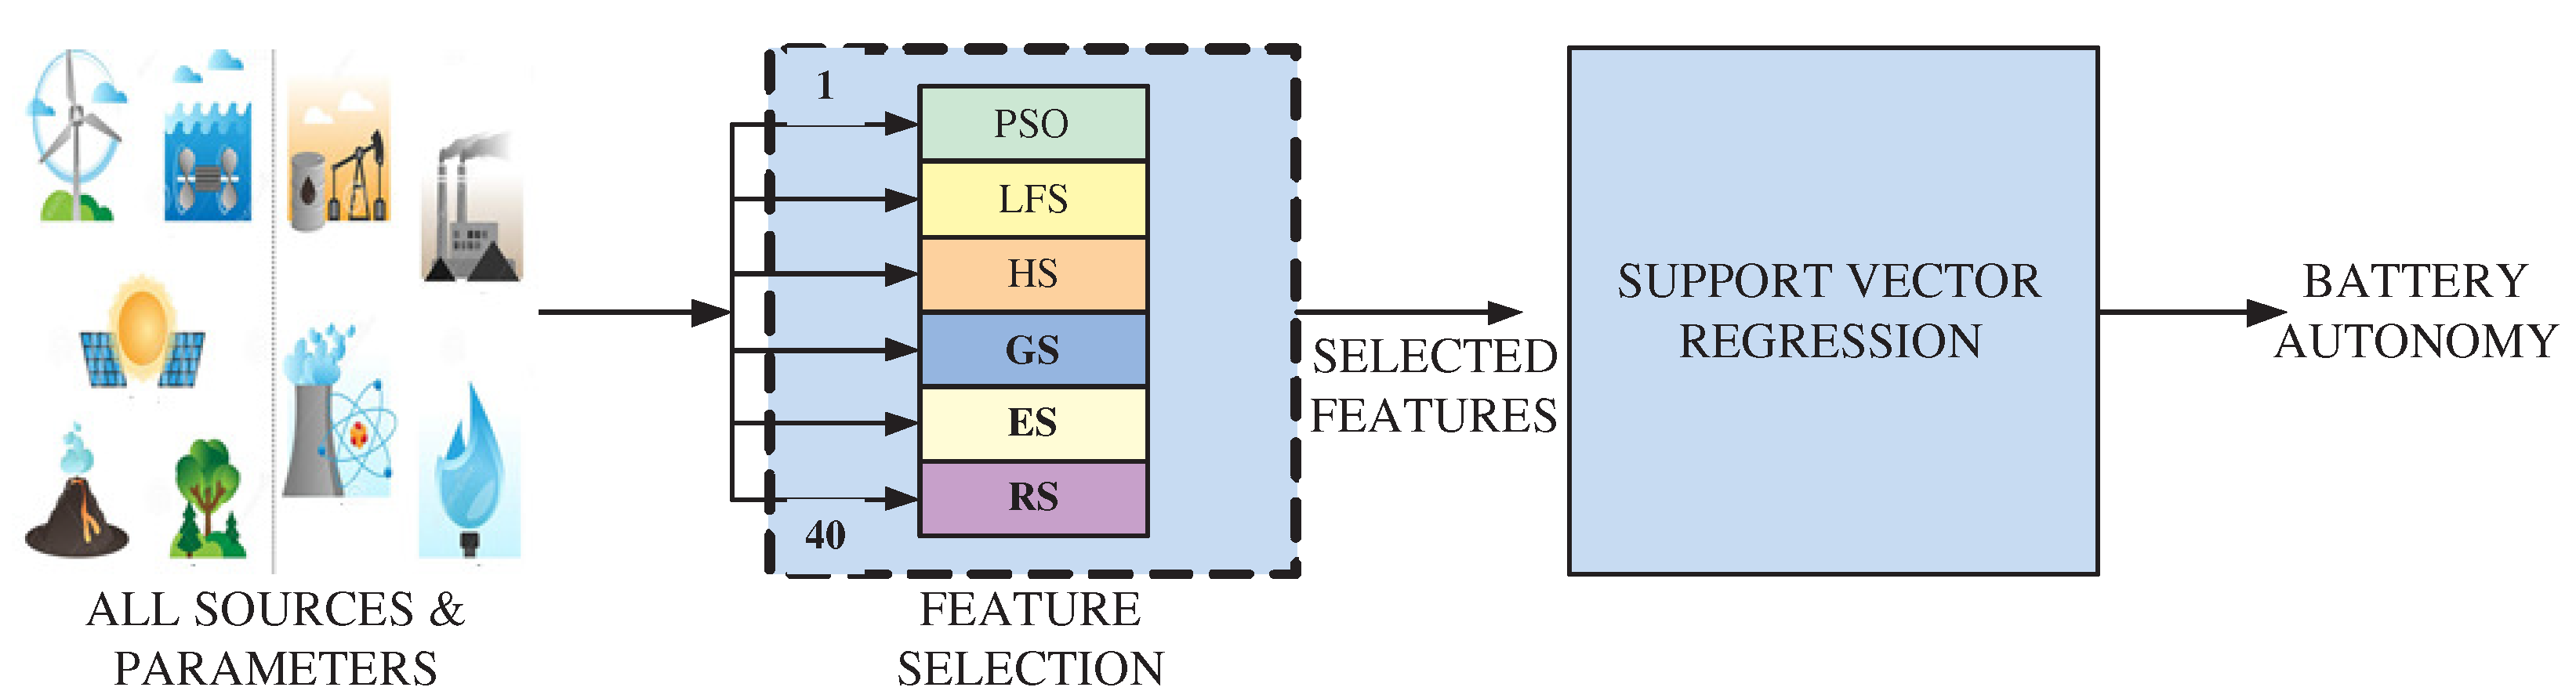
  • A dataset for the residential load of a microgrid with 24,000 instances and 40 attributes per instance is generated using the mixed integer linear programming (MILP) technique. It permits to assess the optimal battery size in microgrids.
  • The robust feature selection algorithms are utilized to identify the attributes that are more relevant and have a higher impact on assessing the optimal battery sizing in microgrids.
  • A machine learning-based approach is used to process the selected features sets for an automated decision of the optimal battery sizing in microgrids.
The remainder of the paper is structured as follows: Section 2 describes the MILP technique and how the dataset is formulated. Section 3 describes the proposed feature selection-based methodology for predicting the optimal battery size in microgrids. Evaluation criteria and experimental results are presented on subjective IQA databases in Section 4 followed by conclusions in Section 5.

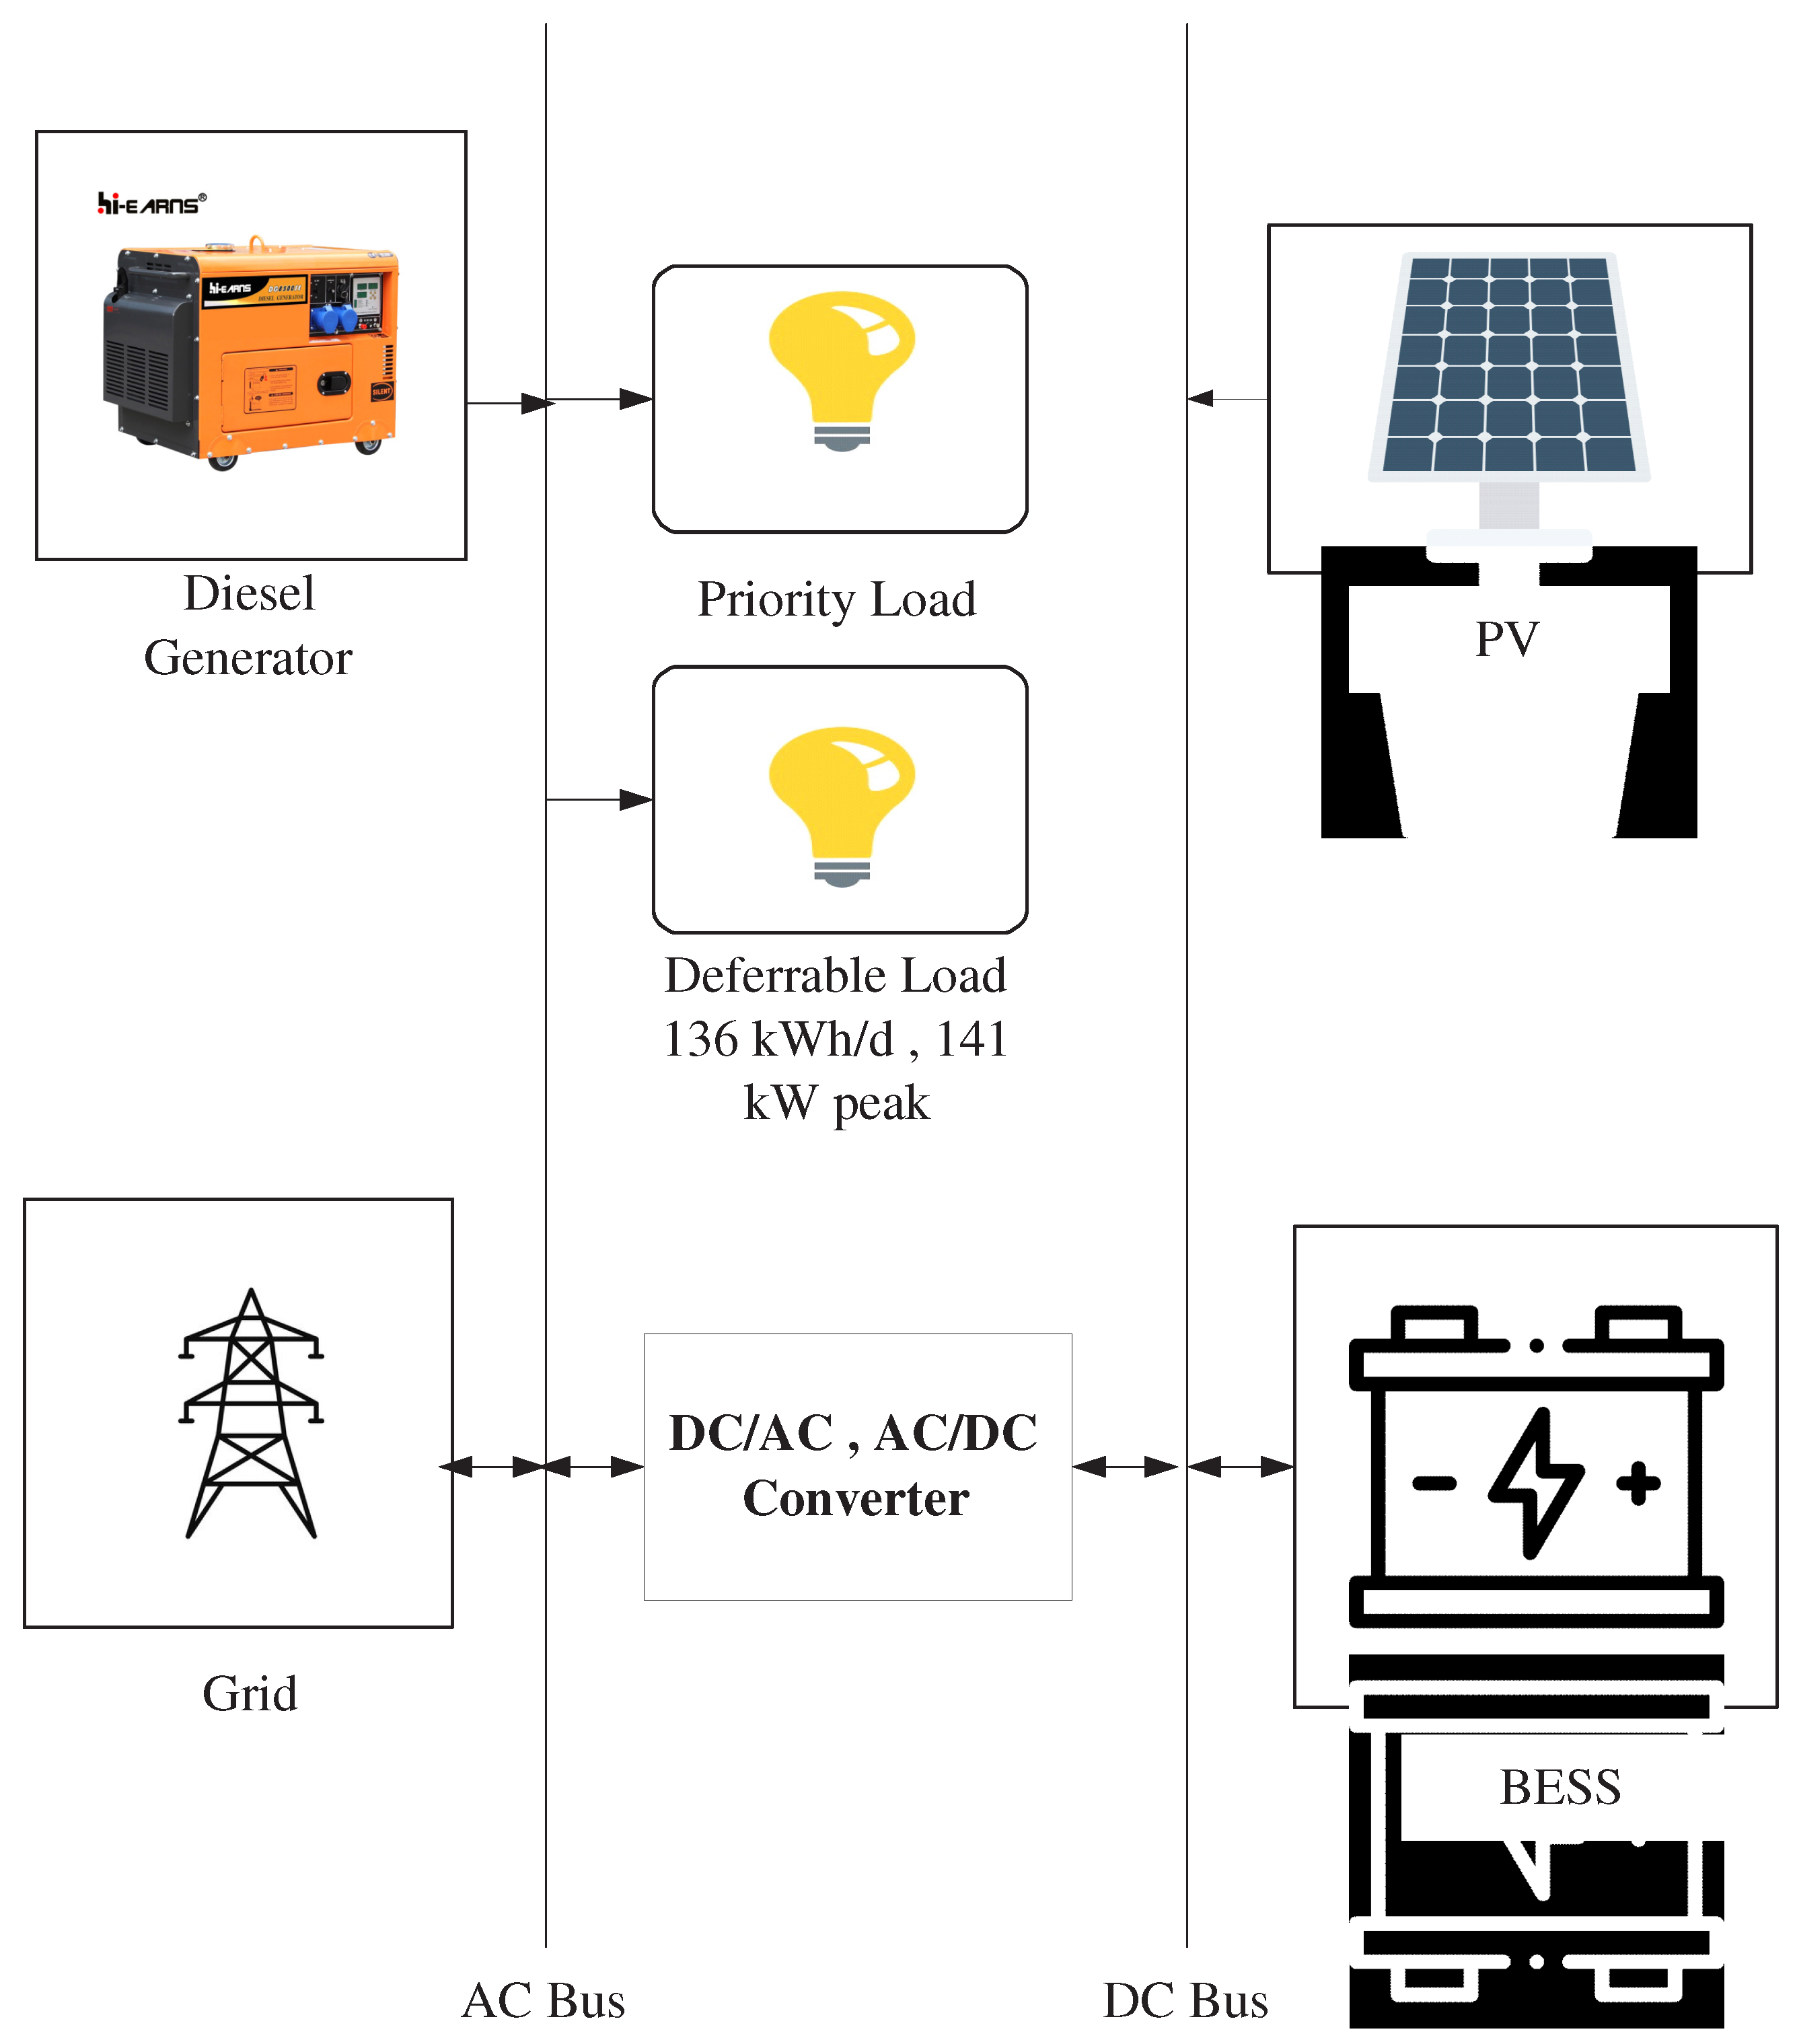
2. Dataset Generation Using Mixed Integer Linear Programming (MILP)

MILP is a linear optimization problem extensively used while solving optimal sizing and selection problems of DERs and energy storage in microgrids. The problem is solved by the power balance of different DERs and energy storage as compared to the total load. Random sizes are entered into respective matrices to form a generation mix, and each generation mix is then compared to fully satisfy the load demand. Mathematically, it can be expressed as in [30],
i = 1 N P i + j = 1 N W j = P L ,
where P is the power in kW extracted from ith DER, and W is the instantaneous power extracted from the jth energy storage at any instant. P L corresponds to the total load demand obtained using MILP.
Figure 1 shows the microgrid model under consideration. The data set for a residential microgrid with 24,000 samples and 40 parameters has been self-extracted using a MILPbased microgrid model as presented in [31]. The extracted parameters and their description is presented in Appendix A. The dataset has also been made available online.

3. Proposed Methodology

Figure 2 shows the two-step methodology proposed for optimal battery sizing of microgrids. The input to the system is power generation source factors and external parameters. In the first step, a feature selection algorithm is applied to the input to select the most relevant factors and parameters for optimal battery sizing in microgrids. The feature selection is performed using various search methods that try to navigate different combinations of attributes in the dataset to arrive at a shortlist of chosen features by keeping battery parameters as the target value. Many feature selection algorithms were evaluated but six top-performing search methods are considered here, which include ranker search, harmony search, evolutionary search, PSO search, genetic search, and linear forward search. In the second step, the selected features by the respective feature selection algorithm are given as input to the support vector regression (SVR) to predict the battery autonomy.

3.1. Feature Selection

The input features are subjected to feature selection. Various feature selection algorithms were analyzed, but the performance of only six top feature selection algorithms is reported in this work. Feature selection algorithms select the most relevant features for optimal battery sizing. The details of each feature selection algorithm are given below.

3.1.1. Harmony Search (HS)

Harmony Search (HS) is an optimization algorithm that utilizes the metaheuristic method. HS offers the advantage of search efficiency, algorithm simplicity, and it converges quickly to the optimal solution. The resolution time for the method is generally low [32]. HS has been used on numerous engineering problems and has shown great application adaptations leading to the different versions of the algorithm being adopted. In most engineering optimization problems, there is consideration for the nonlinear and in some cases nonconvex functions that have intense equality. This has led to the increasing difficulties that arise from the solving of optimization problems using the traditional methods. HS is better suited for complex optimization problems. The HS method tries to search for the perfect harmony that is analogous to the optimal solution. This has led to harmonious improvisation:
x n e w = x b o l d + b ω ,
where x n e w is the new harmony vector, x b o l d is the old harmony vector, and b ω is a constant. The random walk adjustment from the pitch can be illustrated in,
x n e w = x o l d + b ( 2 ϵ 1 ) ,
where x o l d is the fixed variable for the pitch, and b is constant for the pitch displacement.

3.1.2. Evolutionary Search (ES)

Evolutionary search utilizes the mechanisms that are inspired by nature for the solution of various problems through processes that emulate the various behaviors of living things. The mechanisms used for the development of the algorithm would therefore use biological terms and evolution like reproduction and recombination. The main working principle of the algorithm is the use of solutions that eliminate the weakest links and preserve the strong links i.e., the Darwin-based model. This helps in achieving a more viable solution [33]. The major benefits of the algorithm include increased flexibility, better optimization bandwidth, and unlimited solutions:
p r i = F ( k i ) i = 1 M F ( k i ) ,
where F ( k i ) is a function of random variables.

3.1.3. Genetic Search (GS)

The algorithm uses a set of terms named fitness function, initial population, mutation, selection, and crossover. The algorithm uses Darwin’s model with genetic operators that form a key part of the problem-solution finding [34]. Some of the key benefits of the algorithm are the complex problems solving approach and its parallelism application. The diversification of the optimization is able to deal with functions that are stationary. It can also deal with random noise. The ability of the algorithm to investigate various directions simultaneously in feature space makes it appropriate for the scientific field [32]. However, given its dynamism, the algorithm is widely used in optimization that involves nonlinear data computations. The genetic search algorithm can be considered as a probability function for the chosen selector operator. In the case of chromosome, (C), the algorithm would be
P = | f ( C ) i = 1 N f ( C ) | ,
where f ( C ) is the function for the chromosome, and (N) is the total number of outcomes which depict the nominal value.

3.1.4. Linear Forward Search

The method would use the sequential method that is key for finding the desired element in the list from a group. Upon the successful location of the searched item, the index would often be returned. The movement is in the forward direction when the search is performed [25]. The application for the linear search is mainly for the discrete values of data that would involve many elements. In n models, the function for the linear standard regression model can be written as
y = Q θ + ϵ ,
where Q is the regression constant, and θ is the variable for the regression. The error ϵ is used to make up for the second-order differential equation. The main assumption is that the variance ( σ 2 ) is additive. This means we can obtain the parameter, θ , through the least square method [25].

3.1.5. Particle Swarm Optimization (PSO)

This is an optimization tool used for finding the optimal solutions to the specific parameters for a design requirement with a consideration of the lowest possible cost, optimization. The application is vast in various scientific fields. Since its introduction in 1995, the method has quickly gained several useful applications in various fields [8]. The adoption of the algorithm was based on social behavior, especially the bees and insects that move in a swarm (group). In nature, it is a stochastic novel-based population and is key in solving complex nonlinear optimization problems [9]. PSO uses three parameters i.e., the number of dimensions, and lower and upper boundaries. The function can be elaborated as a function, where the minimum function can be seen below:
M i n , f ( x ) , x = ( x 1 , x 2 , , x N ) ,
where (f(x)) is the function for the variable (x), subject to several inequalities.
S u b j = g m ( x ) 0 for values of m = 1 , 2 , 3 , n g
where g m is the inequality function.
h m ( x ) = 0 for m = n g + 1 , n g + 2 , n g + n h ,
where n h is the final value of equality. The algorithm mainly adopts five main principles. First, proximity means the ability for the space and time computational adjustments incorporated into the model. Next, the quality refers to the swarm’s ability to sense the changing quality of the environment and hence an appropriate response. Thirdly, the diverse response is the ability of the swarm to change considerably and not in a narrow manner. Stability refers to the swarm not being able to change with all aspects of change but rather a controlled environment. Finally, adaptability refers to the change that is most suitable and hence the worthy adjustment [9].

3.1.6. Ranker Search

This is a search algorithm that uses the evaluation metrics to be able to retrieve the information mainly from various data sources. For instance, Google uses a ranger search algorithm; PageRank ranks the various URL pages depending on the importance of the various web pages. Thus, the main function is the frequency that is considered by the search algorithm for the ranking of the web pages. The case study into the Google search engine can be used as the benchmark of the operations of the ranker search algorithm.
The algorithm would work in the three-stage process namely crawling, indexing, and serving. In the crawling stage, the use of other information gathering techniques like the bots will be used to obtain the updated changes to the various URL. Next, at the indexing stage, the categorical ranking of the various web pages is based on the content of either the images or the various texts. This is done by the identification of the various headers and the tags. Finally, at the serving stage also known as the ranking stage, the various URL will be listed based on the most relevant to the search parameter that is obtained for the search. The use of a similar concept is adopted by the various search engines with a few minor adjustments to the attributes of search like the price in some cases or the frequency of visits in some (inbound traffic) [10]. In the case of the ranker algorithm, the basic ranker search can be formulated as
P R ( A ) = P R ( B ) L ( B ) + P R ( C ) L ( C ) + P R ( D ) L ( D ) ,
where A, B, and C and web pages that are lined together, and L ( ) is the outbound link. The various probability functions of the pages can be used. The overall function would define P R ,
P R ( U ) = B u P R ( v ) L ( v ) ,
The notation B u is the set that contains all links to the URL page u, and L ( v ) the number of links to URL v. the damping factor is also considered for the algorithm.
The SVR uses tools like sparse solution [26]. The use of the SVR will consider a Hyperplane; this is a separation that aids in the prediction of the target value. The Kernel in an SVR model would be a function that would be suitable for the mapping of the data points into a higher dimension. The commonly used kernels are the sigmoidal, polynomial, and Gaussian radial basis function kernels. Finally, the boundary line margin that separates the hyperplane for the data points [26]. The illustration can be seen below for the SVR. The normal vector’s magnitude relative to the surface can be estimated as
M i n w 0.5 | | w | | 2
where w are the weights, and the error is compensated in the constraints by constraints,
| y i W i X i | ϵ
where y i is the initial y constraints for the variable, and x i is the initial x constraints for the variable.

4. Experimental Results and Discussion

4.1. Data Set and Evaluations’ Parameters

The dataset is one of the basic requirements for the quantitative evaluation of a system. The data set is of the residential load of a microgrid. It is self-developed by using MILP. The data set has 24,000 samples and 40 features. The 40 features are presented in Appendix A. Each row in the data set presents generation sources, external factors, and battery parameters. Add some details about the time, duration topology, etc.

4.1.1. Spearman Ranked Correlation Coefficient (SROCC)

This is a nonparametric measure of the strength and direction of association that can be established between two variables. The assumptions used for SROCC are mainly three. The first assumption is that the two variables under study should be measured on an ordinal, interval, or ratio scale. The second assumption is that the two variables should present paired observation-based criteria. The last assumption is that there should be a monotonic relationship between the two variables [11]. The SROCC score is given as
S R O C C = i ( ( x i x ¯ ) ( y i y ¯ ) ) i ( x i x ¯ ) 2 ( i ( y i y ¯ ) )
where x i is the ith value of x, x ¯ is the mean value of x, y i is the ith value of y, and y ¯ is the mean value of y. A value close to 1 for SROCC signifies better performance and represents that the predicted battery autonomy using the proposed model is close to the original battery autonomy, whereas a value close to 0 for SROCC signifies poor performance and represents that the predicted battery autonomy does not match the original battery autonomy.

4.1.2. Kendal Correlation Constant

The KCC is used for the measurement of the ordinal association between two measured quantities. The correlation would test for the similarities in the ordering of data when it is ranked by quantities. The coefficient value of 1 means that the elements in the two sets are ordered in a similar manner i.e., high correlation. The coefficient value being −1 ( τ = 1 ) means that the two sets are ordered oppositely. Finally, when τ = 0 , it means there is no relationship between the two sets [12]. The rank correlation can be expressed by
τ = n c n d n ( n 1 ) ,
where n c is the number of concordant pairs, n d is the number of discordant pairs, and n is the total number of pairs. A value close to 1 for KCC signifies better performance and represents the fact that the predicted battery autonomy using the proposed model is close to the original battery autonomy. However, a value close to 0 for KCC signifies poor performance and represents that the predicted battery autonomy does not match the original battery autonomy.

4.1.3. LCC: Linear Correlation Constant

LCC is a measure of the strength of the linear relationship between two variables. The LCC values, r x y , show the strength of the relationship between two variables. A value close to 1 for LCC signifies better performance and represents that the predicted battery autonomy using the proposed model is close to the original battery autonomy. However, a value close to 0 for SROCC signifies poor performance and represents that the predicted battery autonomy does not match the original battery autonomy [35]. The formulation of the linear coefficient can be seen below:
r x y = n i = 1 n x i y i i = 1 n y i n i = 1 n x i 2 i = 1 n x i 2 n i = 1 n y i 2 ( i = 1 n y i 2 )
where x i is the ith values for the x variable, and y i is the ith value of the y variable.

4.1.4. RMSE: Root Mean Square Error

The RMSE is a tool that is used for the prediction error (residual). The residuals are the measure of how far predicted data points are from the original values [35]. The use of the RMSE is vital for statistical data to illustrate data relationships and establish the variation of the data. The RMSE can be formulated as follows:
R M S E = ( P O ) 2 n
where P is the predicted value in the observations, and O is the observed value for the observations with a sample size n. A value close to 0 for RMSE signifies better performance and represents that the predicted battery autonomy using the proposed model is close to the original battery autonomy. However, a high value for RMSE signifies poor performance and represents that the predicted battery autonomy does not match the original battery autonomy.

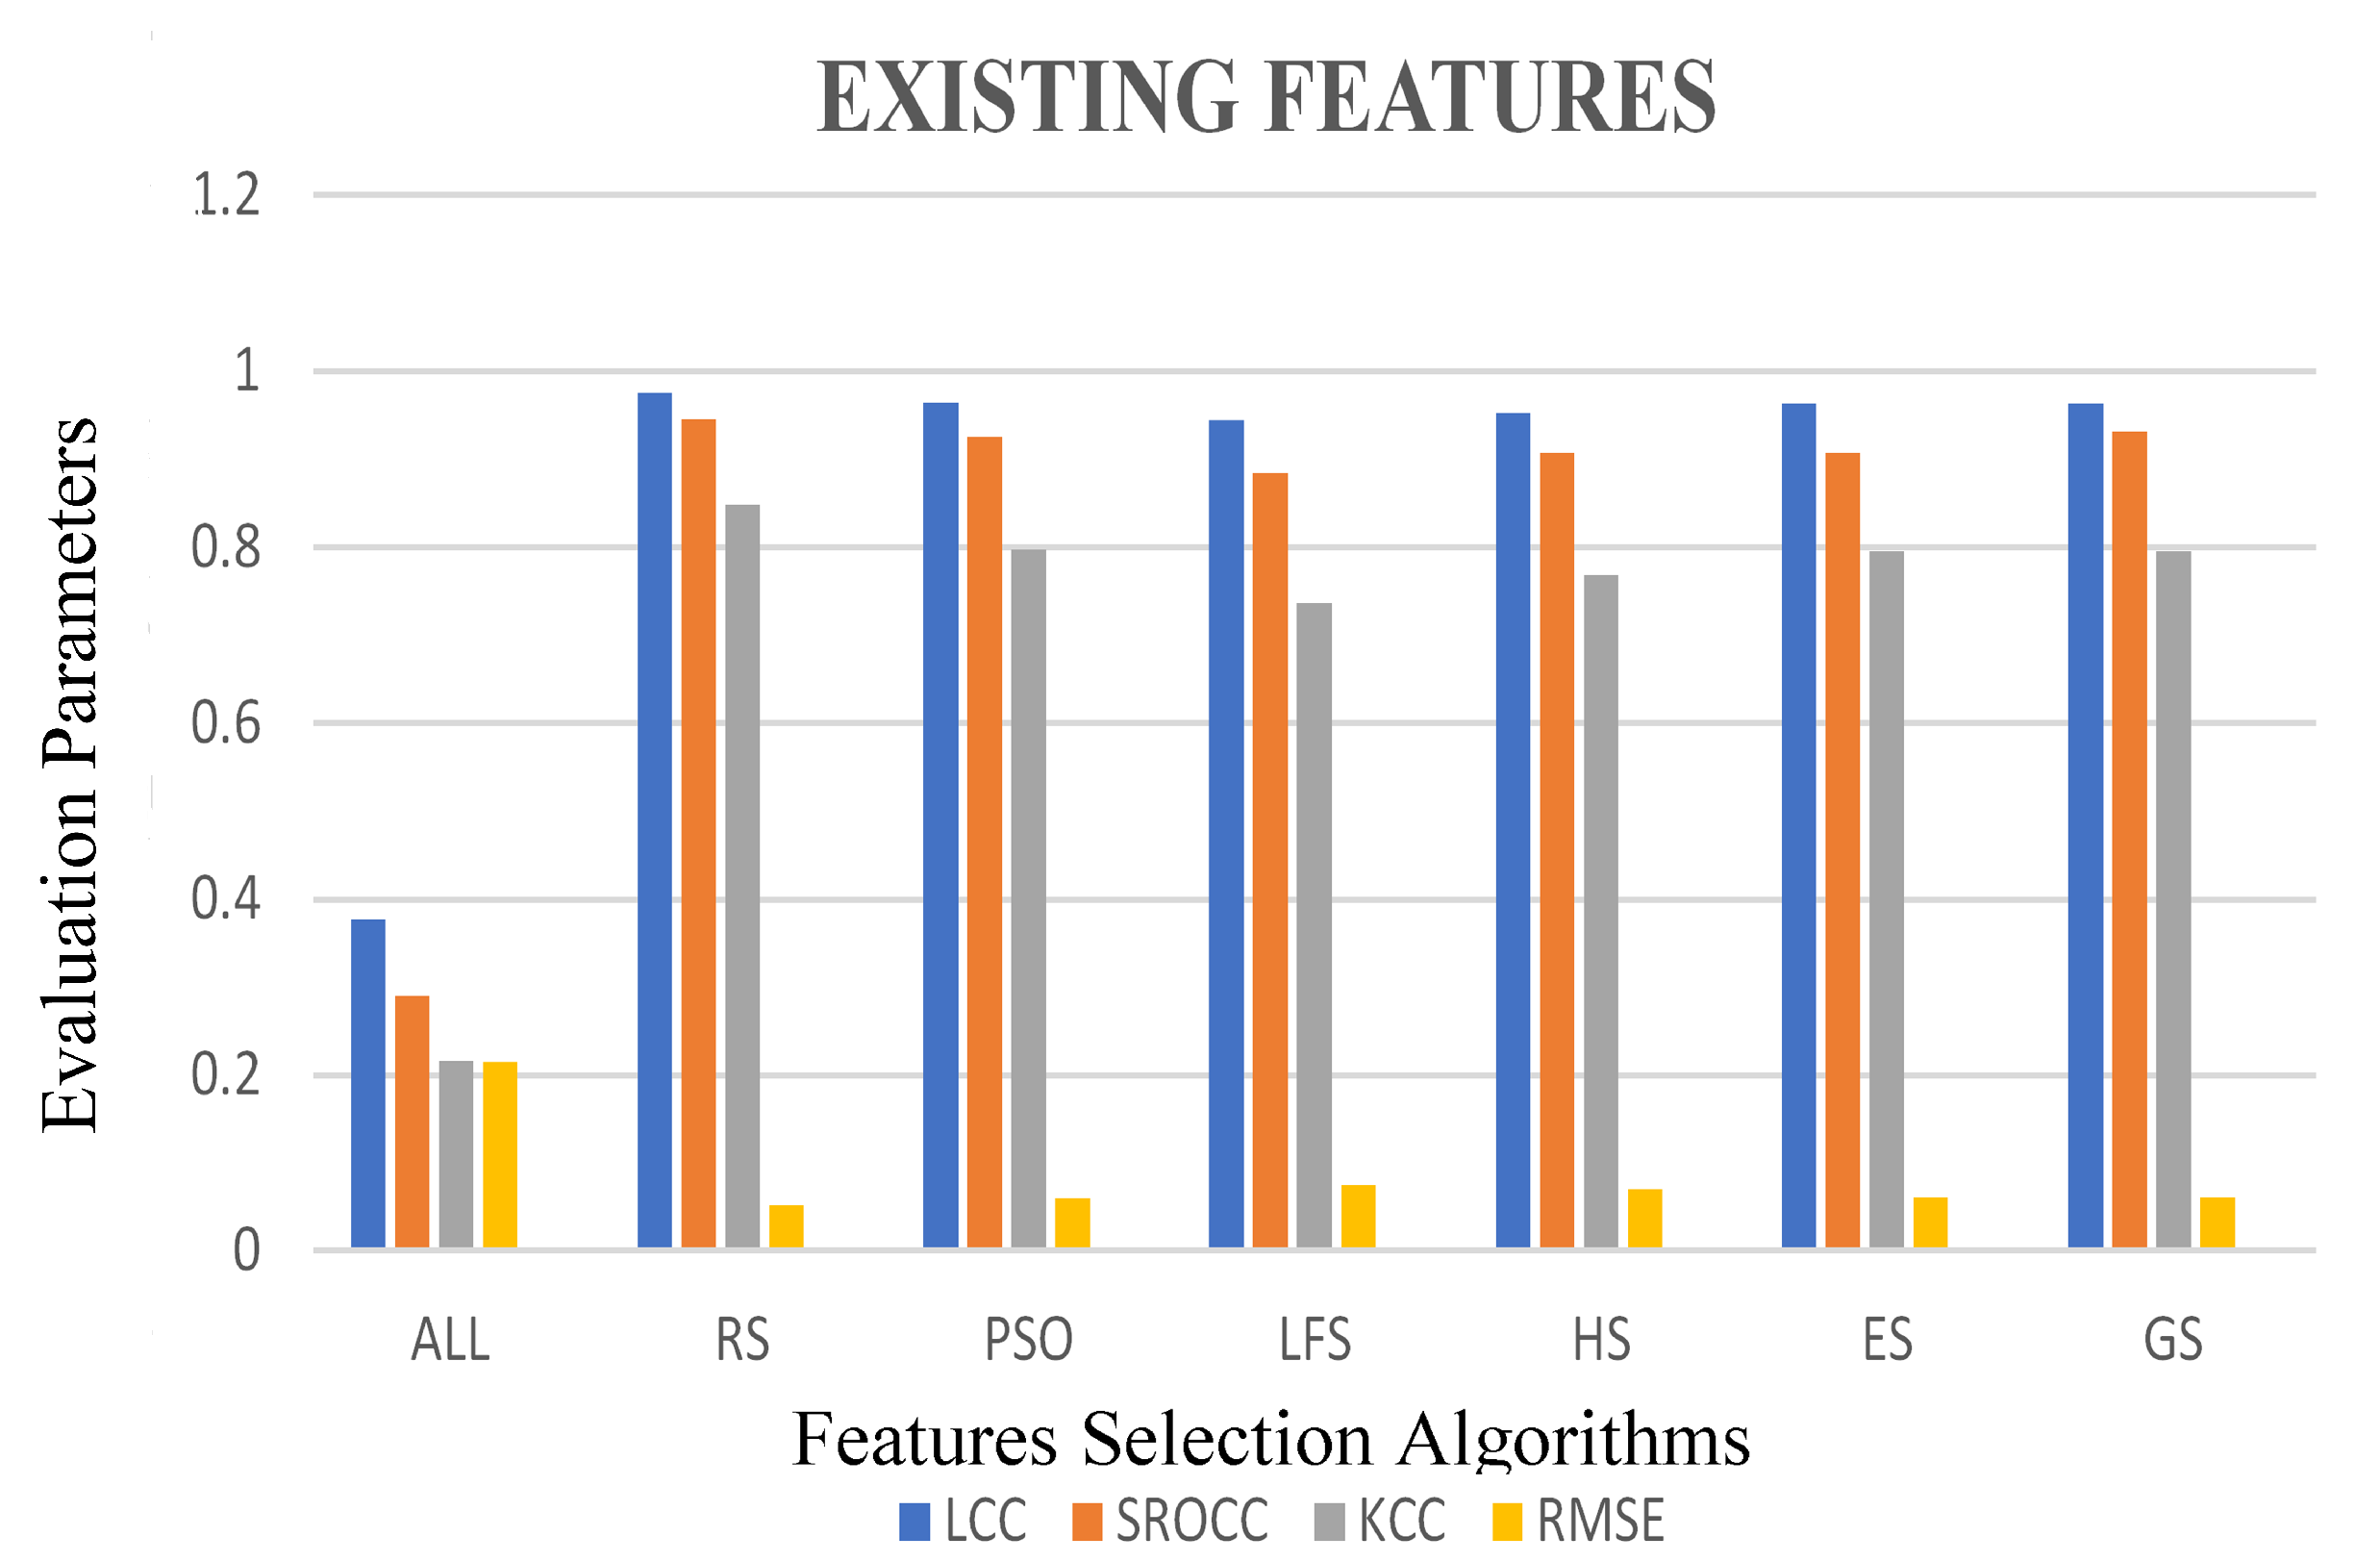
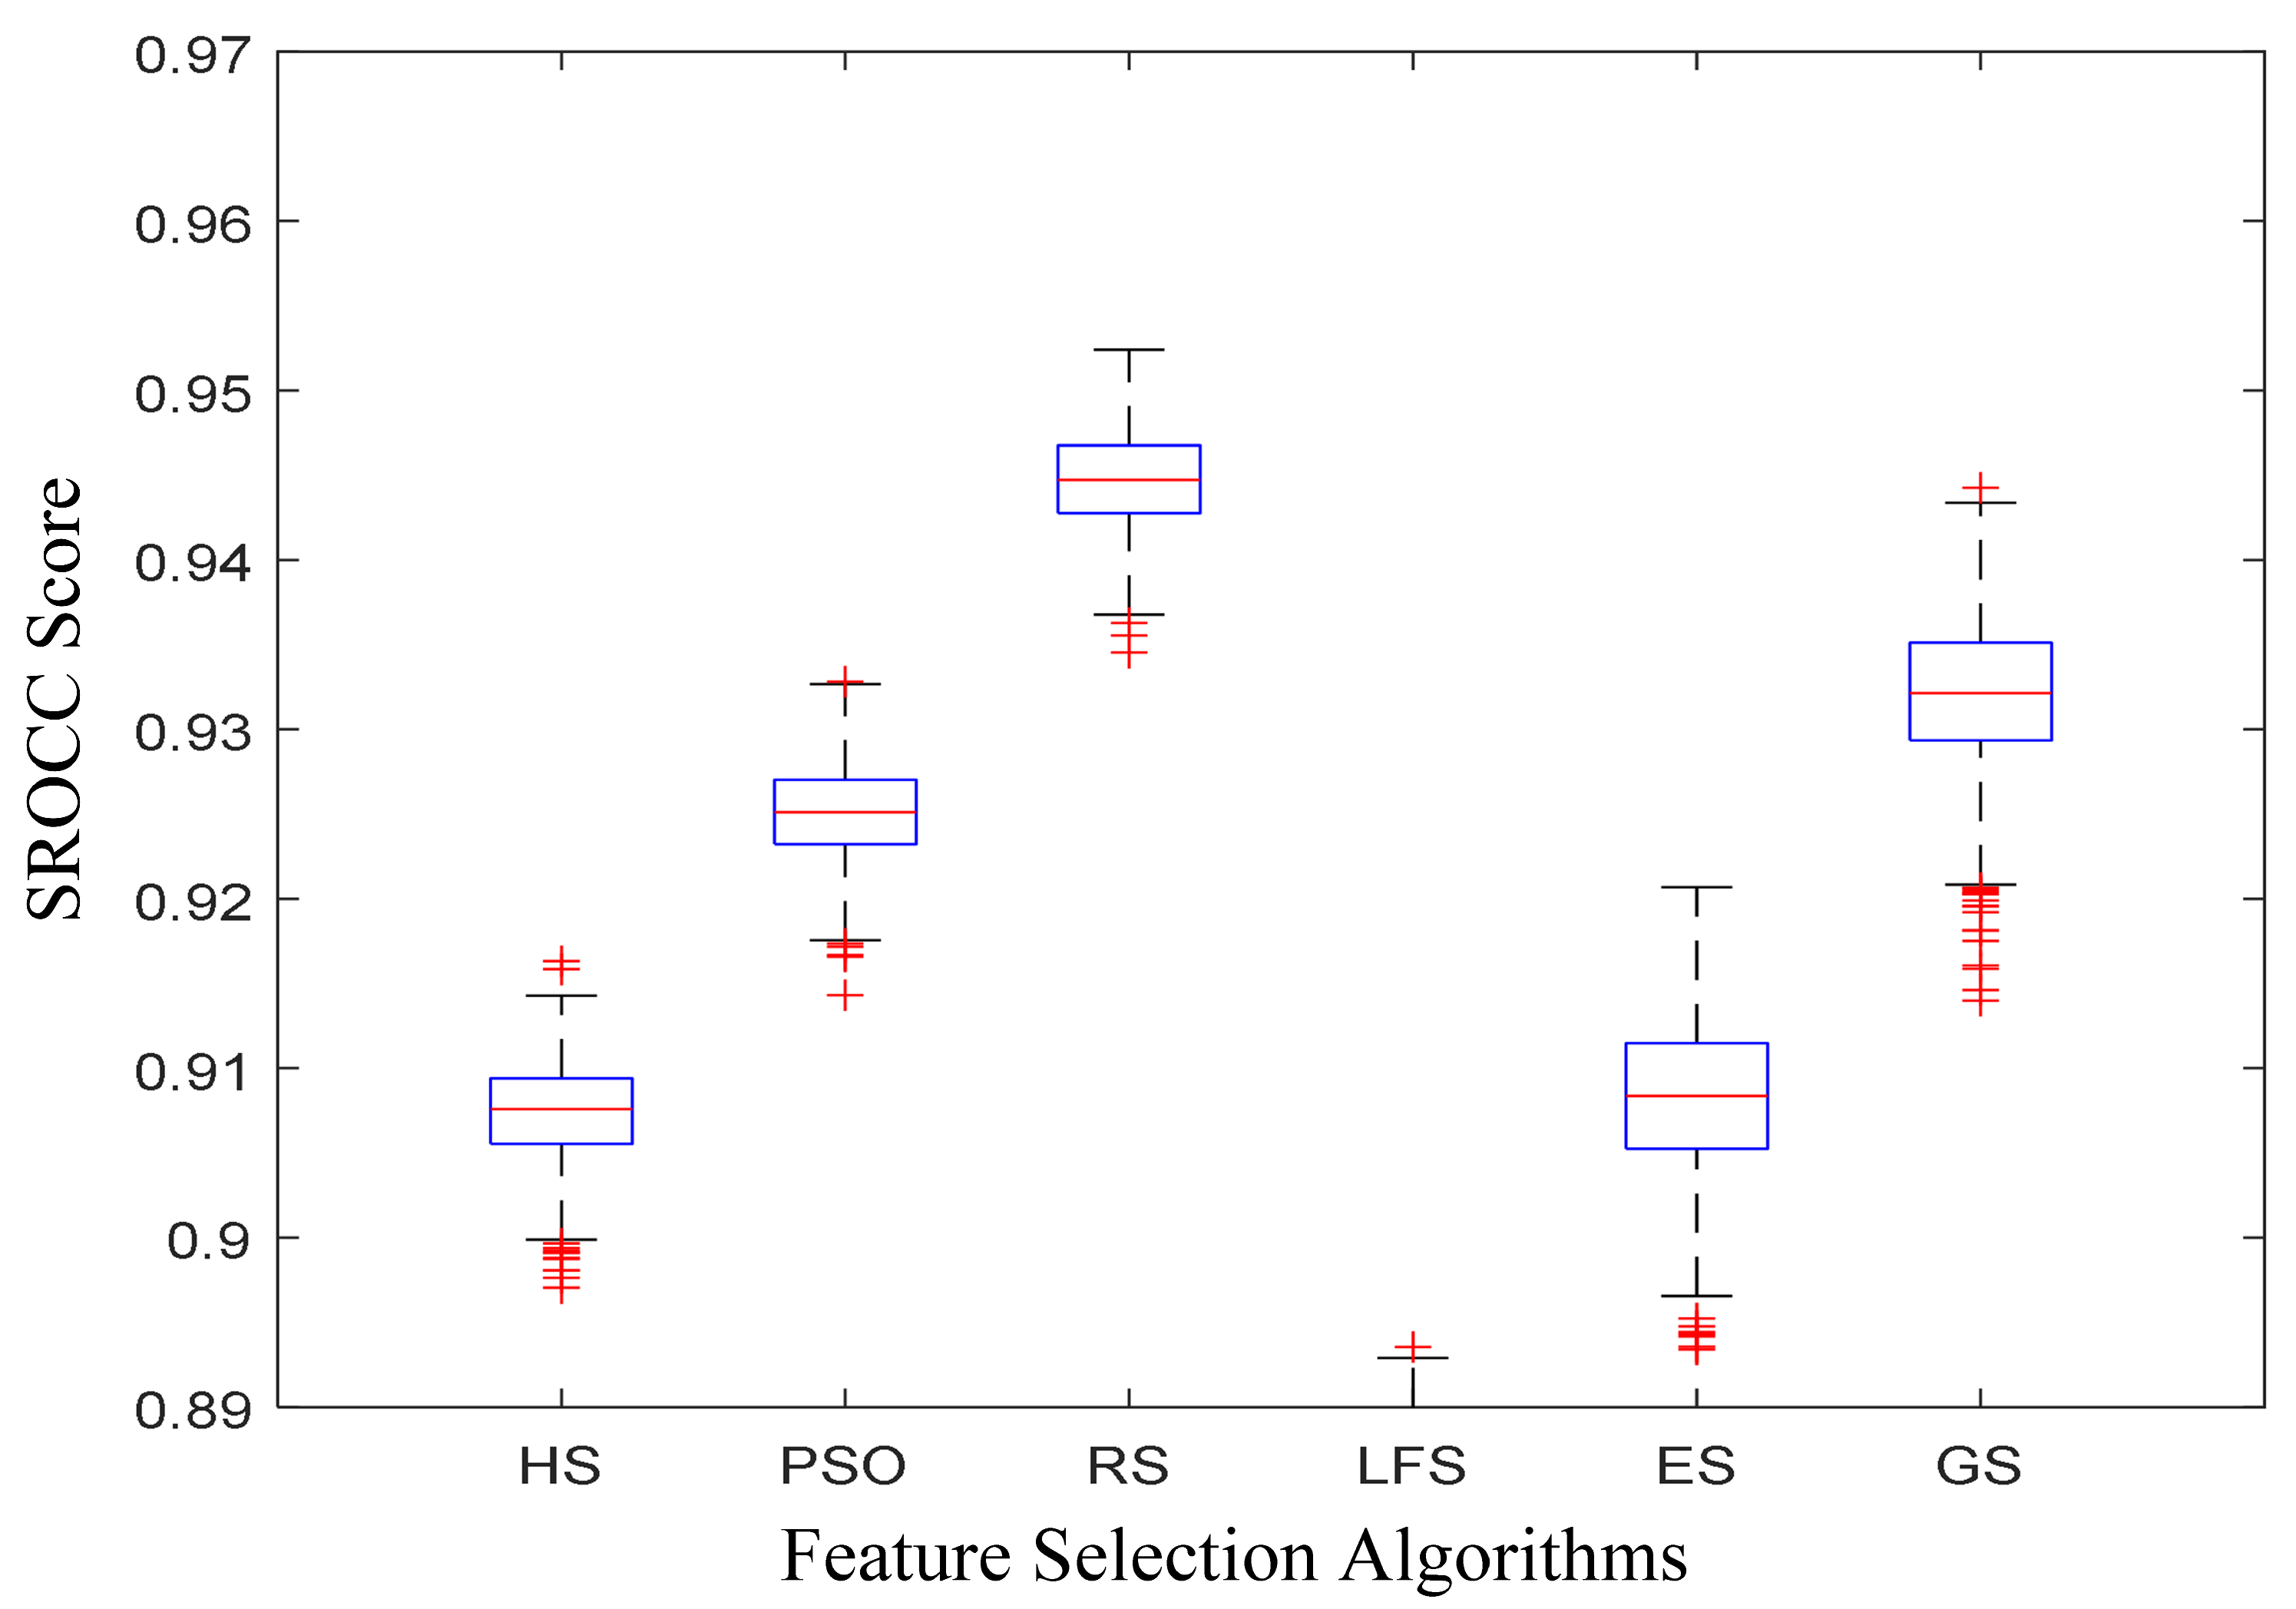
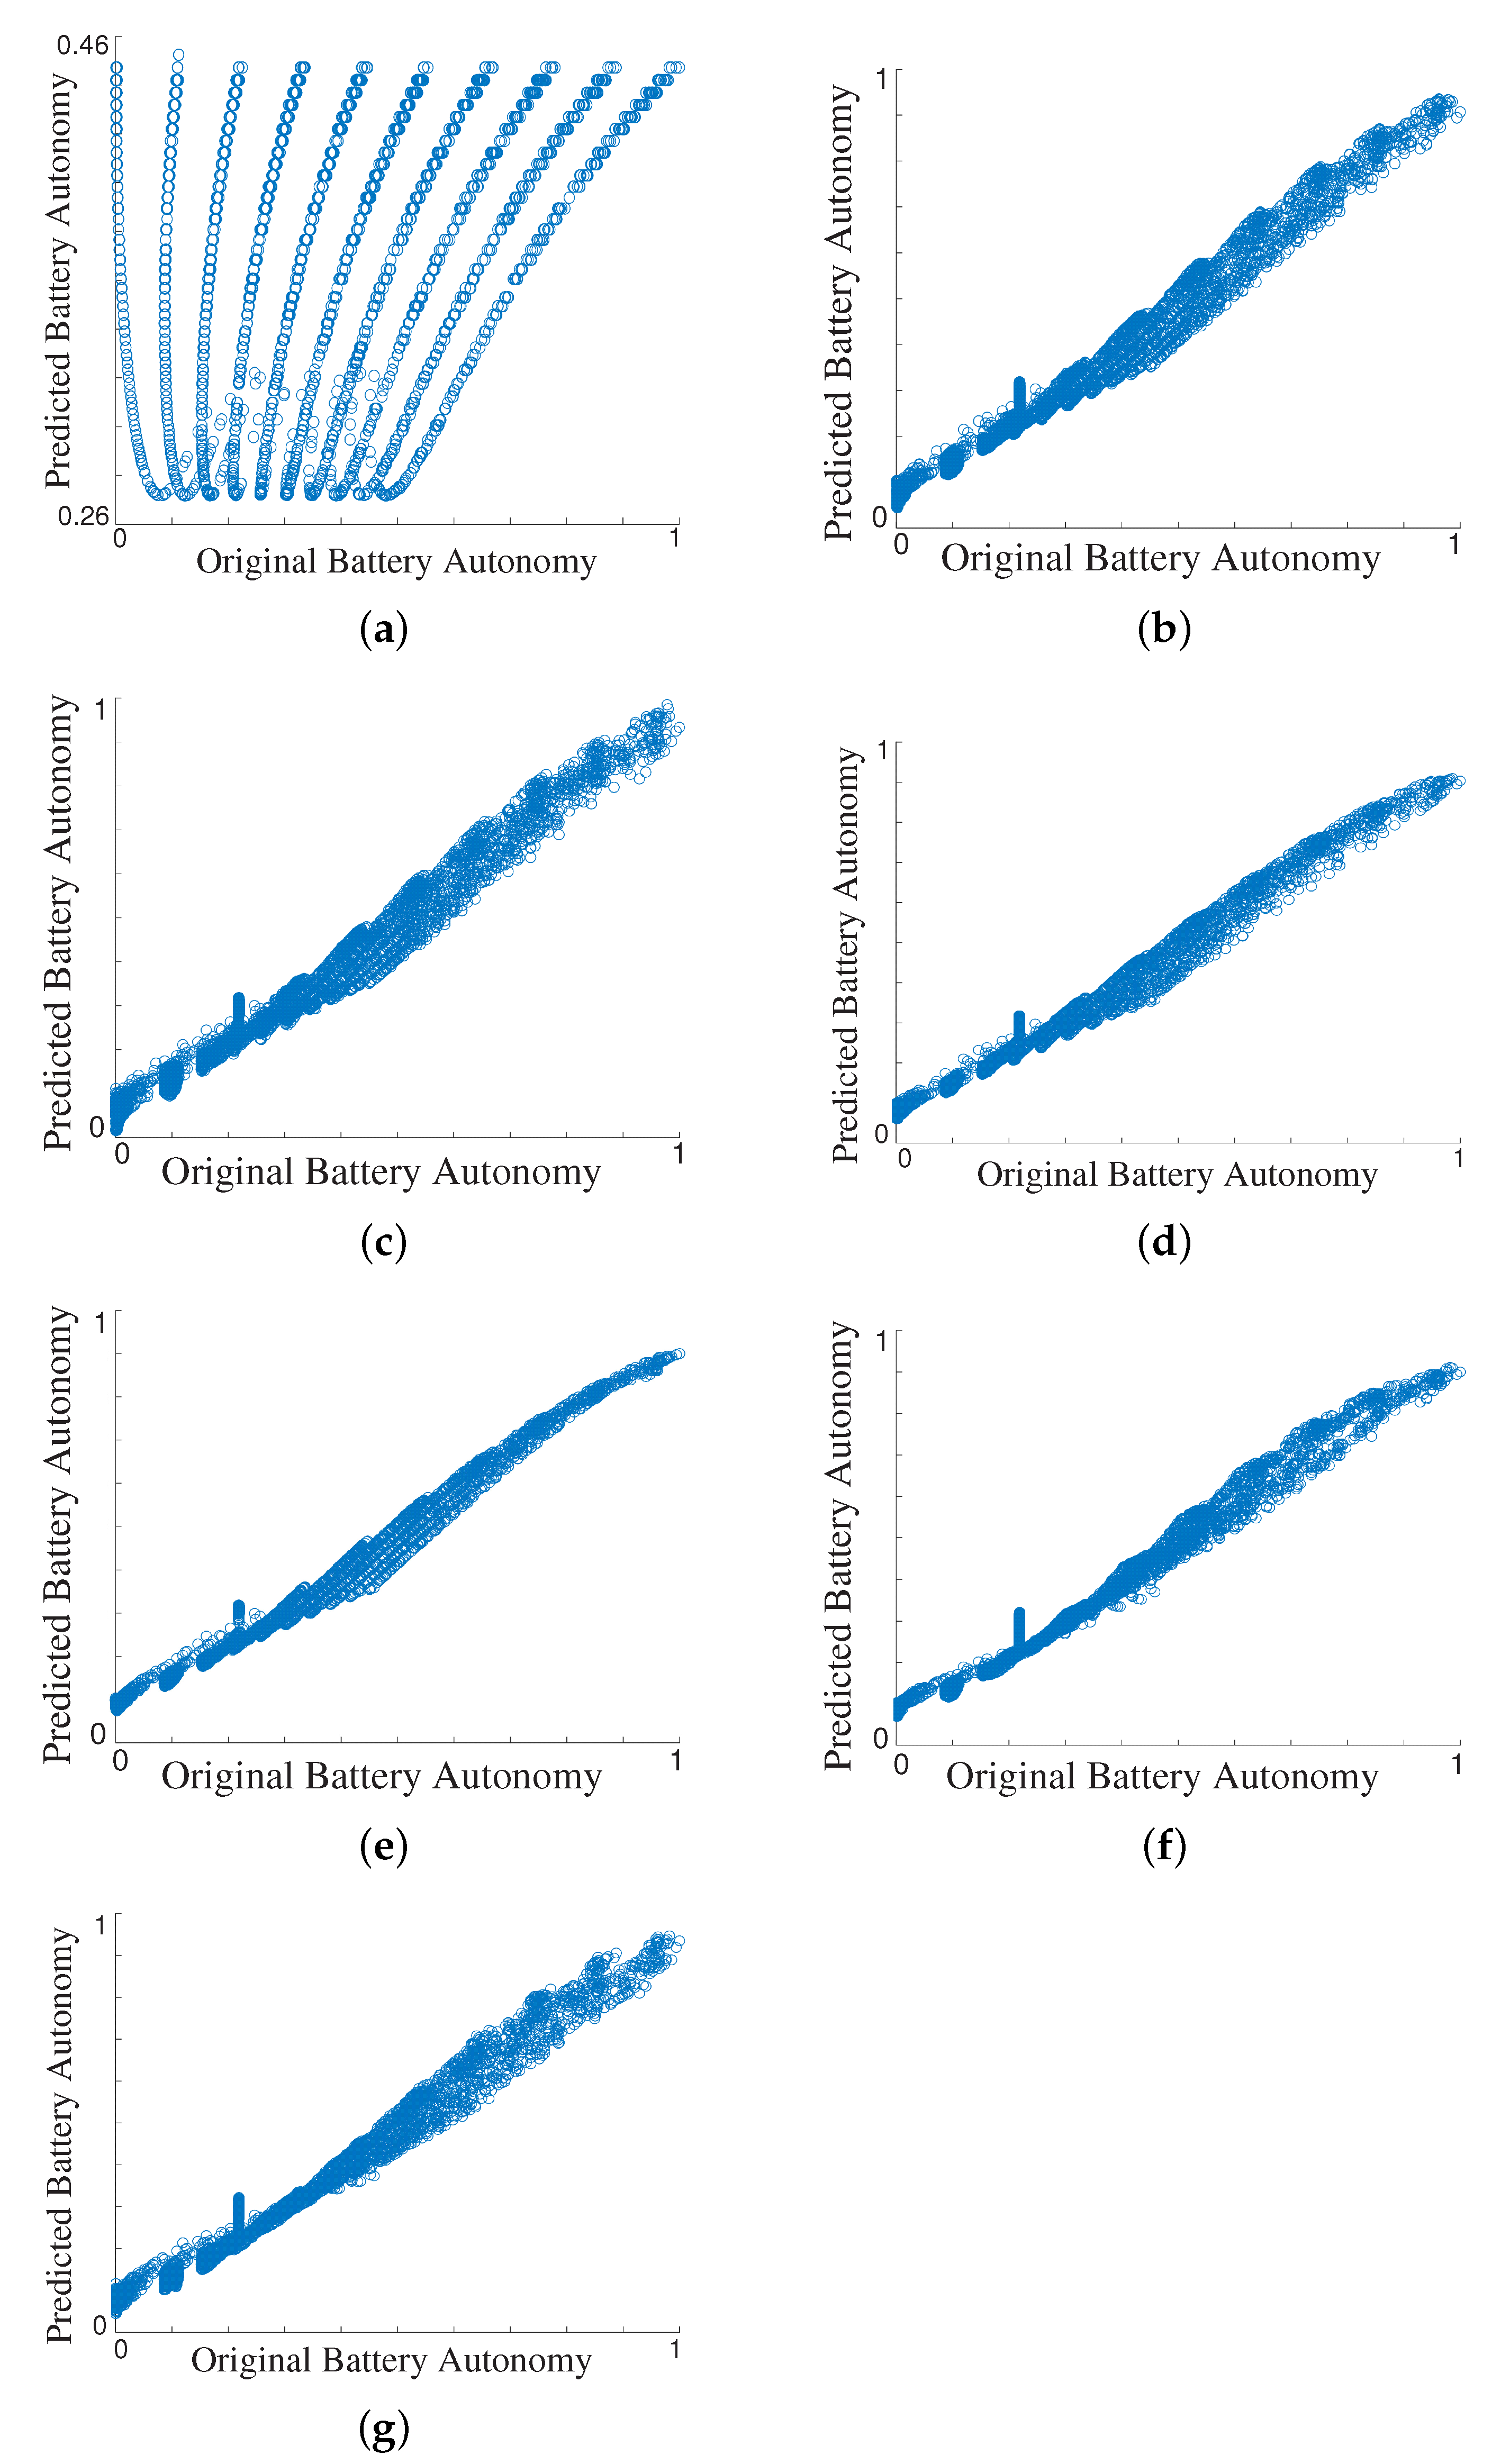
4.2. Performance Analysis

Table 1 shows the number of features selected by each feature selection algorithm. The total number of features is 40. Ranker search selects 29 and particle swarm optimization selects 14 features. However, six features are selected by linear forward selection and eight features are selected by the harmony search algorithm. Evolutionary search and genetic search algorithms select 12 and 11 features, respectively. It can be observed that the ranker search feature selection algorithm selects the largest number of features i.e., 29, whereas the linear forward features selection algorithm selects the least number of features i.e., 6, particle swarm optimization algorithm selects the second largest number of features i.e., 14. The third least number of features is selected by harmony search i.e., 8.
Figure 3 shows the comparison of all the feature selection algorithms in terms of SROCC, LCC, KCC, and RMSE in the form of a bar graph. It can be observed that the feature selection algorithms help in better prediction of battery autonomy and improve the performance of the proposed methodology. Figure 3 shows that the battery autonomy prediction capability of the proposed methodology improves greatly when feature selection is applied, and it can be observed that the SROCC score is 0.2893, LCC score is 0.3760, KCC score is 0.2165, and RMSE score is 0.2152 when all 40 features are utilized. Feature selection helps in improving the capability of the system to predict the battery autonomy which is depicted by an improvement in SROCC score to 0.9452, LCC score to 0.9756, KCC score to 0.8488, and RMSE score to 0.0525 when the ranker search feature selection algorithm is applied. Aforementioned values close to 1 for SROCC, LCC, and KCC signify that the predicted battery autonomy correlates highly with the original battery autonomy, and hence the predicted values of battery autonomy are close to the original values of battery autonomy. Furthermore, the value of RMSE close to zero shows that the difference between the values of predicted battery autonomy and original battery autonomy is minimal. Hence, the feature selection algorithms have a significant impact on improving the battery autonomy prediction capability of the proposed system. It can be observed that the height of the bar graphs is lower when all the features and the height increases for all six feature selection algorithms and when a subset of the most relevant and optimal features is used for predicting the battery autonomy.
The results shown in Figure 3 can be verified using Table 2. The performance analysis for the battery autonomy capability of the proposed methodology in terms of SROCC, LCC, KCC, and RMSE is shown in Table 2. It can be observed that the performance of the proposed methodology improves when feature selection algorithms are utilized. The system shows a capacity for battery autonomy prediction when all the 40 features are utilized in terms of SROCC, LCC, and KCC score to be 0.2893, 0.3764, and 0.2165, respectively. The capacity for predicting battery autonomy in terms of SROCC, LCC, and KCC increases to 0.9452, 0.9756, and 0.8488 when the ranker search feature selection algorithm is applied. In terms of RMSE, a value close to 0 signifies better battery autonomy prediction capability and, therefore, the performance in terms of RMSE improves from 0.2152 when all the features are utilized to 0.0525 when ranker search is used. Ranker search is ranked at the top with an SROCC, LCC, KCC, and RMSE score of 0.9452, 0.9756, 0.8488, and 0.0525, respectively. PSO is ranked second with a SROCC, LCC, KCC, and RMSE score of 0.9252, 0.9645, 0.7983, and 0.0608, respectively. Genetic search is ranked third with a SROCC, LCC, KCC, and RMSE score of 0.9237, 0.9640, 0.7959, and 0.0613, respectively. Evolutionary search is ranked fourth with a SROCC, LCC, KCC, and RMSE score of 0.9229, 0.9639, 0.7954, and 0.0613, respectively. Harmony search is ranked fifth with an SROCC, LCC, KCC, and RMSE score of 0.9076, 0.9528, 0.7685, and 0.0701, respectively. Linear forward selection is ranked sixth with an SROCC, LCC, KCC, and RMSE score of 0.8846, 0.9443, 0.7369, and 0.07518, respectively.
Figure 4 shows the box plot of the SROCC scores over 1000 iterations for the proposed methodology when using all features and utilizing the top-performing six feature selection algorithms. A box plot shows the five-number summary of a set of data i.e., minimum, first quartile, median, third quartile, and maximum. The interquartile range is defined as the distance between the upper and lower quartiles. A larger interquartile range shows a higher deviation in the data. A lower interquartile range is desirable for our case, which indicates consistent results over the given iterations. The test and train samples are selected at random for each iteration. It is ensured that the test and train sets for each iteration are disjoint sets i.e., the training samples are not present in the test samples. It can be observed that the median value for the box plot of ranker search is the largest, which shows that it performs best. It can also be observed that the box plot for the ranker search is more compact i.e., it has a lower interquartile range in comparison to when all the features are utilized, evolutionary search, genetic search, and harmony search. This shows that there is a lower standard deviation between SROCC values in the case of ranker search. A lower value of standard deviation shows that the results are more consistent over the 1000 iterations.
The performance comparison of the proposed methodology in terms of RMSE with state-of-the-art techniques in literature is shown in Table 3. A value close to zero for RMSE exhibits better performance, whereas a higher value of RMSE represents poor performance. The proposed methodology with ranker search has the least value of RMSE i.e., 0.0525 when compared to other state-of-the-art methods, i.e., it is ranked at the top, and it signifies the better performance of the proposed methodology in comparison to state-of-the-art methods. Support Vector Regression integrated with Harris–Hawks Optimization [27] is ranked second with an RMSE score of 0.1961, K-means clustering [24] based technique is ranked third with a RMSE score of 0.7170, which is much higher in comparison to the proposed methodology.
Figure 5 shows the scatter plots of the proposed methodology using all features and with feature selection algorithms. The horizontal axis of each scatter plot represents the original values of battery autonomy computed using MILP and the vertical axis represents the predicted values of battery autonomy. The ideal case, i.e., the best result would be if the data points of the scatter plot are aligned along the positive diagonal. Figure 5a shows the scatter plot of the original vs. predicted values when all features are used. It can be observed that the data points are not aligned along the diagonal, hence the performance of the system is not optimal. Figure 5b shows the scatter plot of the original vs. predicted values when an evolutionary search feature selection algorithm is used. It can be observed that the data points are better aligned along the diagonal in comparison to when all features are used. It is also validated by the higher SROCC score of 0.9639. Figure 5c shows the scatter plot of the original vs. predicted values when the genetic search is used to select features. It can be observed that the data points are better aligned along the diagonal in comparison to when all features are used. It is also validated by the higher SROCC score of 0.9640. Figure 5d shows the scatter plot of the original vs. predicted values when harmony search is used to select features. It can be observed that the data points are better aligned along the diagonal in comparison to when all features are used. It is also validated by the higher SROCC score of 0.9528. Figure 5e shows the scatter plot of the original vs. predicted values when linear forward selection is used. It can be observed that the data points are better aligned along the diagonal in comparison to when all features are used. It is also validated by the higher SROCC score of 0.9443. Figure 5f shows the scatter plot of the original vs. predicted values when particle swarm optimization is used to select features. It can be observed that the data points are better aligned along the diagonal in comparison to when all features are used. It is also validated by the higher SROCC score of 0.9645. Figure 5g shows the scatter plot of the original vs. predicted values when ranker search is used for feature selection. It can be observed that the data points here are best aligned along the diagonal in comparison to all others. It is also validated by the highest SROCC score of 0.9756.
The results from different feature selection algorithms affect the battery sizing in microgrids or the performance. The feature selection algorithm with the least RMSE score and the highest SROCC, LCC, and KCC score assess the optimal size of the battery. The feature selection algorithm with the highest RMSE score and lowest SROCC, LCC, KCC score does not effectively predict the optimal size of the battery.
Adding the event-driven techniques might enhance the performance of proposed solution in terms of online computing efficiency, compression, and information management [38,39,40,41]. Additionally, potential control and optimization mechanisms can be further investigated in the context of battery management systems [2,3,42,43,44,45,46,47,48,49,50,51,52,53,54,55,56,57,58,59]. Future work considering these elements may be investigated.

5. Conclusions

Microgrids are becoming more popular with each passing day, but microgrids require bulk storage capacity to provide the stored energy in times of emergency or peak loads. Mixed-integer linear programming (MILP) is an established technique for the integration and optimization of different energy sources and parameters for optimal battery sizing. A new MILP-based dataset is studied in this work. Furthermore, a machine learning-based approach using the Support Vector Regression (SVR) is evaluated in this work for optimal battery sizing. Results have shown that the performance of the SVR, when all the features of the MILP formation are used, requires improvement. Hence, feature selection algorithms have been utilized that help in selecting the most relevant features that have a high impact on battery sizing. The performance of six top-performing feature selection algorithms is analyzed. The Ranker Search feature selection algorithm attained the highest performance with SVR by securing a Spearman’s rank-ordered correlation constant of 0.9756, linear correlation constant of 0.9452, Kendall correlation constant of 0.8488, and root mean squared error of 0.0525. The particle swarm optimization achieved the second best performance, genetic search is the third, evolutionary search is the fourth, harmony search is ranked fifth, and linear forward selection is ranked sixth. The performance of the proposed approach is compared with state-of-the-art counterparts. Results confirm a comparable or better performance of the devised method. In the future, the performance of devised method will be analyzed for other potential datasets and applications. Investigating the feasibility of incorporating the other machine and deep learning based regression models is another axis of future research.

Author Contributions

Conceptualization, I.F.N. and A.W.; methodology, I.F.N. and H.K.; software, H.K.; validation, A.W. and S.M.Q.; formal analysis, I.F.N. and A.W.; investigation S.M.Q. and A.W.; resources, A.W., S.M.Q. and A.T.A.; writing—original draft preparation, H.K., I.F.N., S.M.Q. and A.W.; writing—review and editing, S.M.Q., A.W. and M.K.; visualization, H.K. and I.F.N.; supervision, I.F.N.; project administration, I.F.N., A.W., S.M.Q. and A.T.A.; funding acquisition, A.T.A. and S.M.Q. All authors have read and agreed to the submitted version of the manuscript.

Funding

This research work is supported by the Effat University, Jeddah, 22332, Saudi Arabia.

Institutional Review Board Statement

Not applicable.

Informed Consent Statement

This article does not contain any studies with human participants or animals performed by any of the authors.

Data Availability Statement

Dataset related to this article can be found at link1: https://doi.org/10.17632/syt3yrr7f5.1 or link2: https://data.mendeley.com/datasets/syt3yrr7f5/1 an open-source online data repository hosted at Mendeley Data.

Acknowledgments

The research is technically supported by Bahria University and Effat University. The authors acknowledge the financial support from the Supply Chain Management Department of the Effat University and from the Electrical and Computer Engineering Department of the Effat University under Grant No. UC#9/2June2021/7.2-21(3)5, Effat University, Jeddah, Saudi Arabia.

Conflicts of Interest

The authors declare no conflict of interest.

Abbreviations

The following abbreviations are used in this manuscript:
MILPMixed Integer Linear Programming
RERenewable Energy
DGENsDistributed Generation market demand models
DERsDistributed Energy Resources
BESSBattery Energy Storage System
GAMSGeneric Algebraic Modelling System
ELMExtreme Learning Machine
NPCNet Present Cost
L-SVRLinear Support Vector Regression
PVPhotovoltaic
HSHarmony Search
ESEvolutionary Search
GSGenetic Search
PSOParticle Swarm Optimization
SVRSupport Vector Regression
SROCCSpearman Ranked Correlation Coefficient
KCCKendal Correlation Constant
LCCLinear Correlation Constant

Appendix A. Generation Techniques’ Factors and External Factors

Sr. No.ParameterDescription
1.Photovoltaic (PV)It is the power made available by Photovoltaic cells
power generation
2.Distributed generationIt is for the analysis of the factors that affect the future market
market demand (DGEN)demands for energy resources
3.Hoppecke 6 OPzS 300It is a 300 Ah battery, with dimensions of about 147 × 208 × 420
mm, and weighs about 24.9 kg
4.ConverterIt is the typical rating of the power inversion of an operation
inverter.
5.Total Capital Cost (TCC)The project overhead costs and the running costs would sum up
the TCC
6.Unmet Load FractionIt is the proportion of the total annual electrical load that went
unserved because of insufficient generation for the system
7.Total net present costIt is an economic parameter used for decision-making when
(TNPC)doing a feasibility study on the power model
8.Total EmissionsIt is the volume of effluents that are released by a project into the
environment
9.Total annual capital costit is the project lifetime cost of operations.
(TACC)
10.Total annual replacement costIt is the annual cost of the replacement for the various components
(TARC)that will be used for the grid system
11.Total operations & maintenanceIt is the annual cost of the operation and maintenance
cost (TOMC)
12.Total fuel cost (TFC)It is the cost of fuel, which can be fossil-based or gases
13.Total annual cost (TAC)It is the total annual cost of operations
14.Operating costIt is the cost of factors for production that are used for the
generation of the power for 1 year
15.Cost of energy (COE)It is the average cost per kWh of useful electrical energy
16.Photovoltaic (PV) ProductionIt is the average projection of the photovoltaic cell power
production
17.Distributed generation productionIt is a tool is developed for the analysis of the factors that affect
(dGENP)the future market production of energy resources
18.Grid purchases (GP)It is the cost incurred for the acquisition of power into the grid this
is payable to the production companies
19.Grid net purchases (GNP)It is the cost minus the working expenses for the grid production
of power
20.Total electrical productionIt is the peak value of the power produced for the grid system
(TEP)that can be converted to useful power
21.AC primary Load ServedIt is the total amount of energy that can be used towards serving
(AC-PLS)the AC primary load(s) for a year
22.Deferrable load served (DLS)It is the electrical load that requires a certain amount of
energy for a given time
23.Renewable fraction (RF)It is the renewable fraction i.e., the ratio of the nonrenewable to
the total electrical energy served to a specified load
24.Capacity shortage (CS)It is the total amount of capacity energy shortage that occurs
throughout the year
25.Unmet load (UL)It is termed as the fraction for the proportion of the total
annual electrical load that arises from the insufficient generation
26.Unmet load fraction (ULF)It is the ratio of the working power load to the unmet load
27.Excess electricity (EE)It is the surplus power that is produced by a system based
on the estimated base loads for a given duration
28.DieselIt evaluates the volumetric consumption of diesel for a given
duration
29.Carbon dioxideIt is the deposition of CO2 as effluent into the air in terms of
(CO2) Emissionsweight per given duration
30.Carbon mono oxideIt is the deposition of CO (carbon monoxide gas) as effluent
(CO) Emissionsinto the air in terms of weight per given duration
31.UHC EmissionsIt is the emission of the Unburned Hydrocarbons as effluent
into the air in terms of weight per given duration
32.Particulate matterIt is a feature that investigates the emissions of the PM as effluent into
(PM) Emissionsthe air in terms of weight per given duration
33.Sulfur dioxideIt is the deposition of SO2 gas as effluent into the air in terms
(SO2) Emissionsof weight per given duration
34.Nitrogen oxideIt is a feature that investigates the emissions of the Nitrogen Oxides
(NOx) Emissions(NOx) as effluent into the air in terms of weight per given duration
35.Distributed generation marketIt is a feature that evaluates the distributed generation of the fuel, and
demand (DGEN) model Fuelit is expressed as liters per year
36.Distributed generation marketIt evaluates the Distributed Generation in terms of active hours
demand (DGEN) model Hoursto produce electricity for a given duration
37.Distributed generation marketIt analyzes the working statistics for the Distributed Generation
demand (DGEN) model starts/yrof the power system for a given year
38.Distributed generation marketIt analyzes the working life for the Distributed Generation of the
demand (DGEN) model Lifepower system for a given year
39.Battery ThroughputIt is the lifetime of the battery in years that is worked out by
dividing the energy level by the duration
40.Battery LifeIt is the estimated working life of the battery under which it can
operate.
The Ranker search algorithm selects 29 features i.e., the feature numbers corresponding to Appendix A are 2, 3, 4, 5, 6, 7, 8, 9, 10, 11, 21, 23, 24, 25, 26, 27, 28, 29, 30, 31, 32, 33, 34, 35, 36, 37, 38, 39, 40., Particle swarm optimization selects 14 features i.e., the feature number corresponding to Appendix A are 3, 10, 15, 22, 23, 27, 31, 33, 34, 36, 37, 38, 39, 40. Linear forward selection selects six features i.e., the feature numbers corresponding to Appendix A are 22, 27, 36, 37, 39, 40. Harmony search selects 8 features i.e, the feature numbers corresponding to Appendix A are 15, 22, 27, 34, 36, 37, 39, 40. Evolutionary search selects 12 features i.e., the feature numbers are 1, 6, 10, 15, 20, 27, 31, 36, 37, 38, 39, 40. The Genetic search algorithm selects 11 features i.e., the feature numbers are 4, 15, 22, 23, 27, 30, 34, 36, 37, 39, 40. Feature numbers 12, 13, 14, 16, 17, 18, and 19 are selected by no feature selection algorithm. Feature numbers 1, 2, 5, 7, 8, 9, 11, 20, 21, 24, 25, 26, 28, 29, 32, 35 are selected by only one feature selection algorithm. Feature numbers 3, 4, 6, 31, and 33 are selected by two feature selection algorithms. Feature numbers 10, 23, 30, and 38 are selected by three feature selection algorithms. Feature numbers 15, 22, and 34 are selected by four feature selection algorithms. Feature numbers 27, 36, 37, 39, and 40 are selected by all six feature selection algorithms.
Ranker search shows the best performance and selects 29 features, so let us discuss the importance of these features one by one. The first selected feature is distributed generation market demand. It is important because the future market demands of energy affect battery autonomy. The second selected feature is Hoppecke 6 OPzS 300. It defines the battery and thus it is important for battery autonomy. The third feature is the converter, and it helps in computing battery autonomy because it gives the power inversion of an operation inverter. The fourth selected feature is total capital cost, and it is important because cost plays a vital role in optimal battery sizing and computing battery autonomy. The fifth selected feature is unmet load fraction, and it helps in battery sizing because it helps in determining the portion of the total load that went unserved. The total net present cost is the sixth selected feature, and it helps in battery sizing since the total net present cost has a significant impact on the size of the battery to be utilized. The seventh selected feature is the total emissions, and they impact the battery size because the allowable emissions will help in determining the battery size. Total annual capital cost is the next selected feature and the total annual cost will help in determining the size of the battery to be used. The tenth selected feature is total operations and maintenance cost and since the batteries may require maintenance so it is important for determining the battery size. The next selected feature is AC primary load served, and it helps in battery sizing because the size of the battery also depends on the AC load to be served. The twelfth selected feature is the renewable factor and knowing the fraction of load being served by the renewable energy will impact the battery size. The next selected feature is a capacity shortage and knowing the energy capacity shortage can help us in determining the size of the battery to reduce the capacity shortage. The fourteenth and fifteenth selected features are unmet load and unmet load fraction, respectively, and they can help in determining the size of the battery to minimize the effects of insufficient generation. Excess electricity is the next selected feature, and it can help in battery sizing because the excess power may be stored in batteries for use at a later time when more energy is required. The seventeenth selected feature is diesel and the volumetric use of diesel in a system has an impact on the size of the battery to be used in the system. The next three selected features are carbon dioxide, carbon mono oxide, and unburned hydrocarbons emissions, respectively, and, with global warming, checks are being put in place for carbon emissions. The limit of allowable carbon emissions for a system will impact the size of the battery being utilized. The next three selected features are particulate matter, sulfur dioxide, and nitrogen oxide emissions as effluent into the air, respectively, and, since they can cause serious health issues, therefore we would want these emissions to be minimized and an appropriate battery size can help in doing so; therefore, these emissions will impact the battery size. The next selected feature is distributed generation market demand fuel and, since the distributed generation of fuel for a system is affected by the battery size, thus, vice versa, the battery size will be affected by the distributed generation fuel. The next selected feature is distributed generation market demand hours, and the battery size will be affected by the number of hours the distributed generation model is active. If it remains active for a longer time, we may require larger batteries, and, if it remains active for a shorter time, we may require smaller batteries. Distributed generation market demand model stats/years is the next selected feature, and, since it gives the statistics of the system, it will help in determining the size of the battery. The next selected feature is distributed generation market demand model life, and, since it analyzes the working life of the distributed generation power system, it may therefore be used to determine the size of the battery. The next selected feature is battery throughput, which is the lifetime of a battery in years, and it directly affects the battery size because, if a lifetime is smaller for a battery, we will require a larger battery and, if the lifetime is larger, we may require a smaller battery. The last selected feature of the battery is battery life, which defines the estimated working life of a battery, and, since it is a direct parameter of the battery, it will affect the battery size. It can be observed that excess electricity, distributed generation market demand model hours, distributed generation market demand model life, battery throughput, and battery life are selected by all the six feature selection algorithms, whereas operating cost, deferrable load served, and nitrogen oxide emissions are selected by four feature selection algorithms each. The total annual replacement cost, renewable fraction, carbon mono oxide emissions, and distributed generation market demand model life are selected by three feature selection algorithms each.

References

  1. Houran, M.A.; Yang, X.; Chen, W. Energy management of microgrid in smart building considering air temperature impact. In Proceedings of the 2018 IEEE Applied Power Electronics Conference and Exposition (APEC), San Antonio, TX, USA, 4–8 March 2018; pp. 2398–2404. [Google Scholar]
  2. Klansupar, C.; Chaitusaney, S. Optimal Sizing of Utility-scaled Battery with Consideration of Battery Installation Cost and System Power Generation Cost. In Proceedings of the 2020 17th International Conference on Electrical Engineering/Electronics, Computer, Telecommunications, and Information Technology (ECTI-CON), Phuket, Thailand, 24–27 June 2020; pp. 498–501. [Google Scholar]
  3. Sobon, J.; Stephen, B. Model-Free Non-Invasive Health Assessment for Battery Energy Storage Assets. IEEE Access 2021, 9, 54579–54590. [Google Scholar] [CrossRef]
  4. Zhang, N.; Yang, N.-C.; Liu, J.-H. Optimal Sizing of PV/Wind/Battery Hybrid Microgrids Considering Lifetime of Battery Banks. Energies 2021, 14, 6655. [Google Scholar] [CrossRef]
  5. Takano, H.; Hayashi, R.; Asano, H.; Goda, T. Optimal Sizing of Battery Energy Storage Systems Considering Cooperative Operation with Microgrid Components. Energies 2021, 14, 7442. [Google Scholar] [CrossRef]
  6. Hoyos-Velandia, C.; Ramirez-Hurtado, L.; Quintero-Restrepo, J.; Moreno-Chuquen, R.; Gonzalez-Longatt, F. Cost Functions for Generation Dispatching in Microgrids for Non-Interconnected Zones in Colombia. Energies 2022, 15, 2418. [Google Scholar] [CrossRef]
  7. Belboul, Z.; Toual, B.; Kouzou, A.; Mokrani, L.; Bensalem, A.; Kennel, R.; Abdelrahem, M. Multiobjective Optimization of a Hybrid PV/Wind/Battery/Diesel Generator System Integrated in Microgrid: A Case Study in Djelfa, Algeria. Energies 2022, 15, 3579. [Google Scholar] [CrossRef]
  8. Cano, A.; Arévalo, P.; Jurado, F. A comparison of sizing methods for a long-term renewable hybrid system. Case study: Galapagos Islands 2031. Sustain. Energy Fuels 2021, 5, 1548–1566. [Google Scholar] [CrossRef]
  9. Kumar, J.; Parthasarathy, C.; Västi, M.; Laaksonen, H.; Shafie-Khah, M.; Kauhaniemi, K. Sizing and Allocation of Battery Energy Storage Systems in Åland Islands for Large-Scale Integration of Renewables and Electric Ferry Charging Stations. Energies 2020, 13, 317. [Google Scholar] [CrossRef] [Green Version]
  10. Hannan, M.; Faisal, M.; Jern Ker, P.; Begum, R.; Dong, Z.; Zhang, C. Review of optimal methods and algorithms for sizing energy storage systems to achieve decarbonization in microgrid applications. Renew. Sustain. Energy Rev. 2020, 131, 110022. [Google Scholar] [CrossRef]
  11. El-Bidairi, K.; Nguyen, H.; Mahmoud, T.; Jayasinghe, S.; Guerrero, J. Optimal sizing of Battery Energy Storage Systems for dynamic frequency control in an islanded microgrid: A case study of Flinders Island, Australia. Energy 2020, 195, 117059. [Google Scholar] [CrossRef]
  12. Yang, Z.; Xia, L.; Guan, X. Fluctuation Reduction of Wind Power and Sizing of Battery Energy Storage Systems in Microgrids. IEEE Trans. Autom. Sci. Eng. 2020, 17, 1195–1207. [Google Scholar] [CrossRef]
  13. Gao, T.; Lu, W. Machine learning toward advanced energy storage devices and systems. iScience 2021, 24, 101936. [Google Scholar] [CrossRef] [PubMed]
  14. Boonluk, P.; Siritaratiwat, A.; Fuangfoo, P.; Khunkitti, S. Optimal Siting and Sizing of Battery Energy Storage Systems for Distribution Network of Distribution System Operators. Batteries 2020, 6, 56. [Google Scholar] [CrossRef]
  15. Talent, O.; Du, H. Optimal sizing and energy scheduling of photovoltaic-battery systems under different tariff structures. Renew. Energy 2018, 129, 513–526. [Google Scholar] [CrossRef]
  16. Prabpal, P.; Kongjeen, Y.; Bhumkittipich, K. Optimal Battery Energy Storage System Based on VAR Control Strategies Using Particle Swarm Optimization for Power Distribution System. Symmetry 2021, 13, 1692. [Google Scholar] [CrossRef]
  17. Gupta, Y.; Vaidya, R.; Kumar Nunna, H.; Kamalasadan, S.; Doolla, S. Optimal PV—Battery Sizing for Residential and Commercial Loads Considering Grid Outages. In Proceedings of the IEEE International Conference on Power Electronics, Smart Grid and Renewable Energy (PESGRE2020), Cochin, India, 2–4 January 2020. [Google Scholar] [CrossRef]
  18. Lazaar, N.; Fakhri, E.; Barakat, M.; Sabor, J.; Gualous, H. A Genetic Algorithm Based Optimal Sizing Strategy for PV/Battery/Hydrogen Hybrid System. In Proceedings of the International Conference onArtificial Intelligence and Industrial Applications, Meknes, Morocco, 19–20 March 2020; pp. 247–259. [Google Scholar]
  19. Xie, S.; Zhang, Q.; Hu, X.; Liu, Y.; Lin, X. Battery sizing for plug-in hybrid electric buses considering variable route lengths. Energy 2021, 226, 120368. [Google Scholar]
  20. Mirhoseini, P.; Ghaffarzadeh, N. Economic battery sizing and power dispatch in a grid-connected charging station using convex method. J. Energy Storage 2020, 31, 101651. [Google Scholar] [CrossRef]
  21. Sampietro, J.L.; Puig, V.; Costa-Castelló, R. Optimal sizing of storage elements for a vehicle based on fuel cells, supercapacitors, and batteries. Energies 2019, 12, 925. [Google Scholar] [CrossRef] [Green Version]
  22. Nuhic, A.; Terzimehic, T.; Soczka-Guth, T.; Buchholz, M.; Dietmayer, K. Health diagnosis and remaining useful life prognostics of lithium-ion batteries using data-driven methods. J. Power Sources 2013, 239, 680–688. [Google Scholar] [CrossRef]
  23. Wu, J.; Zhang, C.; Chen, Z. An online method for lithium-ion battery remaining useful life estimation using importance sampling and neural networks. Appl. Energy 2016, 173, 134–140. [Google Scholar] [CrossRef]
  24. Kanwal, S.; Khan, B.; Ali, S.M. Machine learning based weighted scheduling scheme for active power control of hybrid microgrid. Int. J. Electr. Power Energy Syst. 2021, 125, 106461. [Google Scholar] [CrossRef]
  25. Jayashree, S.; Malarvizhi, K. Methodologies for Optimal Sizing of Battery Energy Storage in Microgrids: A Comprehensive Review. In Proceedings of the International Conference on Computer Communication and Informatics (ICCCI), Coimbatore, India, 22–24 January 2020. [Google Scholar] [CrossRef]
  26. Tang, R.; Yildiz, B.; Leong, P.H.; Vassallo, A.; Dore, J. Residential battery sizing model using net meter energy data clustering. Appl. Energy 2019, 251, 113324. [Google Scholar] [CrossRef]
  27. Abba, S.I.; Rotimi, A.; Musa, B.; Yimen, N.; Kawu, S.J.; Lawan, S.M.; Dagbasi, M. Emerging Harris Hawks Optimization based load demand forecasting and optimal sizing of stand-alone hybrid renewable energy systems—A case study of Kano and Abuja, Nigeria. Results Eng. 2021, 12, 100260. [Google Scholar] [CrossRef]
  28. Hassan, Q.; Pawela, B.; Hasan, A.; Jaszczur, M. Optimization of Large-Scale Battery Storage Capacity in Conjunction with Photovoltaic Systems for Maximum Self-Sustainability. Energies 2022, 15, 3845. [Google Scholar] [CrossRef]
  29. Chiang, M.-Y.; Huang, S.-C.; Hsiao, T.-C.; Zhan, T.-S.; Hou, J.-C. Optimal Sizing and Location of Photovoltaic Generation and Energy Storage Systems in an Unbalanced Distribution System. Energies 2022, 15, 6682. [Google Scholar] [CrossRef]
  30. Driebeek, N.J. An algorithm for the solution of mixed integer programming problems. Manag. Sci. 1966, 12, 485–625. [Google Scholar] [CrossRef]
  31. Fareeha, A.; Waqar, A.; Elavarasan, R.M.; Md Rabiul, I.; Md Moktadir, R.; Muhammad, Z. New Method for Battery Sizing in Microgrids by Seeing Battery Autonomy as a Chance Constraint. In Proceedings of the 2021 31st Australasian Universities Power Engineering Conference (AUPEC), Perth, Australia, 26–30 September 2021; pp. 1–6. [Google Scholar]
  32. Pilati, F.; Lelli, G.; Regattieri, A.; Gamberi, M. Intelligent management of hybrid energy systems for techno-economic performances maximisation. Energy Convers. Manag. 2020, 224, 113329. [Google Scholar] [CrossRef]
  33. Mehrtash, M.; Capitanescu, F.; Heiselberg, P. An Efficient Mixed-Integer Linear Programming Model for Optimal Sizing of Battery Energy Storage in Smart Sustainable Buildings. In Proceedings of the 2020 IEEE Texas Power and Energy Conference (TPEC), College Station, TX, USA, 6–7 February 2020; pp. 1–6. [Google Scholar] [CrossRef]
  34. Bagheri-Sanjareh, M.; Nazari, M.; Gharehpetian, G. A Novel and Optimal Battery Sizing Procedure Based on MG Frequency Security Criterion Using Coordinated Application of BESS, LED Lighting Loads, and Photovoltaic Systems. IEEE Access 2020, 8, 95345–95359. [Google Scholar] [CrossRef]
  35. Elnozahy, A.; Ramadan, H.S.; Abo-Elyousr, F.K. Efficient metaheuristic Utopia-based multi-objective solutions of optimal battery-mix storage for microgrids. J. Clean. Prod. 2021, 303, 127038. [Google Scholar] [CrossRef]
  36. Ye, L.; Wu, X.; Du, J.; Song, Z.; Wu, G. Optimal sizing of a wind-energy storage system considering battery life. Renew. Energy 2020, 147, 2470–2483. [Google Scholar]
  37. Liu, W.; Yan, L.; Zhang, X.; Gao, D.; Chen, B.; Yang, Y.; Jiang, F.; Huang, Z.; Peng, J. A Denoising SVR-MLP Method for Remaining Useful Life Prediction of Lithium-ion Battery. In Proceedings of the 2019 IEEE Energy Conversion Congress and Exposition (ECCE), Baltimore, MD, USA, 29 September–3 October 2019; pp. 545–550. [Google Scholar]
  38. Qaisar, S.M. EEfficient mobile systems based on adaptive rate signal processing. Comput. Electr. Eng. 2019, 79, 1062–1070. [Google Scholar] [CrossRef]
  39. Mian Qaisar, S. Signal-piloted processing and machine learning based efficient power quality disturbances recognition. PLoS ONE 2021, 16, e0252104. [Google Scholar] [CrossRef] [PubMed]
  40. Mian Qaisar, S.; Alsharif, F. Signal piloted processing of the smart meter data for effective appliances recognition. J. Electr. Eng. Technol. 2020, 15, 2279–2285. [Google Scholar] [CrossRef]
  41. Mian Qaisar, S. Event-driven coulomb counting for effective online approximation of Li-ion battery state of charge. Energies 2020, 13, 5600. [Google Scholar] [CrossRef]
  42. Peng, X.; Zhang, C.; Yu, Y.; Zhou, Y. Battery remaining useful life prediction algorithm based on support vector regression and unscented particle filter. In Proceedings of the 2016 IEEE International Conference on Prognostics and Health Management (ICPHM), Ottawa, ON, Canada, 20–22 June 2016; pp. 1–6. [Google Scholar]
  43. Ali, A.Y.; Basit, A.; Ahmad, T.; Qamar, A.; Iqbal, J. Optimizing coordinated control of distributed energy storage system in microgrid to improve battery life. Comput. Electr. Eng. 2020, 86, 106741. [Google Scholar] [CrossRef]
  44. Seyed, A.F.; Ardalan, V. Mixed-Integer Linear Programming for Optimal Scheduling of Autonomous Vehicle Intersection Crossing. IEEE Trans. Intell. Veh. 2018, 3, 287. [Google Scholar]
  45. Adriana, C.L.; Nelson, L.D.; Moises, G.; Juan, C.V.; Josep, M.G. Mixed-integer- linear-programming-based energy management system for hybrid PV-wind-battery microgrids: Modeling, design, and experimental verification. IEEE Trans. Power Electron. 2017, 32, 2769–2783. [Google Scholar]
  46. Hossein, S.; Majid, M.; SHamid, F.; Gevork, B.G. Optimal sizing and energy management of a grid connected microgrid using homer software. In Proceedings of the Smart Grids Conference 2016, Kerman, Iran, 20–21 December 2016; pp. 20–21. [Google Scholar]
  47. Sung, M.; Ko, Y. Machine-learning-integrated load scheduling for reduced peak power demand. IEEE Trans. Consum. Electron. 2015, 6, 167–174. [Google Scholar] [CrossRef]
  48. Lu, B.; Shahidehpour, M. Short-term scheduling of battery in a grid-connected PV/battery system. IEEE Trans. Power Syst. 2005, 20, 1053–1061. [Google Scholar] [CrossRef]
  49. Elavarasan, R.M.; Shafiullah, G.M.; Padmanaban, S.; Kumar, N.M.; Annam, A.; Vetrichelvan, A.M.; Holm-Nielsen, J.B. A Comprehensive Review on Renewable Energy Development, Challenges, and Policies of Leading Indian States with an International Perspective. IEEE Access 2020, 8, 74432–74457. [Google Scholar] [CrossRef]
  50. Momete, D.C. Analysis of the Potential of Clean Energy Deployment in the European Union. IEEE Access 2018, 6, 54811–54822. [Google Scholar] [CrossRef]
  51. Papadaskalopoulos, D.; Pudjianto, D.; Strbac, G. Decentralized Coordination of Microgrids with Flexible Demand and Energy Storage. IEEE Trans. Sustain. Energy 2014, 5, 1406–1414. [Google Scholar] [CrossRef]
  52. Ganesan, S.; Subramaniam, U.; Ghodke, A.A.; Elavarasan, R.M.; Raju, K.; Bhaskar, M.S. Investigation on Sizing of Voltage Source for a Battery Energy Storage System in Microgrid with Renewable Energy Sources. IEEE Access 2020, 8, 188861–188874. [Google Scholar] [CrossRef]
  53. Wang, Y.; Li, Y.; Jiang, L.; Huang, Y.; Cao, Y. PSO-based optimization for constant- current charging pattern for li-ion battery. Chin. J. Electr. Eng. 2019, 5, 72–78. [Google Scholar] [CrossRef]
  54. Kolluri, R.; de Hoog, J. Adaptive Control Using Machine Learning for Distributed Storage in Microgrids. In Proceedings of the Eleventh ACM International Conference on Future Energy Systems, Virtual, 22–26 June 2020. [Google Scholar]
  55. Shivam, K.; Tzou, J.; Wu, S. A multi-objective predictive energy management strategy for residential grid-connected PV-battery hybrid systems based on machine learning technique. Energy Convers. Manag. 2021, 237, 114103. [Google Scholar] [CrossRef]
  56. Khorramdel, H.; Aghaei, J.; Khorramdel, B.; Siano, P. Optimal battery sizing in microgrids using probabilistic unit commitment. IEEE Trans. Ind. Inform. 2015, 12, 834–843. [Google Scholar] [CrossRef]
  57. Waqar, A.; Wang, S.; Khalid, M.S.; Shi, X. Multi-objective chance constrained programming model for operational-planning of V2G integrated microgrid. In Proceedings of the 2015 5th International Conference on Electric Utility Deregulation and Restructuring and Power Technologies (DRPT), Changsha, China, 26–29 November 2015; pp. 443–448. [Google Scholar]
  58. Waqar, A.; Shaorong, W.; Samir, M.D.; Tao, T.; Yida, W. Optimal capacity expansion-planning of distributed generation in microgrids considering uncertainties. In Proceedings of the 2015 5th International Conference on Electric Utility Deregulation and Restructuring and Power Technologies (DRPT), Changsha, China, 26–29 November 2015; pp. 437–442. [Google Scholar]
  59. Waqar, A.; Muhammad, S.N.; Muhammad, A.; Imtiaz, A.; Syed, U.A.; Jehanzeb, A. Multi-objective analysis of DER sizing in microgrids using probabilistic modeling. In Proceedings of the 2019 International Conference on Electrical, Communication, and Computer Engineering (ICECCE), Swat, Pakistan, 24–25 July 2019; pp. 1–6. [Google Scholar]
Figure 1. Micro grid model under consideration.
Energies 15 07865 g001
Figure 2. Proposed methodology for optimum performance.
Energies 15 07865 g002
Figure 3. The performance comparison of feature selection algorithms in terms of LCC, SROCC, KCC, and RMSE scores.
Energies 15 07865 g003
Figure 4. Box plots for the performance comparison in terms SROCC score between six feature selection algorithms for predicting battery autonomy.
Energies 15 07865 g004
Figure 5. Scatter plots for the original vs. predicted battery autonomy scores (a) all features; (b) evolutionary search; (c) genetic search; (d) harmony search; (e) linear forward seection; (f) particle swarm optimization; (g) ranker search.
Energies 15 07865 g005
Table 1. Number of features selected by each feature selection algorithm.
Feature Selection AlgorithmNumber of Features Selected
All40
Ranker search29
Particle swarm optimization14
Linear forward search6
Harmony search8
Evolutionary search12
Genetic search11
Table 2. Performance comparison of feature selection algorithms.
Feature Selection AlgorithmLCCSROCCKCCRMSE
All0.37600.28930.21650.2152
Ranker0.97560.94520.84880.0525
PSO0.96450.92520.79830.0608
Linear forward0.94430.88460.73690.07518
Harmony search0.95280.90760.76850.0701
Evolutionary search0.96390.92290.79540.0613
Genetic search0.96400.92370.79590.0613
Table 3. Performance comparison of proposed methodology with state-of-the-art techniques.
TechniqueRMSE Score
Multi-Layer Perception [36]6.3000
Linear Support Vector Regression [37]2.4090
K-means clustering [24]0.7170
Support Vector Regression integrated with Harris Hawks Optimization [27]0.1961
Neural Network [26]0.4240
Proposed method ( P r a n k e r )0.0525
Publisher’s Note: MDPI stays neutral with regard to jurisdictional claims in published maps and institutional affiliations.

