Article

Last Mile Logistics Life Cycle Assessment: A Comparative Analysis from Diesel Van to E-Cargo Bike

by
Andrea Temporelli
*,
Paola Cristina Brambilla
,
Elisabetta Brivio
and
Pierpaolo Girardi
Ricerca Sistema Energetico—RSE Spa, Via R. Rubattino 54, 20134 Milan, Italy
*
Author to whom correspondence should be addressed.
Energies 2022, 15(20), 7817; https://doi.org/10.3390/en15207817
Submission received: 21 September 2022 / Revised: 12 October 2022 / Accepted: 19 October 2022 / Published: 21 October 2022

Abstract

:
With the proliferation of e-commerce, the field of last-mile logistics has grown increasingly, highlighting the need to manage the environmental consequences of this phenomenon, especially to achieve decarbonization targets for cities and to improve citizens’ quality of life. Within this framework, the authors carried out a last-mile logistics life cycle assessment, to analyse and compare different logistics vehicle options performing the same service in an urban context: an electric four-wheel cargo bike, an electric van, a plug-in hybrid van, and a diesel van. The assessment shows that the e-cargo bike performs better for all the impact categories considered. The second-best option is the e-van, while the diesel van shows the worst environmental results. Focusing on decarbonization, the replacement of a diesel van with an electric one or with an e-cargo bike allows a reduction of 173 g CO2 eq/km and 250 g CO2 eq/km, respectively. Similar results are obtained for Photochemical Ozone Formation with associated emissions of 0.18, 0.31, 0.45 and 0.49 g NMVOC eq/km for the e-cargo bike, e-van, plug in hybrid van and diesel van, respectively. The only exceptions are Human Health impact categories, Acidification and Respiratory inorganics, for which the plug-in hybrid van performs worst, and Resource use, Mineral and Metals, for which the electric van performs worst.

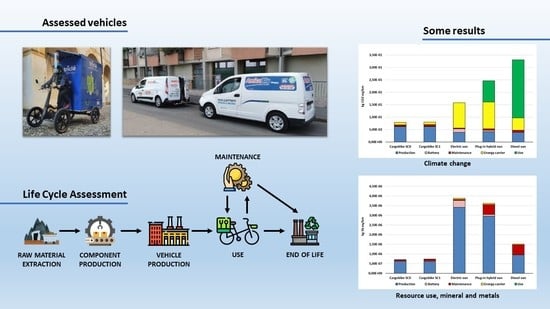
Graphical Abstract

1. Introduction

The European Union transport sector is responsible for about 25% of greenhouse gases emissions and 23% of these emissions are due to urban traffic [1].
Freight transport is responsible for 25% of CO2 emissions in urban areas and more than 50% of particulate emissions [2]. To reach the European Green Deal target of climate neutrality by 2050 [3] it is necessary to reduce transport climate change emissions by about 90%, a very challenging target that could be obtained with transport sector electrification. In urban areas, last-mile logistics is growing and gradually assuming a central and crucial role, also thanks to e-commerce diffusion [4]. Sustainable last-mile logistics can offer a substantial contribution to climate change emissions reduction and has the potential to mitigate other problems, such as local pollution and city congestion, that directly affect citizens’ quality of life [4].
So, it is important to find new technologies and strategies to make last mile logistics operations more and more sustainable. A relevant contribution could come from the introduction of alternative electric vehicles, such as electric vans [5] or, for deeper decarbonization, cargo bikes with electric pedal assist [6,7]. In this context, Life Cycle Assessment could be a suitable instrument to evaluate different vehicle options, identifying possible benefits and impacts related to different technologies.
Vans LCA or Life Cycle Assessment studies about last-mile logistics are not so common in the available literature. Furthermore, a recent study published by the European Commission [8] underlines the need for LCA studies including the vans sector. In our literature review, although it was perhaps not complete or exhaustive, we found only eleven studies published in the last ten years on LCA of vans or trucks, of which two do not present a complete Life Cycle Assessment [9,10] and two exclude the end-of-life of vehicles [11,12]. Only five studies rely on primary data at least for some phases of the lifecycle [11,12,13,14,15] but none of them do so for the vehicles’ use phase.
The assessed studies compare electric and traditional van performance, often considering many assumptions such as vehicle use, driving style, and electricity mix for battery recharge.
Many studies, assessing environmental impacts, evaluate vehicles performances only by considering Greenhouse Gas (GHG) emissions as an environmental impact category [9,13,14,16,17]; based on this impact category, light electric vans are competitive in last-mile logistics deliveries, especially in an urban context with frequent stop-and-go events [11,12,13,18]. Finally, only five studies deal with urban last-mile logistics [11,12,16,17,18] and only three [8,9,16] are focused on vans, while the remaining two are focused on larger vehicles, such as trucks.
Even fewer studies were found for what concerns the LCA of cargo bikes with pedal assist for last-mile logistics [19,20,21,22,23,24]. Only three of them perform a complete life cycle assessment and none of them rely on primary data for the use phase (only [20] uses primary data for the e-cargo bike Bill of Materials). The only environmental impact category considered in half of the studies is Climate Change (GWP), while [19] also considers Fossil Fuel consumption and Acidification, [22] considers Photochemical Ozone Formation Potential, and [23] includes NOx and PM emissions.
The available literature has not provided sufficient information and analysis concerning this type of vehicle, which may eventually replace our reliance on internal combustion engine vans for last mile logistics.
This paper aims to investigate and compare, within an LCA perspective, the performances of an electric four-wheel cargo bike, an electric, plug-in hybrid and a diesel van used for urban last-mile deliveries, addressing the lack of studies in the literature focusing on urban commercial vehicle life cycle assessment [25].
To obtain reliable results, two experimental activities were deployed: an electric cargo bike was monitored with GPS and an energy meter, during its real delivery service in the centre of Padua city; different vans (electric, plug-in hybrid, diesel) were monitored to obtain pollutant emissions and fuel consumption during their use phase.
These on-road measurements designed for the study (energy and fuel consumptions, exhaust emissions detection, GPS tracking) are some of the primary data used to characterise the assessed vehicles within the LCA model. Thanks to the data collection, the results are more coherent and generalisable to reality.
The present study fills the gaps in the literature (see Table S1 in Supplementary Materials) concerning the following point: it presents for the first time an LCA of a four-wheel e-cargo bike relying on primary data for construction and use (see Table S2 on Supplementary Materials), and it compares three vans (electric, diesel and petrol plug-in hybrid) using primary data for what concerns the use phase and, in particular, the energy consumption and exhaust air emissions that have been measured in the framework of an ad hoc test campaign.
The main features of the assessed vehicles are resumed in Table 1.

2. Life Cycle Assessment LCA

Life Cycle Assessment (LCA) is a well-spread quantitative methodology standardised by ISO 14040 [26] and ISO 14044 [27]. It is usually defined as a method for assessing the environmental impacts of a product or service considering its entire life cycle, from cradle to grave (and beyond if product reuse and recycling is included). According to ISO, an LCA is divided into four interdependent phases: Goal and scope definition, Life Cycle Inventory, Life Cycle Impact Assessment and Interpretation. Goal and scope definition includes the main parameters of the study such as the system boundaries, the environmental impact categories and indicators, and the functional unit, which is a quantitative measure of the function that the good (or service) studied provides. The goal and scope also include other useful information such as the reasons for performing the study, the intended application and the intended audience. Life cycle inventory (LCI) analysis is the part of the study that requires major efforts. It is a compilation of the inputs (resources such as energy and materials) and the outputs (emissions, waste…) of the product over its life cycle and for each life cycle step, in relation to the functional unit. It is usually a combination of primary data, which are data directly measured, and secondary data, which are data derived from literature and databases. Life cycle impact assessment (LCIA) is the phase in which LCA practitioners evaluate the magnitude and significance of the potential environmental impacts of the considered system using specific methods, which results in a weighted sum of the inputs and outputs compiled in the LCI. Interpretation evaluates the results from the previous phases in relation to the goal and scope to reach conclusions and, possibly, recommendations. The following sections are structured according to the main phases of an LCA study, as recommended in the ISO 14040 [26].

3. Goal and Scope

The goal of this study is to compare commercial vehicles performances, electric, plug-in hybrid and diesel vans and cargo bikes with pedal assist for the urban last-mile deliveries service.
The functional unit considered for the assessment is 1 km driven to complete a delivery in an urban area. According to the literature, the distance driven (km) rather than the payload (kg * km) is an appropriate functional unit, which indicates that the service given is the distance travelled for a delivery, regardless of the weight of the delivered packages [11,12,14,15,16,17,19,22] (See Table S1 of Supplementary Materials). More specifically, the EU Commission report “Determining the environmental impacts of conventional and alternatively fuelled vehicles through LCA” confirms this assumption [8].
For what concerns vehicle comparability, it is worth mentioning that the typical daily distance is about 60 km [28] (well below electric vans’ typical range) and that, in urban areas, commercial vehicles have a filling rate between 20% and 40% [25,29]. So, it is acceptable to assume that e-cargo bikes and vans can provide an equivalent service, considering that goods are delivered daily.
Impacts assessment is realised with a Cradle to Grave perspective, including all the phases of the vehicles’ life cycle: raw material extraction and processing, components production and assembly, energy carriers’ production and distribution, use phase, maintenance, and end of life. Only vehicle transport (and vehicle component transport) is excluded (Figure 1), being considered negligible.
The cut-off approach [30] is considered for the allocation, except for batteries. For these devices, due to their current low recycling rate, end-of-life recycled materials and environmental credit for secondary raw materials generated by the process are considered, following the methodology suggested in [31].
Environmental impact assessment is realised considering some of the midpoint indicators and characterization models proposed by the Environmental Footprint Impact Assessment Method (EF Method) developed by the Joint Research Centre [32,33].
According to the target of this work and the existing literature [34], eight impact categories were selected to account for environmental aspects (Climate Change; Photochemical Ozone Formation; Acidification terrestrial and freshwater), human health (Respiratory inorganics; Non-cancer human health effects; Cancer human health effects) and resource consumption (Resource use, energy carriers; Resource use, mineral and metals).
The Ecoinvent v3.3 database [30] is used for background and secondary data, and the assessed system is modelled with SimaPro software (© PRé Sustainability B.V., Amersfoort, The Netherlands).
Finally, unlike most literature studies, primary data are considered to characterise the use phase of the assessed vehicles. To this aim, delivery routes, distances travelled, pollutant emissions, energy and fuel consumptions were obtained through on-road measurements specifically designed for this study.

4. Life Cycle Inventory—LCI

4.1. E-Cargo Bike

E-cargo bike primary data considered for the LCA study were generated by monitoring (for 18 months) the vehicle, which was used by a logistics operator for last-mile deliveries in Padua city centre.
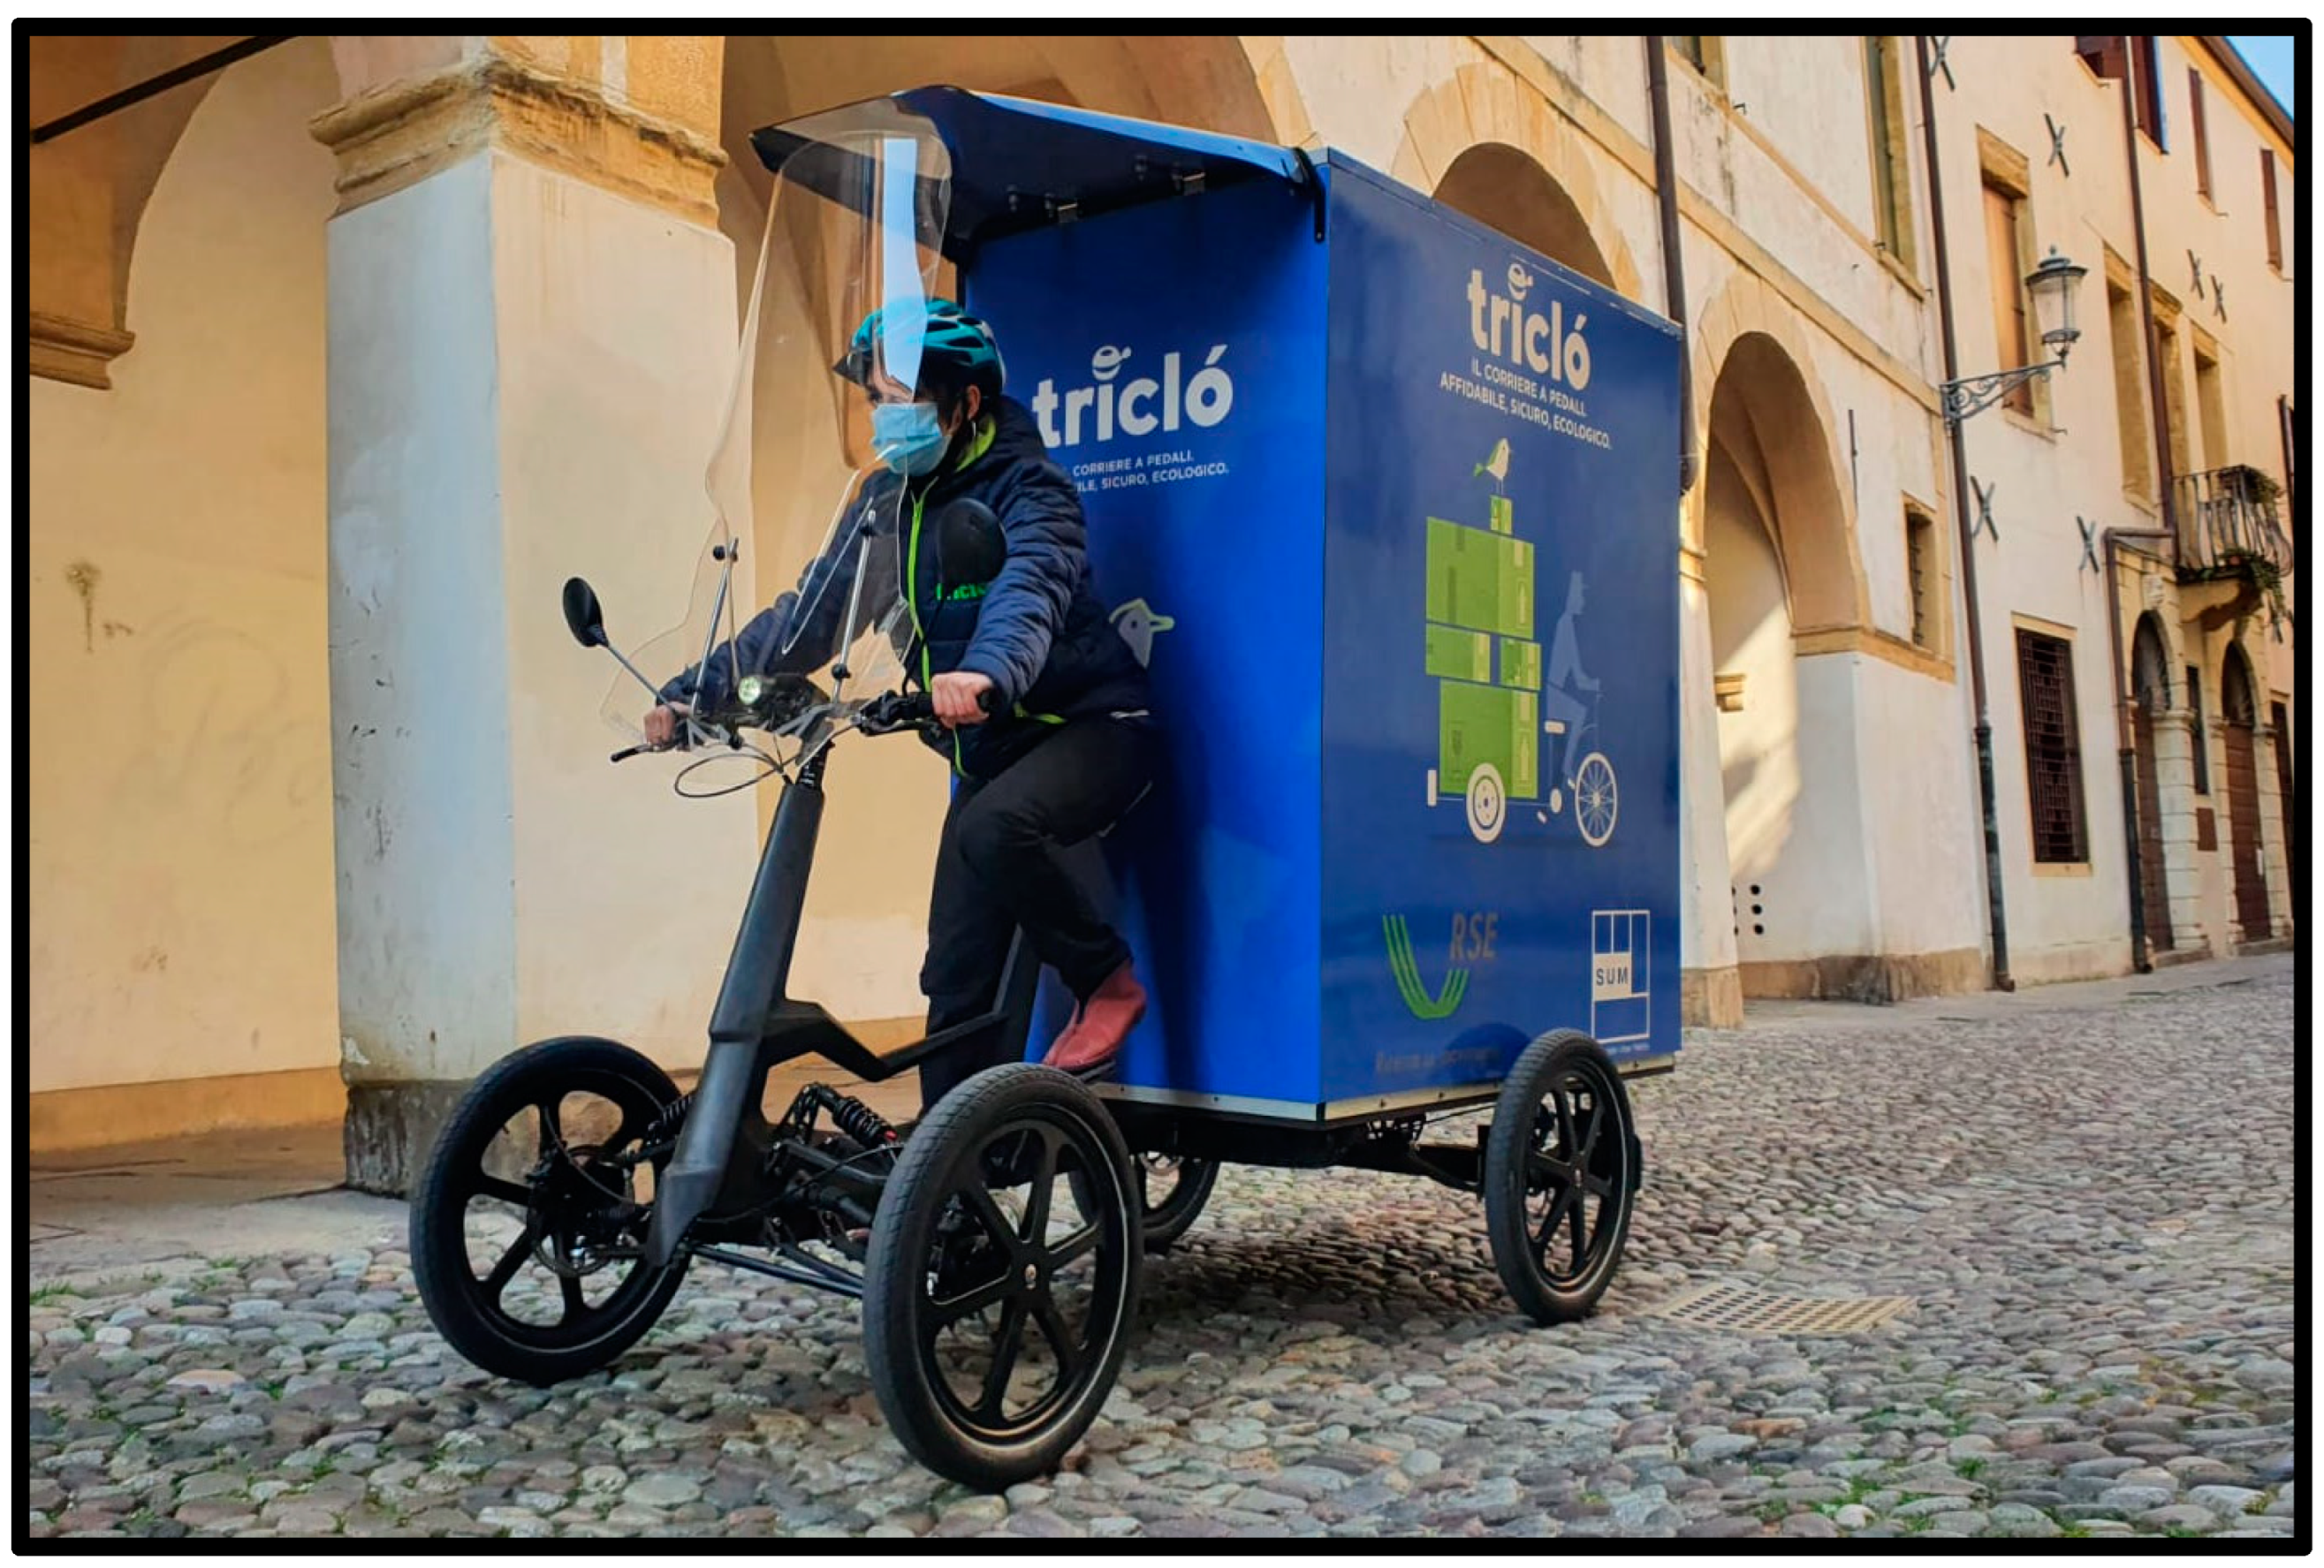
The e-cargo bike assessed is a quadricycle called SUM-X (Figure 2) produced by an Italian society which collaborated in the study (ONE LESS VAN s.r.l.—Mestre Venezia (VE), Italy), providing the Bill of Materials (BoMs) of the vehicle, which constitutes a second set of primary data.
This e-cargo bike is an innovative logistics solution for last-mile delivery in urban centres: it is a very stable vehicle, usable without any problems both on paved and cobbled roads, and has a considerable load capacity, comparable to traditional vans, and good battery autonomy.
The assessed e-cargo bike has a load capacity of about 250 kg and is equipped with a battery with 60 km of autonomy. Weekly based measurements confirm an average load of 200 kg. These features allow us to compare the e-cargo bike with the vans considered in this study: Nissan e-NV200 (Nissan Motor Co., Ltd., Yokohama, Japan) and Ford Transit Connect (Ford Motor Company, Dearborn, MI, USA). This assumption is acceptable because, as discussed above, urban freight vans have an average load factor between 20% and 40% [25,29] of the maximum load capacity (the capacity of a van, e.g., Nissan e-NV200, is about 740 kg and 4.2 m3; 20–40% corresponds to 150–300 kg and approximately 1.5 m3). It has been estimated that almost 51% of urban parcel delivery can be completed by conventional cargo bikes [35].
Thanks to the BoMs shared by the e-cargo bike manufacturer, it was possible to define the production phase with extreme accuracy: weight, numerousness, materials, and the country of production for every component were listed in the BoMs shared. Most of the components involved in the production phase are provided by Asian or European producers. All components are bought and then assembled by the e-cargo bike manufacturer in Italy. The vehicle assembly is realized manually, so this process did not need a large amount of energy.
For what concerns raw materials extraction, processing and related energy consumptions, Ecoinvent 3.3 (Ecoinvent, Technoparkstrasse 1 8005, Zurich, Switzerland) [30] has been used. Thanks to the information shared by the vehicle producer, especially the country of production, it was possible to identify the most suitable Ecoinvent datasets to model these processes.
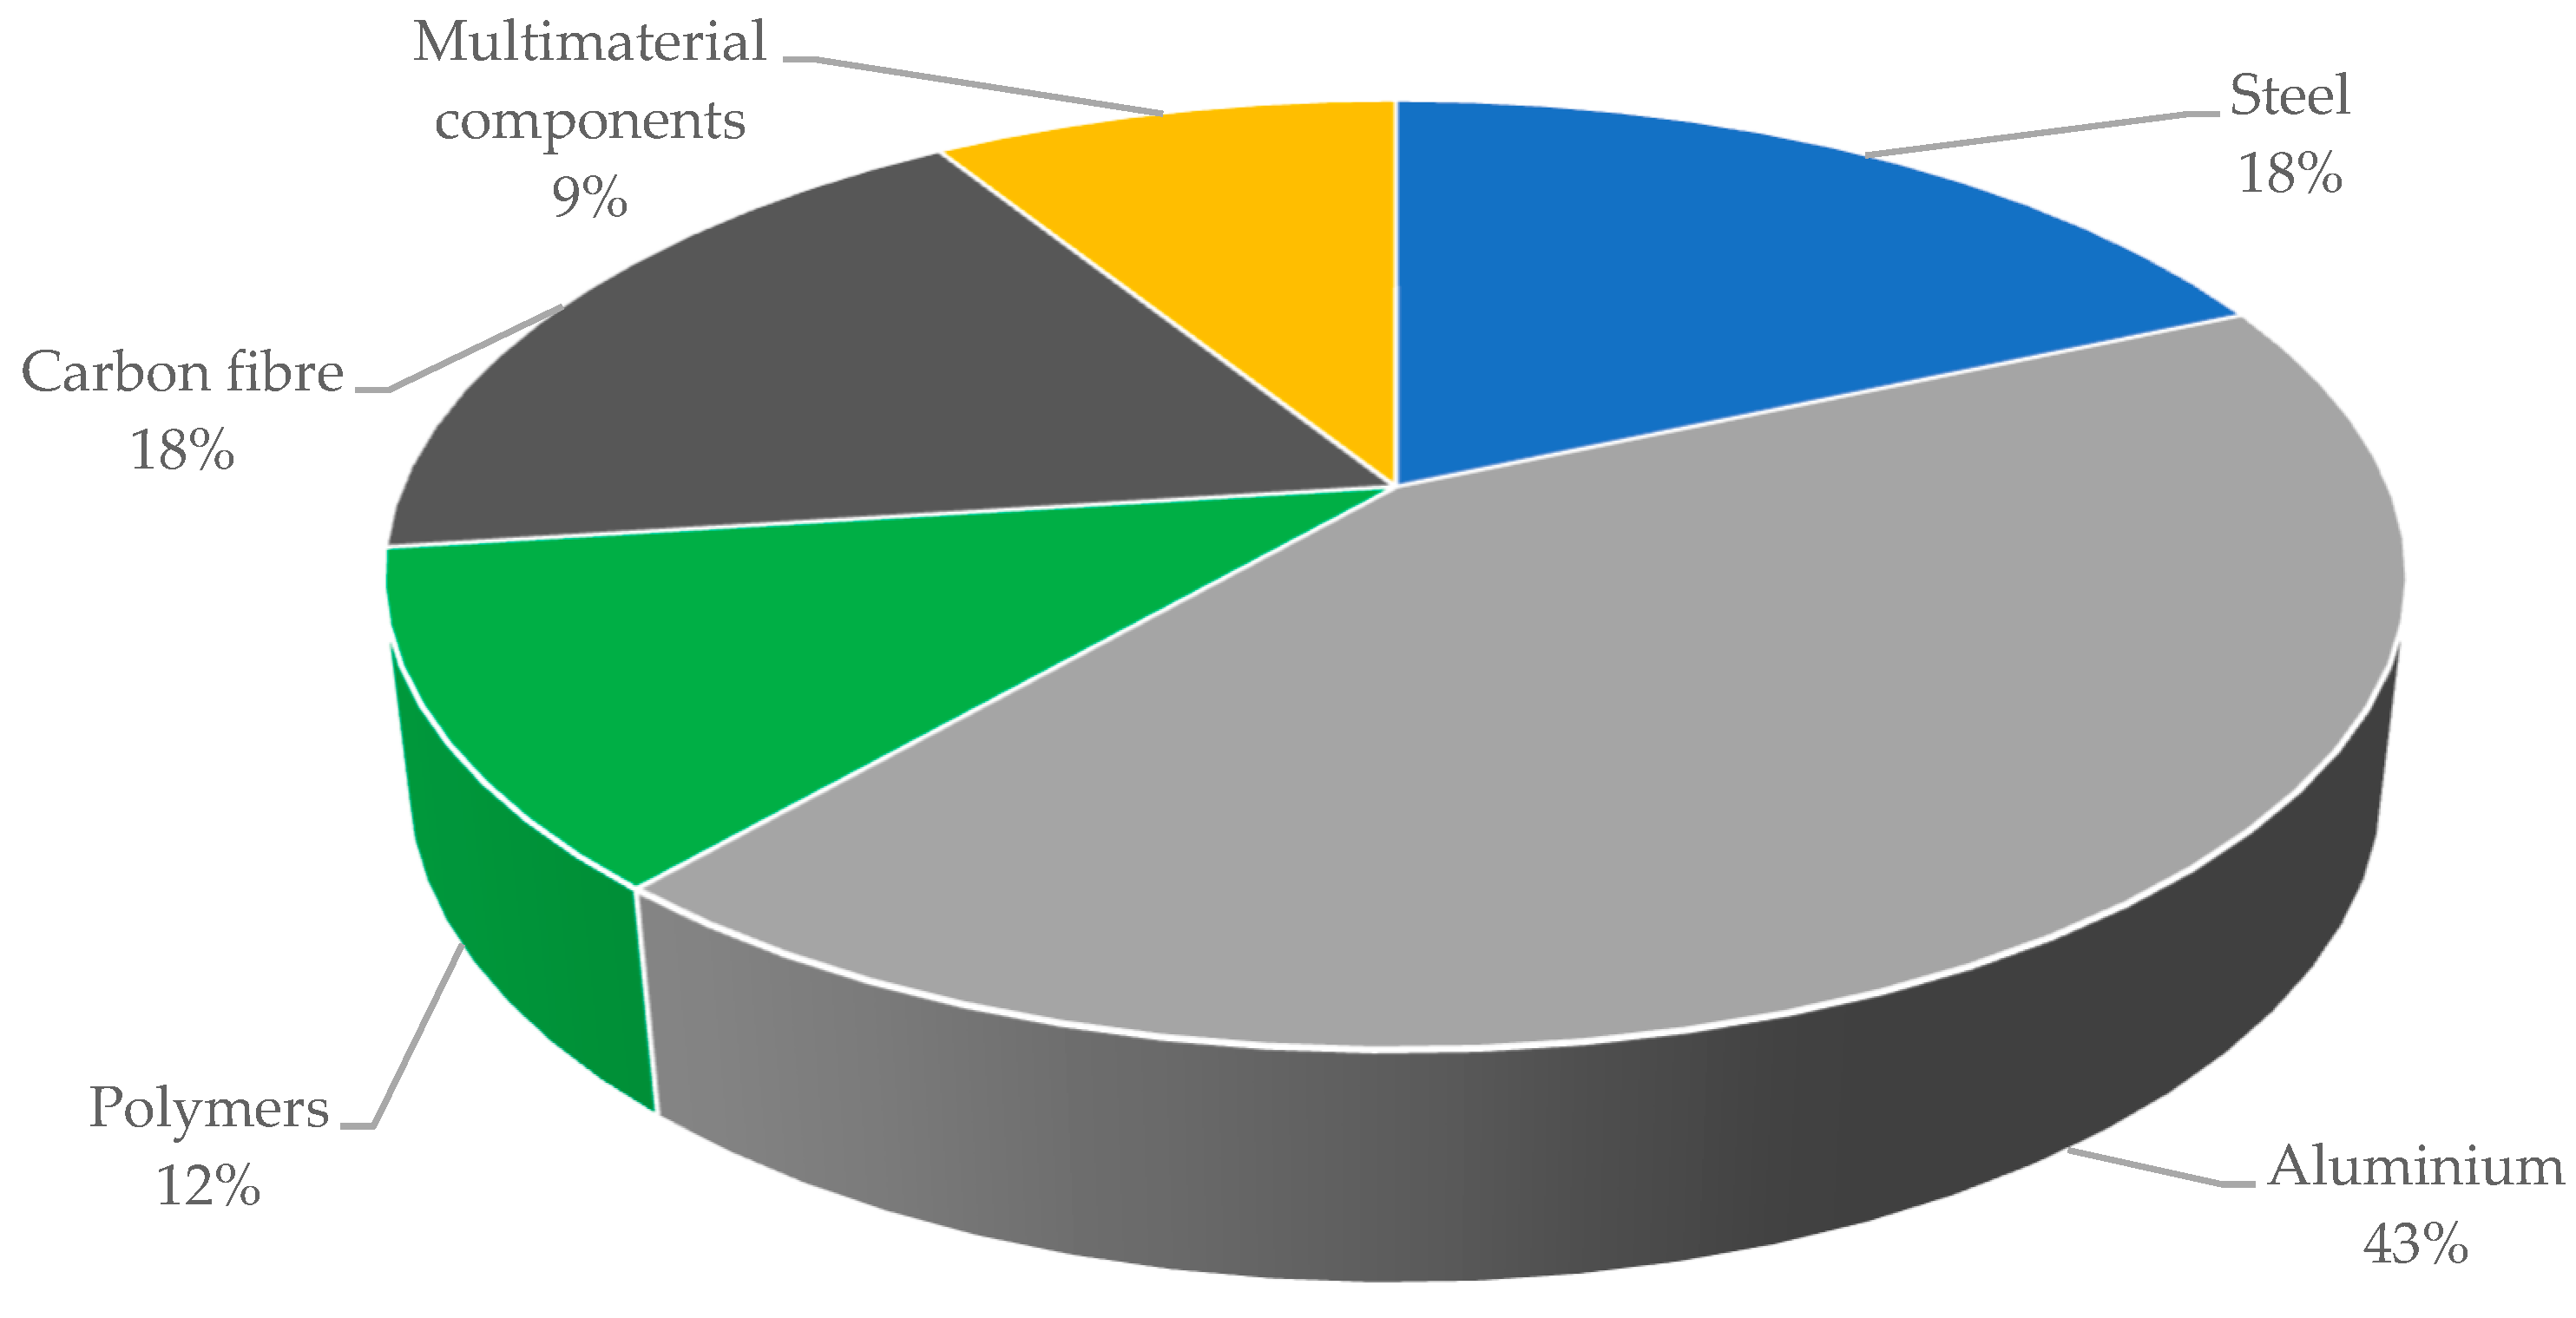
Considering the vehicle production phase, it is possible to observe that metals have the higher mass percentage (43% aluminium, 18% steel). Carbon fibre mass is also considerable, comprising approximately 18% of total weight, whereas “multi-material” components (such as display, engine, battery, brake pad, electronic, LED) are about 9% in mass. Finally, the remaining 12% is represented by plastic polymers. In Figure 3, the pie chart shows the mass percentage distribution of e-cargo bike materials.
Finally, for the e-cargo bike battery, the work of Carvalho et al. [31] was considered, in which primary data from Li-ion cells producers have been used.
The BoMs of the e-cargo bike and other details regarding the components considered for the production phase are available in Table S2 of Supplementary Materials.
To monitor the e-cargo bike use phase and collect primary data for the analysis, a set of monitoring devices have been applied to the vehicle.
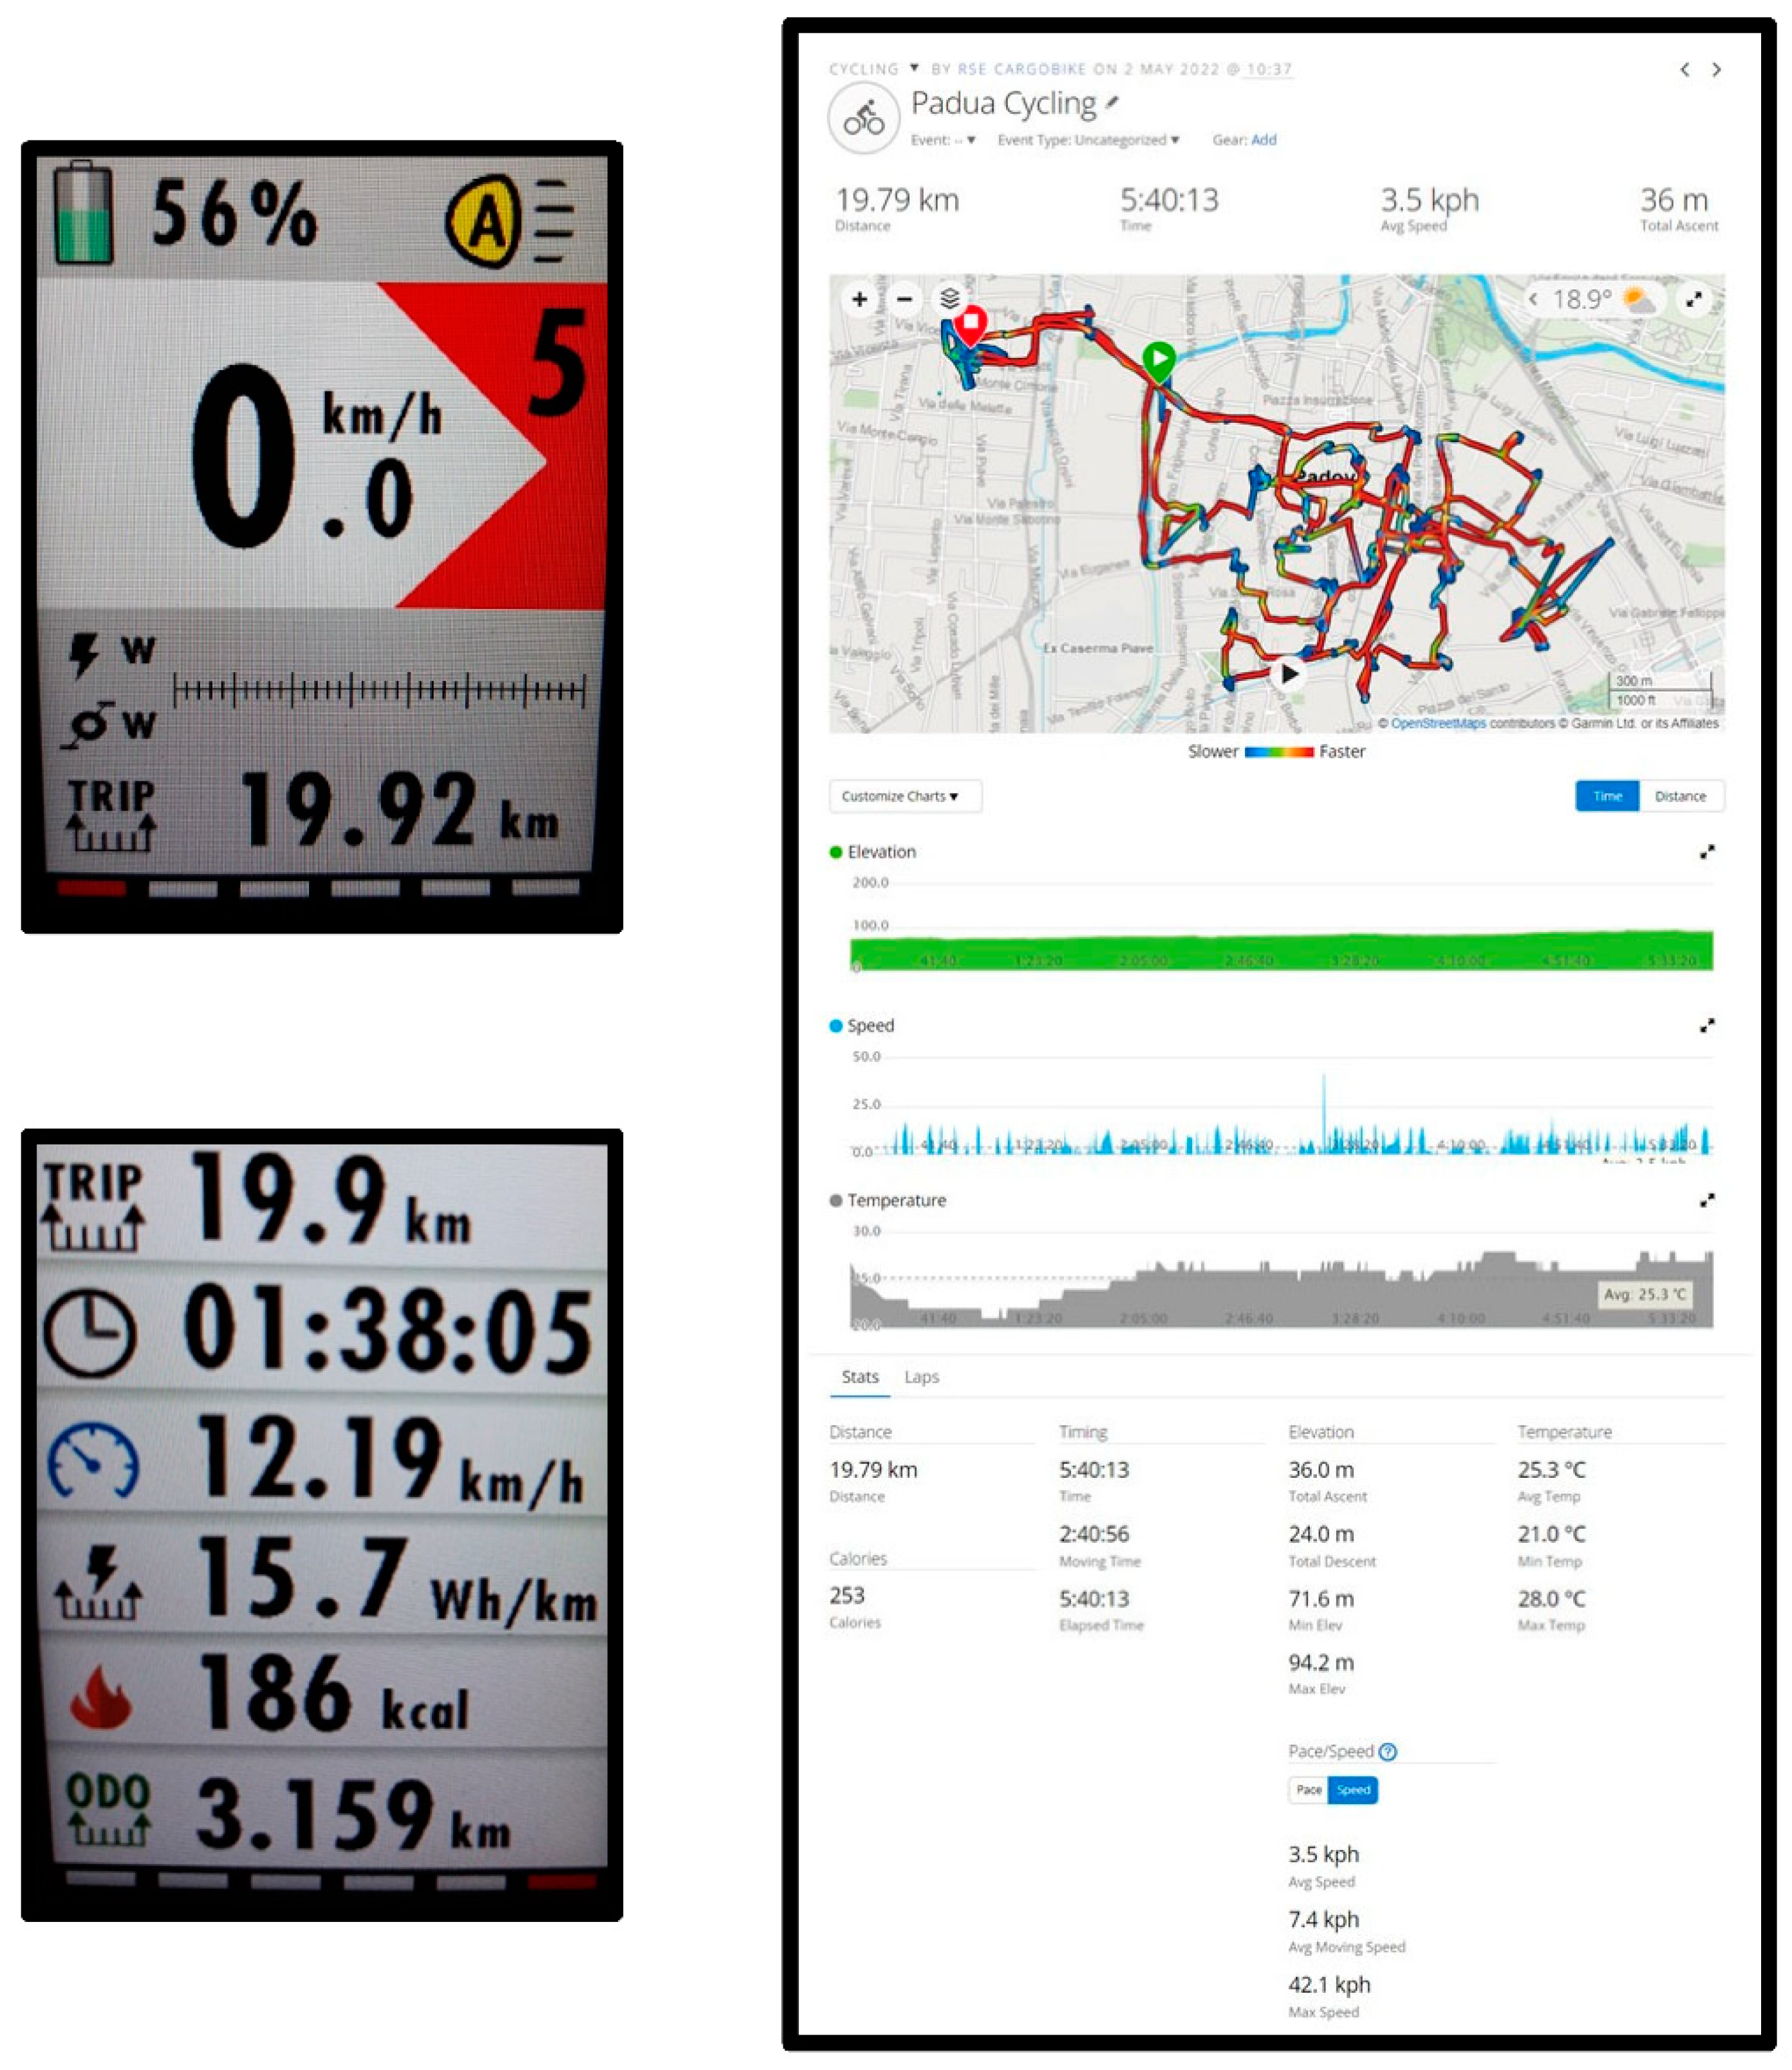
The e-cargo bike is equipped with a GPS, to track all routes and give other useful information (distance, time riding, speed). All this information is stored on a cloud every day the vehicle is used. Data sharing is automatically performed with a smartphone, which is also installed on the vehicle. This device is used every day by the rider to take a picture of the e-cargo bike display at the end of the working route. In this way, other data about the e-cargo bike working day are stored and shared: average speed, energy average consumption and battery level.
An example of the data collected during a working day, using the smartphone and the GPS, is shown in the following Figure 4.
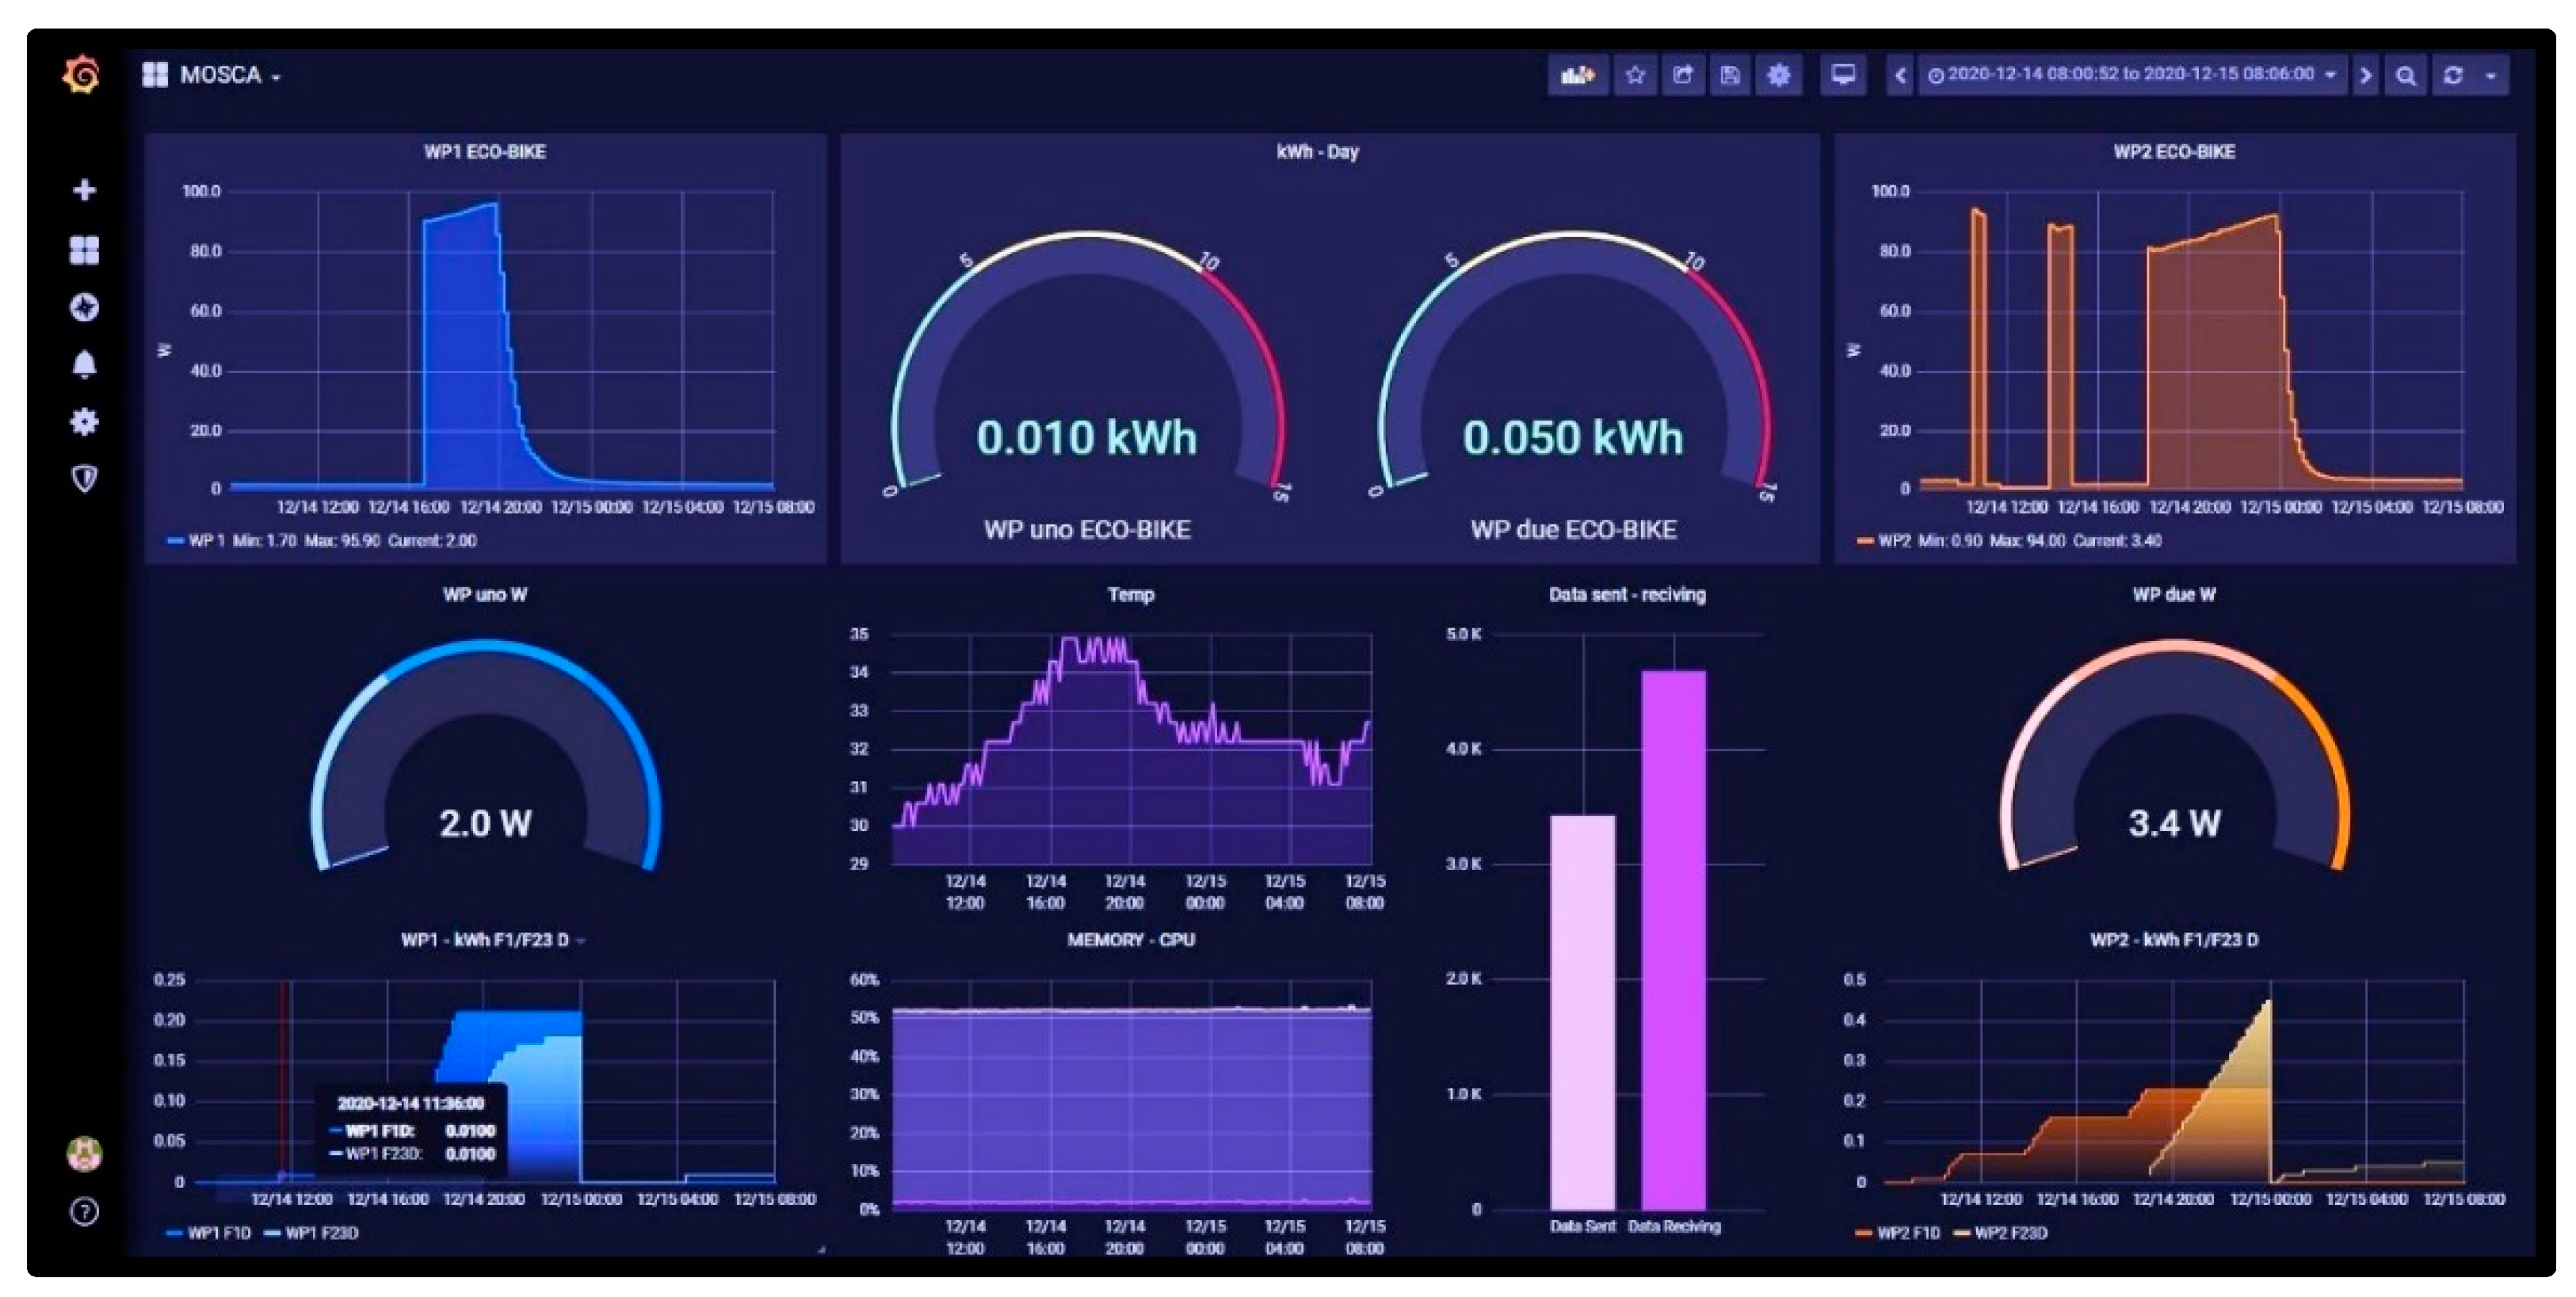
At the end of every working day, the e-cargo bike battery is recharged at the logistics operator’s headquarters. Energy consumption information, while charging, is collected with a monitoring system specially designed for this experimentation. This system is called MOSCA (MOnitoring System for CArgobike) and is placed between the battery vehicle and the electric socket, measuring in this way all energy consumption parameters during every recharging process. In the following Figure 5, the application interface is shown. Further detail on the energy consumption monitoring system can be found in [36].
The e-cargo bike monitoring has provided primary data which allowed us to estimate the average distance travelled (25.5 km/day) and the average daily energy consumption (0.54 kWh/day). These data were used to design the use phase of the vehicle.
No literature references were found to estimate the e-cargo bike’s non-exhaust particulate emissions during the use phase, due to brake and tyre wear. Nonetheless, assuming a conservative approach, these emissions are considered in this study and are directly linked to the e-cargo bike’s total (gross) weight, which is given by the e-cargo bike’s mass (80 kg), rider mass (80 kg) and goods mass (200 kg) [37] (for details, see Equations (2) and (4)).
The electric energy used for recharging the e-cargo bike’s battery is modelled according to the Italian 2018 electric energy mix (most recent value) [38] in which almost 40% of the electricity is produced by natural gas, 35% from renewables. 9% from coal and 13% is imported [38].Transmission and distribution losses are considered 6%, according to national statistics [39].
The e-cargo bike’s maintenance phase includes all the ordinary operations, based on information from the literature and the vehicle instruction handbook. Details regarding the components included in the maintenance phase are shown in Table S3 of Supplementary Materials.
The maintenance phase considers two different scenarios: Cargobike SC0, a scenario without battery substitution; Cargobike SC1, a scenario with one battery substitution in the middle of the vehicle lifetime (after three years). We did not find a consolidated value for e-cargo bike battery life span in terms of total mileage in the literature. This value is influenced by many parameters (e.g., daily distance ride, goods weight, drive style) and it is affected by the use phase stress. Although in our experimentation, the average battery state of charge was about 40%, suggesting a battery life longer than 10 years (4000–5000 cycles [40]), considering a conservative approach, a battery substitution scenario (Cargobike SC1) was also considered.
In the end-of-life phase, the e-cargo bike is dismantled and all the components are sent to different end-of-life treatments, depending on the material from which they are made. This phase is modelled based on the data of the Italian Special waste report 2020 [41].
Energy and material consumptions for the e-cargo bike’s dismantling are properly modelled with Ecoinvent database information.

4.2. Electric, Diesel and Plug-In Hybrid Van

As mentioned above, electric assisted cargo bikes are not the only available solution for more sustainable urban logistics. A more conventional option could be represented by electric or plug-in hybrid vans. For this reason, the e-cargo bike performances were compared to an electric, a plug-in hybrid and a diesel van. Of course, using standard driving cycles for van energy consumption and air pollutant emissions was not considered feasible, as an urban delivery driving cycle, with its frequent stop-and-go events, dramatically differs from standard cycles such as NEDC or WTLC. Hence, a specific experiment was designed and carried out. The vehicles tested were a Nissan e-NV200, a Ford Transit Connect and a Renault Megane plug-in hybrid (Renault Group, Boulogne-Billancourt, France). It was not possible to rent the same models in the three different motorisations, so the choice of the vehicles was guided by the following criteria:
  • The electric van was the same already used for the experimentation in the EU project Sharing Cities [42], which was our reference for the delivery routes.
  • The diesel model was the most similar to the electric one (for weight, carrying capacity and engine power) available for rent.
  • As no plug-in hybrid van was available for rent, a passenger car similar in weight and engine power was used, assuming, as a first approximation, that it could be considered as a proxy alternative for a plug-in hybrid van.
As already mentioned, these three vans were tested on real delivery routes, obtained by the EU project Sharing Cities monitoring and evaluation activity [43]; during these delivery simulations, the diesel and plug-in hybrid vans’ exhaust emissions were measured, using the PEMS tool (Portable Emissions Measurement System). The delivery distance was 60 km with ten stop-and-go events for delivery or pick up, considering different stop-and-go times.
This activity allowed us to characterize the vehicles’ use phase through primary data based on real road use and not on standard vehicle approval procedures. Furthermore, the three vans were tested in the laboratory on a chassis dynamometer, considering a specific driving cycle based on the speeds measured during the on-road experiment activity. In this way, it was possible to detect all the other emissions not measurable during the on-road test (NH3, N2O).
The vans’ production phase is modelled using the GREET database [44]. Starting from the Pickup Truck dataset (Van dataset is not available in GREET), vehicle compositions are obtained and then components’ and materials’ final weights are estimated scaling the real mass of the assessed vans. Details regarding the composition and weight of systems and sub-systems for the three vans are shown in Tables S4–S6 of Supplementary Materials.
As explained above, van use phase data were obtained with the on-road experiment activity. Fuel consumption was measured during the on-road tests, considering carbon dioxide measure, whereas energy consumptions for recharging electric and plug-in hybrid vans batteries were measured using another monitoring tool such as the MOSCA one used for the e-cargo bike. Table 2 and Table 3 show energy consumptions and pollutant emissions collected during the experimentation.
Moreover, laboratory tests during the experimentation have confirmed that brake wear emissions for the electric vehicle, thanks to its regenerative braking system, are far lower than the ones of the endothermic vehicle. Nonetheless, these estimations are affected by a certain degree of uncertainty, due, for example, to the wheel configuration to which the sensors are applied. For this reason, in this work, the EMEP/EEA methodology was adopted [45] as implemented in Ecoinvent [37,46], according to which non exhaust emissions are proportional to the gross vehicle weight and brake wear emissions produced by an electric vehicle are about 20% of those produced by an internal combustion engine vehicle.
For further detail, non-exhaust emissions were calculated through the following formula:
Road   wear   emissions = C road × GVW
Tyre   wear   emissions = C tyre × GVW
Brake   wear   emissions ICE = C brake × GVW
Brake   wear   emissions ELE = SF brake × C brake × GVW
where:
GVW =   Gross   vehicle   weight   Curb   weight   +   passenger   weight
C road = r o a d   a b r a s i o n   c o e f f i c i e n t = 9.79 × 10 9   kg / kg v e h i c l e
C tyre = t y r e   a b r a s i o n   c o e f f i c i e n t = 5.73 × 10 8   kg / kg v e h i c l e
C brake = b r a k e   f r i c t i o n   c o e f f i c i e n t = 4.45 × 10 9   kg / kg v e h i c l e
SF brake = b r a k e   w e a r   s c a l i n g   f a c t o r = 0.2   d u e   t o   r e g e n e r a t i v e   b r a k i n g ,   i f   a n y
The electric energy mix, used by these two vans during the use phase, is the Italian 2018 electric energy mix [38], the same considered for the e-cargo bike use phase.
Petrol and diesel supply chains, used by internal combustion engine vans (diesel and plug-in hybrid), are modelled starting from Italian imports of petroleum [47,48] as in [49].
Vans maintenance datasets include tyres, mineral oils and fluids substitution, whereas diesel van maintenance also includes battery substitution. Maintenance data are obtained considering GREET [10] and Ecoinvent database [30]. Lead battery substitution impacts and energy consumptions for the maintenance process are obtained from the Ecoinvent database, considering the three vans’ lifetimes.
The electric van battery is supposed to have the same lifetime as the vehicle; that is, 240,000 km [49]. According to the producer’s warranty, the battery capacity reduction is below 20% after 160,000 km. With this reduced energy capacity, the electric van’s autonomy is reduced by about 20% [50] leaving enough driving range to guarantee a daily delivery service, which is about 60 km. For this reason, electric van battery substitution is not considered during the vehicle’s lifetime. The vans’ end of life phase is based on literature studies, which consider grinding and post-grinding processes [51].

5. Life Cycle Impact Assessment—LCIA

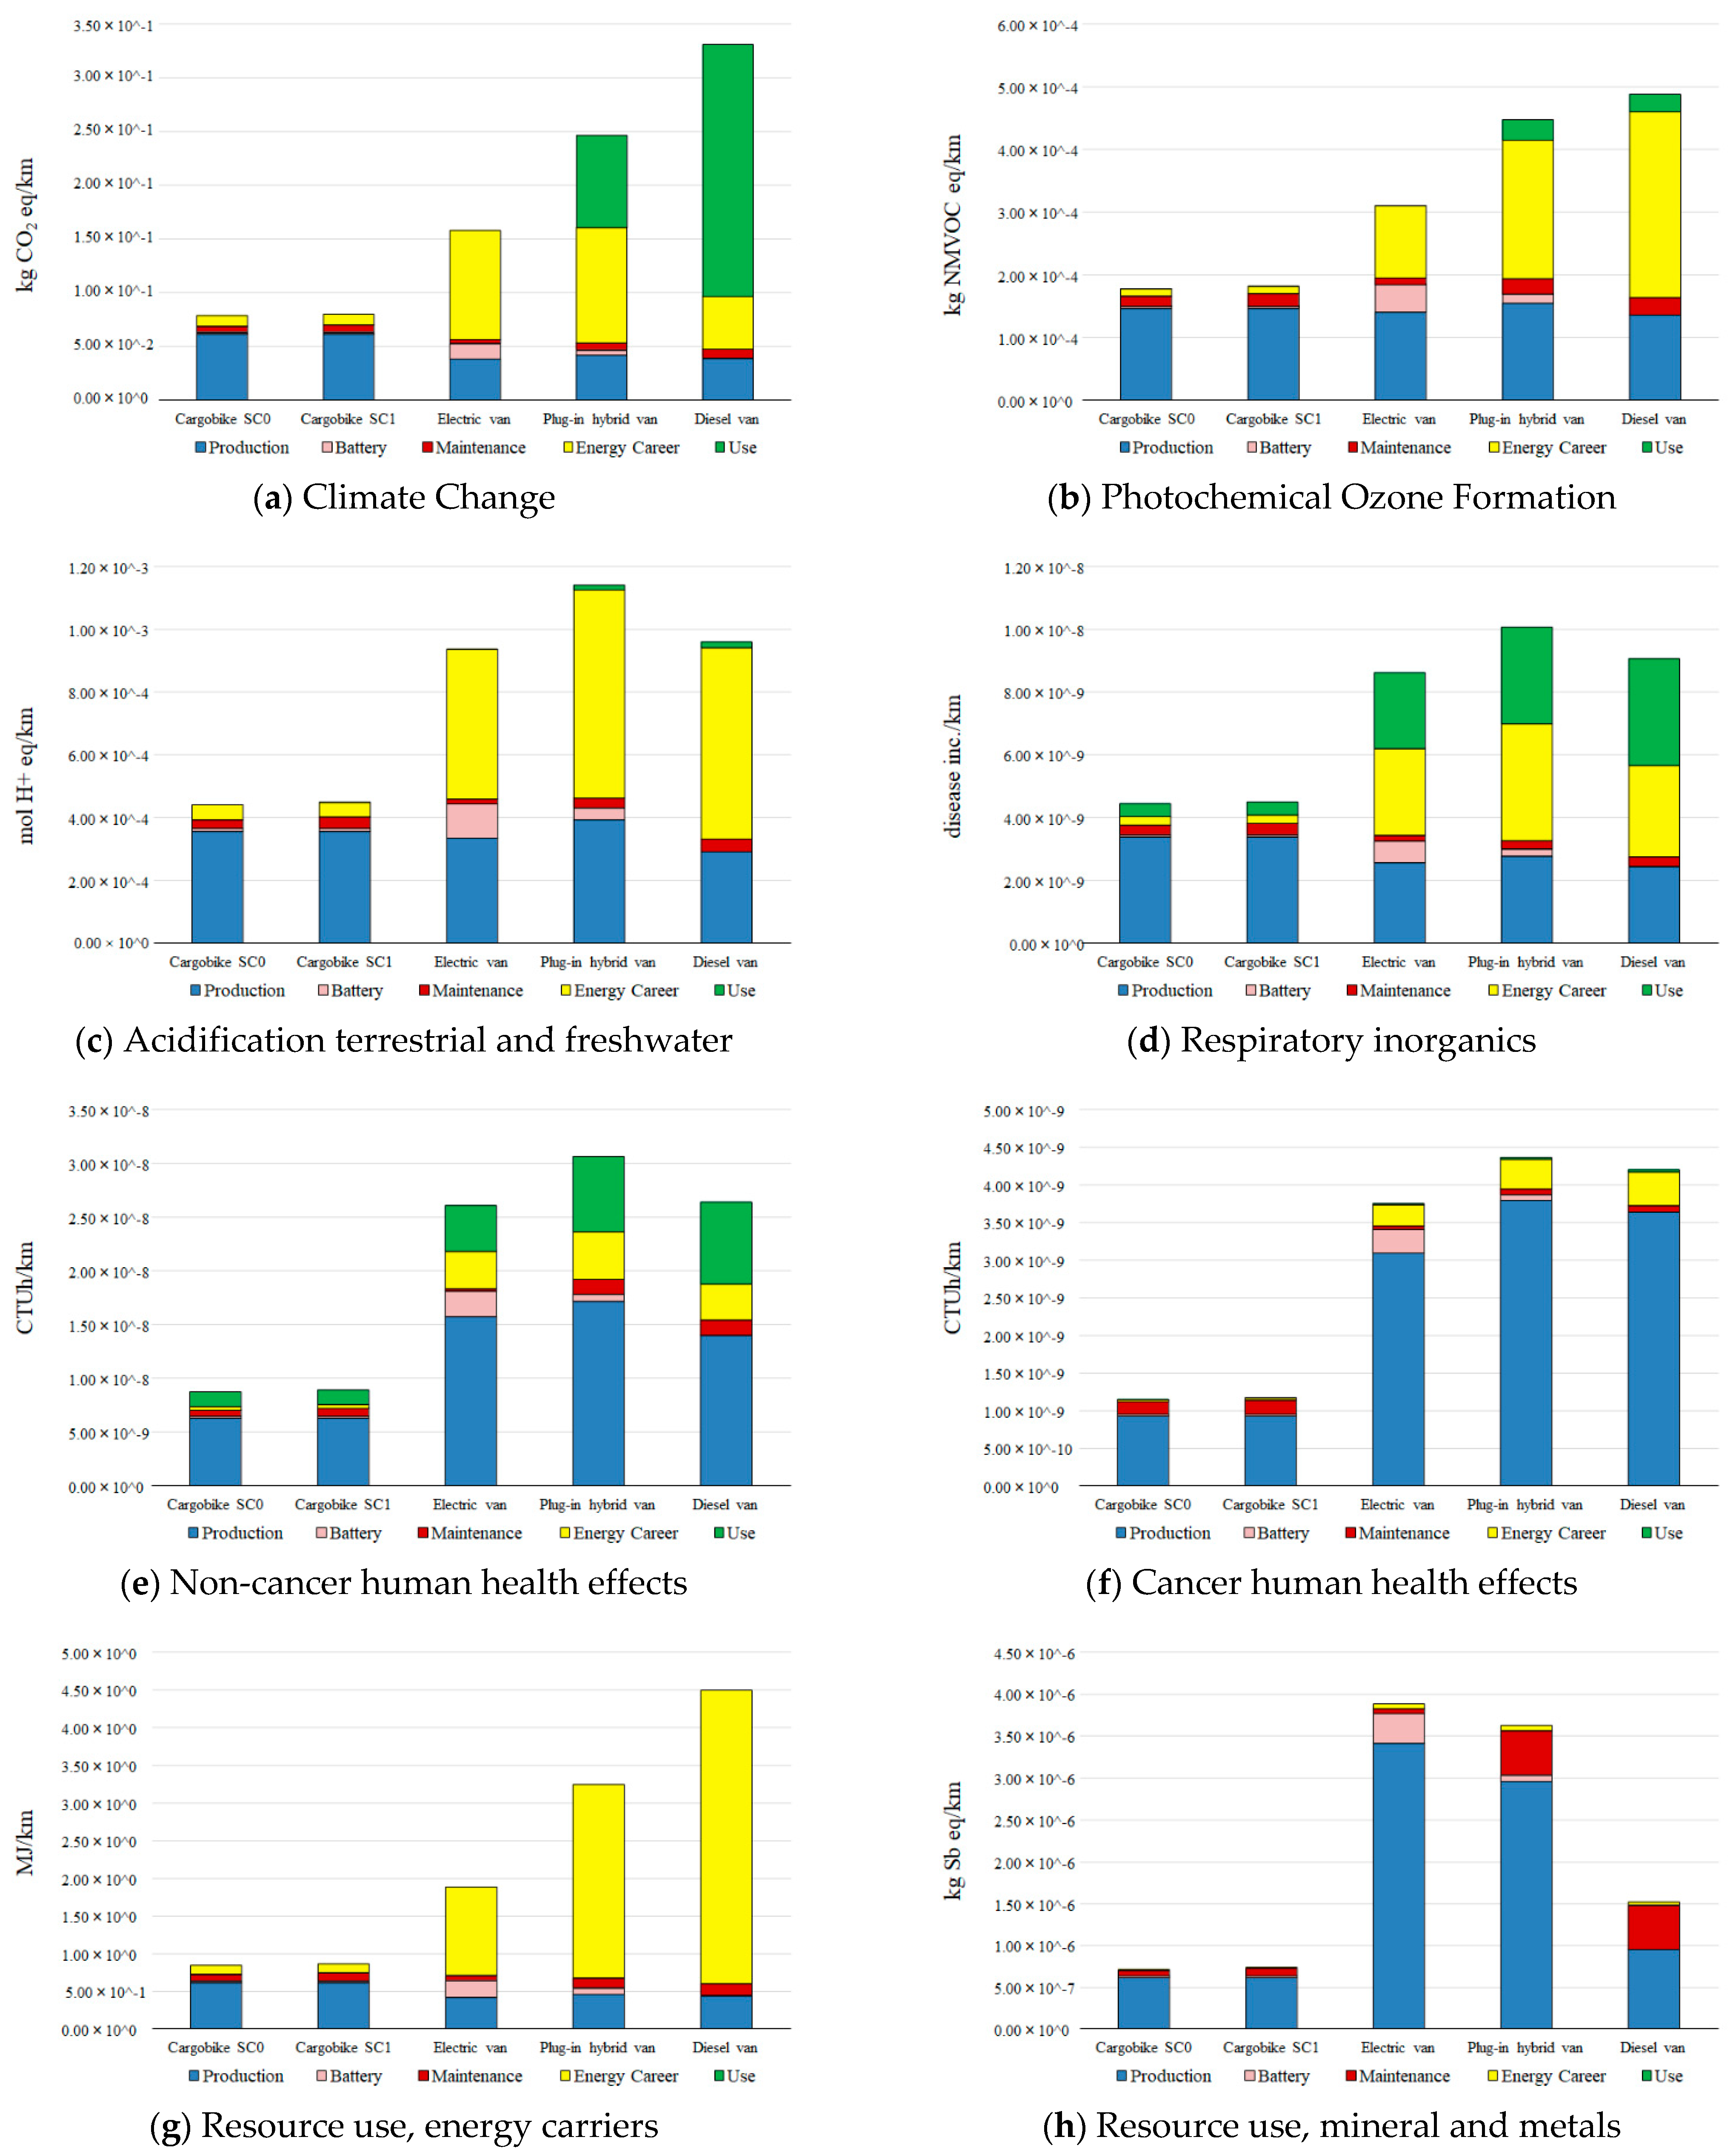
Figure 6 continues with the results and the potential impacts of the assessed vehicles. Both e-cargo bike scenarios, without battery substitution (Cargobike SC0) and with battery substitution (Cargobike SC1), are shown. For every impact category, the assessed vehicles are compared, highlighting the impacts generated by each life cycle phase: Production includes impacts due to vehicles materials and production as well end of life; Battery includes impacts due to electric vehicles batteries production and end of life; Maintenance includes maintenance processes impacts (in Cargobike SC1 scenario this item includes battery substitution); Energy carrier includes energy carriers supply (electric energy, petrol, diesel) including all life cycle phases; Use includes direct impacts generated by vehicles during the use phase: exhaust emissions impacts for ICE vehicles and non-exhaust emissions due to abrasion for all the vehicles.
Table 4 illustrates the environmental impacts of all the assessed vehicles and all the selected impact categories.
For all the assessed impact categories, the e-cargo bike shows the best environmental performances. Furthermore, environmental impacts in the two scenarios (Cargobike SC0 without battery substitution and Cargobike SC1 with battery substitution) are very similar. Impact category Resource use, mineral and metals shows the biggest differences between the two scenarios (4% for all life cycle and 31% only considering the maintenance phase) and the reason is major resource consumption due to the battery substitution.
For the Climate Change impact category, the e-cargo bike shows the lowest impacts (79 g CO2 eq/km for Cargobike SC0 and 80 g CO2 eq/km and Cargobike SC1). The diesel van has the worst performance, with 331 gCO2 eq/km (234 g CO2 eq/km are due to the use phase). The Climate Change indicator value for the electric van is 158 g CO2 eq/km; the plug-in hybrid van is in an intermediate position between diesel and electric one, with 246 g CO2 eq/km. Plug-in hybrid van CO2 eq emissions are mostly generated by the use phase because hybrid modality during this phase contributes with 85 gCO2 eq/km.
E-cargo bike production is the major contribution to its Climate Change indicator, and this is due to intensive processes used during carbon fibre manufacturing (carbon fibre is used in many components of this vehicle, such as the chassis). Furthermore, compared to the other vehicles, this phase is the most impactful because of the e-cargo bike’s lifetime being the shortest: 6 years of lifetime with 33,620 km total mileage for the e-cargo bike, which is tiny compared to the 240,000 km total mileage assumed for vans.
Considering only the three vans, electric van and battery production phases are more impactful than diesel and plug-in hybrid van and battery production. This result is due to the battery impacts, which are very high during manufacturing. For the Photochemical Ozone Formation impact category, it is possible to make similar considerations. In this case, the NMVOC eq emissions are due to energy consumption during electric van and battery production.
The electric and the endothermic engines in the plug-in hybrid van cause a high contribution to the Acidification terrestrial and freshwater impact category for the production phase, making this vehicle performance the worst for this category. Impact category contribution due to the plug-in hybrid van’s energy carrier supply is higher than the diesel van, and the reason is due to the combined effects of petrol and electricity.
The plug-in hybrid van is also the worst vehicle considering the Respiratory inorganics impact category, due to the contribution of the energy carrier supply (petrol and electricity) and use phase (exhaust and non-exhaust emissions). For the plug-in hybrid van, KERS regenerative braking effects (Kinetics Energy Recovery System and battery recharge) have not been taken into consideration due to insufficient literature concerning this point. For this reason, plug-in hybrid non-exhaust emissions modelled considering vehicle weight are completely comparable to those of the diesel van.
Concerning human toxicity impacts (Non-cancer human health effects and Cancer human health effects) all three vans show a high potential impact due to the production phase, higher than 80% for all the assessed cases.
The reason for this result is chrome emission during metals manufacturing, especially steel and aluminium. In the two vans with electric engines, the non-negligible impact contribution is due to electronic component production (inverters, controllers and printed wiring boards).
In the Resource use, energy carriers impact category, the diesel van shows the worst performance, and the contribution of energy vector supply is clear. Petroleum extraction, especially extra EU petroleum production (63%), contributes 86% of this indicator. For the electric van, the impacts are due to natural gas (45% of the indicator value) and coal (25% of the indicator value) consumption for electric energy production in the Italian mix. The e-cargo bike shows lower impacts because its energy consumption is considerably lower due to the vehicle’s light weight and the pedal contribution during the use phase (the inclusion of the impacts on diet for integrating human energy use is out of the scope of the present paper and will be further investigated in future works).
Finally, the Resource use, mineral and metals impact category shows critical performance for the electric van (and also for the plug-in hybrid van). The value of the indicator is influenced by precious metals (e.g., gold) which are contained in electronic components and have a high characterization factor.
As already stated, the electricity mix used by electric vehicles is the Italian 2018 electricity mix (IT 2018) [38].
Since the recharging mix plays a relevant role in determining the environmental performances of electric vehicles [22], a sensitivity analysis was performed to investigate its effects. More specifically, the following recharging mixes were considered:
  • The future, deeply decarbonized, Italian electricity mix, according to the 2030 PNIEC scenario (Piano Nazionale Integrato per l’Energia e il Clima) (IT 2030) [38].
  • Electricity from only photovoltaic production (All PV) which can represent the optimistic scenario for EVs.
  • Electricity from Natural Gas production (All NG), which may represent a pessimistic scenario for EVs.
Table 5 shows the composition of the considered recharging mixes.
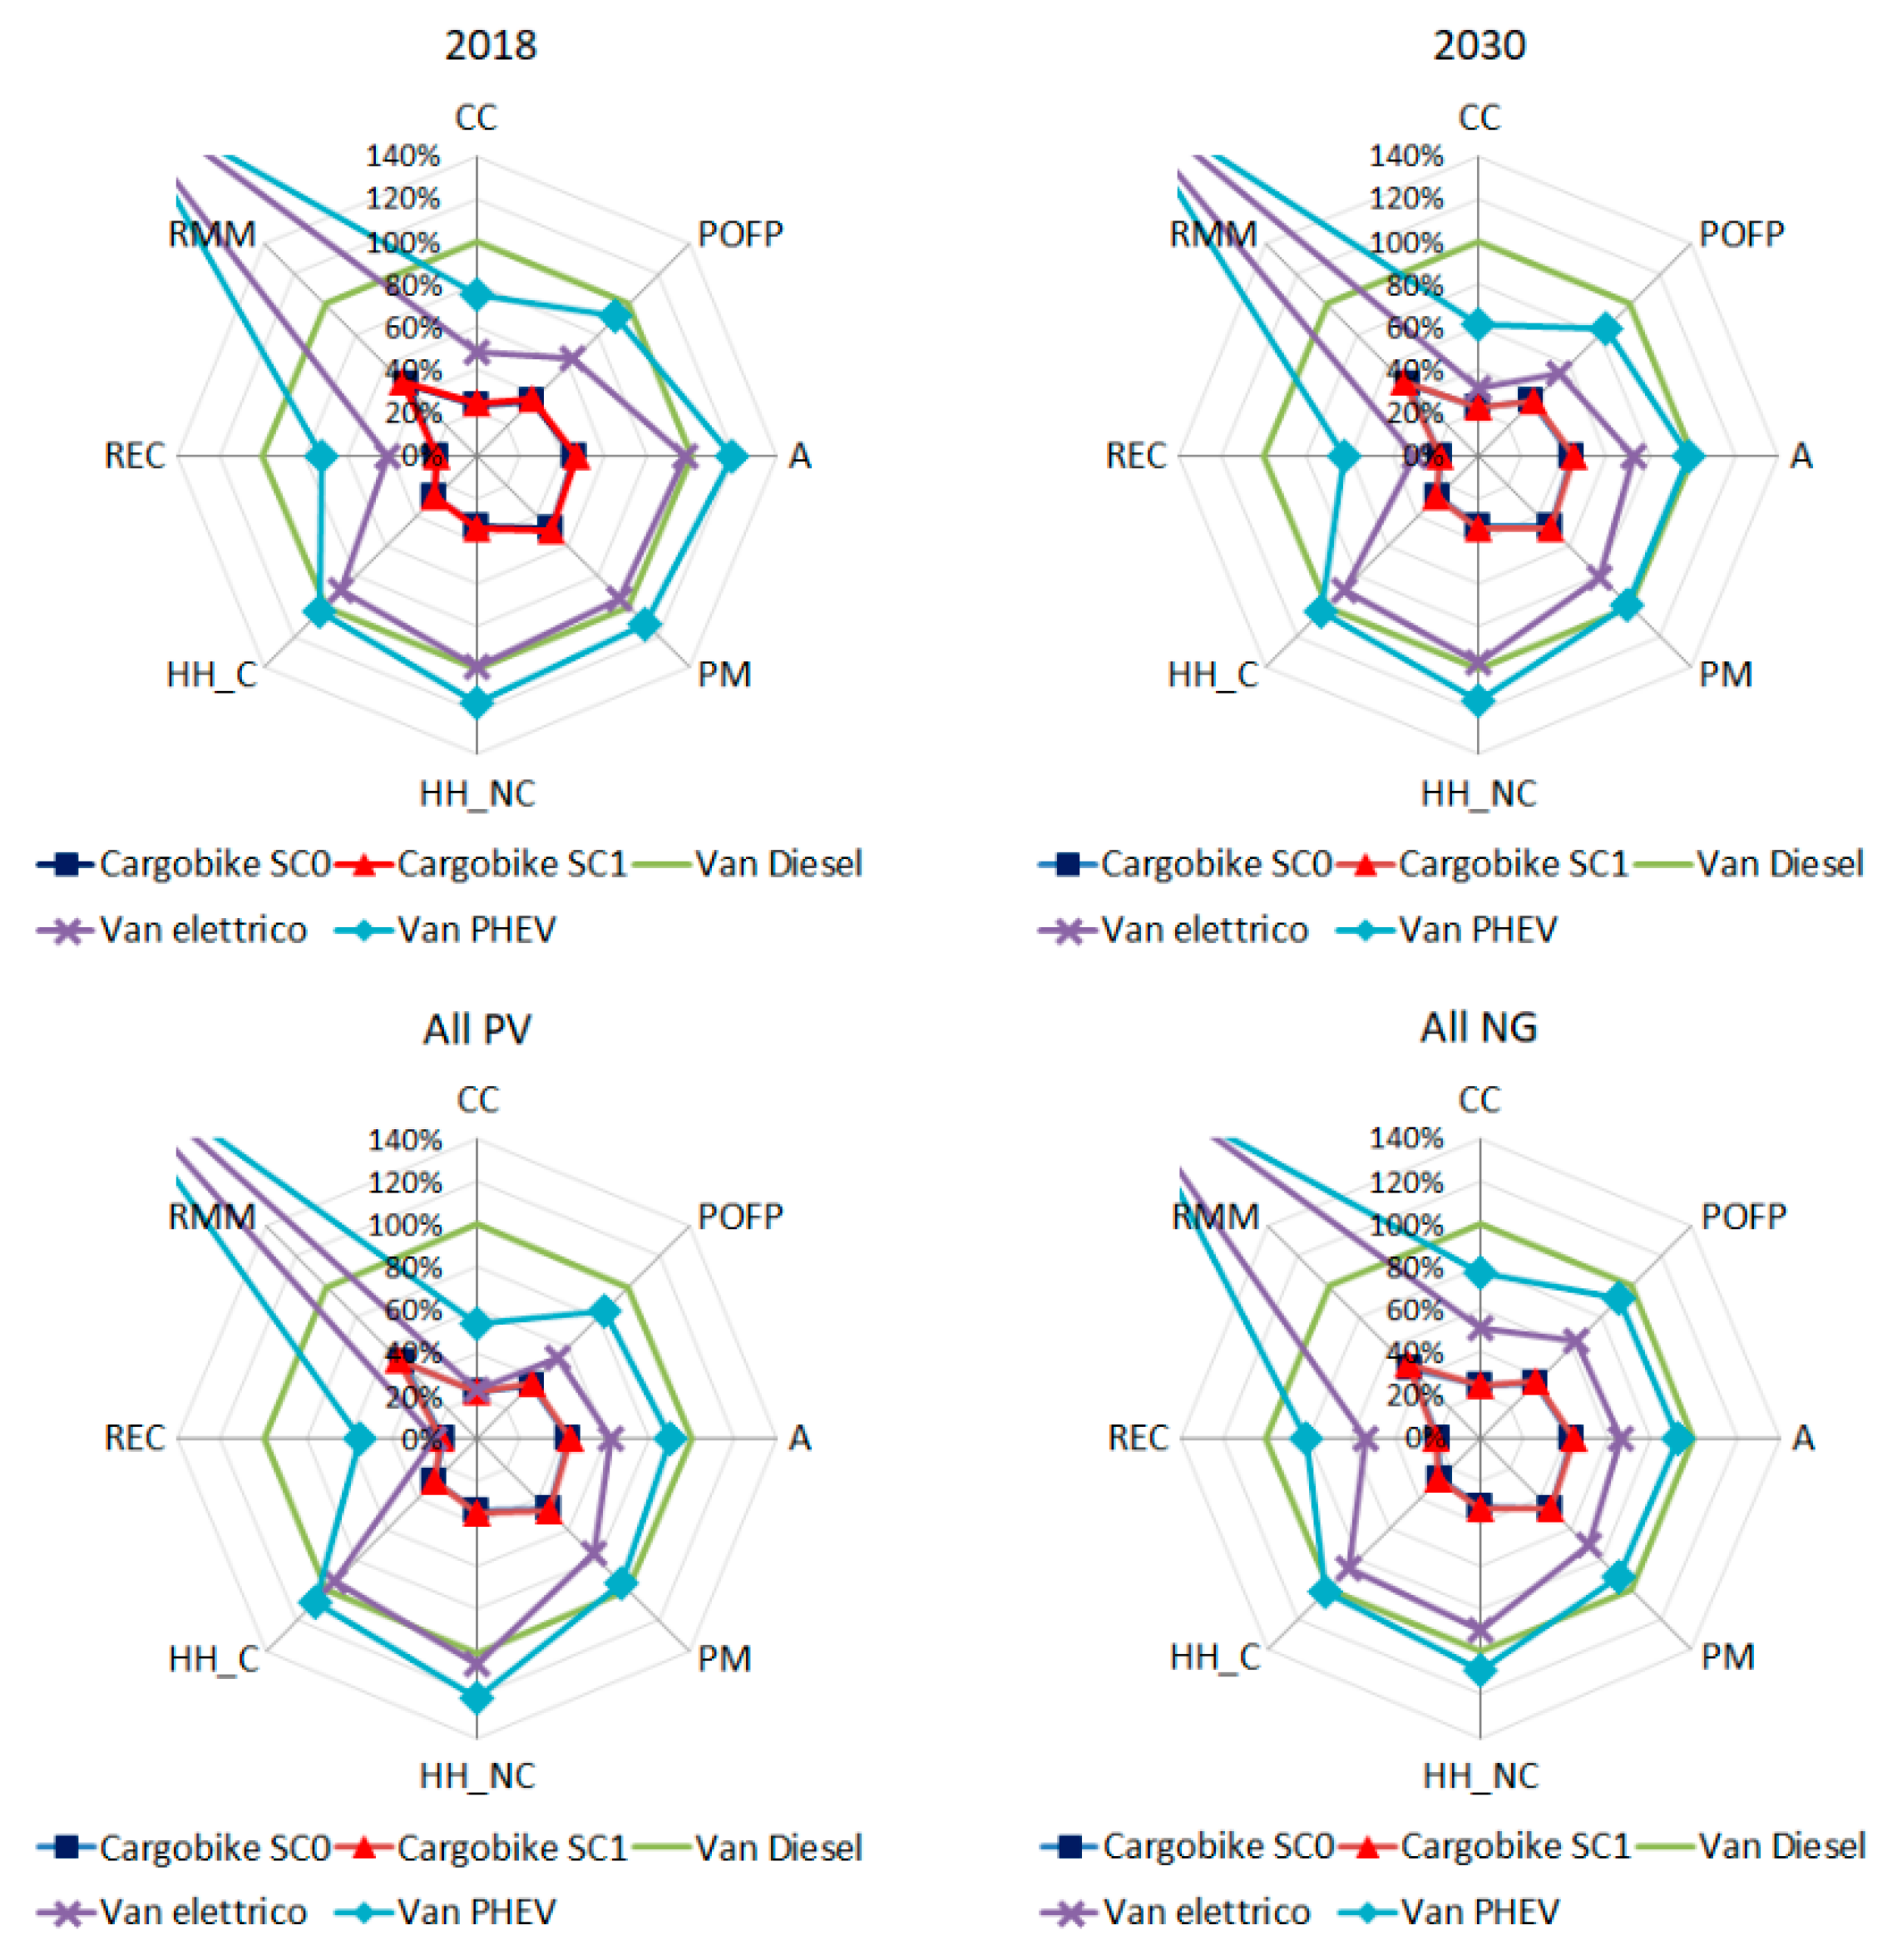
As regards Climate Change, the analysis showed that the use of less carbon-intensive electricity mixes (IT 2030 and All PV with 0.196 and 0.075 kg CO2 eq/kWh respectively) leads to a general impact reduction, especially for the electric and the plug-in hybrid vans, as for these vehicles, the contribution of the energy carrier phase is more relevant than that of the e-cargo bike. Furthermore, if the ranking does not change, it is worth noting that the emission gap between the electric van and e-cargo bike along the entire life cycle goes from 100% of the baseline scenario (IT 2018, 0.411 kg CO2 eq/kWh) to 43% of the IT 2030 scenario to the 6% of the All PV scenario. On the contrary, the All-NG scenario (0.456 kg CO2 eq/kWh) induces a widening of the gap between the performances of e-cargo bike and electric van (111%).
For Respiratory Inorganics, the burdens of the electric vehicles show a reduction for all the recharging mixes considered. In particular, this analysis highlights a rank reversal between the performances of the plug-in hybrid van, which performs worst in the IT 2018 scenario, and the diesel van, which performs worst in all other considered scenarios.
Finally, as for Resource use, mineral and metals, the IT 2030 and All PV scenarios entail an increase in the potential impacts of electric vehicles, due to higher production from the photovoltaic source.
In the following Figure 7 potential impacts for the assessed vehicles, considering the four scenarios, are shown.
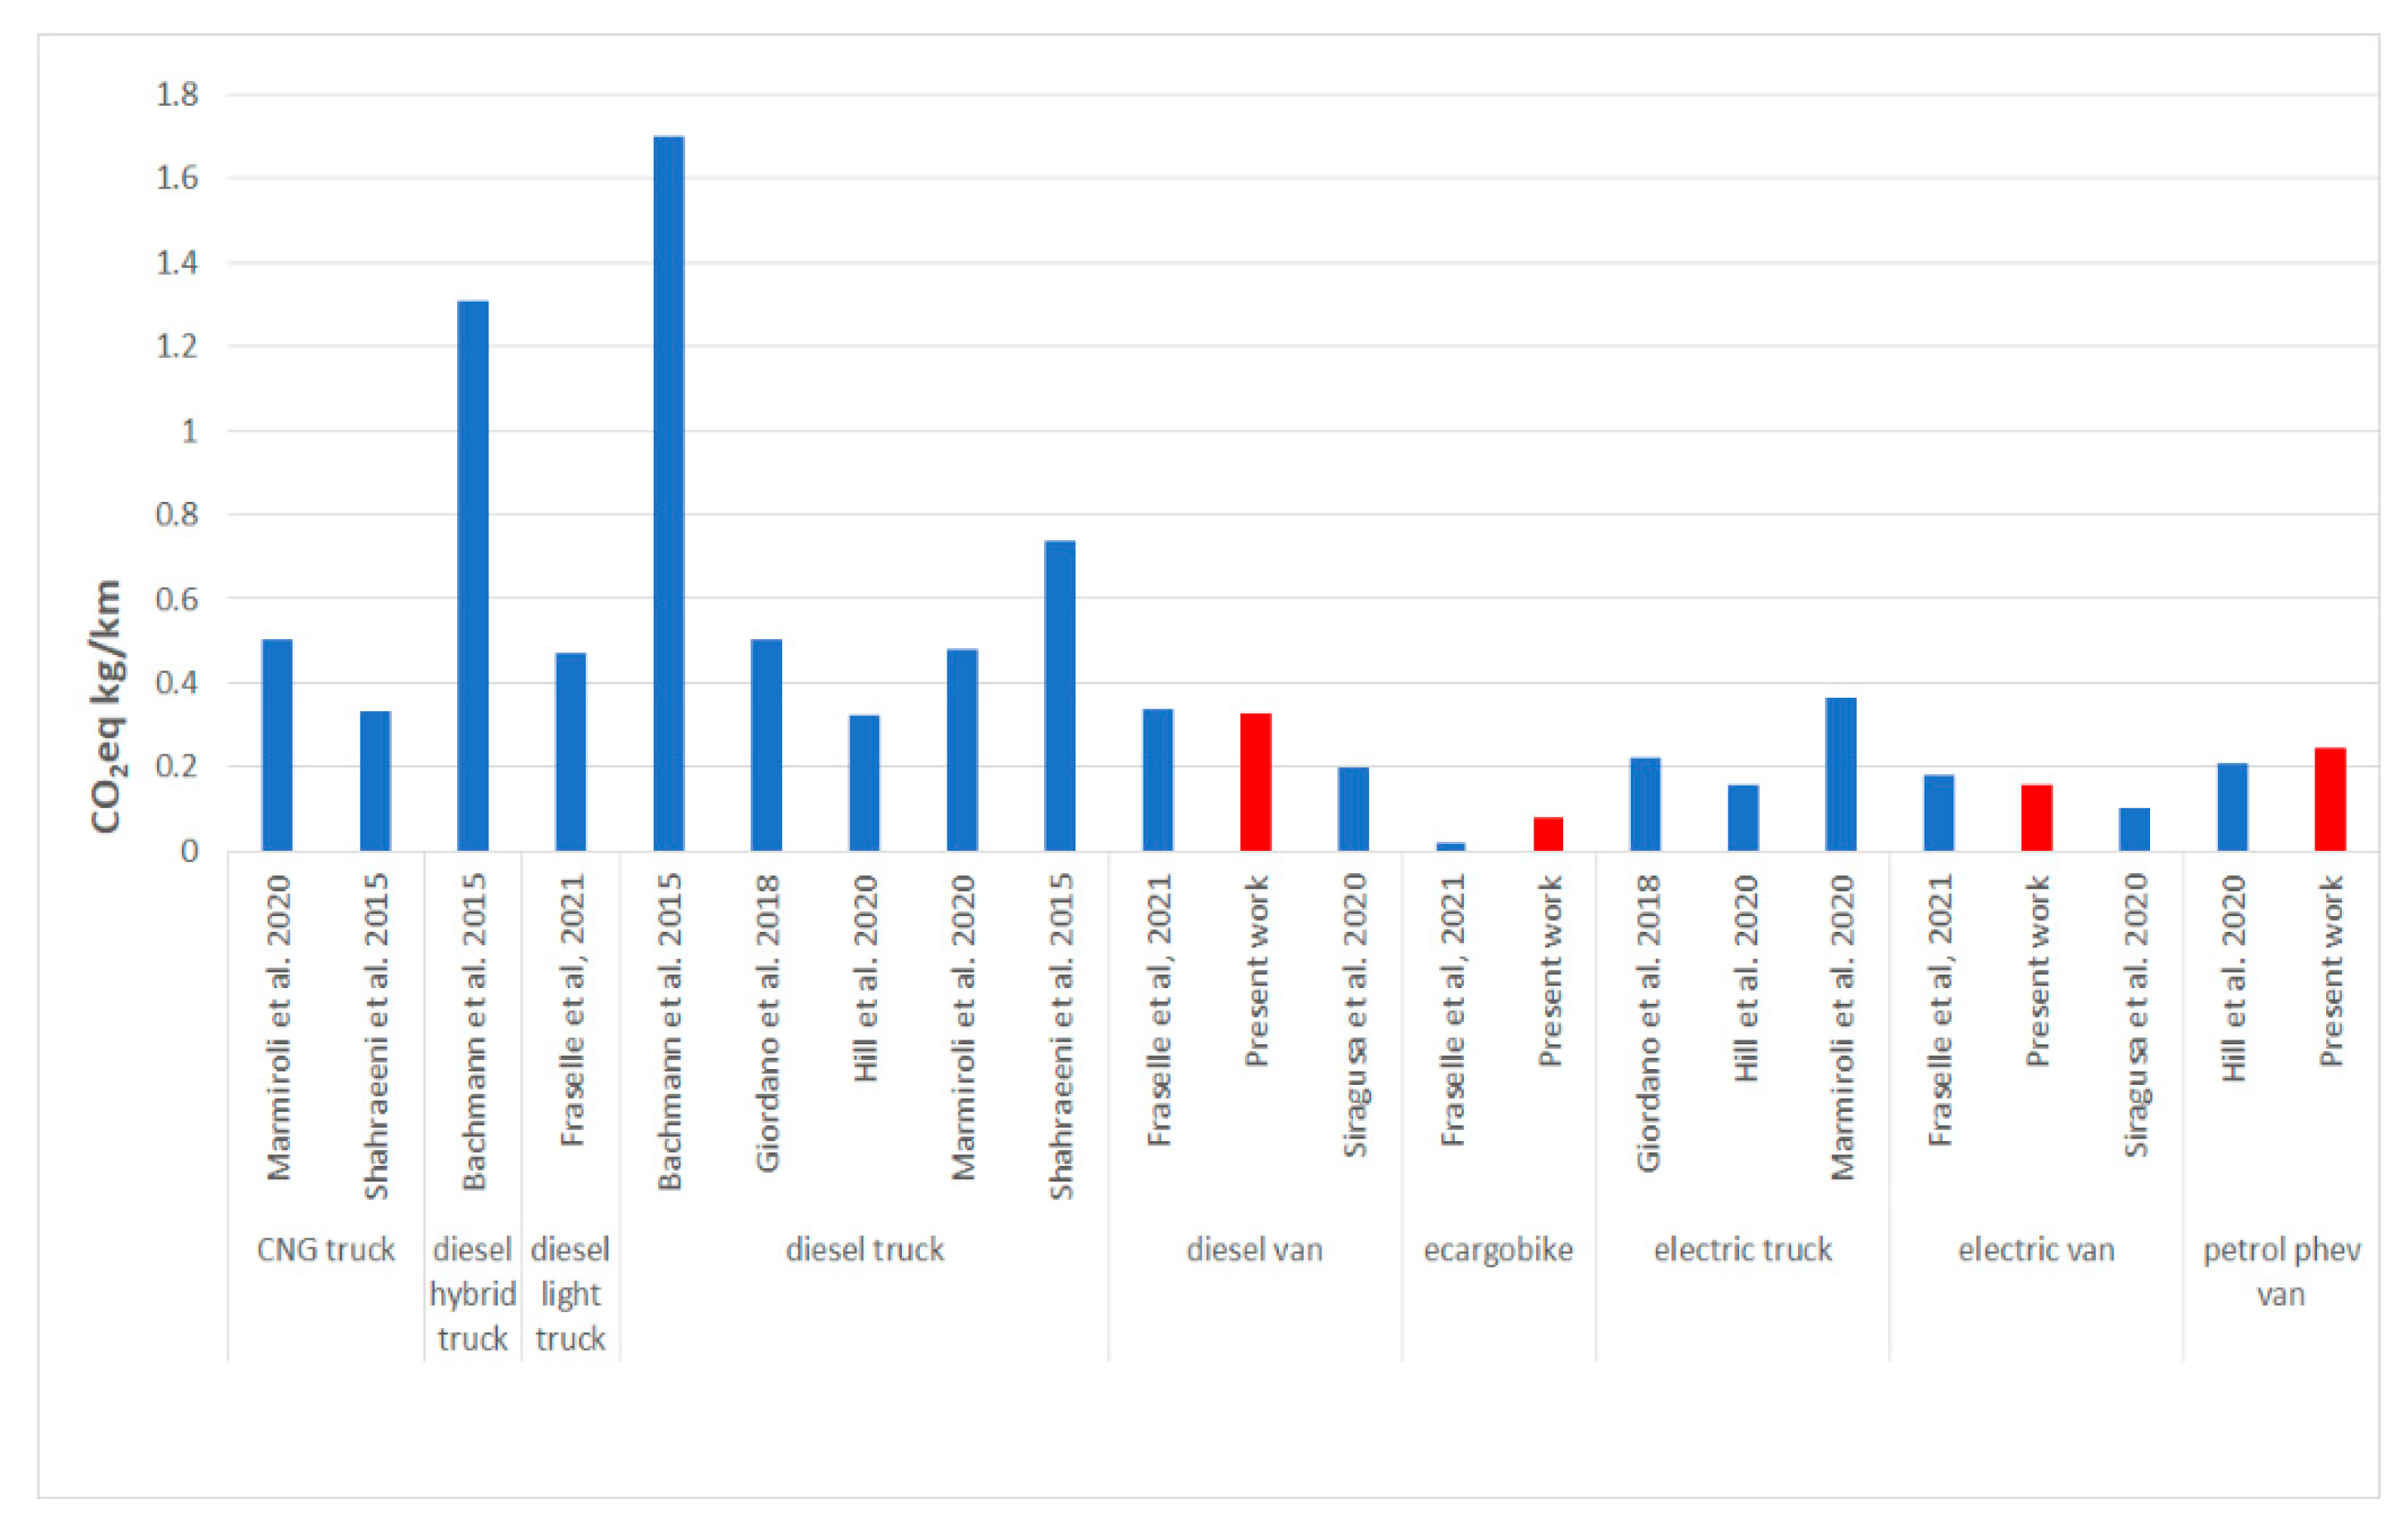
Comparison with other studies is not easy because LCA results depend on several parameters, such as the functional unit, the system boundaries, the allocation rules and the environmental impact categories indicators used. Moreover, the size and the model of the vans and the driving cycle deeply affect the results. A literature results meta-analysis is out of the scope of the present work. Nevertheless, a comparison can be made for what concerns at least the CO2 eq/km emissions, considering studies in Table S1 of Supplementary Materials with the same functional unit (1 km) and system boundaries similar to our study.
The bar chart in Figure 8 shows that the results in the present work are reasonably in line with the literature, considering the differences in the vehicles’ sizes and driving cycles.

6. Conclusions

The last-mile logistics environmental impact assessment shows that e-cargo bikes’ lifecycle impacts are always lower than the other assessed vehicles when considering the same delivery service.
Sensitivity analysis shows that also battery substitution in the middle of the e-cargo bike’s lifetime (Cargobike SC1 scenario) does not affect this vehicle’s better performance.
When a delivery service is not possible using the e-cargo bike, the electric van shows the best environmental performance for Climate Change, Photochemical Ozone Formation, Non-cancer human health effects, Cancer human health effects, Resource use, energy carriers, Respiratory inorganics, Acidification terrestrial and freshwater impact categories.
Electric van battery range (250 km) is not an issue in urban last mile logistics services because the range is much higher than the average delivery distance driven every day (about 60 km).
The diesel van has the highest potential impacts for Climate Change, Photochemical Ozone Formation, Resource use, and energy carriers, but its performances are better than plug-in hybrid vans for non-cancer human health effects, Cancer human health effects, Acidification terrestrial and freshwater, and Respiratory inorganics. This is because the double engine implies higher impacts for these impact categories in the production phase, while at the same time, the PHEV does not benefit from a reduction in pollutants affecting these impact categories in the frequent-stop-and-go last-mile delivery driving cycle tested in the present work.
Focusing on last mile logistics decarbonization, substituting a diesel van with an electric one entails climate change emissions reductions of about 173 gCO2/km. This value grows to 250 gCO2 eq/km if the diesel van is substituted by an e-cargo bike, confirming results from other studies [52].
Considering that e-cargo bike can, in some cases, outperform many other vehicles in city logistics [53], the results show that the substitution of diesel vans with e-cargo bikes, whenever feasible, would dramatically reduce the environmental impacts for all the assessed categories. Considering only the three assessed vans, the electric one shows the best performances for almost all the impact categories chosen in this study. Environmental impacts of the electric van are higher than diesel and plug-in hybrid vans only for the Resource use, mineral and metals impact category. This result is due to precious metals contained in electronic components, which have a high characterization factor.
The use of primary data in the present study is a point of strength, but it also leads to some limitations. The monitored e-cargo bike is an innovative vehicle, and we have no data on actual maintenance operations and on the total mileage of the bike and battery. Furthermore, data referring to van energy consumption and emission are derived from experimental data, with only three days of testing per vehicle and on a trip that we consider “representative” for trip length and the number of stop-and-go events. Further experimental data for van emissions and a longer monitoring time for the e-cargo bike will improve the reliability of the results. Moreover, the daily trips considered for vans and e-cargo bikes are different in terms of length, number of deliveries and area of the city. Nevertheless, the comparison is conservative since the data for the vans have been collected in conditions (far from the city centre, low number of stop-and-go events for loading and delivery) favourable to their use.
Finally, other advantages related to e-cargo bike include the reduced noise pollution, congestion and accidents. These aspects will be quantified in future development of the study, together with a quantification of the external costs of total life cycle airborne emissions.

Supplementary Materials

The following supporting information can be downloaded at: https://www.mdpi.com/article/10.3390/en15207817/s1, Table S1: Literature review; Table S2: E-cargo bike Bill of Materials (BoMs); Table S3: E-cargo bike, components substituted during ordinary maintenance; Table S4: Electric van—Composition and weight of systems and sub-systems (based on GREET Pick up Track); Table S5: Plug-in hybrid van—Composition and weight of systems and sub-systems (based on GREET Pick up Track); Table S6: Diesel van—Composition and weight of systems and sub-systems (based on GREET Pick up Track); Table S7: LCIA—Sensitivity analysis with different energy mix, for all the assessed impact categories.

Author Contributions

Conceptualization, A.T., P.C.B., E.B., and P.G.; methodology, A.T., P.C.B., E.B., and P.G.; software, A.T., P.C.B., E.B.; validation, A.T., P.C.B. and E.B.; formal analysis, A.T., P.C.B. and E.B.; investigation, A.T., P.C.B., E.B.; resources, A.T., P.C.B. and E.B.; data curation, A.T., P.C.B., E.B.; writing—original draft preparation, A.T.; writing—review and editing, A.T., P.C.B., E.B. and P.G.; visualization, A.T.; supervision, P.C.B. and P.G.; project administration, P.C.B. and P.G. All authors have read and agreed to the published version of the manuscript.

Funding

This work has been financed by the Research Fund for the Italian Electrical System under the Contract Agreement between RSE S.p.A. and the Ministry of Economic Development—General Directorate for the Electricity Market, Renewable Energy and Energy Efficiency, Nuclear Energy in compliance with the Decree of 16 April 2018.

Conflicts of Interest

The authors declare no conflict of interest.

References

  1. European Environmental Agency EEA. The First and Last Mile—The Key to Sustainable Urban Transport—Transport and Environment Report 2019; Report No 18/2019; Office of the European Union: Luxembourg, 2019. [Google Scholar]
  2. Lebeau, P.; De Cauwer, C.; Van Mierlo, J.; Macharis, C.; Verbeke, W.; Coosemans, T. Conventional, hybrid, or electric vehicles: Which technology for an urban distribution centre? Sci. World J. 2015, 2015, 302867. [Google Scholar] [CrossRef] [Green Version]
  3. European Commission. A European Green Deal. 2019. Available online: https://ec.europa.eu/info/strategy/priorities-2019-2024/european-green-deal_en#documents (accessed on 1 September 2022).
  4. Bosona, T. Urban freight last mile logistics—Challenges and opportunities to improve sustainability: A literature review. Sustainability 2020, 12, 8769. [Google Scholar] [CrossRef]
  5. Croci, E.; Donelli, M.; Colelli, F. An LCA comparison of last-mile distribution logistics scenarios in Milan and Turin municipalities. Case Stud. Transp. Policy 2021, 9, 181–190. [Google Scholar] [CrossRef]
  6. Oliveira, C.M.d.; Albergaria De Mello Bandeira, R.; Vasconcelos Goes, G.; Schmitz Gonçalves, D.N.; D’Agosto, M.D.A. Sustainable vehicles-based alternatives in last mile distribution of urban freight transport: A systematic literature review. Sustainability 2017, 9, 1324. [Google Scholar] [CrossRef] [Green Version]
  7. Saenz-Esteruelas, J.; Figliozzi, M.; Serrano, A.; Faulin, J. Electrifying last-mile deliveries: A carbon footprint comparison between internal combustion engine and electric vehicles. In International Conference on Smart Cities; Springer: Màlaga, Spain, 2016; pp. 76–84. [Google Scholar]
  8. Hill, N.; Amaral, S.; Morgan-Price, S. Determining the Environmental Impacts of Conventional and Alternatively Fuelled Vehicles through LCA: Final Report; European Commission, Directorate-General for Climate Action: Brussels, Belgium, 2020. [Google Scholar]
  9. Hottle, T.; Caffrey, C.; McDonald, J.; Dodder, R. Critical factors affecting life cycle assessments of material choice for vehicle mass reduction. Transp. Res. Part D Transp. Environ. 2017, 56, 241–257. [Google Scholar] [CrossRef] [PubMed]
  10. Burnham, A. Updated Vehicle Specifications in the GREET Vehicle-Cycle Model; Argonne National Laboratory: Lemont, IL, USA, 2012.
  11. Marmiroli, B.; Venditti, M.; Dotelli, G.; Spessa, E. The transport of goods in the urban environment: A comparative life cycle assessment of electric, compressed natural gas and diesel light-duty vehicles. Appl. Energy 2020, 260, 114236. [Google Scholar] [CrossRef]
  12. Giordano, A.; Fischbeck, P.; Matthews, H. Environmental and economic comparison of diesel and battery electric delivery vans to inform city logistics fleet replacement strategies. Transp. Res. Part D Transp. Environ. 2018, 64, 216–229. [Google Scholar] [CrossRef]
  13. Yang, L.; Hao, C.; Chai, Y. Life Cycle Assessment of Commercial Delivery Trucks: Diesel, Plug-in Electric and Battery-Swap Electric. Sustainability 2018, 10, 4547. [Google Scholar] [CrossRef] [Green Version]
  14. Shahraeen, M.; Ahmed, S.; Malek, K.; Van Drimmelen, B.; Kjeang, E. Life cycle emissions and cost of transportation systems: Case study on diesel and natural gas for light duty trucks in municipal fleet operations. J. Nat. Gas Sci. Eng. 2015, 24, 26–34. [Google Scholar] [CrossRef]
  15. Cecchel, S.; Chindamo, D.; Collotta, M.; Cornacchia, G.; Panvini, A.; Tomasoni, G.; Gadola, M. Lightweighting in light commercial vehicles: Cradle-to-grave life cycle assessment of a safety-relevant component. Int. J. Life Cycle Assess. 2018, 23, 2043–2054. [Google Scholar] [CrossRef]
  16. Siragusa, C.; Tumino, A.; Mangiaracina, R.; Perego, A. Electric vehicles performing last-mile delivery in B2C e-commerce: An economic and environmental assessment. Int. J. Sustain. Transp. 2020, 16, 22–33. [Google Scholar] [CrossRef]
  17. Bachmann, C.; Chingcuanco, F.; MacLean, H.; Roorda, M. Life-cycle assessment of diesel-electric hybrid and conventional diesel trucks for deliveries. J. Transp. Eng. 2015, 141, 05014008-1–05014008-8. [Google Scholar] [CrossRef]
  18. Lee, D.Y.; Thomas, V.M. Parametric modeling approach for economic and environmental life cycle assessment of medium-duty truck electrification. J. Clean. Prod. 2017, 142, 3300–3321. [Google Scholar] [CrossRef] [Green Version]
  19. Garraín, D.; Lechón, Y. Exploratory environmental impact assessment of the manufacturing and disposal stages of a new PEM fuel cell. Int. J. Hydrogen Energy 2014, 39, 1769–1774. [Google Scholar] [CrossRef]
  20. Schünemann, J.; Finke, S.; Severengiz, S.; Schelte, N.; Gandhi, S. Life Cycle Assessment on Electric Cargo Bikes for the Use-Case of Urban Freight Transportation in Ghana. Procedia CIRP 2022, 105, 721–726. [Google Scholar] [CrossRef]
  21. Marques, D.L.; Coelho, M.C. A Literature Review of Emerging Research Needs for Micromobility—Integration through a Life Cycle Thinking Approach. Future Transp. 2022, 2, 135–164. [Google Scholar] [CrossRef]
  22. Fraselle, J.; Limbourg, S.L.; Vidal, L. Cost and Environmental Impacts of a Mixed Fleet of Vehicles. Sustainability 2021, 13, 9413. [Google Scholar] [CrossRef]
  23. Heilmann, B.H.; Reinthaler, M.R.; Ganev, B.G.; Eibl, M.E. Does the introduction of small electric cargo vehicles into a logistics concept for last mile delivery of parcels and groceries in urban areas reduce its environmental impact? In Proceedings of the 7th Transport Research Arena TRA, Wien, Austria, 16–19 April 2018; Available online: https://zenodo.org/record/1451426 (accessed on 5 August 2022).
  24. Saénz Esteruelas, J.M. An Evaluation of the Environmental Impact Reduction in the Urban Delivery Logistics Using Tricycles: A Case Study in Portland, OR, USA. Master’s thesis, Departamento de Estadística e Investigación Operativa, Universidad Pública de Navarra, Pamplona, Spain, 2016. [Google Scholar]
  25. Letnik, T.; Marksel, M.; Luppino, G.; Bardi, A.; Božičnik, S. Review of policies and measures for sustainable and energy efficient urban transport. Energy 2018, 163, 245–257. [Google Scholar] [CrossRef]
  26. ISO 14040:2006; Environmental Management—Life Cycle Assessment—Principles and Framework. ISO—The International Organization for Standardization: Geneva, Switzerland, 2006.
  27. ISO 14044:2006; Environmental Management—Life Cycle Assessment—Requirements and Guidelines. ISO—The International Organization for Standardization: Geneva, Switzerland, 2006.
  28. Faccio, M.; Gamberi, M. New city logistics paradigm: From the “last mile” to the “last 50 miles” sustainable distribution. Sustainability 2015, 7, 14873–14894. [Google Scholar] [CrossRef] [Green Version]
  29. Ministero Delle Infrastrutture e dei Trasporti. La Logistica Urbana in Una Visione Integrata; STM: Rome, Italy, 2020.
  30. Wernet, G.; Bauer, C.; Steubing, B.; Reinhard, J.; Moreno-Ruiz, E.; Weidema, B. The Ecoinvent database version 3 (part I): Overview and methodology. Int. J. Life Cycle Assess. 2016, 21, 1218–1230, 2016. [Google Scholar] [CrossRef]
  31. Carvalho, M.L.; Temporelli, A.; Girardi, P. Life cycle assessment of stationary storage systems within the Italian electric network. Energies 2021, 14, 2047. [Google Scholar] [CrossRef]
  32. Fazio, S.; Castellani, V.; Sala, S.; Schau, E.; Secchi, M.; Zampori, L.; Diaconu, E. Supporting Information to the Characterisation Factors of Recommended EF Life Cycle Impact Assessment Methods; JRC109369, EUR 28888 EN; European Commission: Ispra, Italy, 2018. [Google Scholar]
  33. Zampori, L.; Pant, R. Suggestions for Updating the Product Environmental Footprint (PEF); JRC Technical Reports; European Commission: Ispra, Italy, 2019. [Google Scholar]
  34. Girardi, P.; Gargiulo, A.; Brambilla, P.C. A comparative LCA of an electric vehicle and an internal combustion engine vehicle using the appropriate power mix: The Italian case study. Int. J. Life Cycle Assess. 2015, 20, 1127–1142. [Google Scholar] [CrossRef]
  35. Wrighton, S.; Reiter, K. CycleLogistics–moving Europe forward. Transp. Res. Procedia 2015, 12, 950–958. [Google Scholar] [CrossRef] [Green Version]
  36. Garrone, F.; Cazzaniga, A.C.M.; Terruggia, R.; Bartalesi, D.; Zanon, F.; Guagliardi, G.A.; Lazzari, R. Risultati della sperimentazione di casi d’uso per servizi elettrici sulla piattaforma Fog INtelliGent Edge Reactive (FINGER); 21008730; RSE, Rapporto di Ricerca di Sistema: Milan, Italy, 2021; Available online: https://www.rse-web.it/rapporti/ (accessed on 24 August 2022).
  37. Simons, A. Road transport: New life cycle inventories for fossil-fuelled passenger cars and non-exhaust emissions in ecoinvent v3. Int. J. Life Cycle Assess. 2016, 21, 1299–1313. [Google Scholar] [CrossRef]
  38. Carvalho, M.L.; Marmiroli, B.; Girardi, P. Life cycle assessment of Italian electricity production and comparison with the European context. Energy Rep. 2022, 8, 561–568. [Google Scholar] [CrossRef]
  39. TERNA. Dati Statistici—Dati generali. 2018. Available online: https://www.terna.it/it/sistema-elettrico/statistiche/pubblicazioni-statistiche#:~:text=Dati%20statistici%202021&text=Il%20fabbisogno%20di%20energia%20elettrica,%2C9%25%20rispetto%20al%202020 (accessed on 24 August 2022).
  40. Peters, J.F.; Baumann, M.; Zimmermann, B.; Braun, J.; Weil, M. The environmental impact of Li-Ion batteries and the role of key parameters–A review. Renew. Sustain. Energy Rev. 2017, 67, 491–506. [Google Scholar] [CrossRef]
  41. Istituto Superiore per la Protezione e la Ricerca. Rapporto rifiuti Speciali; ISPRA: Rome, Italy, 2020.
  42. Eurocities, Sharing Cities. Available online: http://www.sharingcities.eu/ (accessed on 3 March 2021).
  43. Manca, F.; O’Dwyer, E.; Sivakumar, A.; Rolim, C.; Gomes, R.; Tatti, A.; Causone, F.; De Antonellis, S.; Temporelli, A.; Girardi, P. Deliverable D8.7—Final Economic, Social and Environmental Appraisal. Sharing Cities, Call: H2020-SCC-2015; Ref. Ares(2021)8022860-31/12/2021; European Commission: Luxembourg, 2021. [Google Scholar]
  44. Burnham, A.; Wang, M.; Wu, Y. Development and Applications of GREET 2.7--The Transportation Vehicle-CycleModel; Argonne National Lab.(ANL): Argonne, IL, USA, 2006.
  45. Ntziachristos, L.; Boulter, P. Road Vehicle Tyre and Brake Wear. Road Surface Wear. EMEP/CORINAIR Emission Inventory Guidebook; European Environment Agency: Copenhagen, Denmark, 2009. [Google Scholar]
  46. Del Duce, A.; Gauch, M.; Althaus, H.J. Electric passenger car transport and passenger car life cycle inventories in ecoinvent version 3. Int. J. Life Cycle Assess. 2016, 21, 1314–1326. [Google Scholar] [CrossRef]
  47. Ministero dello Sviluppo Economico. Produzione nazionale di idrocarburi—anno 2019. 2019. Available online: https://unmig.mise.gov.it/images/dati/produzione-2019.pdf (accessed on 24 August 2022).
  48. Ministero dello Sviluppo Economico. La situazione energetica nazionale nel 2019. 2020. Available online: https://dgsaie.mise.gov.it/pub/sen/relazioni/relazione_annuale_situazione_energetica_nazionale_dati_2019.pdf (accessed on 24 August 2022).
  49. Girardi, P.; Brambilla, P.C.; Mela, G. Life Cycle Air Emissions External Costs Assessment for Comparing Electric and Traditional Passenger Cars. Integr. Environ. Assess. Manag. 2020, 16, 140–150. [Google Scholar] [CrossRef] [Green Version]
  50. Saxena, S.; Le Floch, C.; MacDonald, J.; Moura, S. Quantifying EV battery end-of-life through analysis of travel needs with vehicle powertrain models. J. Power Sources 2015, 282, 265–276. [Google Scholar] [CrossRef] [Green Version]
  51. Brambilla, P.C.; Temporelli, A.; Mela, G.; Molocchi, A.; Brivio, F. LCA della Mobilità Urbana dalle Persone alle Merci; 21010643; RSE, Rapporto di Ricerca di Sistema: Milan, Italy, 2021; Available online: https://www.rse-web.it/rapporti/ (accessed on 24 August 2022).
  52. Saenz, J.F.M.; Faulin, J. Assessment of the carbon footprint reductions of tricycle logistics services. Transp. Res. Rec. 2016, 2570, 48–56. [Google Scholar] [CrossRef]
  53. Aiello, G.; Quaranta, S.; Certa, A.; Inguanta, R. Optimization of urban delivery systems based on electric assisted cargo bikes with modular battery size, taking into account the service requirements and the specific operational context. Energies 2021, 14, 4672. [Google Scholar] [CrossRef]
Figure 1. System boundaries and main data sources for the assessed vehicles.
Energies 15 07817 g001
Figure 2. SUM-X, the e-cargo bike assessed and monitored in the study.
Energies 15 07817 g002
Figure 3. Percentage breakdown by weight of the materials that make up the analysed e-cargo bike.
Energies 15 07817 g003
Figure 4. Data and information collected during a delivery working day, using the GPS and the other sensors deployed on the e-cargo bike.
Energies 15 07817 g004
Figure 5. Grafana application interface, used to monitor e-cargo bike recharging energy consumptions.
Energies 15 07817 g005
Figure 6. Potential environmental impacts for the assessed vehicles. Values refer to one km driven for delivery last mile goods.
Energies 15 07817 g006
Figure 7. Relative potential impacts for the vehicles under study, for the selected impact categories and for the analysed scenarios (2018, 2030, All PV, All NG). The impacts are presented relative to the diesel van (100%). LCIA categories: CC = Climate Change; POFP = Photochemical Ozone Formation Potential; A = Acidification Potential; PM = Particulate Matter Formation Potential; HH_NC = Human Toxicity Potential, non-cancer; HH_C = Human Toxicity Potential, cancer; REC = Abiotic depletion potential, Energy Carries; RMM = Abiotic depletion potential, mineral and metal. RMMs for e-Vans and PHE Vans are more than twice the impact of diesel vans in all considered scenarios. The detailed results of the sensitivity analysis are available in Table S7 of Supplementary Materials.
Energies 15 07817 g007
Figure 8. Comparison of life cycle CO2 eq/km emission in literature [8,11,12,14,16,17,22].
Energies 15 07817 g008
Table 1. Main features of the assessed vehicles.
DataE-Cargo BikeElectric VanPlug-In Hybrid VanDiesel Van
ModelSUM-XNissan e-NV200Renault MeganeFord Transit Connect
Size (length × width × height) [cm]260 × 150 × 195 456 × 175 × 186436 × 181 × 144442 × 197 × 183
Load compartment capacity [m3]1.754.21.43.6
Max load capacity [kg]300742N.A.903
Curb weight [kg]80148016031620
Range [km]6030065 (electric)+500850
Power supply systemHuman + ElectricElectricPlug-in hybrid (petrol)Diesel
Engine size [cc]--15981499
Emission standard--Euro 6D ISC FCMEuro 6D ISC FCM
Emission treatment system--TWCEGR-DOC-SCR-DPF
Table 2. Energy consumption collected during the experimentation.
VehicleEnergy CarrierUM ConsumptionConsumptionEnergy Consumption [MJ/km]
Nissan e-NV200ElectricitykWh/km0.2200.79
Renault Megane PHEVElectricitykWh/km0.1801.88
Petrolkg/km0.028
Ford Transit ConnectDieselkg/km0.0753.21
Table 3. Pollutant emissions collected during the experimentation.
Renault Megane PHEVFord Transit ConnectUM
CO284.624230.283g/km
CO159.17978.216mg/km
NOx8.88221.676mg/km
THC19.4374.236mg/km
CH41.2031.151mg/km
NMHC18.2343.085mg/km
NH32.7670.164mg/km
N2O1.32610.286mg/km
PM2.50.0040.532mg/km
Table 4. Impact categories results for all the assessed vehicles. Functional unit is 1 km.
Impact CategoryUMCargo Bike SC0Cargo Bike SC1Electric VanPlug-In Hybrid VanDiesel Van
Climate Changekg CO2 eq7.89 × 10−28.01 × 10−21.58 × 10−12.46 × 10−13.31 × 10−1
Photochemical Ozone Formationkg NMVOC eq1.78 × 10−41.82 × 10−43.10 × 10−44.48 × 10−44.88 × 10−4
Acidification terrestrial and freshwatermol H+ eq4.40 × 10−44.49 × 10−49.37 × 10−41.14 × 10−39.61 × 10−4
Respiratory inorganicsdisease inc4.44 × 10−94.49 × 10−98.62 × 10−91.01 × 10−89.08 × 10−9
Non-cancer human health effectsCTUh8.77 × 10−98.96 × 10−92.61 × 10−83.06 × 10−82.64 × 10−8
Cancer human health effectsCTUh1.15 × 10−91.17 × 10−93.76 × 10−94.37 × 10−94.21 × 10−9
Resource use, energy carriersMJ8.42 × 10−18.62 × 10−11.89 × 1003.25 × 1004.49 × 100
Resource use, mineral and metalskg Sb eq7.06 × 10−77.34 × 10−73.88 × 10−63.62 × 10−61.51 × 10−6
Table 5. Electricity mixes, by energy sources.
Electricity Production [%]IT 2018IT 2030All PVAll NG
Solids (coal)9%0%0%0%
Gas (including derived gases)39%35%0%100%
Oil (including refinery gas)3%1%0%0%
Hydro (pumping excluded)15%15%0%0%
Solar7%22%100%0%
Biomass-waste6%5%0%0%
Nuclear energy0%0%0%0%
Import13%8%0%0%
Wind 5%12%0%0%
Geothermal and other renewables2%2%0%0%
Other fuels (hydrogen, methanol)0%0%0%0%
Publisher’s Note: MDPI stays neutral with regard to jurisdictional claims in published maps and institutional affiliations.