Abstract
One of the most promising concentrated solar power technologies is the central receiver tower power station with heliostat field, which has attracted renewed research interest in the current decade. The introduction of the sCO2 recompression Brayton cycles in the near future installations instead of the Rankine cycle is very probable, due to the prospects of a significant efficiency improvement, process equipment size and capital cost reduction. In this study, energy and exergy analysis of a recompression Brayton cycle configuration for a central receiver power station are performed. Special emphasis is given to the computation of actual performance for the High-Temperature Recuperator and the Low-Temperature Recuperator. The results define realistic thermal and exergetic efficiency limits for the specific cycle configurations applied on a central receiver solar power plant with variable turbine entry temperature. Thermal efficiency, predicted with the improved accuracy of heat exchanger computations, does not exceed the 50% target. Overall, a realizable total power plant efficiency of 37% at 900 K turbine entry temperature is predicted, which is a significant improvement on the current state-of-the-art with steam Rankine cycles.
1. Introduction
Concentrated Solar Power (CSP) systems, based on a heliostat field and a high-temperature central receiver, are capable of generating electricity at a very low cost per kWh, particularly in places with high insolation and low cost of land use. The first large-scale pilot project of this kind was Solar One in the Mojave Desert near Barstow, CA, USA in 1981. The project operated from 1982 to 1986, producing a maximum of 7 MWe, with a total number of 1818 heliostats (72,650 m² area). In 1995 it was redesigned and converted to Solar Two (10 MWe, storage technology based on molten salts, heated to 565 °C at the solar receiver) and remained operational until 1999 [1]. Currently, SolarPaces, an international program of the International Energy Agency (IEA) that supports the collaborative development, testing, and marketing of concentrating solar power plants, lists 31 projects in the Power Tower category [2]. The power plants vary in size between 1–133 MW and the prevailing cycle is the steam Rankine cycle, which limits the cycle’s efficiency to about 40% (the plant’s efficiency is significantly lower, mainly due to the losses associated with the central receiver). The thermal storage, necessary to stabilize the cycle from the variability of solar irradiance, is of the order of 12 h, usually based on molten salt technology. Levelized Cost of Electricity (LCOE) values as low as USD 0.08/kWh were projected for recent projects of this type under construction, although actual LCOE for the major existing Crescent Dunes CSP project (Rankine cycle, superheated steam entering turbine at 540 °C@115 bar) [3]) is reported to be USD 0.18/kWh [2]. For comparison, LCOE values of USD 0.048/kWh were reported for photovoltaic installations in 2021 [4]. In order to be competitive with other renewable power plant technologies, further development is continuously carried out, including the application of highly efficient power cycles, further performance optimization of solar components, increasing deployment and reducing size and manufacturing costs, based on modular technology. Moreover, significant effort is necessary to design and implement solar receivers able to perform at high temperatures (up to 700 °C instead of about 550 °C in the current configurations) and allow the integration of thermal energy storage to these temperature levels. Due to the above reasons, power tower systems are expected to receive increased attention with respect to the attainable high temperatures [5]. In this context, the supercritical carbon dioxide (sCO2) Brayton cycle is a promising candidate cycle for a central solar receiver system due to the following advantages [6]:
- Lower capital cost, owing to the small size of the compressors, turbines and heat exchangers;
- High-efficiency levels are attainable at high turbine entry temperatures;
- CO2 can be directly heated in the solar tower receiver;
- CO2 remains in the supercritical gaseous phase during the whole cycle;
- CO2 is non-toxic and non-flammable [7].
The supercritical CO2 power cycle was first proposed by Feher [8] with over 55% thermal efficiency under ideal conditions, proposed to support a compact electric power generation system installed on a trailer. In 2004, Dostál [9] intensively investigated the sCO2 Brayton cycle as a candidate for application in nuclear power plants of the next generation. Kulhánek and Dostál [10] and Moisseytsev et al. [11] presented studies of alternative sCO2 Brayton cycle configurations. They found the cycle with partial cooling and recompression to attain the highest efficiency. Sarkar [12] carried out energy and exergy analysis of sCO2 recompression Brayton cycles in a nuclear reactor. He investigated the effect of various cycle parameters on exergy efficiency and pointed to the high irreversibilities of the heat exchangers compared to those of the compressor and the turbine. Du et al. [13] studied an isothermal compressor model to further reduce compression work. In another work, Du et al. [14] studied the design and off-design control strategies of the supercritical CO2 recompression cycle for a small-scale lead-cooled fast nuclear reactor. Garg et al. [15] comparatively studied simple supercritical, transcritical and subcritical carbon dioxide Brayton cycles for CSP applications. Thermal efficiency, specific work and exergy destruction were employed as performance indicators. The thermal efficiency increased linearly with low side pressure in the sub- and trans-critical cycles. It reached a maximum 85 bar (supercritical cycle). This cycle was shown to be capable of producing power with a thermal efficiency exceeding 30%, even at lower source temperatures (820 K) with higher turbine inlet pressures (~300 bar). The reasons for efficiency reduction compared to the ideal cycle were demonstrated in an irreversibility analysis of the compressor, regenerator, turbine and gas cooler. Sarkar and Bhattacharyya [16] optimized the thermal performance of a sCO2 recompression Brayton cycle with reheat for operating and design conditions pertaining to nuclear power plants.
CO2 was also proposed as a working fluid for trans-critical cycles integrated with solar systems [17]. Additionally, it was combined with Organic Rankine Cycle (ORC) in waste heat exploitation [18]. Turchi et al. [19] performed simulations of the sCO2 Brayton cycle for solar central receiver applications with a dry cooling condenser. They showed that the sCO2 Brayton cycle is superior to the conventional steam Rankine cycle on thermal efficiency grounds. Recompression, partial cooling and main compression intercooling variants exceeded 50% efficiency above 650 °C turbine entry conditions. Singh et al. [20] studied a sCO2 Brayton cycle combined with a parabolic trough CSP system. An active control system was necessary to maintain supercritical conditions. Iverson et al. [21] presented the sCO2 Brayton cycle test facility at Sandia National Laboratory. The pilot plant produced 250 kWe and has proven to be able to operate in the transient conditions met with a CSP plant.
Besarati and Goswami [22] proposed a cycle improvement by adding a bottoming Organic Rankine Cycle. They predicted a 3–7% efficiency increase. The best thermal performance was obtained with the recompression cycle. Chacartegui et al. [23] compared the simple and recompression sCO2 Brayton cycles and combined them with a bottoming cycle. They found that the standalone recompression cycle and the simple Brayton with a bottoming cycle achieved the highest thermal efficiency of 42–43% at 1000 K turbine entry temperature. These values refer to the heat supplied to the main and auxiliary heaters. The total efficiency, referring to the solar energy entering the solar receiver’s cavity, is significantly lower due to the receiver’s losses. More generally, the exergetic efficiency referring to the sun’s thermal radiation does not increase monotonically as the receivers’ temperature increases to high levels in order to gain more exergy. Dating back to 1981, Bejan et al. [24] theoretically studied the amount of exergy delivered by solar collector systems. The heat transfer irreversibilities occurring between the sun and the collector, the collector and the ambient air, and inside the collector, were separately addressed in this analysis. Only 25% of the exergy input was found to be eventually delivered to the power cycle.
Padilla et al. [25] presented energy and exergy analysis of four sCO2 Brayton cycle configurations: simple cycle, recompression cycle, partial cooling with recompression and recompression with main compression intercooling. Dry cooling was used for the supercritical Brayton cycles and a solar receiver, replacing the heater and reheater for conventional Brayton cycles, was used to provide heat input to the cycles. The exergetic performance was evaluated for Alice Springs, AU. High heat exchanger effectiveness values of 0.95 were assumed for the recuperators, main heater, reheater and precooler. Optimum thermodynamic operating conditions were evaluated at the design point. Exergy analysis is essential in spotting the main system’s irreversibilities and optimizing operating conditions to reduce energy and environmental impacts of the energy systems [26,27]. Design improvements in the recuperators receive significant research attention, due to their effects on cycle efficiency [28]. Jin et al. [29] applied multi-objective genetic algorithm optimization on the zig-zag channel parameters in printed circuit heat exchangers for sCO2 cycle applications. Wang et al. [30] presented a theoretical and numerical analysis of conjugate heat transfer in a printed circuit heat exchanger for sCO2 applications. Liu et al. [31] performed experiments on the convection heat transfer and pressure drop of sCO2 in a mini vertical upward flow tube. Ji et al. [32] designed and manufactured a trapezoidal PCHE prototype and experimentally assessed its thermal–hydraulic performance as a regenerator in an sCO2 test loop. The overall heat transfer coefficient reached a maximum of 2.53 kW/(m2·K). Bai et al. [33] performed a thermodynamic analysis of a Brayton cycle for a CSP system with a mixture of CO2–SF6 as the working fluid to improve performance at high heat rejection temperatures with dry cooling. The above presentation points to the fact that the solar central tower power plants will continue to be improved and new installations will be constructed, aiming at further reduction of capital costs towards further reduction of LCOE at levels not achievable by photovoltaics. The introduction of the sCO2 recompression Brayton cycles in these new installations, instead of the Rankine cycle, is very probable due to the prospects of a significant efficiency improvement, process equipment size and capital cost reduction. Recompression cycle versions, together with reheat, appear able to reach the SunShot target of 50% cycle efficiency, even with dry cooling. For these reasons, DOE has selected this cycle as the leading candidate for achieving the overall SunShot target [3].
In this context, it is necessary to study the feasible cycle efficiency levels based on the actually attainable effectiveness of the high- and low-temperature recuperators, which carry out significant heat exchange duties that are not only comparable with the main heater but—in the case of the high-temperature recuperator—almost twice the main heater’s duty. This is the purpose of the current study, which attempts to define the actually attainable limits in cycle thermal and exergetic efficiency, along with power plant efficiency. As revealed by the energy and exergy analysis of a realizable version of a recompression Brayton cycle with sCO2 in the current work, the exergy loss associated with the recuperators practically sets the limits of the attainable efficiency of the cycle and the power plant. The recompression version of the cycle is selected in terms of the high efficiency and simple, lower capital cost layout with a single turbine.
2. Materials and Methods
Due to the abrupt variation of the properties of CO2 near the critical point [7], the simple sCO2 Brayton cycle is limited by temperature pinch-point problems in the HTR due to the difference in the heat capacity rate between the hot and cold side [16]. Previous studies indicated that high-efficiency levels are attainable with the recompression Brayton cycle, which will be examined in the present study, with the solar receiver providing heat input. The basic layout diagram of the cycle examined is presented in Figure 1. CO2 at temperatures ranging from 500 to 800 °C and high pressure (of the order of 20 MPa, state 5) is expanded through the turbine (T). The exit stream of the turbine (state 6) enters first the High-Temperature Recuperator (HTR), which recovers energy to preheat the stream entering the solar receiver (state 4). Next, the exit stream passes through the Low-Temperature Recuperator (LTR). In this way, energy is further recovered to preheat the stream exiting the main compressor (state 2). The stream leaving the LTR (state 8) is split into two streams (split ratio 0.6); the first stream (60% of the total mass flowrate) enters the main compressor (MC) and the second stream (40%) enters the recompressor (RC), which is a secondary compressor operating at the exit conditions of the low-temperature recuperator [16]. The induced split flow reduces the total cold fluid’s capacitance to avoid pinch-point problems in the LTR.
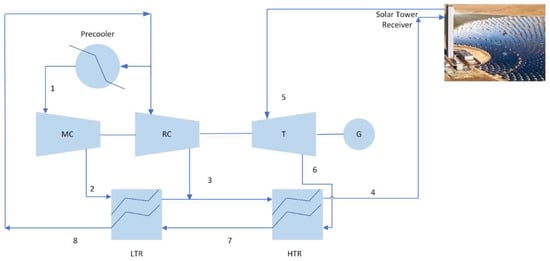
Figure 1.
Layout of an sCO2 recompression Brayton cycle with partial cooling combined with a solar central receiver CSP power plant.
The stream leaving the main compressor (state 2) is preheated in the LTR as explained above and then mixed with the stream leaving the recompressor. The mixed stream (state 3) recovers energy through the HTR and enters the solar receiver. The HTR’s duty is about twice the main heater’s duty. Part of the work produced by the turbines is to drive the two compressors. In order to decrease the main compressor’s work, the part of the fluid stream leaving the LTR (state 8) must be pre-cooled to a temperature very close to the critical point of CO2 (state 1) before entering the compressor. The above processes and the magnitude of the respective heat and power quantities and irreversibilities are better understood in the typical temperature–entropy diagram of Figure 2, which is calculated for the case with 873 K turbine entry temperature.
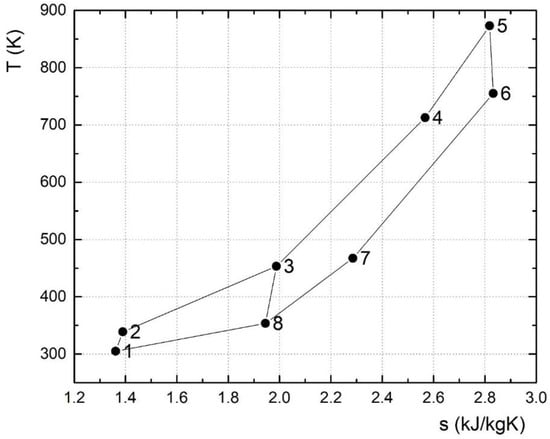
Figure 2.
Temperature–entropy diagram for the recompression sCO2 Brayton cycle examined. High temperature of the Brayton cycle 600 °C (873 K).
In the framework of the energy analysis and performance optimization, mass and energy balances are carried out in the four heat exchangers, the two compressors and the turbine. Due to the rapid property variation of CO2 near critical conditions, it is necessary to study in detail the recuperators’ performance [34]. The HTR and the LTR are Printed Circuit Heat Exchangers (PCHE). They are modeled by means of a segmental computation methodology presented in [35], which employs a 3D conjugate heat transfer computation of the performance of a small two-channel module of the PCHE type. Thus, the heat exchanger effectiveness is computed for a given design of the channels’ geometry and overall heat exchanger’s configuration. That is, the heat exchanger’s effectiveness is not based on an assumption, as is the usual practice [22].
The enthalpy at state 8 is based on the minimum reachable temperature of the hot stream leaving the LTR (state 2) [36]. Another important parameter used to model sCO2 cycles associated with the LTR’s operation is the above-mentioned split ratio (SR), which is determined by an energy balance on the LTR and found very close to 0.6 for typical sCO2 recompression cycle configurations:
The thermal efficiency of the cycle is calculated as:
The energy, mass and exergy balance equations along with the segmental computation method for the recuperators are written in Python 3.10 [37]. The properties database REFPROP 9.1 [38] is employed for the thermodynamic properties of carbon dioxide (CO2) under supercritical conditions based on the model developed by Span and Wagner [39]. Out of the usually adopted assumptions in the cycle computation [19,22], only the following—very reasonable ones—are kept in the current study:
- All components of the cycle are assumed adiabatic;
- The cycle operates under steady-state conditions.
The cycle computation is performed by means of an iterative procedure, summarized in the flowchart of Figure 3 and further explained in the Appendix A.
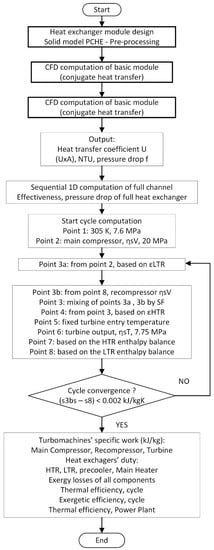
Figure 3.
Flowchart of the cycle calculation with recuperators’ performance based on the CFD-aided, 1D segmental heat exchanger calculation methodology.
The energy model produces similar results to those of Dostál [9] and Turchi et al. [19] whenever uniform heat exchanger effectiveness values of 0.95, turbine efficiency 0.93, compressors’ efficiency 0.89, turbine inlet temperature 800 °C and minimum pinch-point temperature of 5 °C are adopted. However, uniform heat exchanger effectiveness at such high levels is an oversimplification, especially for the HTR and LTR, as will be discussed in the next section.
3. Recuperators’ Performance Computations
The energy model of the solar tower CSP system with sCO2 recompression Brayton cycle needs more detailed heat exchanger computation procedures in order to give realistic results. The CFD-aided heat exchanger calculation methodology mentioned above was successfully employed for the two recuperators, HTR and LTR, which are based on the printed circuit heat exchanger (PCHE) technology [35]. The CFD computation is applied to a small basic module of the heat exchanger’s channels of about 50 mm in length (Figure 4), which incorporates the basic geometry of the high-pressure (HP) and low-pressure (LP) heat exchanger channels, based on the specific design choices with regard to channel dimensions and layout, wall roughness and zig-zag angles. The boundary conditions for the basic module involve the inlet gas temperatures for the hot and cold channels, the exit gas pressures for the hot and cold channels as well as the respective mass flow rates.
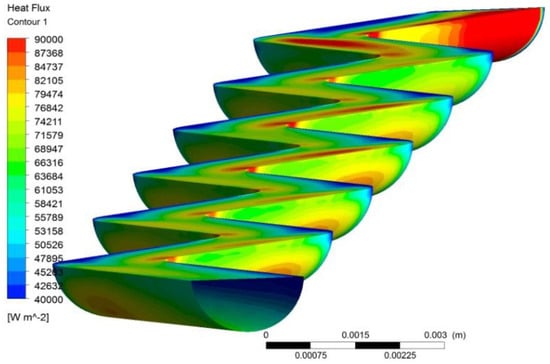
Figure 4.
CFD computation of an HTR channel module: Heat Flux from the low pressure (hot stream) side of sCO2 to the channel’s wall.
The solid model of the module is imported to ANSYS CFX [40], where a 3D, steady-state computation is set up. CO2 thermophysical properties are based on the NIST REFPROP Database [41]. The standard k-epsilon turbulence model was found to adequately match the thermal behavior of the heat exchanger module, without a significant effect on pressure drop prediction accuracy [42]. Periodic boundary conditions are applied to the top, bottom, left and right sides of the stainless steel module. The mass flow rate per individual channel is rationally selected based on CFD computations to understand the trends of the heat exchanger effectiveness and pressure drop.
The CFD computation produces the product U·A (heat transfer coefficient times heat transfer area). Average heat transfer coefficients of the order of 2000 W/m2K are attainable with this technology within the permissible pressure drop of about 1%. The second part of the calculation exploits the average value of U·A from the CFD computation in a segmental, 1D computation of the performance of the full channel length, based on the energy balance equation for each module and the basic heat transfer kinetic equation:
The results of the detailed, CFD-aided computation prove that attainable values of heat exchangers’ effectiveness are of the order of 0.86 for the HTR and 0.91 for the LTR. The specific methodology was employed in this study for the accurate determination of all the recuperators’ effectiveness. The significance of the cycle’s efficiency, especially of the HTR, which has twice the duty of the main heater, will be demonstrated in the exergy computations of the next section.
The segmental computation for the HTR produces as output the evolution of the CO2 temperatures in the low-pressure (hot stream) and high-pressure (cold stream) of the recuperator. This is presented in Figure 5 for a PCHE channel of 1.0 m total channel length that can fit the recuperator’s duty in a sCO2 recompression Brayton cycle with 823 K turbine entry temperature, by a selection of the necessary number of channels. The recuperator’s effectiveness may be increased if one reduces the temperature approach of the two streams. However, the required recuperator’s length increases significantly and produces a high-pressure drop penalty. The heat exchanger’s operation mode is complex, as may be assessed by Figure 6, which presents the evolution of heat flux from the hot to the cold fluid in the heat exchanger’s segments and the respective variation of cp (hot and cold side). The heat flux transferred gradually increases as we move from the low-temperature to the high-temperature part of the heat exchanger, due to the increasing temperature difference between the hot and cold side, as one moves from left to right of the heat exchanger.
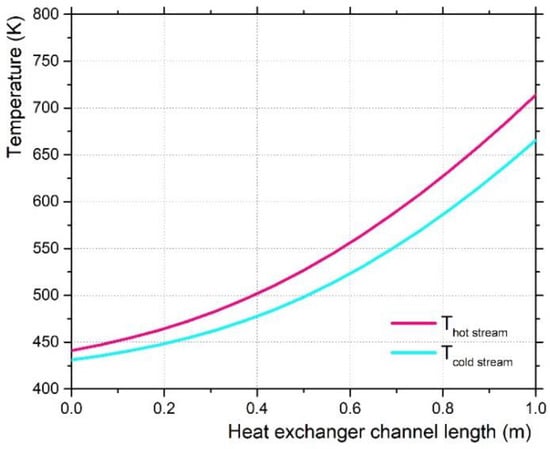
Figure 5.
Typical computation of the HTR’s performance: Evolution of temperature difference along a heat exchanger channel’s length.
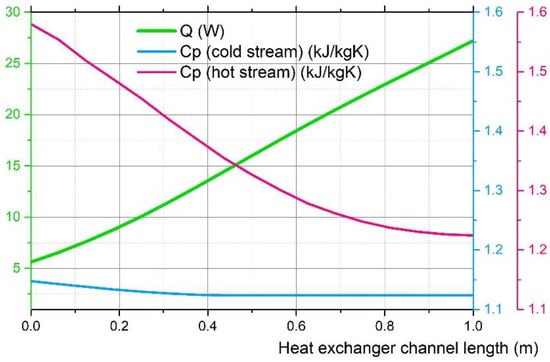
Figure 6.
Variation of heat flux from the hot to the cold stream for a typical channel length of the HTR, with the variation of sCO2 heat capacities in the hot and the cold streams superimposed.
This trend is related to the evolution of the cp ratio between hot and cold streams as one moves from the left to the right side (Figure 7), which gives an idea of the complexities induced by CO2 thermal properties, especially for the LTR, which operates at the low-temperature part of this diagram.
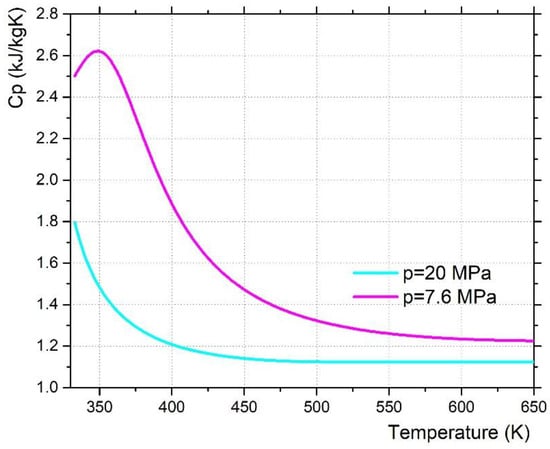
Figure 7.
Variation of the sCO2 heat capacity with temperature for the high-pressure and the low-pressure side of the cycle.
The next task is the computation of the LTR, where the mass flow rates differ because of the flow split at point 8. Only 60% of the mass flow rate is fed to the high-pressure side of the LTR. The average heat transfer coefficient, U, is computed to values of the order of 2000–2200 W/m2K by dividing the average heat flux by LMTD. Experimental results from the work of other researchers for the specific heat exchanger type find U in the range of 1100–2500 W/m2K [32]. The results for the Low-Temperature Recuperator (LTR) are presented in the diagram of Figure 8. The actual recuperator’s effectiveness is computed based on the selected heat exchanger’s length (ε = 0.91).
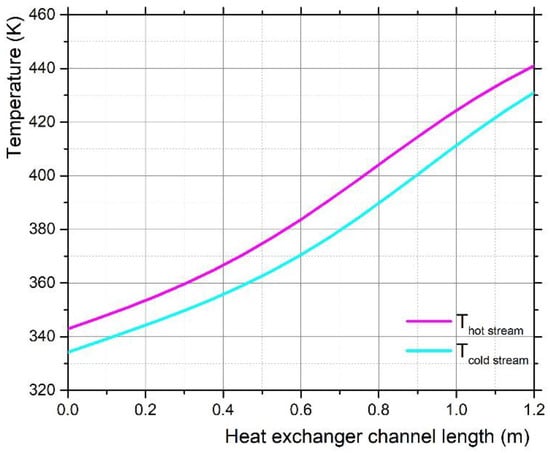
Figure 8.
Typical computation of the LTR’s performance: Evolution of temperature difference along a heat exchanger channel’s length.
The LTR’s operation is more complex, as seen by the evolution of heat flux transferred from the hot to the cold fluid, as well as the respective variation of cp for the hot and cold side (Figure 9). It can be observed in this Figure that, due to the peculiarities of cp variation between the two streams, the heat transferred from the hot side to the cold side is maximized towards the middle of the heat exchanger length.
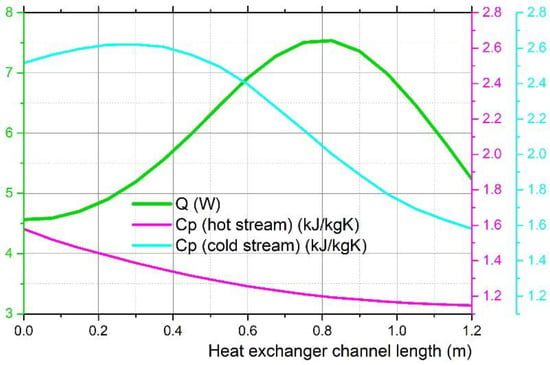
Figure 9.
Variation of heat flux from the hot to the cold stream for a typical channel length of the LTR, with the variation of sCO2 heat capacities in the hot and the cold streams superimposed.
Overall, the heat exchanger’s effectiveness values attainable for the LTR are higher than with respect to the HTR. This is explained by the nearly constant temperature difference between the hot and cold streams observed in Figure 8, in contrast to the behavior of the HTR (Figure 5), where the pinch point at the low-temperature side does not allow for further reduction of the temperature approach between the two streams. The computations are completed with the pressure drop for the full channel, which is indicative of the pressure drop for the total heat exchanger if the headers’ and collectors’ losses are neglected at first approximation. The allowable pressure drop in this type of recuperator is 1% of the inlet pressure. Although lower pressure drops are desirable to reduce operating costs and improve cycle efficiency, a too-small pressure drop increases size and capital cost.
4. Results of Energy Calculations
The accurate computation of heat transfer effectiveness values for the HTR and the LTR enables the realistic computation of the full cycle, based on the procedure described in the previous section. To this end, an additional computation is necessary, which takes into account the solar receiver’s losses due to self-emission and convection losses to the environment.
The central receiver’s thermal efficiency may be calculated as follows [43]:
where α is the average receiver’s shortwave absorptivity; ε is the average shortwave emissivity of the receiver; TR is its surface temperature; is the view factor from the receiver to its surroundings; is the convection coefficient (W/m2K); is the efficiency of the heliostats’ field; is the direct normal solar irradiance (W/m2); and C is the heliostats’ concentration ratio. To simplify the calculation of the receiver’s heat losses, the surface temperature of the solar receiver’s cavity is roughly approximated as:
where is the solar receiver’s temperature approach, assumed at the order of 150 °C [44,45]. The parameter values employed in calculating the thermal efficiency of the central receiver are summarized in Table 1.

Table 1.
Input parameters for calculating the central receiver’s efficiency [43].
The effect of turbine entry temperature on the thermal efficiency of the central receiver is presented in Figure 10, along with the effect of the solar receiver temperature approach. The maximum temperature at turbine entry is limited by solar receiver technology since metallic tubular receivers do not currently withstand more than 800 °C exit temperatures [46].
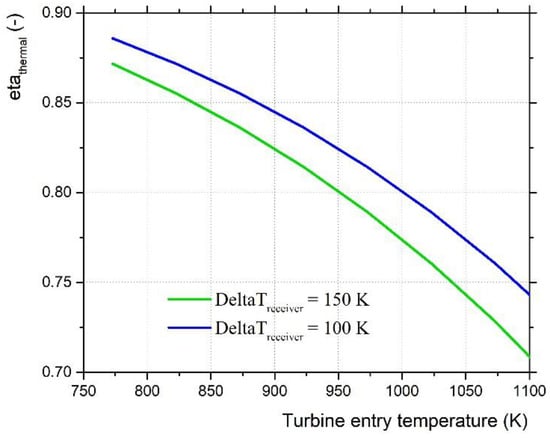
Figure 10.
Thermal efficiency of the central receiver as function of turbine entry temperature. Effect of two different solar receiver temperature approach values (150 vs. 100 °C).
If in the continuing process of improvements in central receiver technology, the temperature approach could be reduced from the currently attained values of 150 °C to 100 °C, the thermal efficiency of the central receiver is shown to significantly improve, especially at higher receiver temperatures, which is expected to have favorable effects on the attainable cycle’s efficiency [46]. The location of the solar tower power plant is assumed to be in the Eastern part of Crete, Greece, in a location with high insolation levels, where a previous experiment had been conducted in a small-size pilot plant [1].
The inlet temperature of the compressor is calculated as:
where ITD is the initial temperature difference, assumed to be 12 °C. Therefore the reference compressor inlet temperature for the computations is set to 32 °C. This is point 1 of the cycle (Figure 2) and it must be kept close to the critical temperature of CO2 (31.1 °C) by the action of the pre-cooler. Since the CO2 density at these thermodynamic states is very high to the order of 600 kg/m3, the compressor’s work is minimized and the required high efficiency for the recompression sCO2 Brayton cycles is attainable. If the compressor’s inlet temperature goes a few degrees higher, there is a rapid reduction of the working medium’s density which deteriorates the cycle’s efficiency.
Cycle computations were performed by varying the turbine entry temperature (TET) from 773 K to 1023 K at intervals of 50 K. The results are summarized in Figure 11, where the evolution of 1st Law efficiency as a function of the turbine entry temperature is presented. As long as the efficiency of the central receiver is not included, the cycle’s efficiency with regard to the heat supplied to the main heater is monotonically increasing from 41.3% @773 K to 47.3% @ 1023 K TET. This indicates that the DOE Sunshot target of 50% cycle efficiency is very difficult to attain with the current receiver technology and attainable temperatures at the turbine’s entry [3]. These values are significantly lower than the ones computed in the bibliography based on optimistically high recuperators’ effectiveness values of 0.95 [25]. Indicative values resulting from computations with ideal recuperators’ effectiveness values are also presented in the same Figure for comparison (shown to reach 59% @1023 K TET). In addition to the internal cycle’s efficiency results, the calculation of the evolution of the central receiver’s thermal efficiency, based on Equation (5) and the assumptions of Table 1, is shown in the same Figure to reduce monotonically from 87% @ 773 K to 76% @ 1023 K TET. The resulting overall thermal efficiency of the solar tower power plant is seen to present a maximum value of 37.2–37.3% at turbine entry temperatures of 873–923 K, respectively. The turbine entry temperatures for maximum overall efficiency agree with the calculations of other researchers [25]. However, as expected, the overall efficiency levels predicted with the actually realizable recuperators’ effectiveness values are lower. The reasons will be apparent from the exergy analysis in the next section.
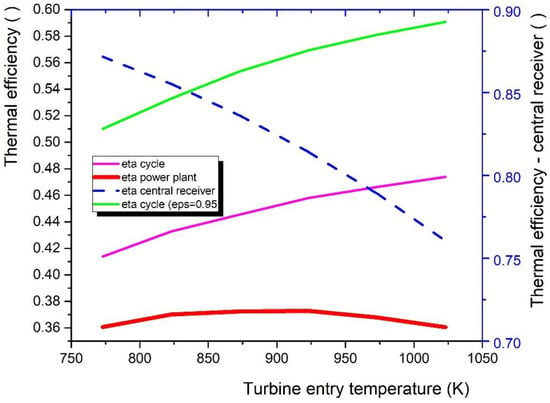
Figure 11.
First law efficiencies of recompression sCO2 Brayton cycle with the solar tower system, as function of the turbine entry temperature: ideal values of heat exchangers’ effectiveness (ε = 0.95), vs. realistic values.
As a next step in the presentation of energy computation results, Figure 12 compares the specific work of the compressors and turbine, along with the specific duties (per kg of CO2 working medium) of all heat exchangers, as a function of the turbine entry temperature. As expected, the main compressor’s specific work is kept constant, since the conditions at the main compressor’s entry (state 1) are kept constant for all cycle versions examined. The specific work of the recompressor is slightly increasing with turbine entry temperature and is 58–82% higher than the respective main compressor’s work due to the significantly lower CO2 density at the recompression operation temperature levels. On the other hand, the work output of the turbine is monotonically increasing from 116 to 159 kJ/kg as one moves from 773 to 1023 TET. The LTR’s duty stays about 20–30% higher than the pre-cooler’s duty, which increases from 98 to 132 KJ/kg moving from 773 to 1023 TET. On the other hand, the main heater’s duty stays 80% higher than the pre-cooler’s duty. Most important, the HTR’s duty is seen to take very high values, monotonically increasing with the turbine entry temperature, from 270 to 425 kJ/kg. The HTR’s duty stays 55–80% higher than the main heater’s duty.
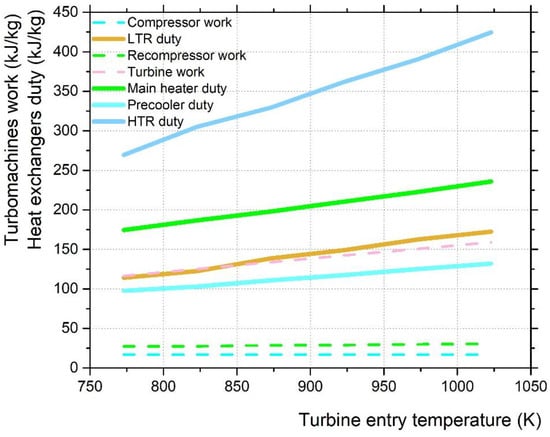
Figure 12.
Specific Heat exchangers’ duties and specific work of turbomachines.
The above observations explain the prevailing role of the HTR’s effectiveness on the exergy losses of the cycle, which set the attainable limits of exergetic efficiency of this cycle, as will be explained in the next section where the proposed model is extended to an exergy analysis for the recompression sCO2 Brayton cycle integrated with a solar receiver.
5. Exergy Analysis Procedure
The exergy balance corresponding to the control volume around each component of the cycle is calculated in the generalized form [36]:
where the heat interactions of the control volume are associated with the respective exergy interactions:
On the other hand, the mass flows into and out of the control volume are associated with the respective specific exergy at the inlet and outlet, which is a thermodynamic state variable defined in terms of state variables enthalpy and entropy and the environment datum point ) as follows:
In this paper, the steady-state operation of the system is examined, thus . Moreover, the recompression sCO2 Brayton cycle is integrated with a central solar receiver. Thus the exergy input includes, in principle, the exergy of the incoming solar radiation to the solar receiver:
where is the efficiency of the solar receiver and is the heliostat field efficiency [43], which includes the cosine losses, the reflectance losses and spillage and is the dimensionless maximum useful work that could be gained by the solar radiation. This is approximated by Petela’s formula [47]:
where is the blackbody temperature of the Sun (5800 K).
However, a large percentage of the exergy input coming from the sun calculated by the above formula cannot be recovered (e.g., the efficiency of the heliostat field is close to its theoretical limit), which leads to very small values for the exergetic efficiency of the cycle if referred to this exergy input. In this study, we prefer to refer to the exergy input to the working medium at the surface of the solar tower receiver’s heat exchanger (main heater) by means of the following equation:
where TR is the surface temperature of the solar receiver’s cavity and is the specific heat input to the cycle per kg of CO2 working medium. This heat input is lower than the thermal radiation entering the receiver’s cavity, as expressed by the receiver’s thermal efficiency. The input parameters and the standard environmental state (Tu; Pu) used for the exergy analysis are presented in Table 2.

Table 2.
Input parameters used in the exergy analysis of the sCO2 recompression Brayton cycle.
The overall exergetic efficiency, , is calculated as:
Equation (14) can be alternatively expressed in terms of the exergy losses and exergy destruction as follows:
In this case, the exergy losses are associated with irreversibilities due to heat transfer with finite temperature differences in the heat exchangers, while the exergy destruction is associated with internal irreversibilities in the turbomachines and friction losses in the piping.
For the main heater (solar receiver), the exergy losses can be calculated by subtracting the exergy difference across the heater (e5-e4) from the exergy of the heat input to the main heater .
For the pre-cooler, the exergy difference (e8-e1) across it is considered to be exergy loss as a whole, since the small increase in exergy of the cooling air (or water) is not considered exploitable. As regards the recuperators, HTR and LTR, their exergy losses are calculated by subtracting the exergy increase across the cold stream from the exergy decrease across the recuperator’s hot stream. Finally, the exergy loss across the compressors and the turbine is calculated by subtracting the exergy increase in the compressors from the work supplied to the compressors and subtracting the work output of the turbine from the exergy decrease across the turbine, respectively.
6. Exergetic Performance Results and Discussion
In order to better understand the exergetic performance of each component of the cycle, we start with a comparison of the T–s diagrams computed for the two limiting cases examined, with the lowest (773 K) and the highest (1023 K) turbine entry temperatures (Figure 13). It can be observed that as the main heater receives heat at higher temperatures, the heat exchanger duties for the HTR and the LTR are increased accordingly, in order to bridge the increasing enthalpy distance between the compressor and the turbine.
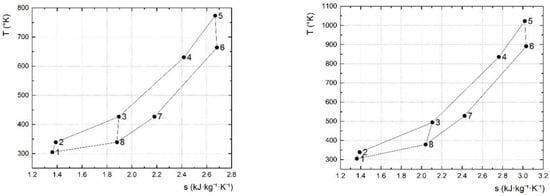
Figure 13.
Comparison between the cycles with lowest and highest turbine entry temperatures examined in this study.
The rapid increase in the HTR and the LTR duty is detailed in Table 3. As a next step, the exergy losses are calculated for each component and also presented in Table 3, along with the turbomachines’ specific work, the heat exchangers’ duties and the 1st and 2nd Law efficiencies as a function of the turbine entry temperature.

Table 3.
Comparison of main cycle and component figures, along with thermal and exergetic efficiency as function of Turbine entry temperature.
Moreover, the evolution of exergy losses for all the components of the power plant is presented in Figure 14 along with the evolution of the resulting exergetic efficiency as a function of the turbine entry temperature. It should be noted again that the exergy losses of the central receiver and heliostat field are not included in this analysis since they are significantly larger than the rest and complicate the process of cycle optimization.
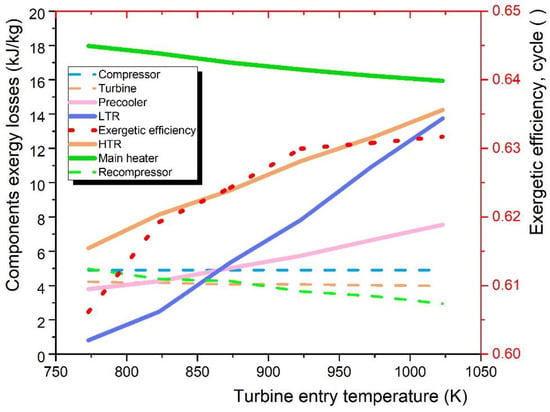
Figure 14.
Exergy losses of the various components of the power plant as function of turbine entry temperature.
Looking into the components’ exergy losses, the major exergy losses of the system are caused by the main heater and HTR, followed by the LTR. As shown in Figure 14, while the main heater’s exergy losses have a tendency to gradually decrease with TET, the HTR’s exergy losses have the opposite tendency and increase with the turbine entry temperature. Moreover, the LTR’s exergy losses, which, as expected, are low at low TET and are seen to increase more steeply and approach those of the LTR at the highest temperatures. On the other hand, the exergy losses of the pre-cooler are seen to steadily increase with turbine entry temperature and reach more than 50% of the HTR’s and LTR’s losses at 1023 K TET. As regards the turbomachines, the highest exergy loss takes place in the main compressor, followed by the main turbine, while the recompressors losses start as high as the compressor’s, but reduce at high TET. The cycle’s exergy efficiency tends to increase slightly as a function of turbine entry temperature to stabilize to 63% as the TET approaches 1023 K. Thus, by increasing the turbine entry temperature beyond 900 K, the gains in the exergy entering the main heater seem to be canceled by the increasing central receiver’s losses to the environment. What is important to note is that all cycle versions with turbine inlet temperatures in the range of 773–1023 K demonstrate an exergy efficiency higher than 60%, which agrees with the similar behavior of the energy efficiency trends presented above. Exergy efficiency values computed for similar cycle variants by Padilla et al. [25] are significantly lower since they include the exergy loss of incoming solar radiation, as reported above. On the other hand, the above-reported exergy losses of the recuperators are higher in our case due to the lower effectiveness values computed by our methodology.
However, the application of the sCO2 Brayton cycles will require significant improvements in solar central receiver technology and heat storage technology in order to allow for a steady-state power plant operation. Alternatively, the application of an auxiliary heater burning natural gas could maintain power output against the hourly and daily variability of solar irradiance.
7. Conclusions
Energy and exergy analysis of a recompression sCO2 Brayton cycle were carried out for a solar central receiver CSP power plant at the range of turbine entry temperatures between 873–1023 K. The analysis was based on improved knowledge of the High-Temperature and Low-Temperature Recuperators’ performance of PCHE technology, based on a previously developed, CFD-aided computation methodology.
The maximum cycle’s thermal efficiency computed for a 1023 K turbine entry temperature is 47.3%, which falls short of the SunShot target of 50% cycle efficiency set by the US Department of Energy because of taking into account the realizable values for the PCHE recuperators’ effectiveness, calculated by the improved methodology.
On the other hand, the total power plant’s energy efficiency, taking into account the central receiver’s losses, is computed to exceed 36% at turbine entry temperatures of 773 K with a maximum of 37% at 900 K. These turbine entry temperatures would require the central receiver’s temperatures to increase to 650 °C instead of the currently attained 550 °C in power plants working with the Rankine steam cycle.
The cycle’s exergy efficiency only slightly increases with turbine entry temperature in the range of 773–1023 K, stabilizing at 63% above 900 K, which defines the attainable limits in the cycle’s exergetic efficiency based on a rational heat exchanger effectiveness computation.
Apart from the solar receiver and main heater, the High- and Low-temperature recuperators are the components with the highest exergy losses. The results confirm the suitability of recompression sCO2 Brayton cycles with turbine entry temperatures of 800–900 K for central solar receiver systems due to their higher thermal and exergetic efficiency compared to conventional steam Rankine cycles.
Future work will examine further cycle improvements with the introduction of reheat and expansion to a second turbine, which is expected to improve the cycle’s efficiency towards the 50% target. To this end, the cycle computation would include significant improvements in the solar central receiver’s model, the application of heat storage technology to allow stable power plant operation, or alternatively, the application of an auxiliary heater could maintain steady power output against the hourly and daily variability of solar irradiance.
Author Contributions
Conceptualization, G.S. and T.S.; methodology, T.S.; software, G.S.; validation, G.S.; formal analysis, T.S.; resources, T.S.; writing—original draft preparation, G.S.; writing—review and editing, T.S.; supervision, T.S. All authors have read and agreed to the published version of the manuscript.
Funding
This research received no external funding.
Acknowledgments
The authors are indebted to Antiopi-Malvina Stamatellou for her assistance with carrying out the recuperators’ modules CFD computations.
Conflicts of Interest
The authors declare no conflict of interest.
Appendix A
The cycle computation procedure summarized in Figure 3 is described in more detail below:
Starting from a specific printed circuit heat exchanger’s basic module geometry, the CFD analysis solves the conjugate heat transfer problem and outputs the heat transfer coefficient, U, and the friction factor for the pressure drop computation. These data are inserted in a 1D segmental computation for the full heat exchanger’s channel length, resulting in a realistic value for heat exchanger effectiveness and pressure drop.
The procedure is applied for both recuperators, namely, the HTR and LTR. The high-pressure (cold stream) and low-pressure side (hot stream) for the HTR and the LTR are shown in color in the T–s diagrams of Figure A1 for a recompression Brayton cycle with a turbine entry temperature of 823 K.
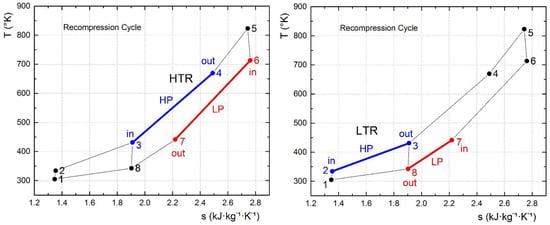
Figure A1.
High-Pressure (cold—blue color) and Low-Pressure (hot—red color) streams in the HTR (left) and the LTR (right).
The recuperators’ effectiveness and pressure drop values are employed in the calculation of the complete cycle by means of an iterative procedure, starting from the main compressor’s inlet (state 1, see Figure 2), which is set to 76 bar and 305 K for all cycle versions.
State 2 is computed based on the assumption of the compressor’s isentropic efficiency.
State 3 is computed by mixing the stream from state 8 based on the recompressor’s isentropic efficiency and the stream from state 2 based on the LTR’s performance.
State 4 is derived based on the previously computed HTR’s effectiveness.
State 5 is fixed by the selected turbine entry temperature and the high pressure (19.9 MPa minus the pressure drop in the HTR and main heater).
State 6 is computed based on the assumption of the turbine’s isentropic efficiency.
State 7 is computed based on the HTR’s enthalpy balance.
State 8 is computed based on the LTR’s enthalpy balance.
The iterative process continues back to state 3 s, until a complete convergence is attained with regard to the entropy at state 3 s (usually within 3–4 iterations).
References
- Poole, L. Concentrating Solar Power: Energy from Mirrors; No. DOE/GO-102001-1147; NREL/BR-810-28751; National Renewable Energy Laboratory: Golden, CO, USA, 2001.
- SolarPaces. Concentrating Solar Power (CSP): Power Tower Projects. 2022. Available online: https://solarpaces.nrel.gov/by-technology/power-tower (accessed on 10 September 2022).
- Mehos, M.; Turchi, C.; Vidal, J.; Wagner, M.; Ma, Z.; Ho, C.; Kolb, W.; Andraka, C.; Kruizenga, A. Concentrating Solar Power Gen3 Demonstration Roadmap; No. NREL/TP-5500-67464; National Renewable Energy Laboratory: Golden, CO, USA, 2017.
- IRENA. Renewable Power Remains Cost-Competitive amid Fossil Fuel Crisis. 2022. Available online: https://www.irena.org/newsroom/pressreleases/2022/Jul/Renewable-Power-Remains-Cost-Competitive-amid-Fossil-Fuel-Crisis (accessed on 10 September 2022).
- Tian, Y.; Zhao, C.Y. A review of solar collectors and thermal energy storage in solar thermal applications. Appl. Energy 2013, 104, 538–553. [Google Scholar] [CrossRef]
- Persichilli, M.; Kacludis, A.; Zdankiewicz, E.; Held, T. Supercritical CO2 Power Cycle Developments and Commercialization: Why sCO2 can Displace Steam. In Proceedings of the Power-Gen India & Central Asia 2012, New Delhi, India, 19–21 April 2012; Echogen Power Systems LLC: Akron, OH, USA, 2012. [Google Scholar]
- ANSI/ASHRAE Standard 15-2013; Safety Standard for Refrigeration Systems. ANSI/ASHRAE: Atlanta, GA, USA, 2013.
- Feher, E.G. The supercritical thermodynamic power cycle. Energy Convers. 1968, 8, 85–90. [Google Scholar] [CrossRef]
- Dostal, V. A Supercritical Carbon Dioxide Cycle for Next Generation Nuclear Reactors. PhD Thesis, Department of Nuclear Engineering, Massachusetts Institute of Technology, Cambridge, MA, USA, 2004. [Google Scholar]
- Kulhanek, M.; Dostal, V. Supercritical Carbon Dioxide Cycles Thermodynamic Analysis and Comparison. In Proceedings of the Supercritical CO2 Power Cycle Symposium 2011, Boulder, CO, USA, 24–25 May 2011. [Google Scholar]
- Moisseytsev, A.; Sienicki, J.J. Investigation of alternative layouts for the supercritical carbon dioxide Brayton cycle for a sodium-cooled fast reactor. Nucl. Eng. Des. 2009, 239, 1362–1371. [Google Scholar] [CrossRef]
- Sarkar, J. Second law analysis of supercritical CO2 recompression Brayton cycle. Energy 2009, 34, 1172–1178. [Google Scholar] [CrossRef]
- Du, Y.; Yang, C.; Zhang, H.; Hu, C.; Zhao, B.; Zhao, W. Research on the applicability of isothermal compressors to supercritical carbon dioxide recompression cycle for nuclear energy. Ann. Nucl. Energy 2023, 180, 109463. [Google Scholar] [CrossRef]
- Du, Y.; Yang, C.; Yu, Z.; Bao, W.; Hu, C.; He, X. Integrated design and off-design hybrid control strategy of supercritical CO2 recompression cycle for nuclear power. Appl. Therm. Eng. 2022, 217, 119194. [Google Scholar] [CrossRef]
- Garg, P.; Kumar, P.; Srinivasan, K. Supercritical carbon dioxide Brayton cycle for concentrated solar power. J. Supercrit. Fluids 2013. 76, 54–60. [CrossRef]
- SSarkar, J.; Bhattacharyya, S. Optimization of recompression S-CO2 power cycle with reheating. Energy Convers. Manag. 2009, 50, 1939–1945. [Google Scholar] [CrossRef]
- Song, Y.; Wang, J.; Dai, Y.; Zhou, E. Thermodynamic analysis of a transcritical CO2 power cycle driven by solar energy with liquified natural gas as its heat sink. Appl. Energy 2012, 92, 194–203. [Google Scholar] [CrossRef]
- Wang, J.; Sun, Z.; Dai, Y.; Ma, S. Parametric optimization design for supercritical CO2 power cycle using genetic algorithm and artificial neural network. Appl. Energy 2010, 87, 1317–1324. [Google Scholar] [CrossRef]
- Turchi, C.S.; Ma, Z.; Neises, T.W.; Wagner, M.J. Thermodynamic Study of Advanced Supercritical Carbon Dioxide Power Cycles for Concentrating Solar Power Systems. J. Sol. Energy Eng. 2013, 135, 041007. [Google Scholar] [CrossRef]
- Singh, R.; Miller, S.A.; Rowlands, A.S.; Jacobs, P.A. Dynamic characteristics of a direct-heated supercritical carbon-dioxide Brayton cycle in a solar thermal power plant. Energy 2013, 50, 194–204. [Google Scholar] [CrossRef]
- Iverson, B.D.; Conboy, T.M.; Pasch, J.J.; Kruizenga, A.M. Supercritical CO2 Brayton cycles for solar-thermal energy. Appl. Energy 2013, 111, 957–970. [Google Scholar] [CrossRef]
- Besarati, S.M.; Goswami, D.Y. Analysis of Advanced Supercritical Carbon Dioxide Power Cycles With a Bottoming Cycle for Concentrating Solar Power Applications. J. Sol. Energy Eng. 2013, 136, 010904. [Google Scholar] [CrossRef]
- Chacartegui, R.; de Escalona, J.M.; Sánchez, D.; Monje, B. Alternative cycles based on carbon dioxide for central receiver solar power plants. Appl. Therm. Eng. 2011, 31, 872–879. [Google Scholar] [CrossRef]
- Bejan, A.; Kearney, D.W.; Kreith, F. Second Law Analysis and Synthesis of Solar Collector Systems. J. Sol. Energy Eng. 1981, 103, 23–28. [Google Scholar] [CrossRef]
- Padilla, R.V.; Too, Y.C.S.; Benito, R.; Stein, W. Exergetic analysis of supercritical CO2 Brayton cycles integrated with solar central receivers. Appl. Energy 2015, 148, 348–365. [Google Scholar] [CrossRef]
- Bejan, A.; Tsatsaronis, G.; Moran, M.J. Thermal Design and Optimization; John Wiley & Sons: Hoboken, NJ, USA, 1995. [Google Scholar]
- Rocco, M.V.; Colombo, E.; Sciubba, E. Advances in exergy analysis: A novel assessment of the Extended Exergy Accounting method. Appl. Energy 2014, 113, 1405–1420. [Google Scholar] [CrossRef]
- Tu, Y.; Zeng, Y. Numerical Study on Flow and Heat Transfer Characteristics of Supercritical CO2 in Zigzag Microchannels. Energies 2022, 15, 2099. [Google Scholar] [CrossRef]
- Jin, F.; Chen, D.; Hu, L.; Huang, Y.; Bu, S. Optimization of zigzag parameters in printed circuit heat exchanger for supercritical CO2 Brayton cycle based on multi-objective genetic algorithm. Energy Convers. Manag. 2022, 270, 116243. [Google Scholar] [CrossRef]
- Wang, X.; Xu, W.; Xu, B.; Xiong, C.; Guo, S.; Chen, Z. Theoretical and numerical analysis of conjugate heat transfer for supercritical CO2 flowing in printed circuit heat exchanger. J. Supercrit. Fluids 2022, 189, 105717. [Google Scholar] [CrossRef]
- Lyu, H.; Wang, H.; Bi, Q.; Niu, F. Experimental Investigation on Heat Transfer and Pressure Drop of Supercritical Carbon Dioxide in a Mini Vertical Upward Flow. Energies 2022, 15, 6135. [Google Scholar] [CrossRef]
- Ji, Y.; Wang, Z.; Wang, M.; Liu, Y.; Xu, H.; Zhu, P.; Ma, S.; Yang, Z.; Xiao, G. Experimental and Numerical Study on Thermal Hydraulic Performance of Trapezoidal Printed Circuit Heat Exchanger for Supercritical CO2 Brayton Cycle. Energies 2022, 15, 4940. [Google Scholar] [CrossRef]
- Bai, W.; Li, H.; Zhang, X.; Qiao, Y.; Zhang, C.; Gao, W.; Yao, M. Thermodynamic analysis of CO2–SF6 mixture working fluid supercritical Brayton cycle used for solar power plants. Energy 2022, 261, 124780. [Google Scholar] [CrossRef]
- Seidel, W. Model Development and Annual Simulation of the Supercritical Carbon Dioxide Brayton Cycle for Concentrating Solar Power Applications. Ph.D. Thesis, University of Wisconsin-Madison, Madison, WI, USA, 2011. [Google Scholar]
- Stamatellos, G.; Stamatellou, A.-M.; Kalfas, A.I. CFD–Aided Design Methodology for PCHE-Type Recuperators in Supercritical CO2 Recompression Power Cycles. In Turbo Expo: Power for Land, Sea, and Air; ASME: New York, NY, USA, 2020. [Google Scholar]
- Moran, M.J.; Shapiro, H.N.; Boettner, D.D.; Bailey, M.B. Fundamentals of Engineering Thermodynamics; John Wiley & Sons: Hoboken, NJ, USA, 2010. [Google Scholar]
- Lutz, M. Programming Python: Powerful Object-Oriented Programming; O’Reilly Media, Inc.: Newton, MA, USA, 2010. [Google Scholar]
- Lemmon, E.; Huber, M.; McLinden, M. NIST Standard Reference Database 23: Reference Fluid Thermodynamic and Transport Properties-REFPROP, Version 9.1. Natl Std. Ref. Data Series (NIST NSRDS) [2013 1.9.2022]. Available online: https://tsapps.nist.gov/publication/get_pdf.cfm?pub_id=912382 (accessed on 10 September 2022).
- Span, R.; Wagner, W. A New Equation of State for Carbon Dioxide Covering the Fluid Region from the Triple-Point Temperature to 1100 K at Pressures up to 800 MPa. J. Phys. Chem. Ref. Data 1996, 25, 1509–1596. [Google Scholar] [CrossRef]
- ANSYS, Inc. ANSYS CFX Reference Guide, Release 15.0; ANSYS, Inc.: Canonsburg, PA, USA, 2013. [Google Scholar]
- Lemmon, E.W.; Huber, M.L.; McLinden, M.O. NIST Reference Fluid Thermodynamic and Transport Properties-REFPROP Version 9.1; National Institute of Standards and Technology: Boulder, CO, USA, 2013; p. 80305.
- Baik, S.; Kim, S.G.; Lee, J.; Lee, J.I. Study on CO2–water printed circuit heat exchanger performance operating under various CO2 phases for sCO2 power cycle application. Appl. Therm. Eng. 2017, 113, 1536–1546. [Google Scholar] [CrossRef]
- Ho, C.K.; Iverson, B.D. Review of high-temperature central receiver designs for concentrating solar power. Renew. Sustain. Energy Rev. 2014, 29, 835–846. [Google Scholar] [CrossRef]
- Delussu, G. A qualitative thermo-fluid-dynamic analysis of a CO2 solar pipe receiver. Sol. Energy 2012, 86, 926–934. [Google Scholar] [CrossRef]
- Soo Too, Y.C.; Benito, R. Enhancing heat transfer in air tubular absorbers for concentrated solar thermal applications. Appl. Therm. Eng. 2013, 50, 1076–1083. [Google Scholar] [CrossRef]
- Hoffschmidt, B. Receivers for Solar Tower Systems; SFERA Summer School: Font Romeu, France, 2014. [Google Scholar]
- Petela, R. Exergy of undiluted thermal radiation. Sol. Energy 2003, 74, 469–488. [Google Scholar] [CrossRef]
Publisher’s Note: MDPI stays neutral with regard to jurisdictional claims in published maps and institutional affiliations. |
© 2022 by the authors. Licensee MDPI, Basel, Switzerland. This article is an open access article distributed under the terms and conditions of the Creative Commons Attribution (CC BY) license (https://creativecommons.org/licenses/by/4.0/).