
A Novel Multi-Objective Optimal Design Method for Dry Iron Core Reactor by Incorporating NSGA-II, TOPSIS and Entropy Weight Method


Abstract
1. Introduction
2. Multi-Objective Optimization Modeling of Dry Iron Core Reactors
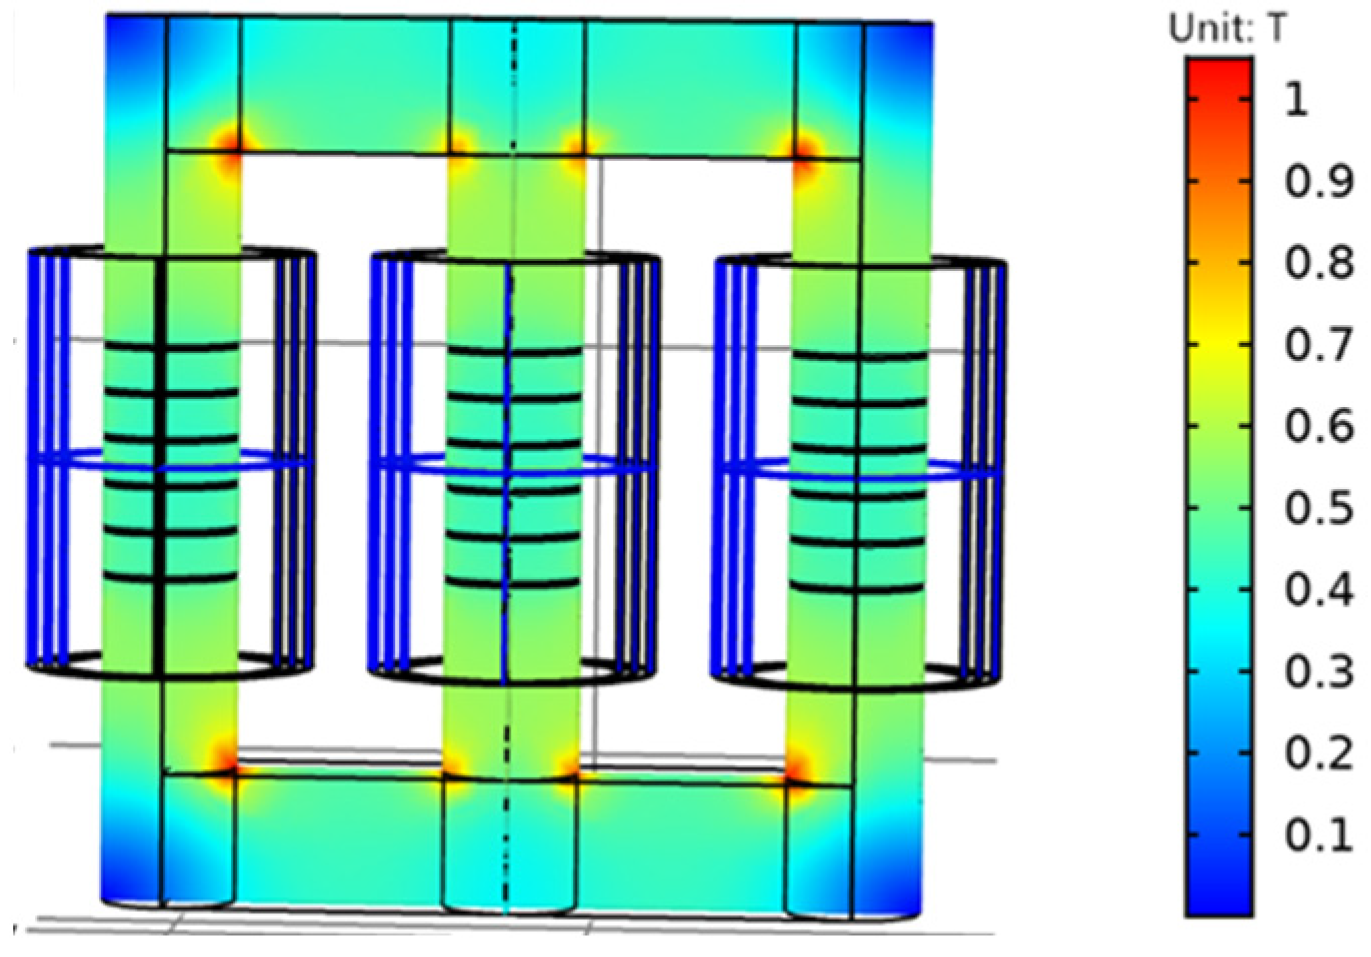
2.1. Three-Dimensional Finite Element Model
2.2. Multi-Objective Optimization Mathematical Model
3. Optimization of Reactor Incorporating NSGA-II and TOPSIS and Entropy Weight Method
3.1. Implementation of NSGA-II Algorithm
- (1)
- Population initialization. Since this paper aims to analyze the effect of different wire size on the optimized indexes, i.e., cost and loss, the common standard wire size was selected as the initialized population, as shown in Table 2. Twenty-eight combinations of different wire lengths and wire widths were formed. These 28 individuals were entered into the COMSOL model as the initial population to calculate the cost and loss under various wire sizes.
- (2)
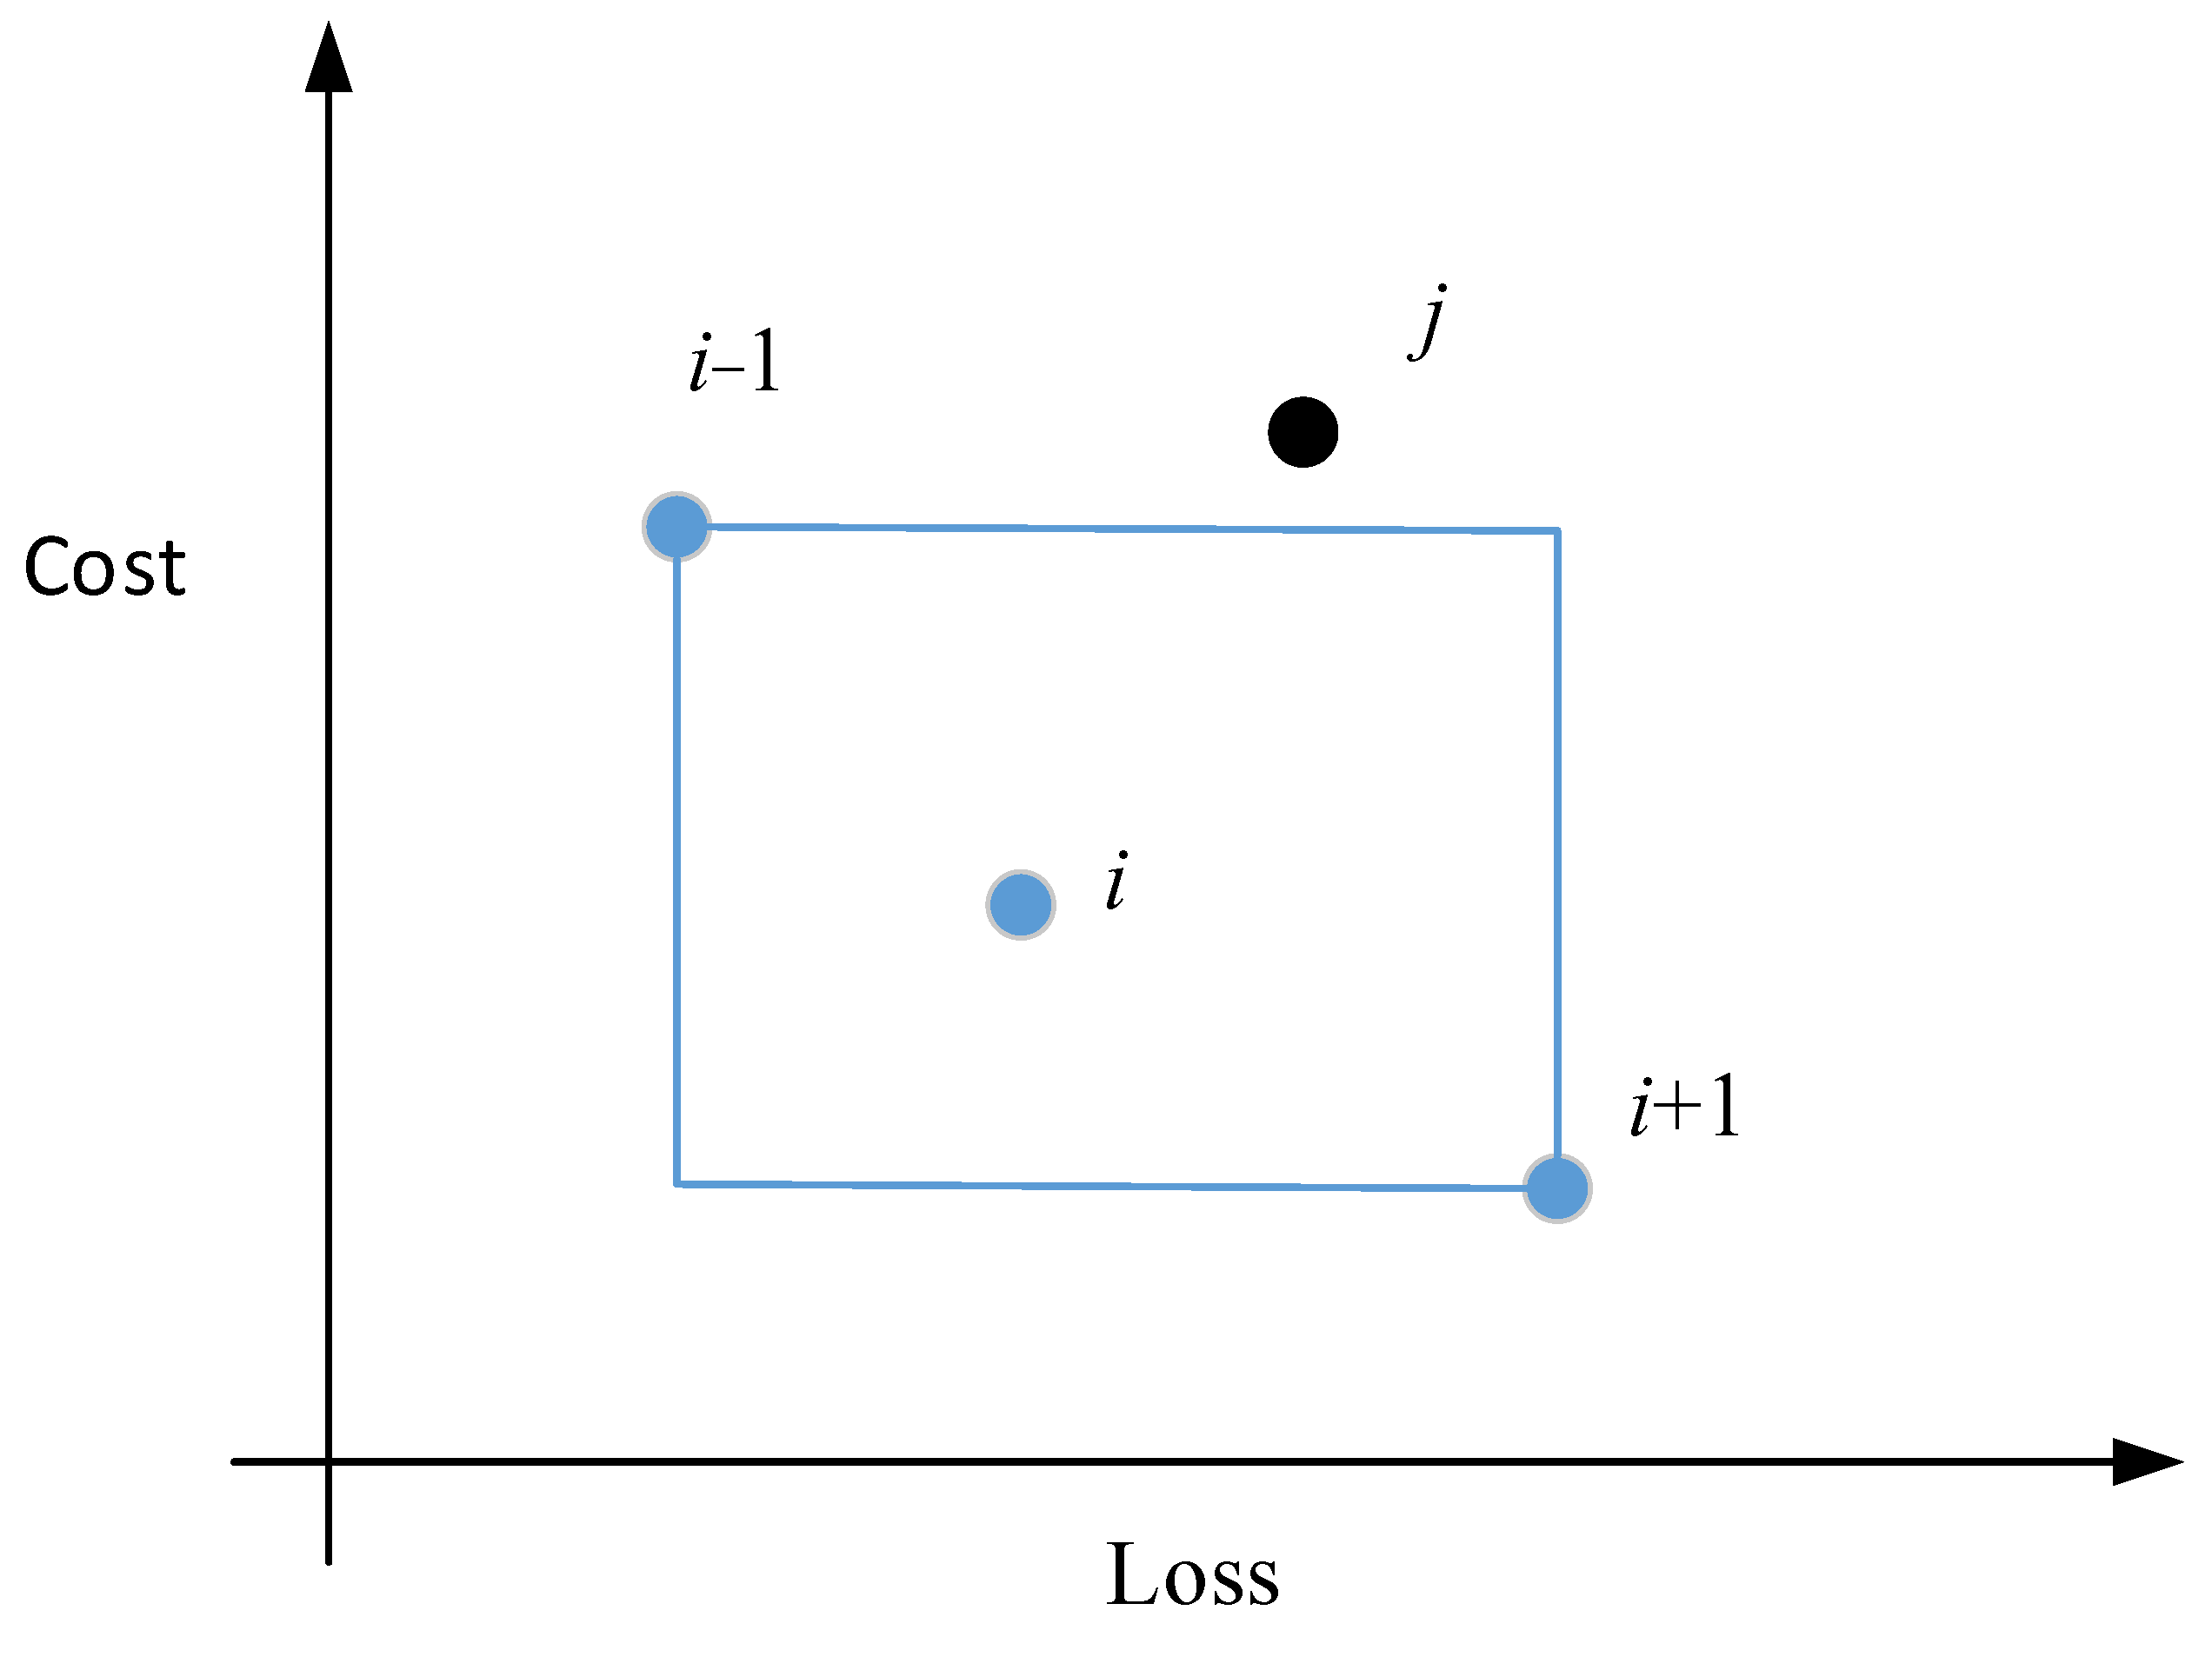
- Fast non-domination sorting and crowding distance calculation of the initial population. Dominance and non-dominance are the focus of the process, as shown in Figure 5. If both the cost and loss for individual i are smaller than individual j, then i dominates j. Otherwise it is a non-dominated relationship. As shown in Figure 5, the cost and loss of individual i are less than individual j, indicating that i dominates j. However, though the loss of individual i is smaller than that of i + 1, the cost of individual i is higher than that of i + 1. Thus, i and i + 1 does not constitute a dominant relationship. This is the same for individuals i and i − 1. All the solutions in the population that are not dominated by other solutions constitute the non-dominated frontier, i.e., the Pareto optimal solution set. The rank of all the individuals in the non-dominated frontier was set to 1. After that, all the individuals with rank 1 were removed and the above operation was repeated for the rest of the population until the non-dominated sorting of all the individuals was completed. The crowding distance of individuals under the same dominance rank was sorted and calculated according to the magnitude of the optimized indexes, where the crowding distance of two boundary solutions is infinity and the crowding distance of the ith individual can be defined as the sum of its distances to individual i − 1 and individual i + 1 on each axis component, which is half of the perimeter of the rectangle in Figure 5.
- (3)
- Selection, crossover and mutation. The parent that is suitable for reproduction is selected from the original population to form the elite population. Each selection is a competition between two randomly selected individuals from the original population to compare their non-dominance rank, and the individual with smaller rank will be selected for the elite population. If the non-dominance rank of two individuals is the same, the individual with the larger crowding is selected to enter the elite population to ensure the diversity of the population. Since there were 28 individuals in the initial population, an elite population containing 14 individuals was obtained after the selection process. After that, a suitable cross-variance operator was selected to cross-variance this population to obtain the offspring population, and the final offspring were 14–28 because the probability of cross-variance was different.
- (4)
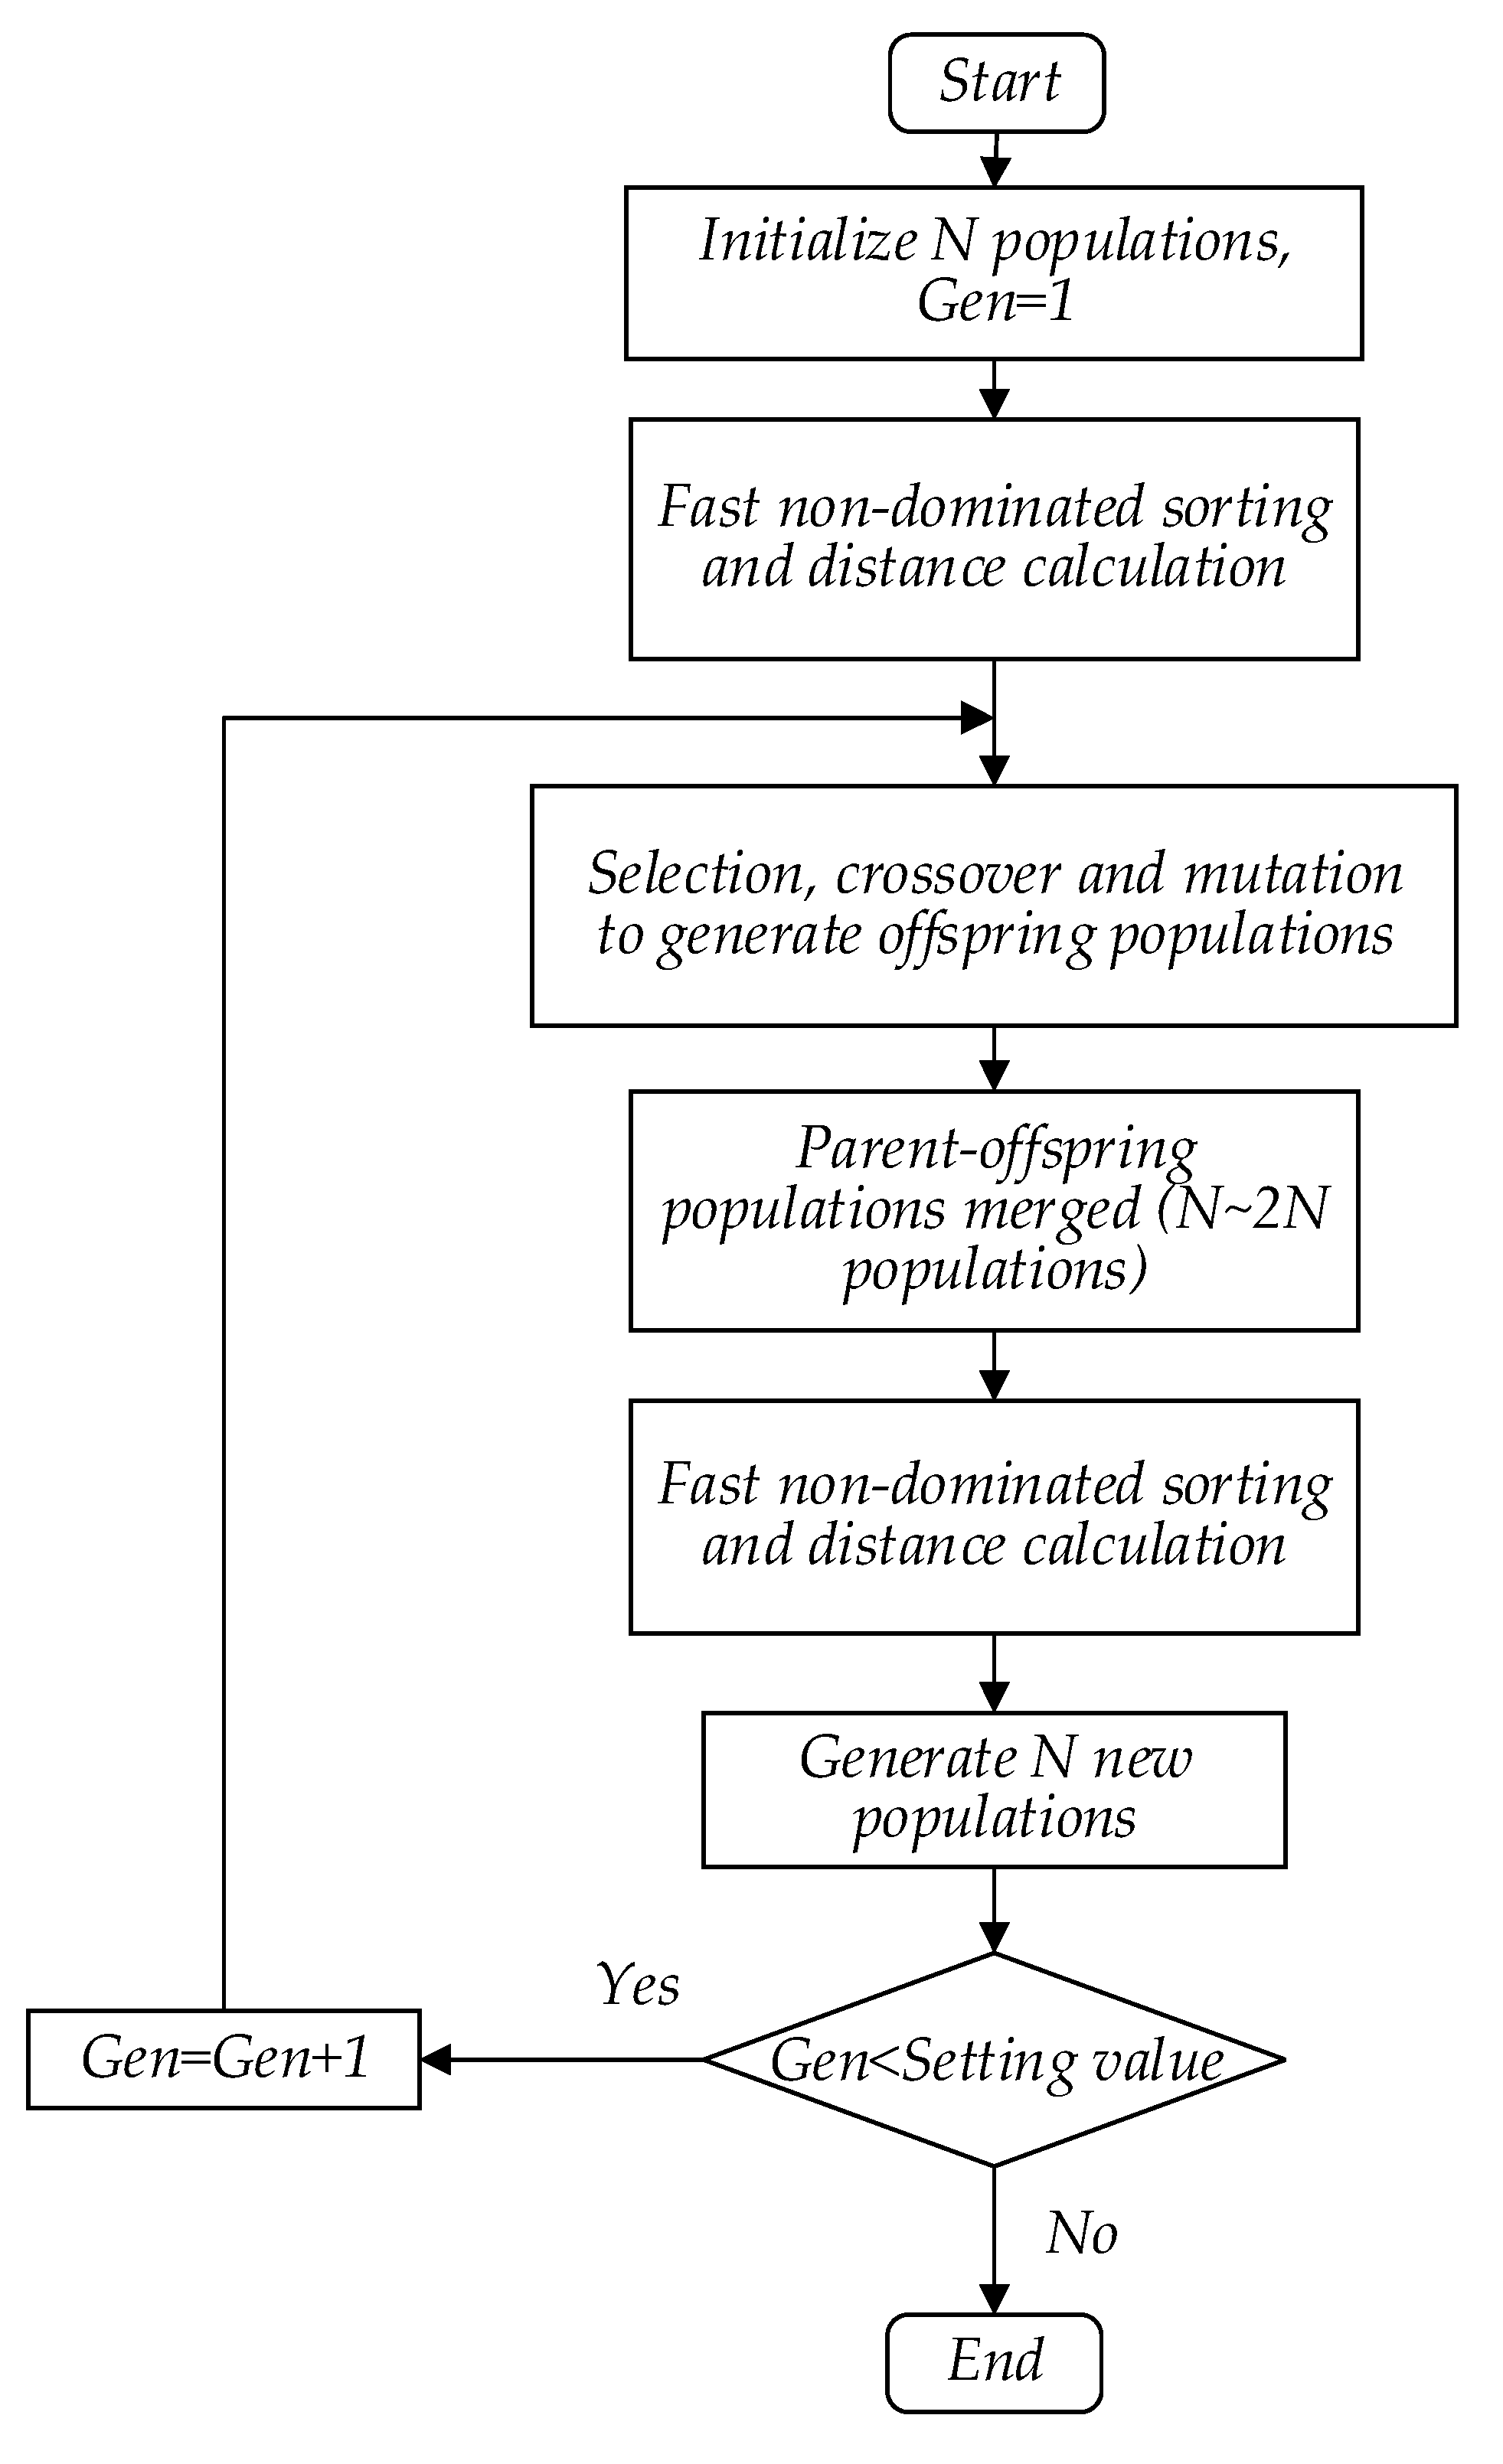
- Merging parent and child generations to generate a new population. The parent–child population was merged into a new population, and the elite retention strategy was used to calculate the new population’s non-dominated sorting and crowding distance. Afterwards, a new population containing 28 individuals was selected to participate in the subsequent evolution based on the sorting and crowding distance. The subsequent step was to repeat the process of (3)–(4) until the number of iterations was satisfied to obtain the Pareto optimal solution set. The above process of NSGA-II can be represented as Figure 6, where Gen indicates the number of generations of genetic evolution.
3.2. Implementation of TOPSIS Method
3.3. Implementation of the Entropy Method
- (1)
- First, the weight of the jth index value of the ith sample was calculated and the weight matrix P was built.
- (2)
- Calculate the entropy ej of the jth index according to Equation (16). A larger value means less variation. The redundancy value dj of the jth index is obtained referring to Equation (17), and finally the entropy weight wj of each index is obtained by normalizing it based on Equation (18). Obviously, the entropy weight sum of all indicators is 1.
4. Algorithm Implementation
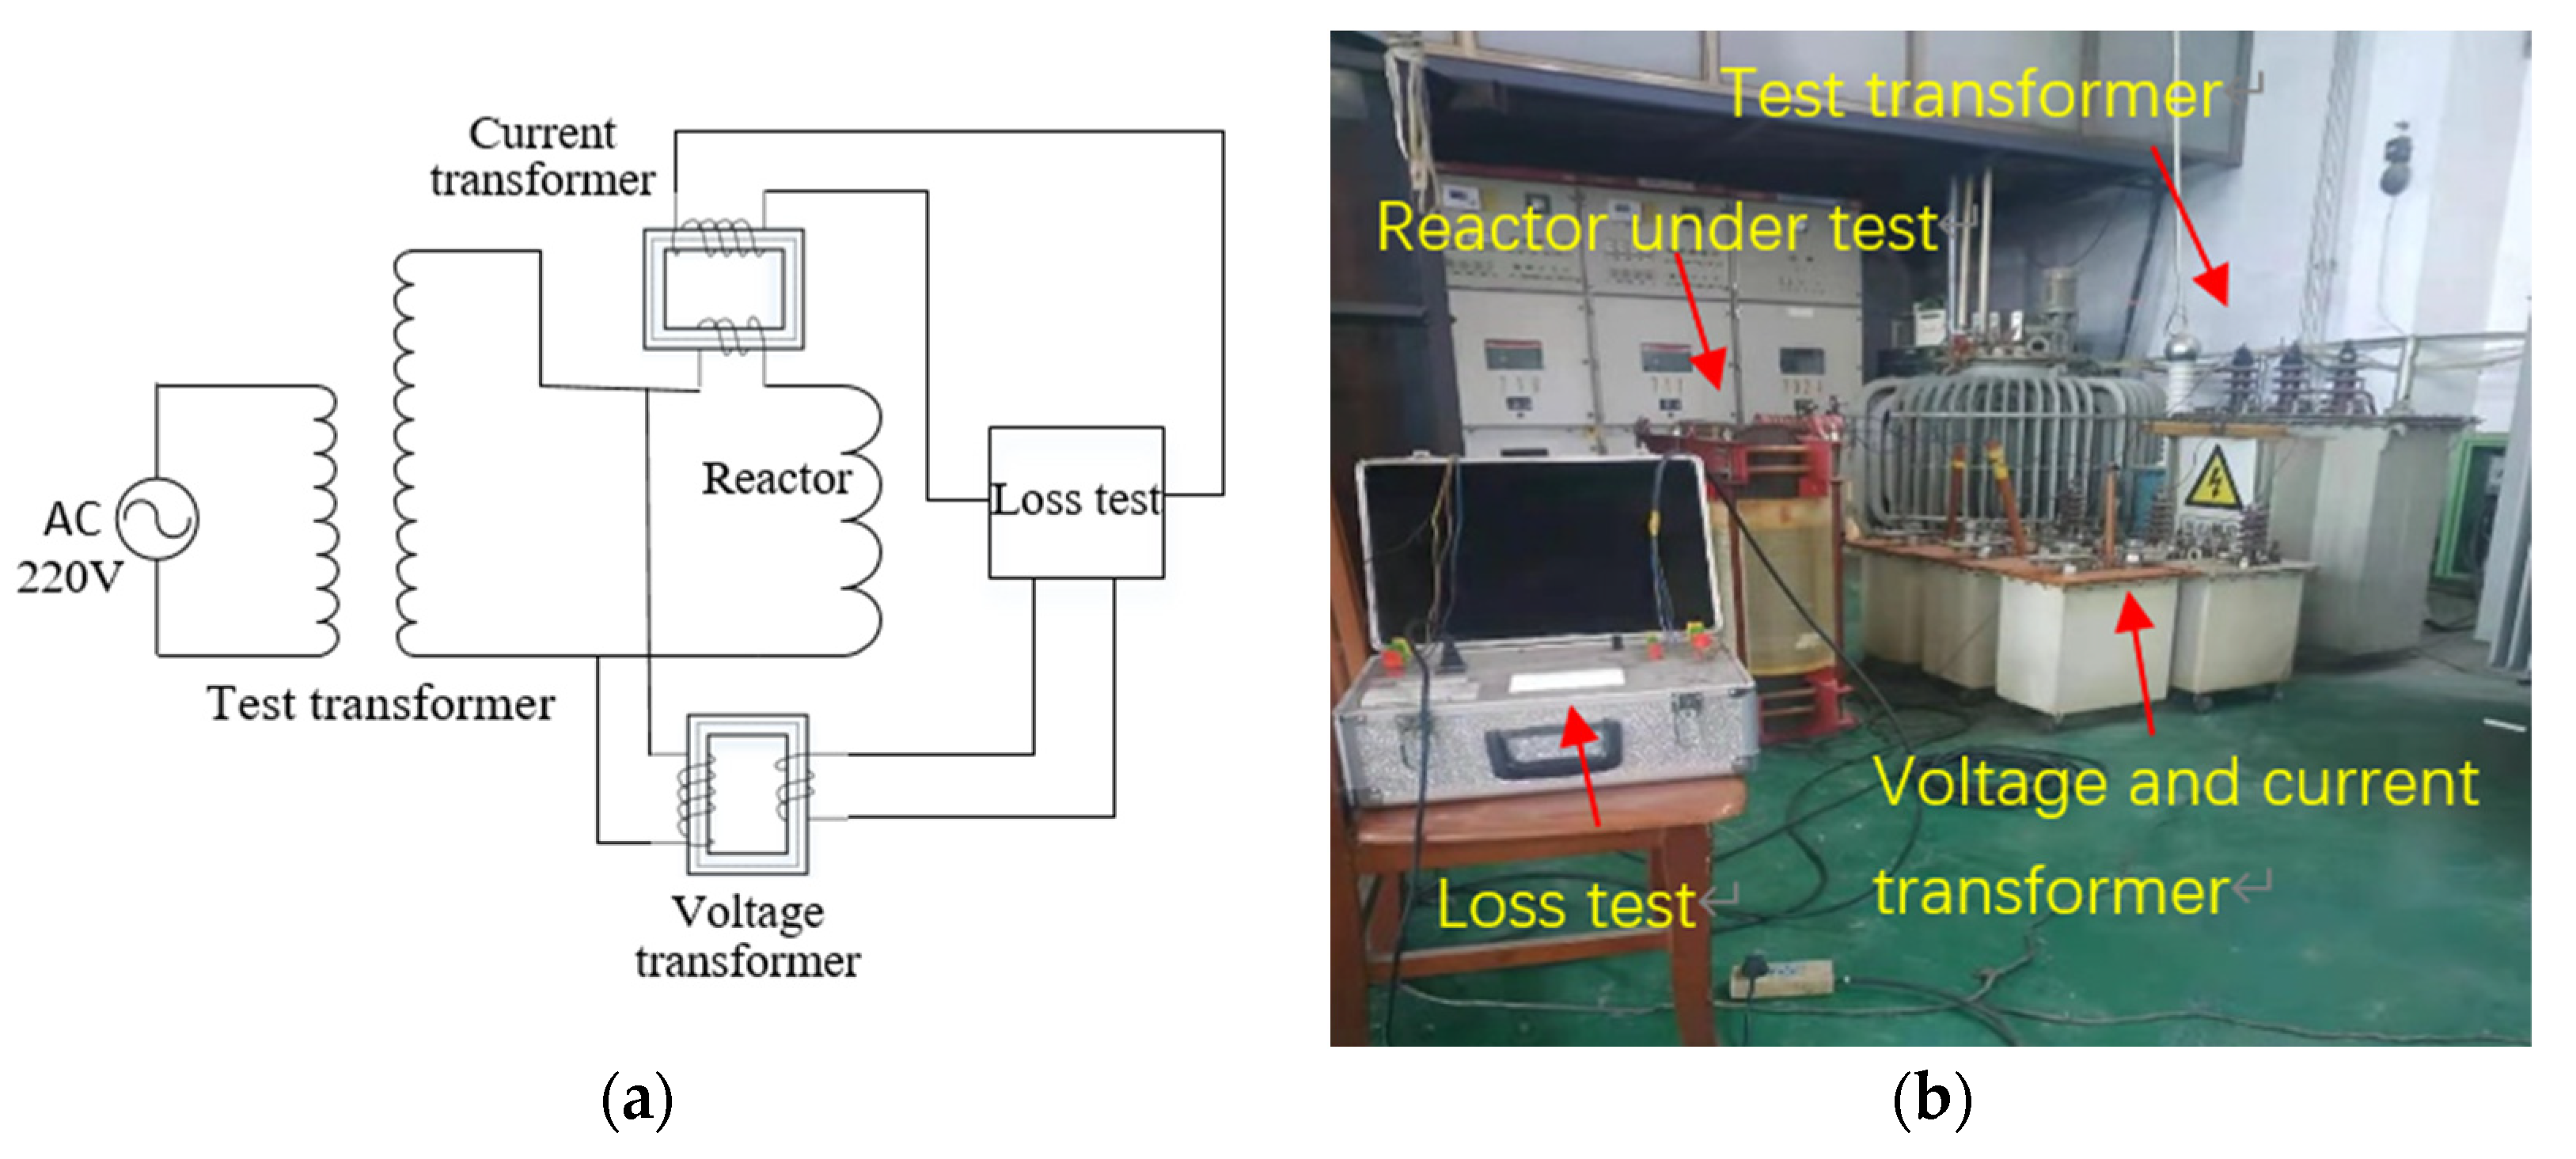
5. Experiment Validation
6. Conclusions
Author Contributions
Funding
Data Availability Statement
Conflicts of Interest
Appendix A

Appendix B

| Loss Weight | Cost Weight | Wire Length (mm) | Wire Width (mm) | Total Loss (kW) | Cost (CNY 10,000) |
|---|---|---|---|---|---|
| 1 | 0 | 3.8070 | 1.9994 | 1.0786 | 3.0622 |
| 0.9 | 0.1 | 3.5416 | 2.0276 | 1.1115 | 2.9281 |
| 0.8 | 0.2 | 3.3500 | 2.0000 | 1.1601 | 2.7848 |
| 0.7 | 0.3 | 3.1713 | 2.0382 | 1.1851 | 2.7095 |
| 0.6 | 0.4 | 3.1500 | 2.0000 | 1.2064 | 2.6638 |
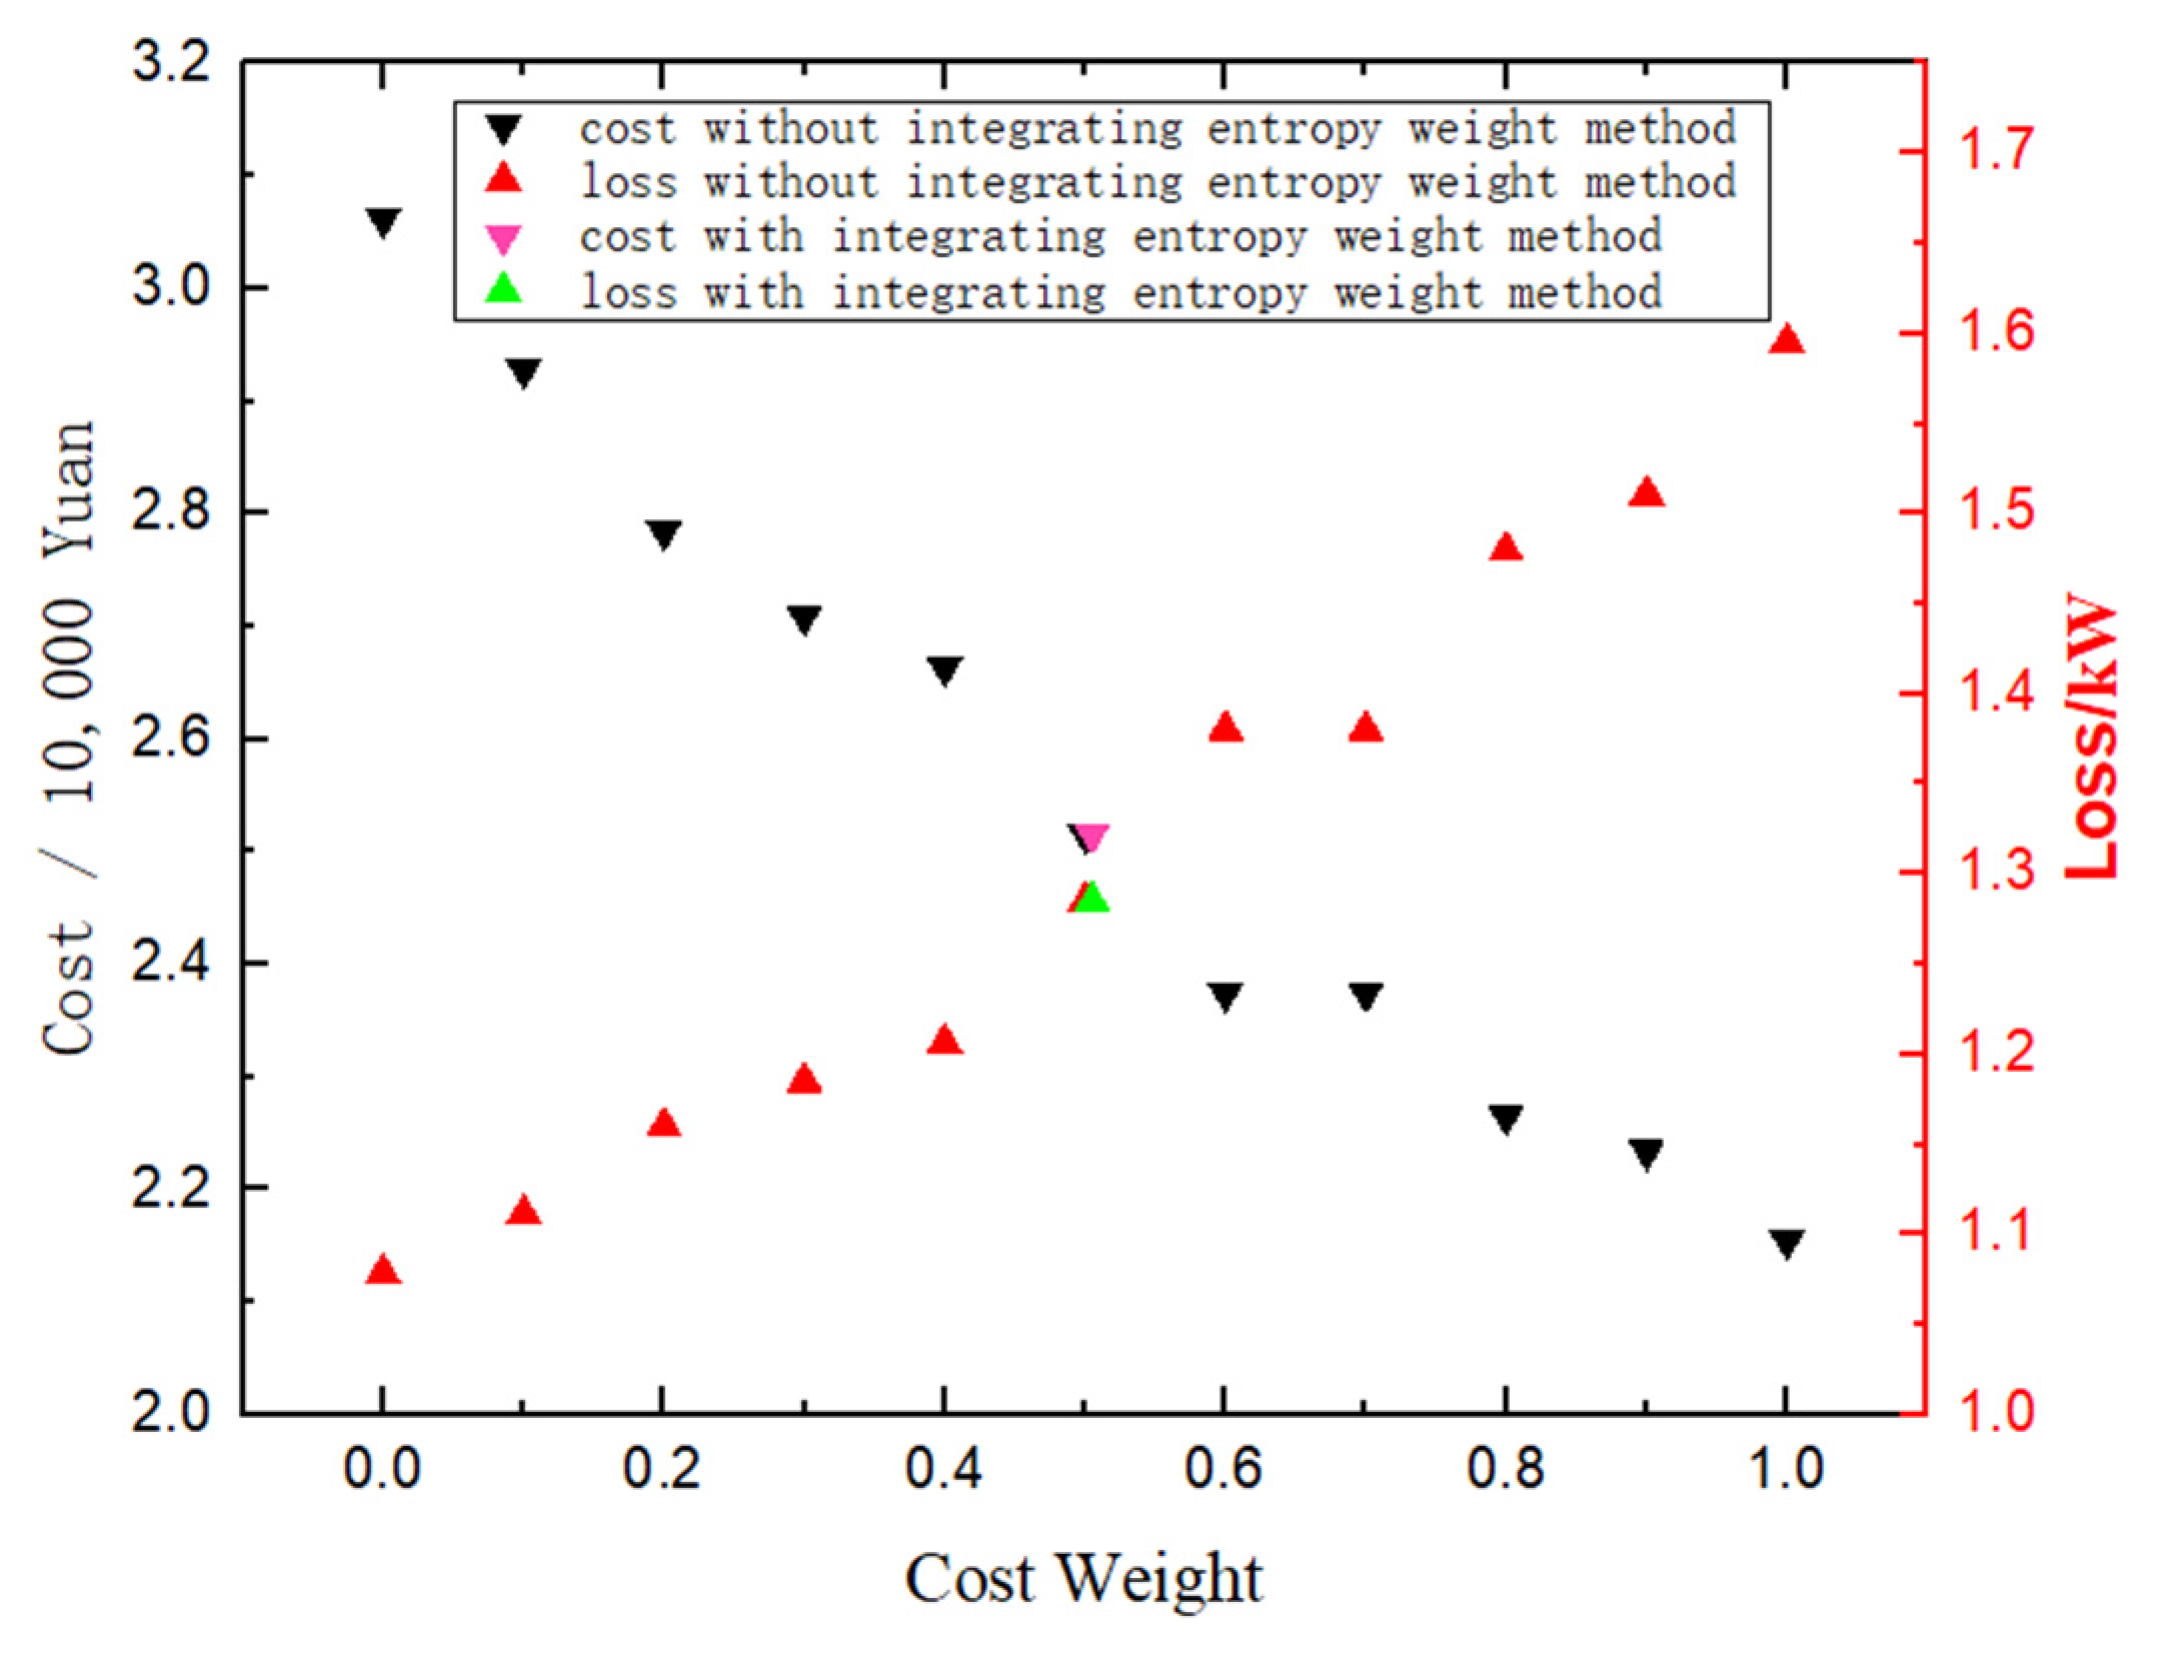
| 0.5 | 0.5 | 3.0693 | 1.8805 | 1.2851 | 2.5155 |
| 0.4949 | 0.5051 | 3.0693 | 1.8805 | 1.2851 | 2.5155 |
| 0.4 | 0.6 | 3.0589 | 1.7147 | 1.3803 | 2.3747 |
| 0.3 | 0.7 | 3.0589 | 1.7147 | 1.3803 | 2.3747 |
| 0.2 | 0.8 | 3.1447 | 1.5271 | 1.4796 | 2.2658 |
| 0.1 | 0.9 | 3.1503 | 1.4846 | 1.5108 | 2.2340 |
| 0 | 1 | 3.1459 | 1.3873 | 1.5954 | 2.1551 |
References
- Li, S.; Man, Y.; Sun, Z.; Li, S.; Chen, R.; Zhao, C. A typical dry-type iron core reactor failure and its treatment measures. In Proceedings of the 2020 International Conference on Green Development and Environmental Science and Technology, Changsha, China, 18–20 September 2020. [Google Scholar]
- Manuel Arias Velásquez, R.; Vanessa Mejía Lara, J. Magnetically controlled reactors design for weak grids. Ain Shams Eng. J. 2021, 12, 1183–1195. [Google Scholar] [CrossRef]
- Yuan, F.; Lv, K.; Tang, B.; Wang, Y.; Yang, W.; Qin, S.; Ding, C. Optimization Design of Oil-Immersed Iron Core Reactor Based on the Particle Swarm Algorithm and Thermal Network Model. Math. Probl. Eng. 2021, 16, 536–544. [Google Scholar] [CrossRef]
- Shen, L.; Xie, F.; Xiao, W.; Ji, H.; Zhang, B. Thermal Analyses of Reactor under High-Power and High-Frequency Square Wave Voltage Based on Improved Thermal Network Model. Electronics 2021, 10, 1342. [Google Scholar] [CrossRef]
- Georgilakis, P.S. Transformer and Inductor Design Handbook 3/E-Wm; McLyman, T., Ed.; Springer: London, UK, 2013; pp. 1–30. [Google Scholar]
- Dönük, A. Effects of Air Gaps on Core Losses of Shunt Reactors. Celal Bayar Univ. J. Sci. 2016, 12. [Google Scholar]
- Yuan, F.; Yuan, Z.; Wang, Y.; Liu, J.; He, J.; Pan, Y. Thermal optimization for nature convection cooling performance of air core reactor with the rain cover: Thermal Optimization of Reactor with The Rain Cover. IEEJ Trans. Electr. Electron. Eng. 2018, 13, 995–1001. [Google Scholar] [CrossRef]
- Ibuchi, T.; Funaki, T. A study on copper loss minimization of air-core reactor for high frequency switching power converter. In Proceedings of the 2013 4th IEEE International Symposium on Power Electronics for Distributed Generation Systems (PEDG), Rogers, AR, USA, 8–11 July 2013. [Google Scholar]
- Yuan, F.; Yuan, Z.; Wang, Y.; Liu, J.; Su, H.; He, J. Research of electromagnetic and thermal optimization design on air core reactor. IEEJ Trans. Electr. Electron. Eng. 2018, 13, 725–731. [Google Scholar] [CrossRef]
- Ma, C.; Zhao, Y.; Ma, X. Efficient optimization design of dry-type air-core reactors with the improved genetic algorithm. Int. J. Appl. Electromagn. Mech. 2017, 55, 235–242. [Google Scholar] [CrossRef]
- Yuan, Y.; Wang, X.; Cao, J.; Chen, Q. Multi-objective optimization of laminar flow characteristics in helical coiled tubes based on NSGA-II. In Proceedings of the 6th International Symposium on Energy Science and Chemical Engineering, Harbin, China, 22–24 January 2021. [Google Scholar]
- Xu, Y.; Guo, Q.; Tan, A.; Xu, L.; Tu, Y.; Liu, S. Multi-objective Route Planning of Museum Guide based on an Improved NSGA-II Algorithm. In Proceedings of the 2020 International Symposium on Automation, Information and Computing (ISAIC 2020), Beijing, China, 2–4 December 2020. [Google Scholar]
- Tiong Teck, T.; Thillainathan, L.; Wai Lok, W.; Abidi, K.; John, T.; Wade, N.S.; Greenwood, D.M.; Patsios, C.; Taylor, P.C. Optimization of Fuzzy Energy-Management System for Grid-Connected Microgrid Using NSGA-II. IEEE Trans. Cybern. 2021, 51, 5375–5386. [Google Scholar]
- El-Nemr, M.; Afifi, M.; Rezk, H.; Ibrahim, M. Finite Element Based Overall Optimization of Switched Reluctance Motor Using Multi-Objective Genetic Algorithm (NSGA-II). Mathematics 2021, 9, 576. [Google Scholar] [CrossRef]
- Rabothata, M.; Muthu, J.; Wegner, L. Optimum design parameters and mechanical properties of polymeric nanocomposites using NSGA-II optimization method. J. Compos. Mater. 2021, 55, 949–972. [Google Scholar] [CrossRef]
- Liu, X.; He, W.; Wei, F. Design of High Altitude Propeller Using Multilevel Optimization. Int. J. Comput. Methods 2020, 17, 32. [Google Scholar] [CrossRef]
- Bolaos, R.I.; Isaza, R. Optimal Relocation of Distribution Transformers Using the Multiobjective Optimization Algorithm NSGA II. Ing. Cienc. 2014, 10, 77–97. [Google Scholar]
- Orosz, T.; Karban, P.; Pánek, D.; Doležel, I. FEM-based transformer design optimization technique with evolutionary algorithms and geometric programming. Int. J. Appl. Electromagn. Mech. 2020, 64, 1–9. [Google Scholar] [CrossRef]
- Cheng-fen, Z.; Yan-zhen, Z.; Feng, C.; Xi-kui, M. Multi-objective Optimum Design of Dry-type Air-core Reactor Based on Improved NSGA-II Algorithm. Proc. CSEE 2010, 30, 115–121. [Google Scholar]
- Zhang, C.; Ma, X. NSGA-II Algorithm with a Local Search Strategy for Multiobjective Optimal Design of Dry-Type Air-Core Reactor. Math. Probl. Eng. 2015, 2015, 839035. [Google Scholar] [CrossRef]
- Duan, Z.; Qian, X.; Wang, R.; Duo, Y.Q. Power Distribution System Evaluation in Chemical Industry Park Using Subjective and Objective Comprehensive Weight Method. Adv. Mater. Res. 2014, 986, 419–423. [Google Scholar] [CrossRef]
- Wang, J.; Wang, X.; Yang, D.; Wang, K.; Zhou, Y. Magnetic Induction Tomography Simulation Analysis Based on Comsol Multiphysics Soft. In Proceedings of the 2018 5th International Conference on Advanced Composite Materials and Manufacturing Engineering, Xishuangbanna, China, 16–17 June 2018. [Google Scholar]
- Khelifa, H.; Bentounsi, A.; Rebahi, F.; Machmoum, M. FE Simulation and Experiment of a Self-Excited SynRel Generator Based on COMSOL Software. J. Electr. Eng. Technol. 2020, 16, 899–905. [Google Scholar] [CrossRef]
- Hiruma, S.; Igarashi, H. Fast computation of copper and iron losses using model order reduction. Int. J. Appl. Electromagn. Mech. 2019, 60, S79–S86. [Google Scholar] [CrossRef]
- Bertotti, G. General properties of power losses in soft ferromagnetic materials. IEEE Trans. Magn. 2002, 24, 621–630. [Google Scholar] [CrossRef]
- Amoiralis, E.I.; Tsili, M.A.; Kladas, A.G. Transformer Design and Optimization: A Literature Survey. IEEE Trans. Power Deliv. 2009, 24, 1999–2024. [Google Scholar] [CrossRef]
- Liu, X.; Wang, Y.; Zhu, J.; Guo, Y.; Lei, G.; Liu, C. Calculation of core loss and copper loss in amorphous/nanocrystalline core-based high-frequency transformer. AIP Adv. 2016, 6, 4167–4182. [Google Scholar] [CrossRef]
- Lin, Y.-K.; Chang, P.-C.; Yeng, L.C.-L.; Huang, S.-F. Bi-objective optimization for a multistate job-shop production network using NSGA-II and TOPSIS. J. Manuf. Syst. 2019, 52, 43–54. [Google Scholar] [CrossRef]
- Jin, M.; Zhang, J.; Cui, S.; Kang, M.; Xiao, Y.; Xiang, R.; Yan, Z. Research on comprehensive evaluation of data link based on G1 method and entropy weight method. In Proceedings of the 2021 International Conference on Mechanical Engineering, Intelligent Manufacturing and Automation Technology (MEMAT), Guilin, China, 15–17 January 2021. [Google Scholar]
- Rengaraj, M.; Subbaraj, S. Decision making on the state of transformers based on insulation condition using AHP and TOPSIS methods. IET Sci. Meas. Technol. 2020, 14, 137–145. [Google Scholar]
- Dhiman, H.S.; Deb, D. Fuzzy TOPSIS and fuzzy COPRAS based multi-criteria decision making for hybrid wind farms. Energy 2020, 202, 117755. [Google Scholar] [CrossRef]
- Lin, Y.; Zhang, W. Pareto efficiency in the infinite horizon mean-field type cooperative stochastic differential game. J. Frankl. Inst. 2021, 358, 5532–5551. [Google Scholar] [CrossRef]


| Materials | Relative Permeability | Relative Permittivity | Conductivity [S/m] |
|---|---|---|---|
| winding coil | 1 | 1 | 2.8 × 10⁷ |
| air | 1 | 1 | 0 |
| core | 9500 | 1 | 0 |
| wire length (mm) | 3.15 | 3.35 | 3.55 | 3.75 | - | - | - |
| wire width (mm) | 1.4 | 1.5 | 1.6 | 1.7 | 1.8 | 1.9 | 2.0 |
| Wire Length (mm) | Wire Width (mm) | Copper Loss (kW) | Iron Core Loss (kW) | Total Loss (kW) | Core Quality (kg) | Copper Quality (kg) | Cost (CNY 10,000) | Overcrowding Distance |
|---|---|---|---|---|---|---|---|---|
| 3.8070 | 1.9994 | 0.8030 | 0.2756 | 1.0786 | 716.97 | 348.20 | 3.0622 | Inf |
| 3.1459 | 1.3873 | 1.3586 | 0.2368 | 1.5954 | 673.86 | 195.81 | 2.1551 | Inf |
| 3.1503 | 1.4846 | 1.2739 | 0.2369 | 1.5108 | 674.23 | 210.05 | 2.2340 | 0.2298 |
| 3.4231 | 2.0134 | 0.8867 | 0.2530 | 1.1397 | 691.95 | 315.48 | 2.8422 | 0.1878 |
| 3.3500 | 2.0000 | 0.9114 | 0.2487 | 1.1601 | 687.23 | 306.40 | 2.7848 | 0.1721 |
| 3.1599 | 1.4258 | 1.3186 | 0.2375 | 1.5561 | 674.71 | 202.17 | 2.1915 | 0.1690 |
| 3.1377 | 1.6171 | 1.1816 | 0.2365 | 1.4181 | 673.44 | 228.94 | 2.3367 | 0.1674 |
| 3.6784 | 1.9838 | 0.8368 | 0.2678 | 1.1045 | 708.45 | 333.57 | 2.9681 | 0.1575 |
| 3.7500 | 2.0000 | 0.8149 | 0.2720 | 1.0869 | 713.13 | 343.08 | 3.0279 | 0.1539 |
| 3.1632 | 1.9212 | 1.0008 | 0.2388 | 1.2396 | 675.07 | 277.14 | 2.6044 | 0.1521 |
| 3.5645 | 2.0024 | 0.8560 | 0.2614 | 1.1175 | 701.13 | 326.46 | 2.9173 | 0.1493 |
| 3.1500 | 2.0000 | 0.9689 | 0.2375 | 1.2064 | 674.15 | 288.21 | 2.6638 | 0.1479 |
| 3.0589 | 1.7147 | 1.1482 | 0.2321 | 1.3803 | 668.22 | 237.37 | 2.3747 | 0.1444 |
| 3.1713 | 2.0382 | 0.9461 | 0.2390 | 1.1851 | 675.51 | 296.13 | 2.7095 | 0.1412 |
| 3.1351 | 1.8900 | 1.0250 | 0.2366 | 1.2616 | 673.18 | 269.75 | 2.5607 | 0.1311 |
| 3.1500 | 1.7944 | 1.0697 | 0.2374 | 1.3071 | 674.17 | 256.42 | 2.4890 | 0.1309 |
| 3.1447 | 1.5271 | 1.2431 | 0.2366 | 1.4796 | 673.80 | 215.95 | 2.2658 | 0.1100 |
| 3.1449 | 1.5331 | 1.2385 | 0.2366 | 1.4751 | 673.75 | 216.92 | 2.2711 | 0.1054 |
| 3.1492 | 1.7106 | 1.1179 | 0.2370 | 1.3549 | 674.11 | 243.76 | 2.4193 | 0.1034 |
| 3.3877 | 2.0000 | 0.9013 | 0.2509 | 1.1523 | 689.60 | 309.94 | 2.8080 | 0.1029 |
| 3.3308 | 1.4819 | 1.2073 | 0.2466 | 1.4539 | 685.97 | 221.57 | 2.3162 | 0.0995 |
| 3.1412 | 1.7553 | 1.0945 | 0.2372 | 1.3317 | 673.57 | 249.87 | 2.4520 | 0.0947 |
| 3.1487 | 1.9188 | 1.0066 | 0.2375 | 1.2441 | 673.97 | 275.19 | 2.5919 | 0.0908 |
| 3.1347 | 1.8575 | 1.0414 | 0.2368 | 1.2783 | 673.11 | 264.74 | 2.5330 | 0.0901 |
| 3.1506 | 1.4171 | 1.3301 | 0.2369 | 1.5670 | 674.14 | 200.14 | 2.1794 | 0.0833 |
| 3.5416 | 2.0276 | 0.8518 | 0.2597 | 1.1115 | 699.65 | 328.85 | 2.9281 | 0.0811 |
| 3.0693 | 1.8805 | 1.0516 | 0.2335 | 1.2851 | 668.95 | 262.75 | 2.5155 | 0.0769 |
| 3.1494 | 1.6784 | 1.1376 | 0.2374 | 1.3750 | 674.14 | 238.81 | 2.3921 | 0.0733 |
Publisher’s Note: MDPI stays neutral with regard to jurisdictional claims in published maps and institutional affiliations. |
© 2022 by the authors. Licensee MDPI, Basel, Switzerland. This article is an open access article distributed under the terms and conditions of the Creative Commons Attribution (CC BY) license (https://creativecommons.org/licenses/by/4.0/).
Share and Cite
Li, Y.; Liu, Y.; Li, S.; Qi, L.; Xie, J.; Xie, Q. A Novel Multi-Objective Optimal Design Method for Dry Iron Core Reactor by Incorporating NSGA-II, TOPSIS and Entropy Weight Method. Energies 2022, 15, 7344. https://doi.org/10.3390/en15197344
Li Y, Liu Y, Li S, Qi L, Xie J, Xie Q. A Novel Multi-Objective Optimal Design Method for Dry Iron Core Reactor by Incorporating NSGA-II, TOPSIS and Entropy Weight Method. Energies. 2022; 15(19):7344. https://doi.org/10.3390/en15197344
Chicago/Turabian StyleLi, Yan, Yifan Liu, Shasha Li, Leijie Qi, Jun Xie, and Qing Xie. 2022. "A Novel Multi-Objective Optimal Design Method for Dry Iron Core Reactor by Incorporating NSGA-II, TOPSIS and Entropy Weight Method" Energies 15, no. 19: 7344. https://doi.org/10.3390/en15197344
APA StyleLi, Y., Liu, Y., Li, S., Qi, L., Xie, J., & Xie, Q. (2022). A Novel Multi-Objective Optimal Design Method for Dry Iron Core Reactor by Incorporating NSGA-II, TOPSIS and Entropy Weight Method. Energies, 15(19), 7344. https://doi.org/10.3390/en15197344