A Mathematical Approach of Voltage Sag Analysis Incorporating Bivariate Probability Distribution in a Meshed System
Abstract
1. Introduction
2. Fault Position Approach and Methods
3. Suggested Mathematical Approach
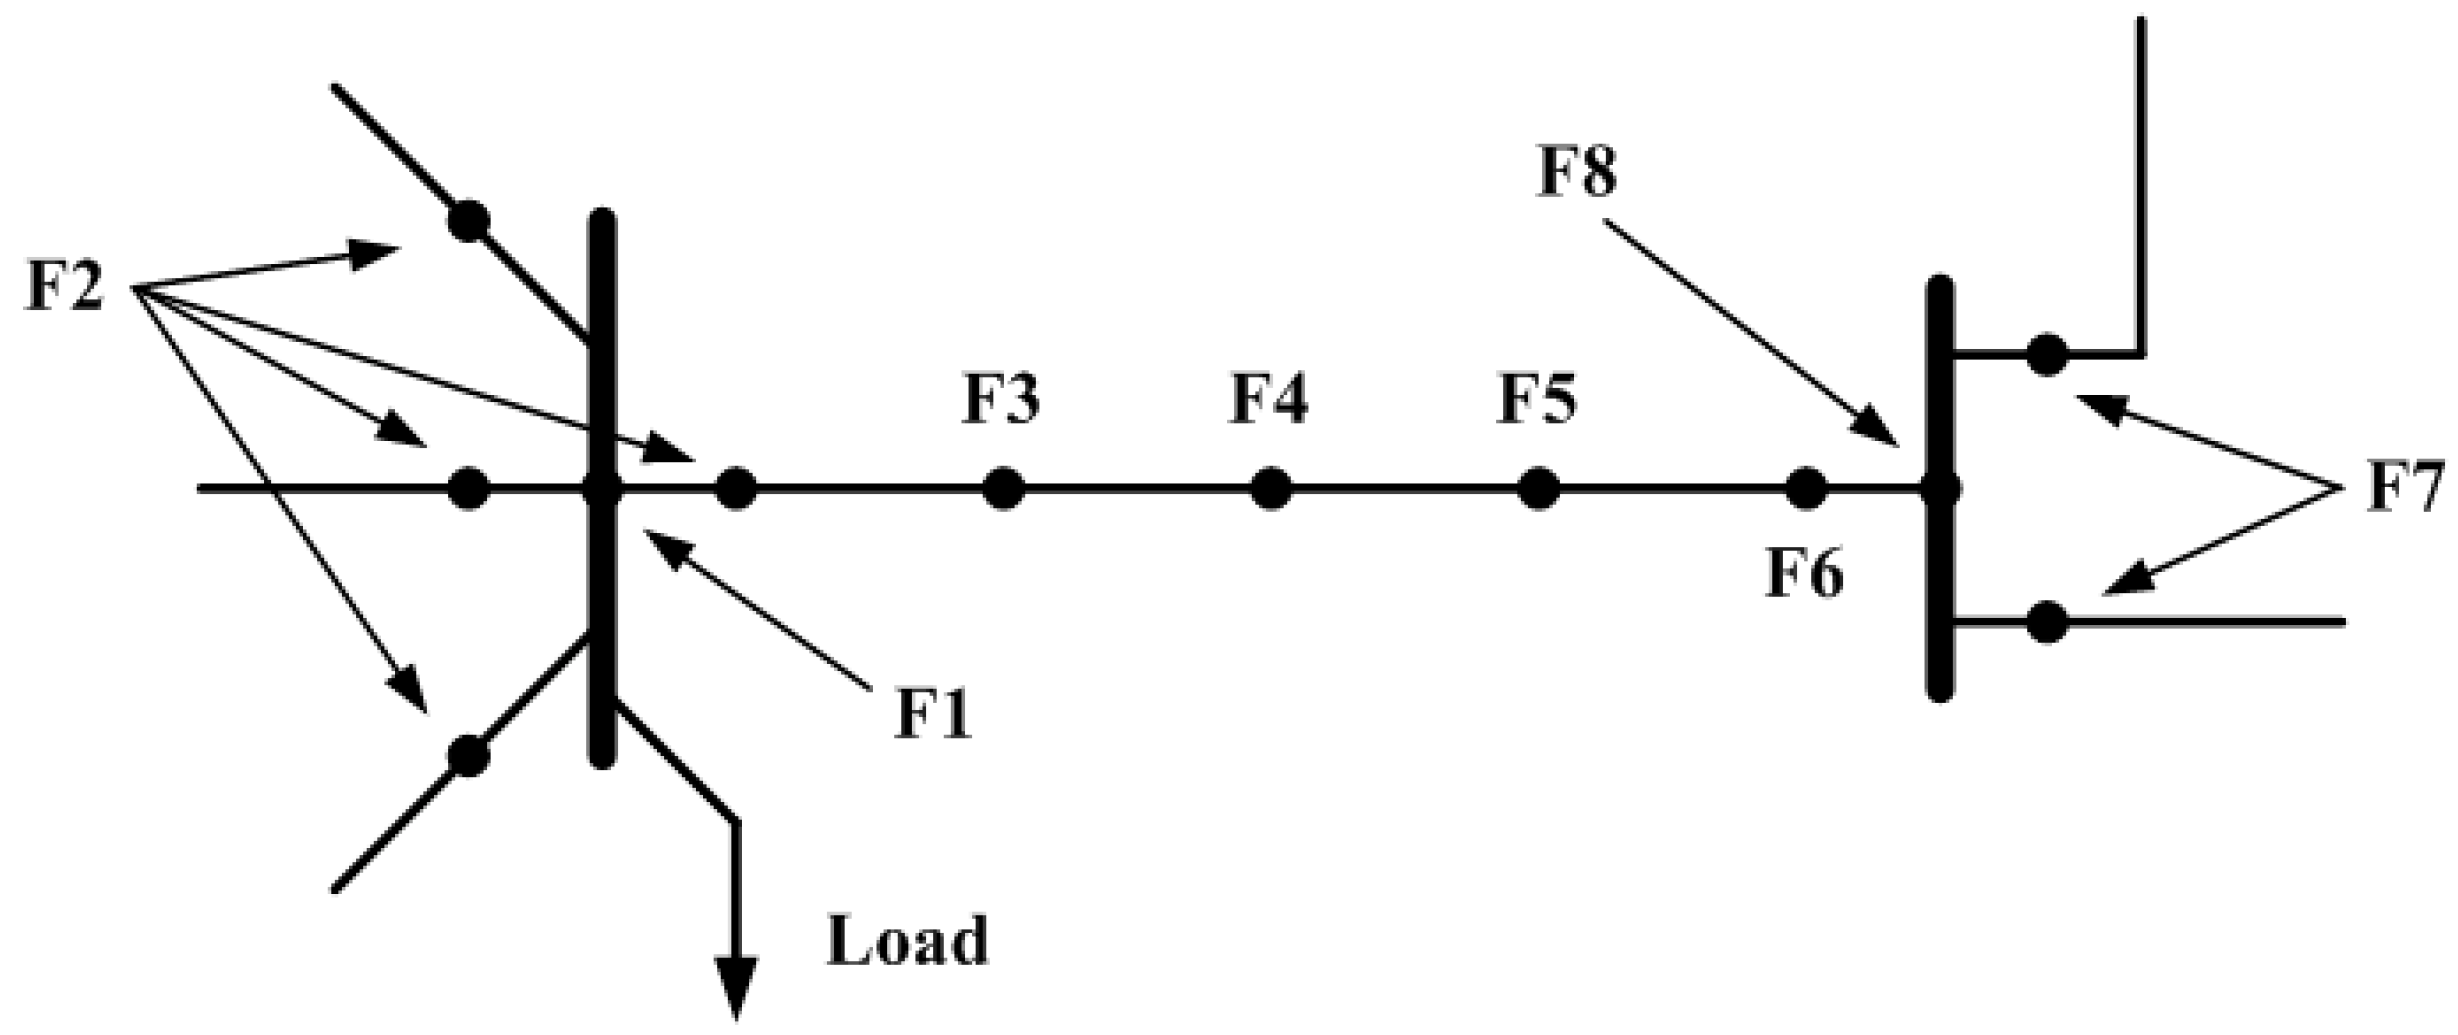
3.1. Faults at the System Buses
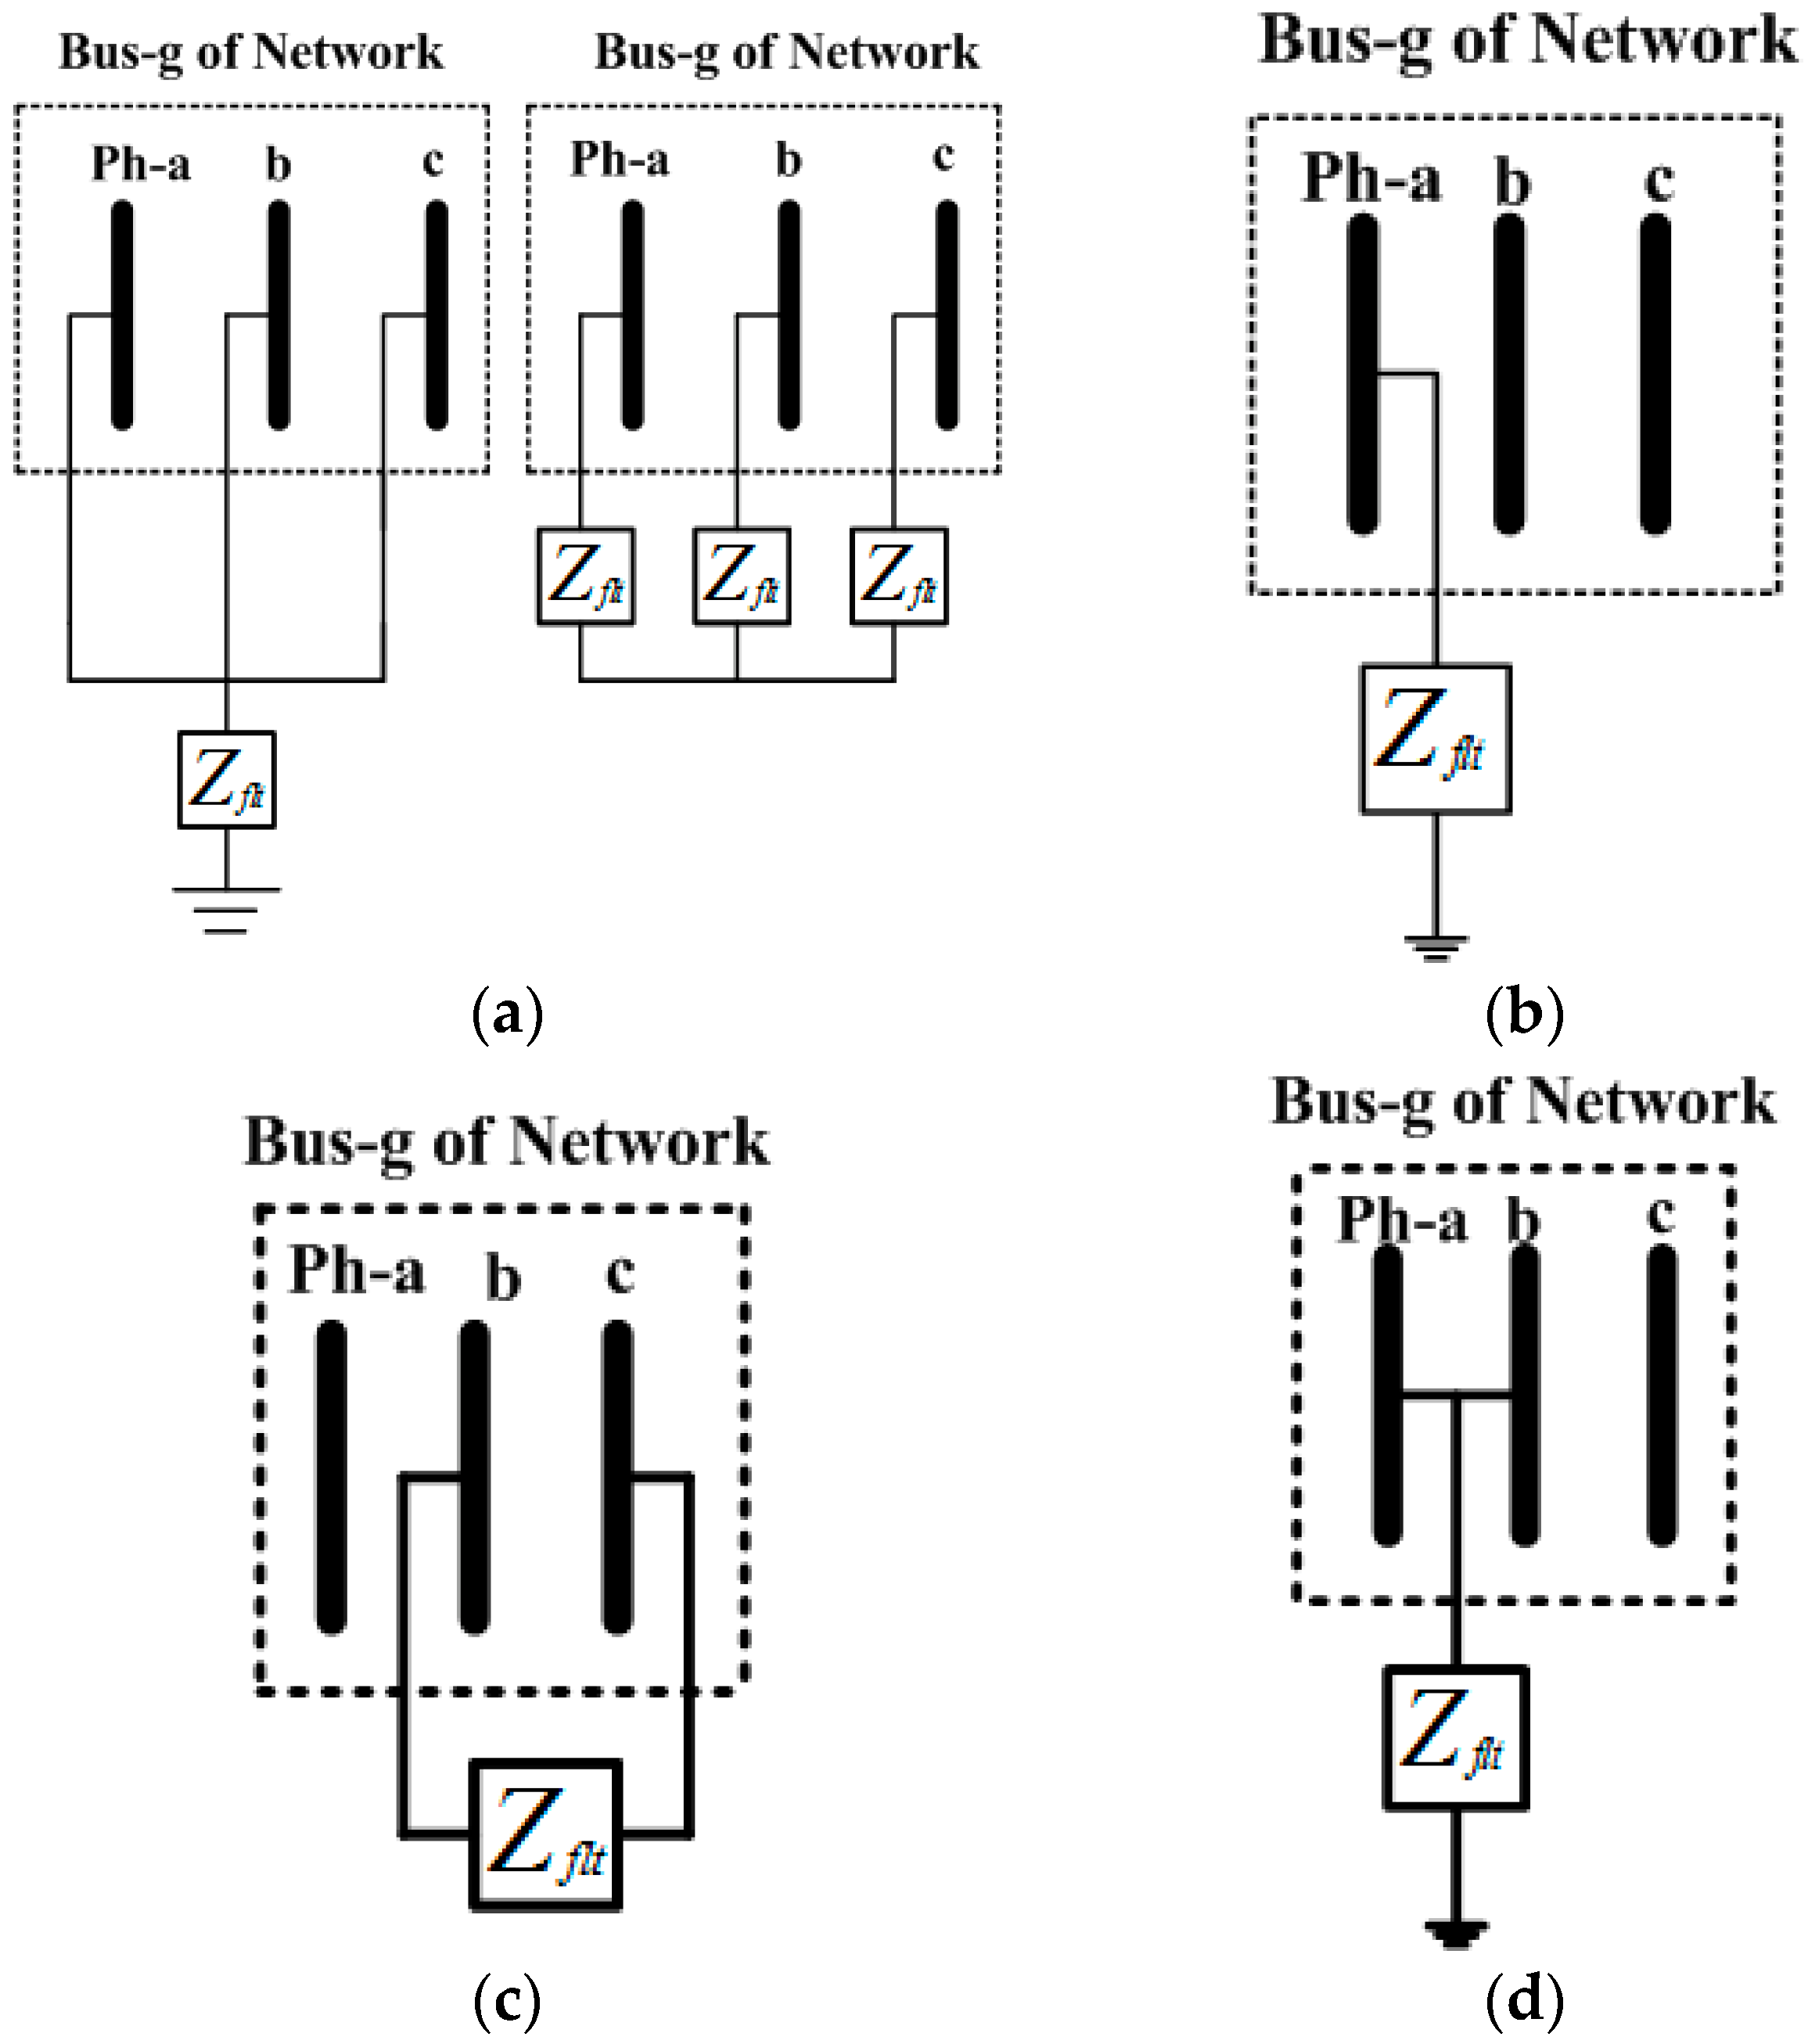
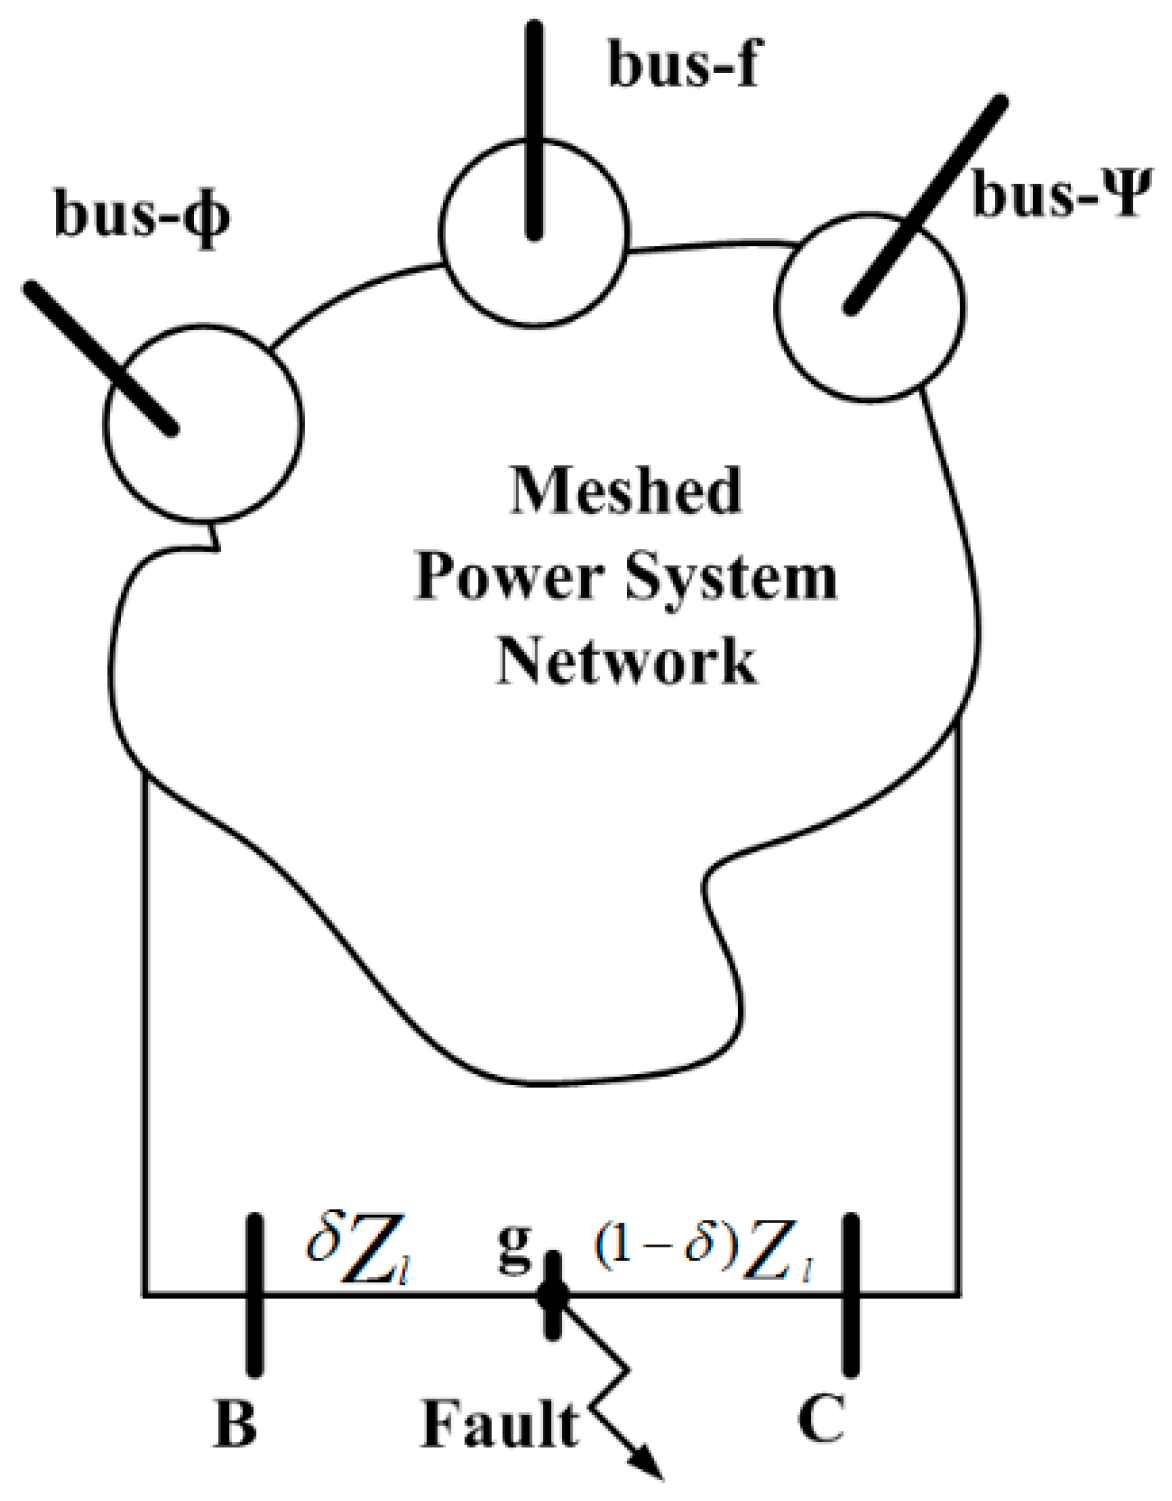
3.2. Voltage Sag Due to a Line Fault
3.2.1. Symmetrical Fault (Three-Phase Fault)
3.2.2. Single Line to Ground Fault (SLGF)
3.2.3. Line to Line Fault (LLF)
3.2.4. Double Line to Ground Fault (DLGF)
4. Sag Analysis Using Bivariate Discrete Probability Distribution
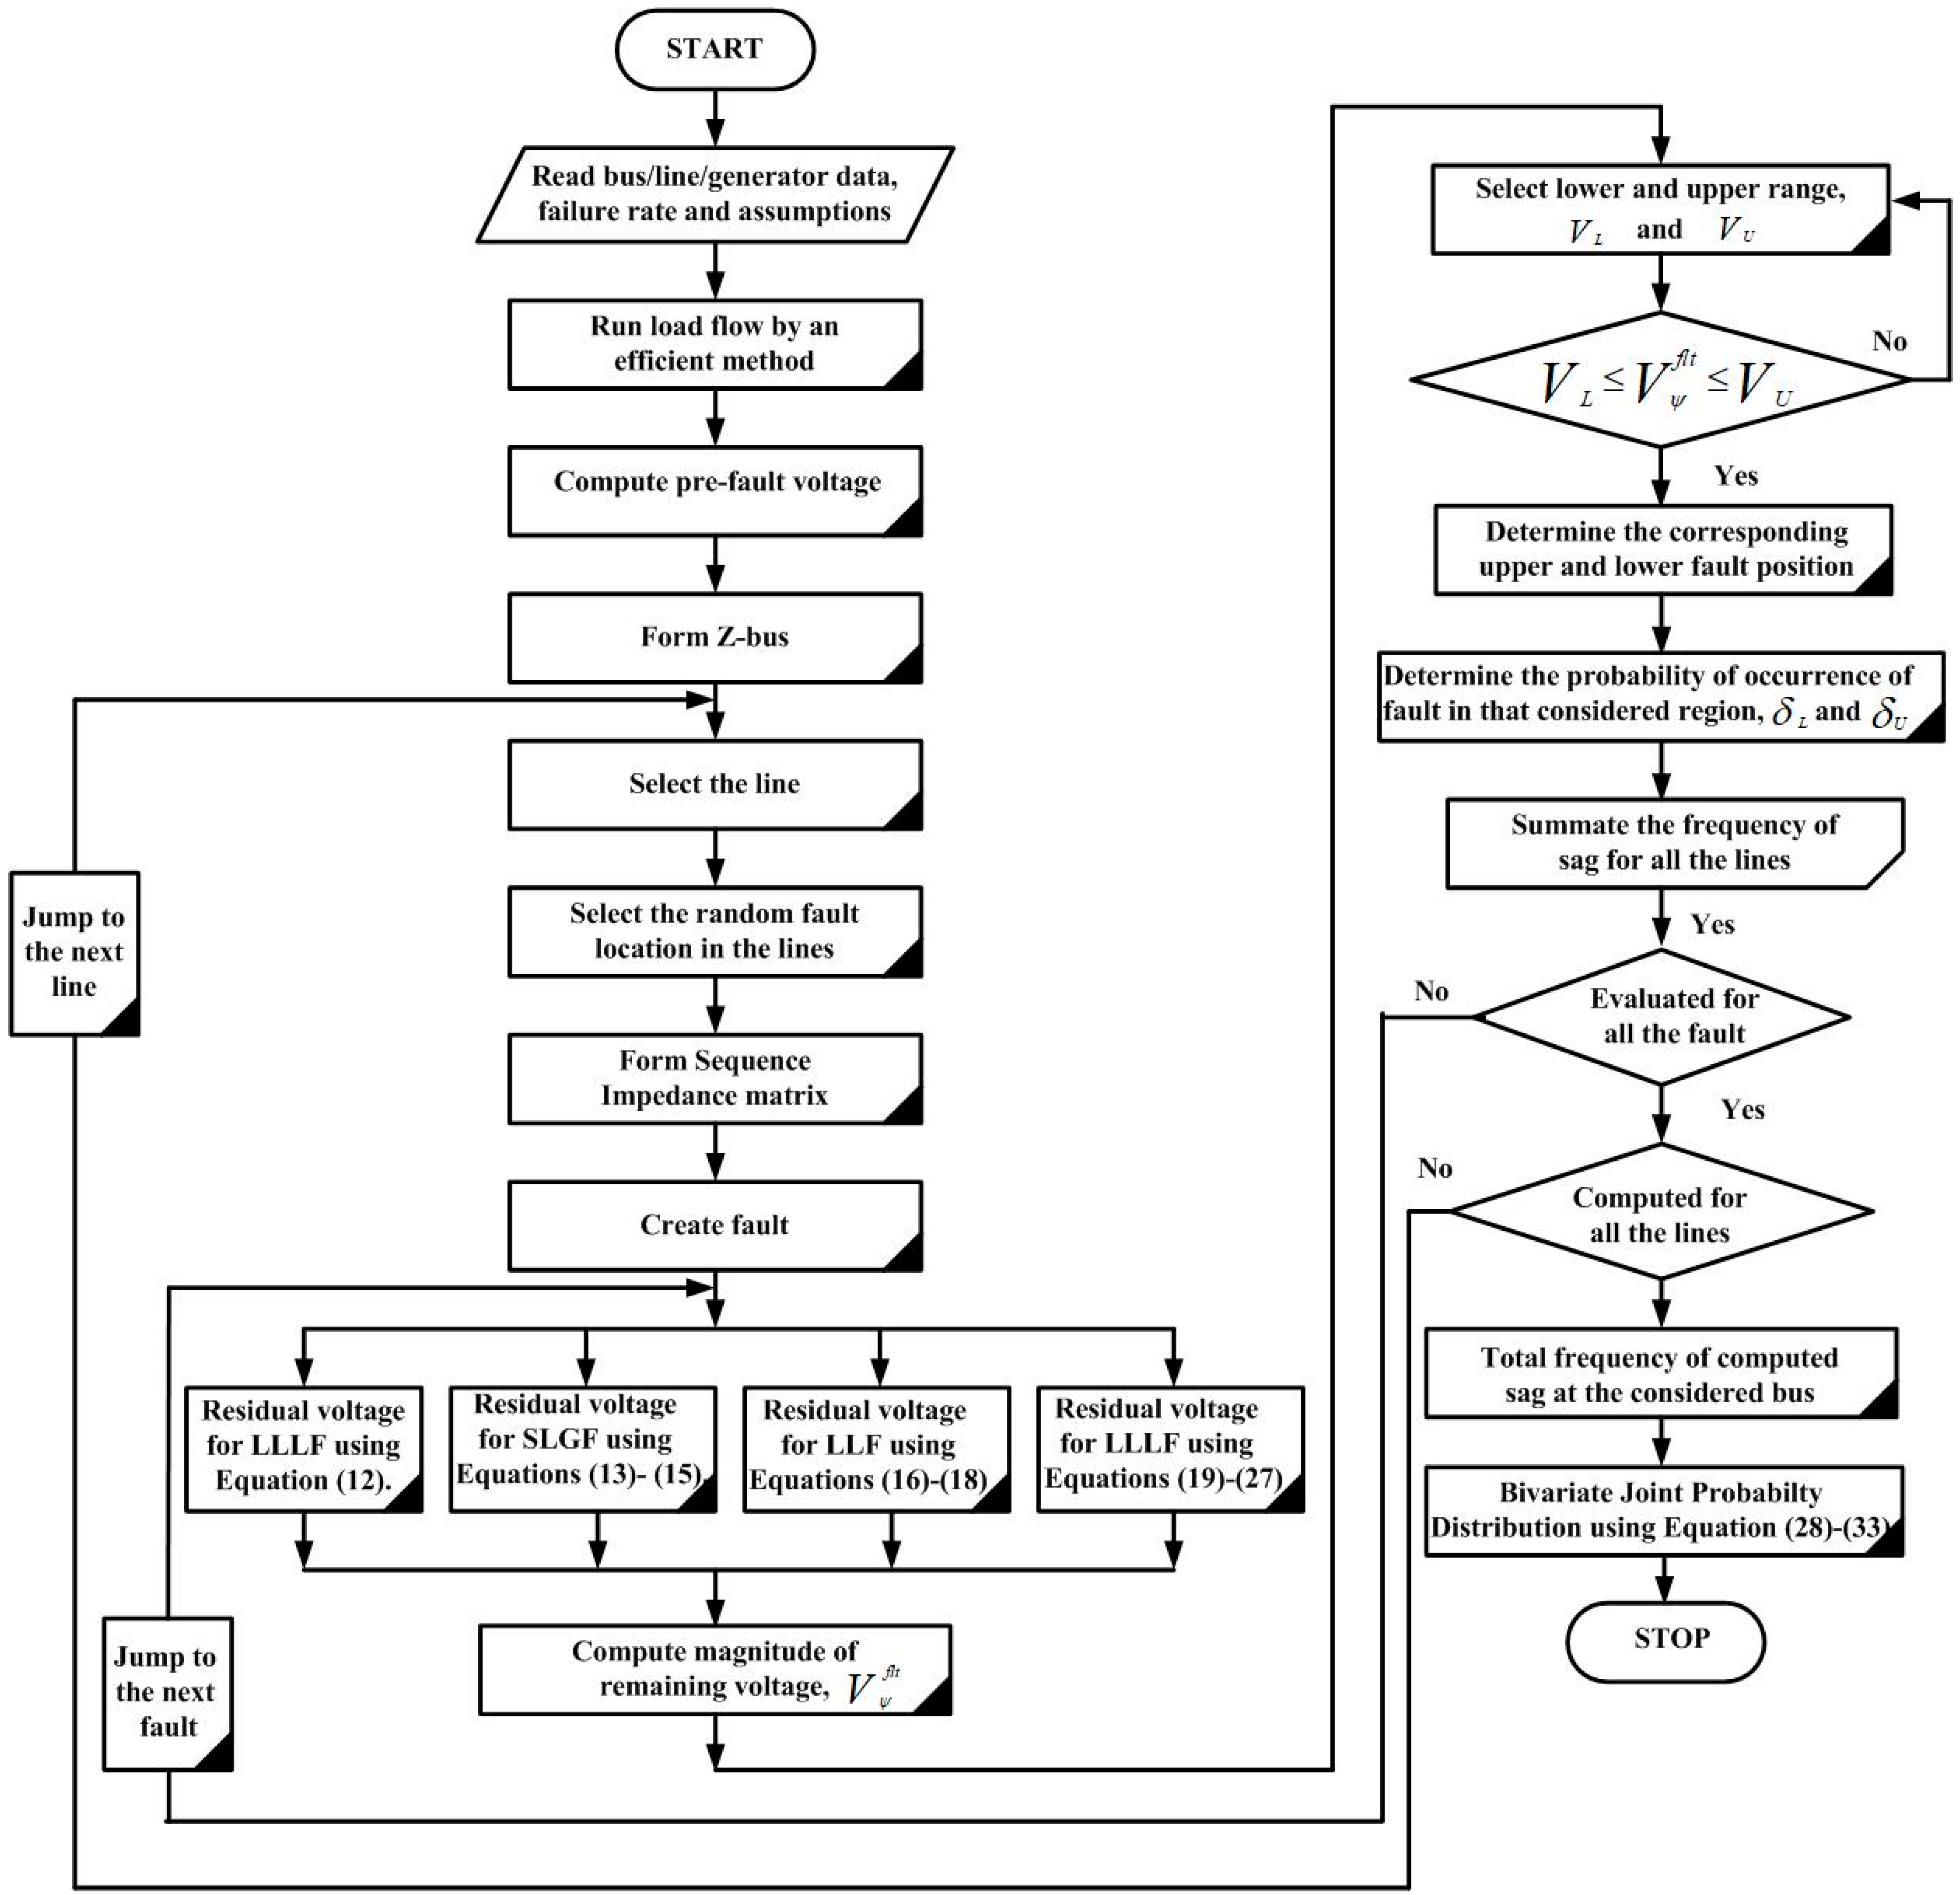
5. Proposed Analytical Flow Chart for Determining the Frequency of Sag
5.1. Brief Explanation of the Flow Chart
- Required data and assumptions are fed to the system.
- Load flow analysis is performed to assess the pre-fault voltage with a fast and efficient load flow analysis technique [25].
- A fault is created along the line, and its effect in terms of voltage is noted at the buses by using the Equations (12)–(27).
- Then, the noted voltages are classified with respect to different ranges, and hence, a total number of associated sags of any given bus.
- Step 3 is repeated for all the lines and different types of faults (SLGF, DLGF, LLF, LLLF, and LLLGF) of the tested system.
- After that, the sag analysis is performed by using the bivariate joint discrete probability distribution method that uses a joint probability mass function that gives a clear idea about the probability of sag occurrence in different regions in a meshed network.
5.2. Flow Chart
6. Case Study
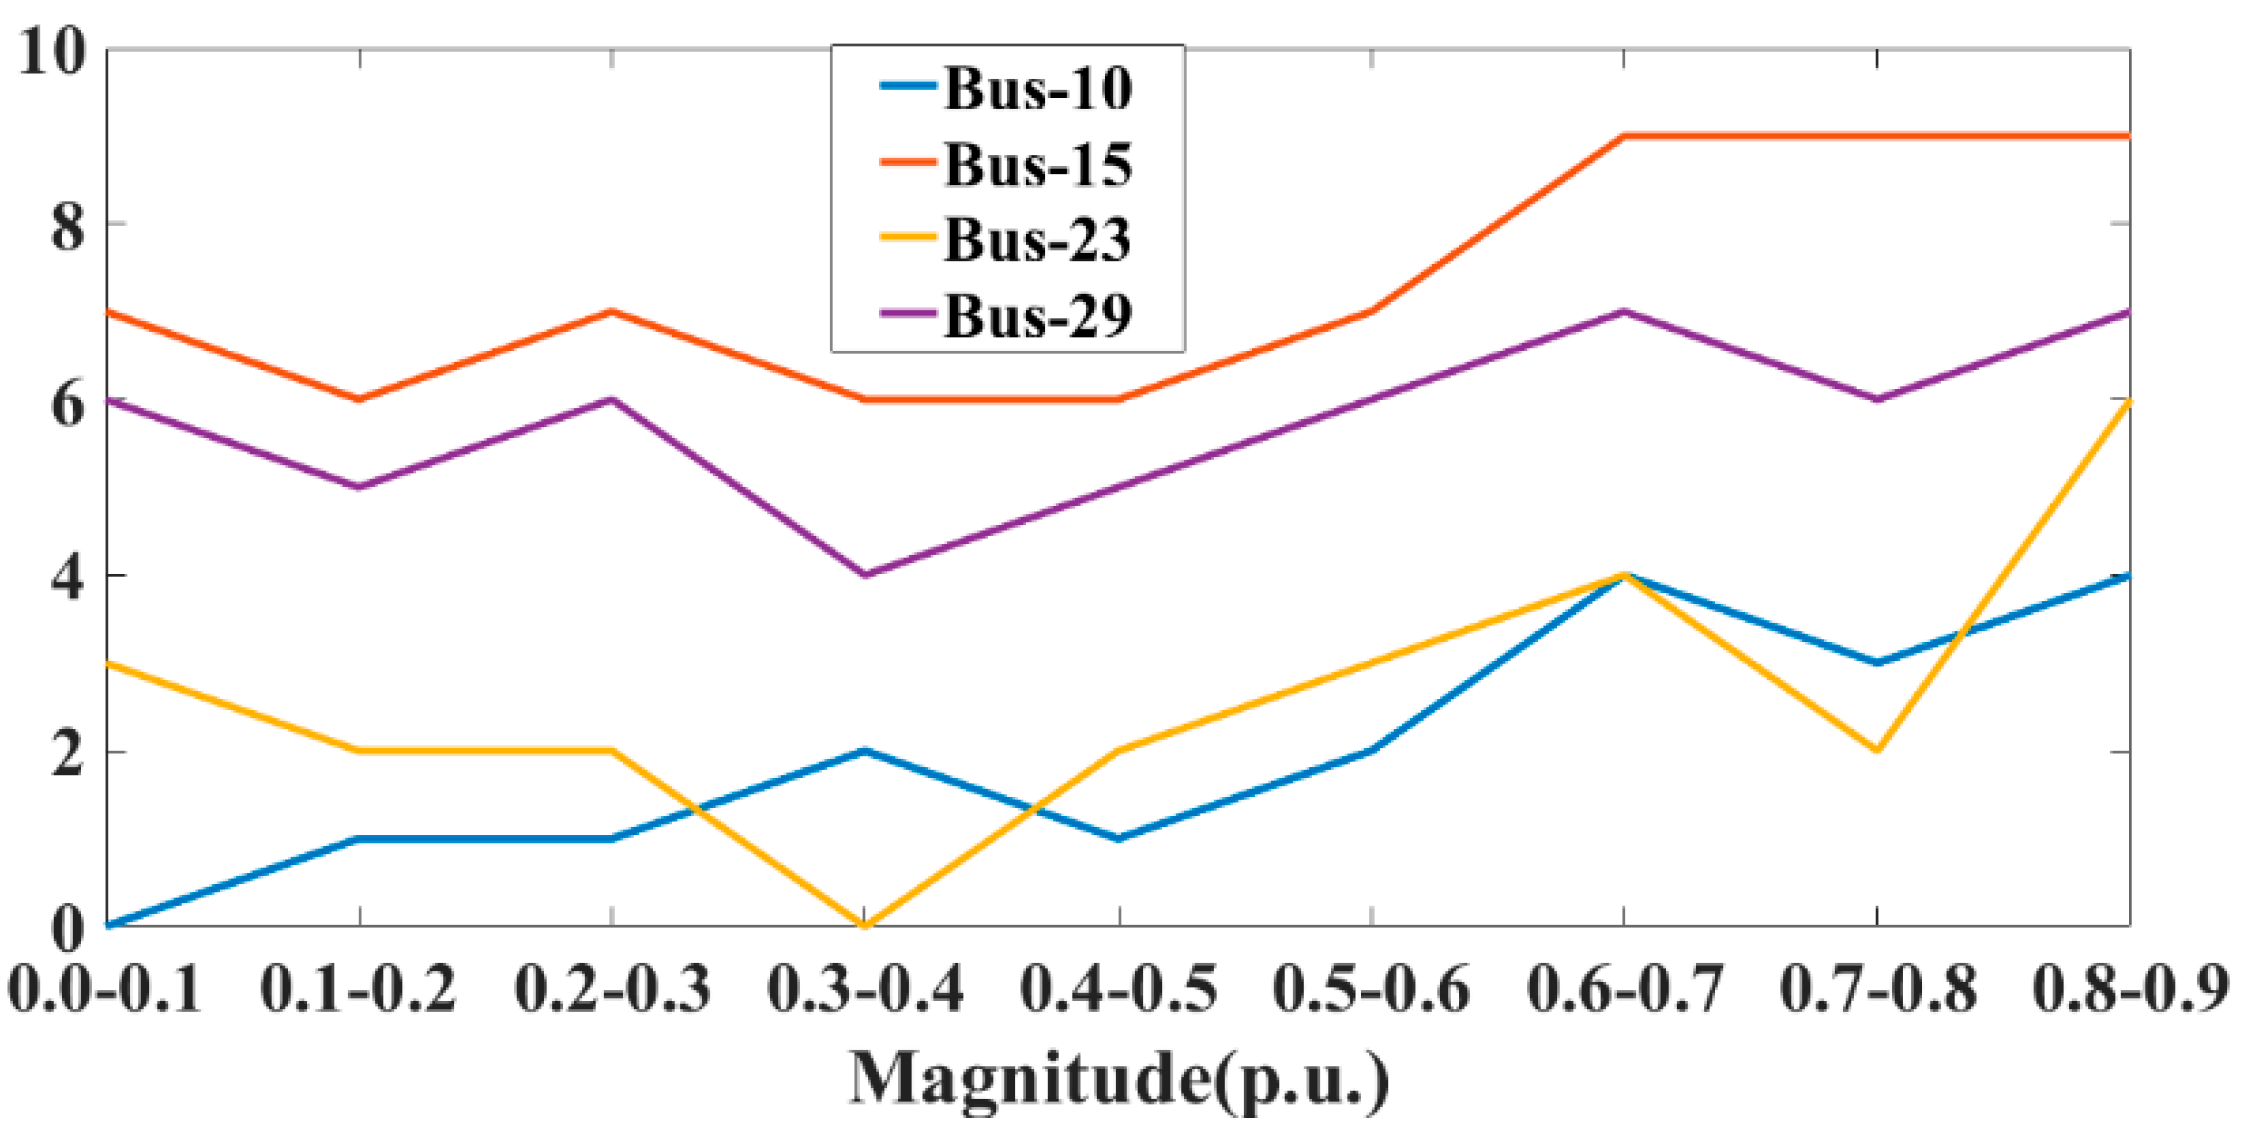
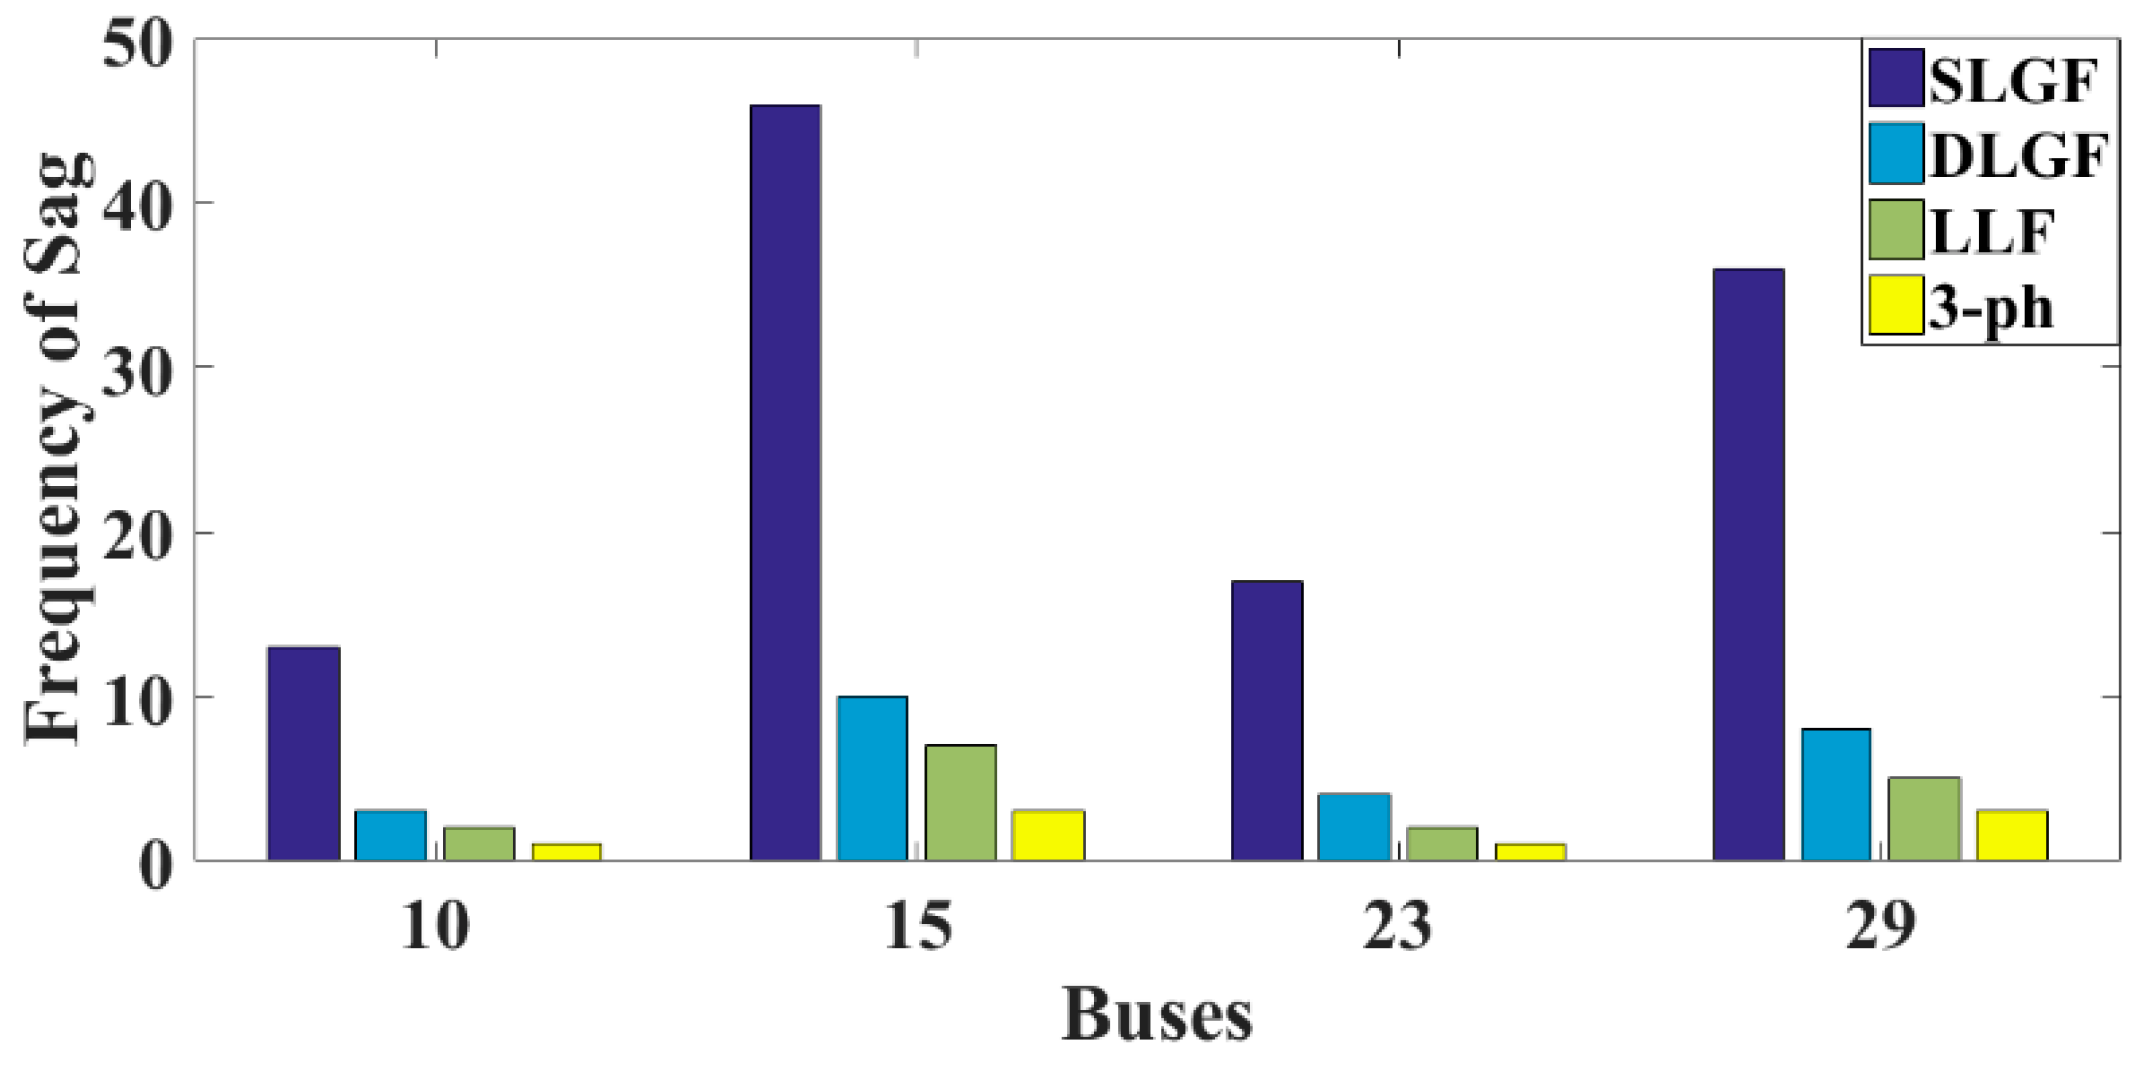
6.1. IEEE RTS-39 Bus Reliability Test System
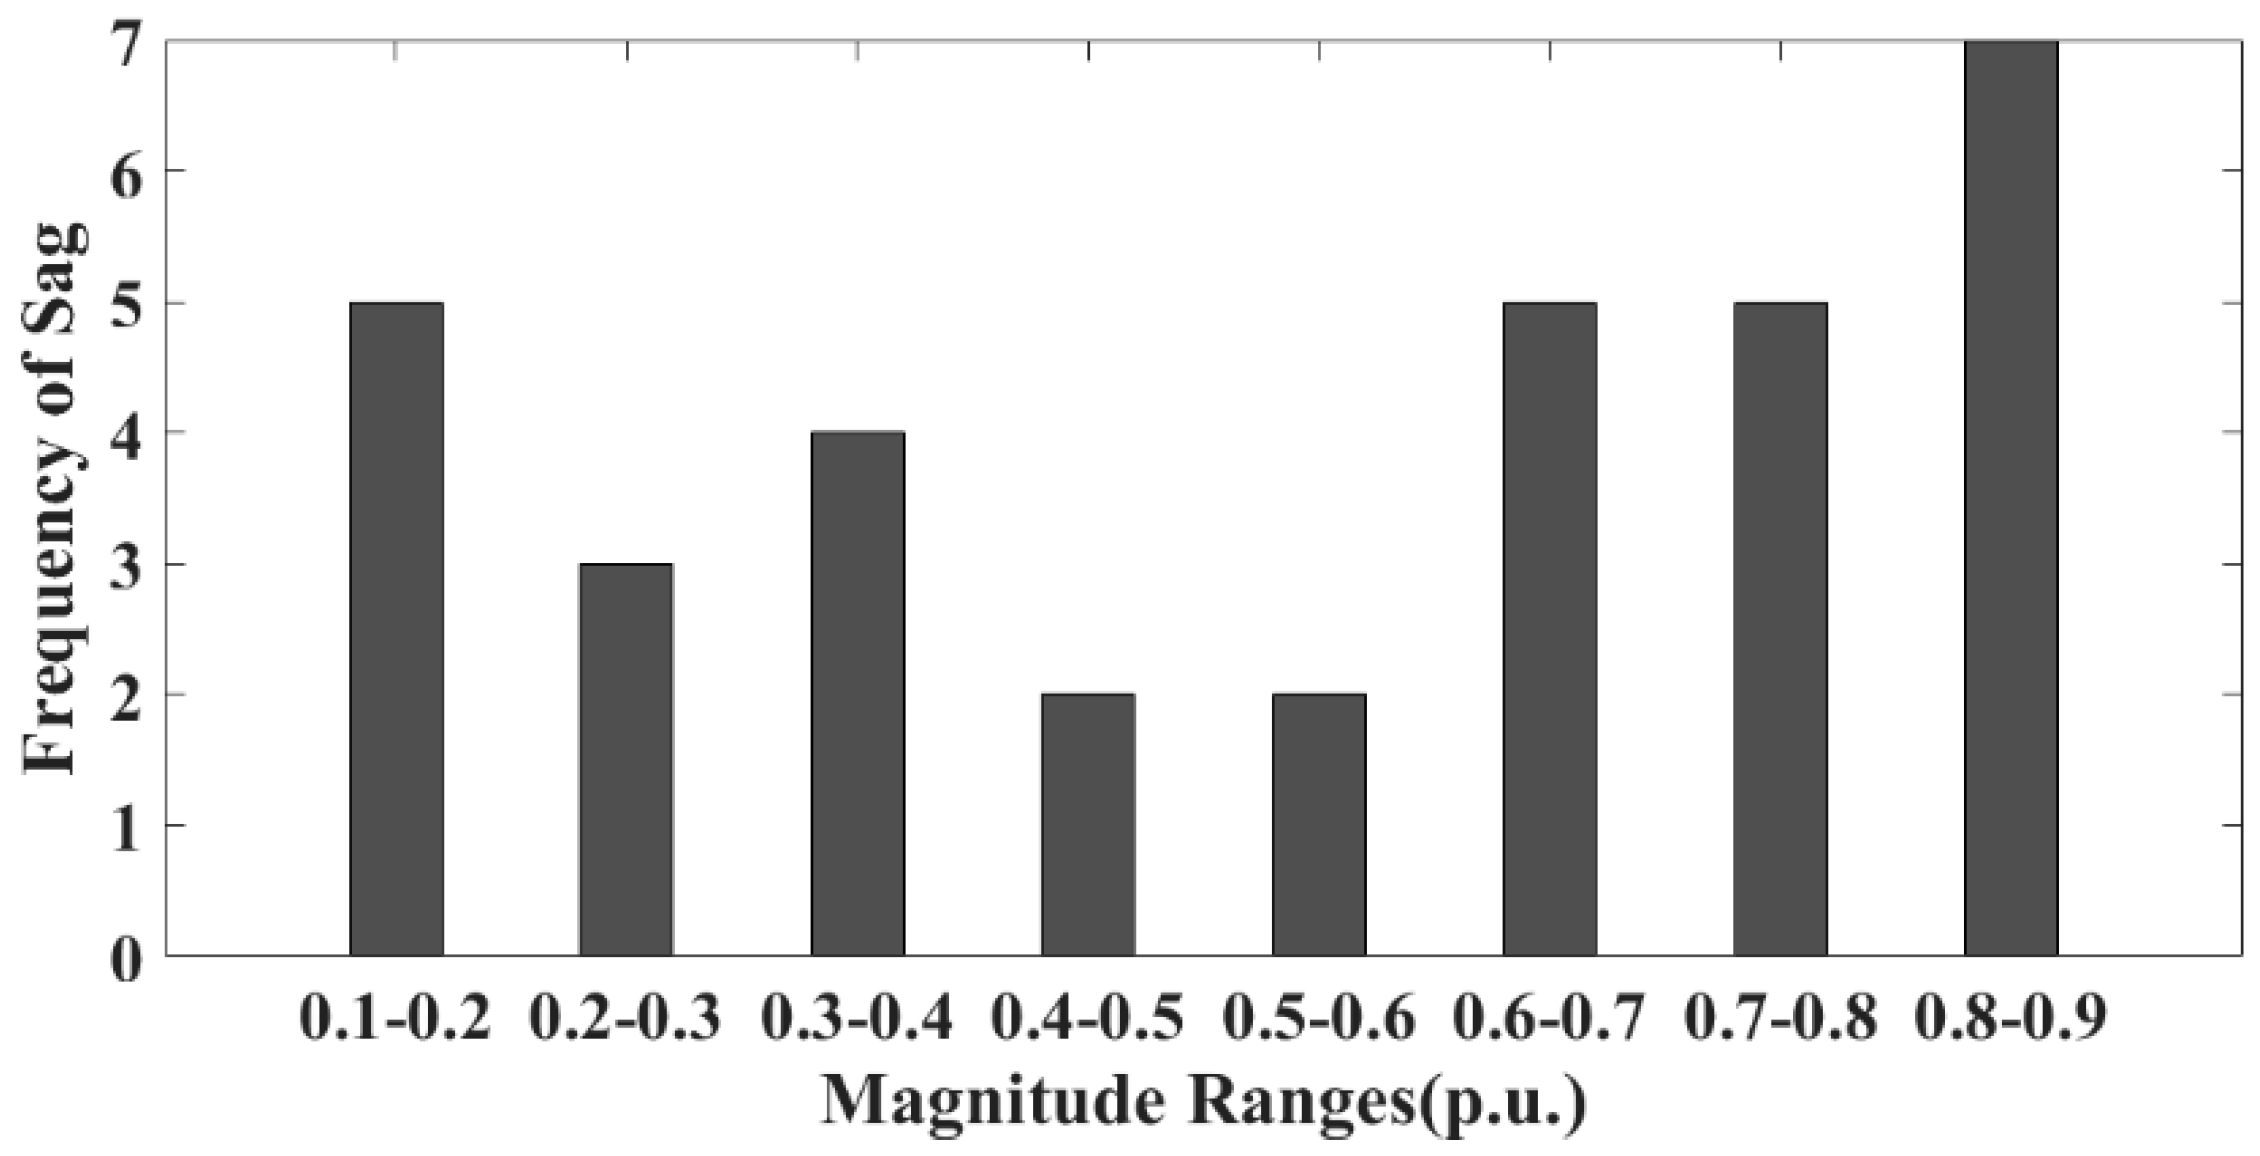
6.2. Study of the Assessment of Sag in a Real Distribution Network
7. Conclusions and Future Scope
Author Contributions
Funding
Data Availability Statement
Conflicts of Interest
References
- Dugan, R.C. Electrical Power System Quality, 2nd ed.; McGraw-Hill: New York, NY, USA, 1996; pp. 43–109. [Google Scholar]
- Bollen, M.H.J. Understanding Power Quality Problems, Voltage Sags and Interruptions; IEEE Press: Piscataway, NJ, USA, 2000; pp. 139–248. [Google Scholar]
- Goswami, A.K.; Gupta, C.P.; Singh, G.K. An analytical approach for assessment of voltage sags. J. Electr. Power Energy Syst. 2009, 31, 418–426. [Google Scholar] [CrossRef]
- Serrano-Fontova, A.; Casals Torrens, P.; Bosch, R. Power quality disturbances assessment during unintentional islanding scenarios. A contribution to voltage sag studies. Energies 2019, 12, 3198. [Google Scholar] [CrossRef]
- Han, Y.; Feng, Y.; Yang, P.; Xu, L.; Xu, Y.; Blaabjerg, F. Cause, Classification of Voltage Sag, and Voltage Sag Emulators and Applications: A Comprehensive Overview. IEEE Access 2020, 8, 1922–1934. [Google Scholar] [CrossRef]
- Deng, Y.; Liu, X.; Jia, R.; Huang, Q.; Xiao, G.; Wang, P. Sag Source Location and Type Recognition via Attention-based Independently Recurrent Neural Network. J. Mod. Power Syst. Clean Energy 2021, 9, 1018–1031. [Google Scholar] [CrossRef]
- Yalman, Y.; Uyanık, T.; Atlı, İ.; Tan, A.; Bayındır, K.Ç.; Karal, Ö.; Golestan, S.; Guerrero, J.M. Prediction of Voltage Sag Relative Location with Data-Driven Algorithms in Distribution Grid. Energies 2022, 15, 6641. [Google Scholar] [CrossRef]
- Mohammadi, Y.; Salarpour, A.; Leborgne, R.C. Comprehensive strategy for classification of voltage sags source location using optimal feature selection applied to support vector machine and ensemble techniques. Int. J. Electr. Power Energy Syst. 2021, 124, 106363. [Google Scholar] [CrossRef]
- Arias-Guzmán, S.; Ruiz-Guzman, O.A.; Garcia-Arias, L.F.; Jaramillo-Gonzales, M.; Cardona-Orozco, P.D.; Ustariz-Farfan, A.J.; Cano-Plata, E.A.; Salazar-Jimenez, A.F. Analysis of Voltage Sag Severity Case Study in an Industrial Circuit. IEEE Trans. Ind. Appl. 2017, 53, 15–21. [Google Scholar] [CrossRef]
- Begum, M.T.A.; Alam, M.R.; Muttaqi, K.M. Analytical expressions for characterising voltage dips and phase-angle jumps in electricity networks. IET Gener. Transm. Distrib. 2019, 13, 116–126. [Google Scholar] [CrossRef]
- Alam, M.R.; Muttaqi, K.M.; Bouzerdoum, A. Characterizing Voltage Sags and Swells Using Three-Phase Voltage Ellipse Parameters. IEEE Trans. Ind. Appl. 2015, 51, 2780–2790. [Google Scholar] [CrossRef]
- Hao, C.; Jin, J. Clustering Analysis of Voltage Sag Events Based on Waveform Matching. Processes 2022, 10, 1337. [Google Scholar] [CrossRef]
- Otcenasova, A.; Bodnar, R.; Regula, M.; Hoger, M.; Repak, M. Methodology for determination of the number of equipment malfunctions due to voltage sags. Energies 2017, 10, 401. [Google Scholar] [CrossRef]
- Milanović, J.V.; Gupta, C.P. Probabilistic assessment of financial losses due to interruptions and voltage sags—Part II: Practical implementation. IEEE Trans. Power Deliv. 2006, 21, 925–932, 2006. [Google Scholar] [CrossRef]
- Motoki, É.M.; da Silveira, P.M.; Pereira, N.B.; de Souza, P.V.G. Cost of Industrial Process Shutdowns Due to Voltage Sag and Short Interruption. Energies 2021, 14, 2874. [Google Scholar] [CrossRef]
- Behera, C.; Reddy, G.H.; Chakrapani, P.; Goswami, A.K.; Gupta, C.P.; Singh, G.K. Assessment of equipment trip probability due to voltage sags based on fuzzy possibility distribution function. IEEE Access 2018, 6, 76889–76899. [Google Scholar] [CrossRef]
- Dos Santos, A.; Rosa, T.; de Barros, M.T.C. Stochastic characterization of voltage sag occurrence based on field data. IEEE Trans. Power Deliv. 2018, 34, 496–504. [Google Scholar] [CrossRef]
- Park, C.H.; Jang, G. Stochastic estimation of voltage sags in a large meshed network. IEEE Trans. Power Deliv. 2007, 22, 1655–1664. [Google Scholar] [CrossRef]
- Khatri, N.; Kumar, V.; Bansal, R.C.; Joshi, R.R. Stochastic evaluation of voltage sag in power system network considering effect of photovoltaic generation. Int. Trans. Electr. Energy Syst. 2019, 29, 2773. [Google Scholar] [CrossRef]
- dos Santos, A.; de Barros, M.C. Voltage sag prediction for network planning. Electr. Power Syst. Res. 2016, 140, 976–983. [Google Scholar] [CrossRef]
- Mitra, R.; Goswami, A.K.; Tiwari, P.K. Voltage sag assessment using type-2 fuzzy system considering uncertainties in distribution system. IET Gener. Transm. Distrib. 2017, 11, 1409–1419. [Google Scholar] [CrossRef]
- Sadat, H. Power System Analysis; McGraw-Hill: New York, NY, USA, 2002; pp. 335–442. [Google Scholar]
- Behera, C.; Banik, A.; Goswami, A.K. A novel approach for voltage sag representation in a chemical industry: A case study. Eng. Rep. 2020, 2, 12198. [Google Scholar] [CrossRef]
- Devore, J.L. Probability and Statistics for Engineering and the Science, 8th ed.; Brooks/Cole: Boston, MA, USA; Cengage Learning: Boston, MA, USA, 2012; pp. 193–230. [Google Scholar]
- Ghatak, U.; Mukherjee, V. A fast and efficient load flow technique for unbalanced distribution system. Int. J. Electr. Power Energy Syst. 2017, 84, 99–110. [Google Scholar] [CrossRef]
- IEEE 39-Bus Test Case. Available online: http://icseg.iti.illinois.edu/ieee-39-bus-system (accessed on 21 October 2020).
- UPCL Network Details. Available online: www.upcl.org (accessed on 21 October 2020).
- Küfeoğlu, S.; Lehtonen, M. Macroeconomic assessment of voltage sags. Sustainability 2016, 8, 1304. [Google Scholar] [CrossRef]


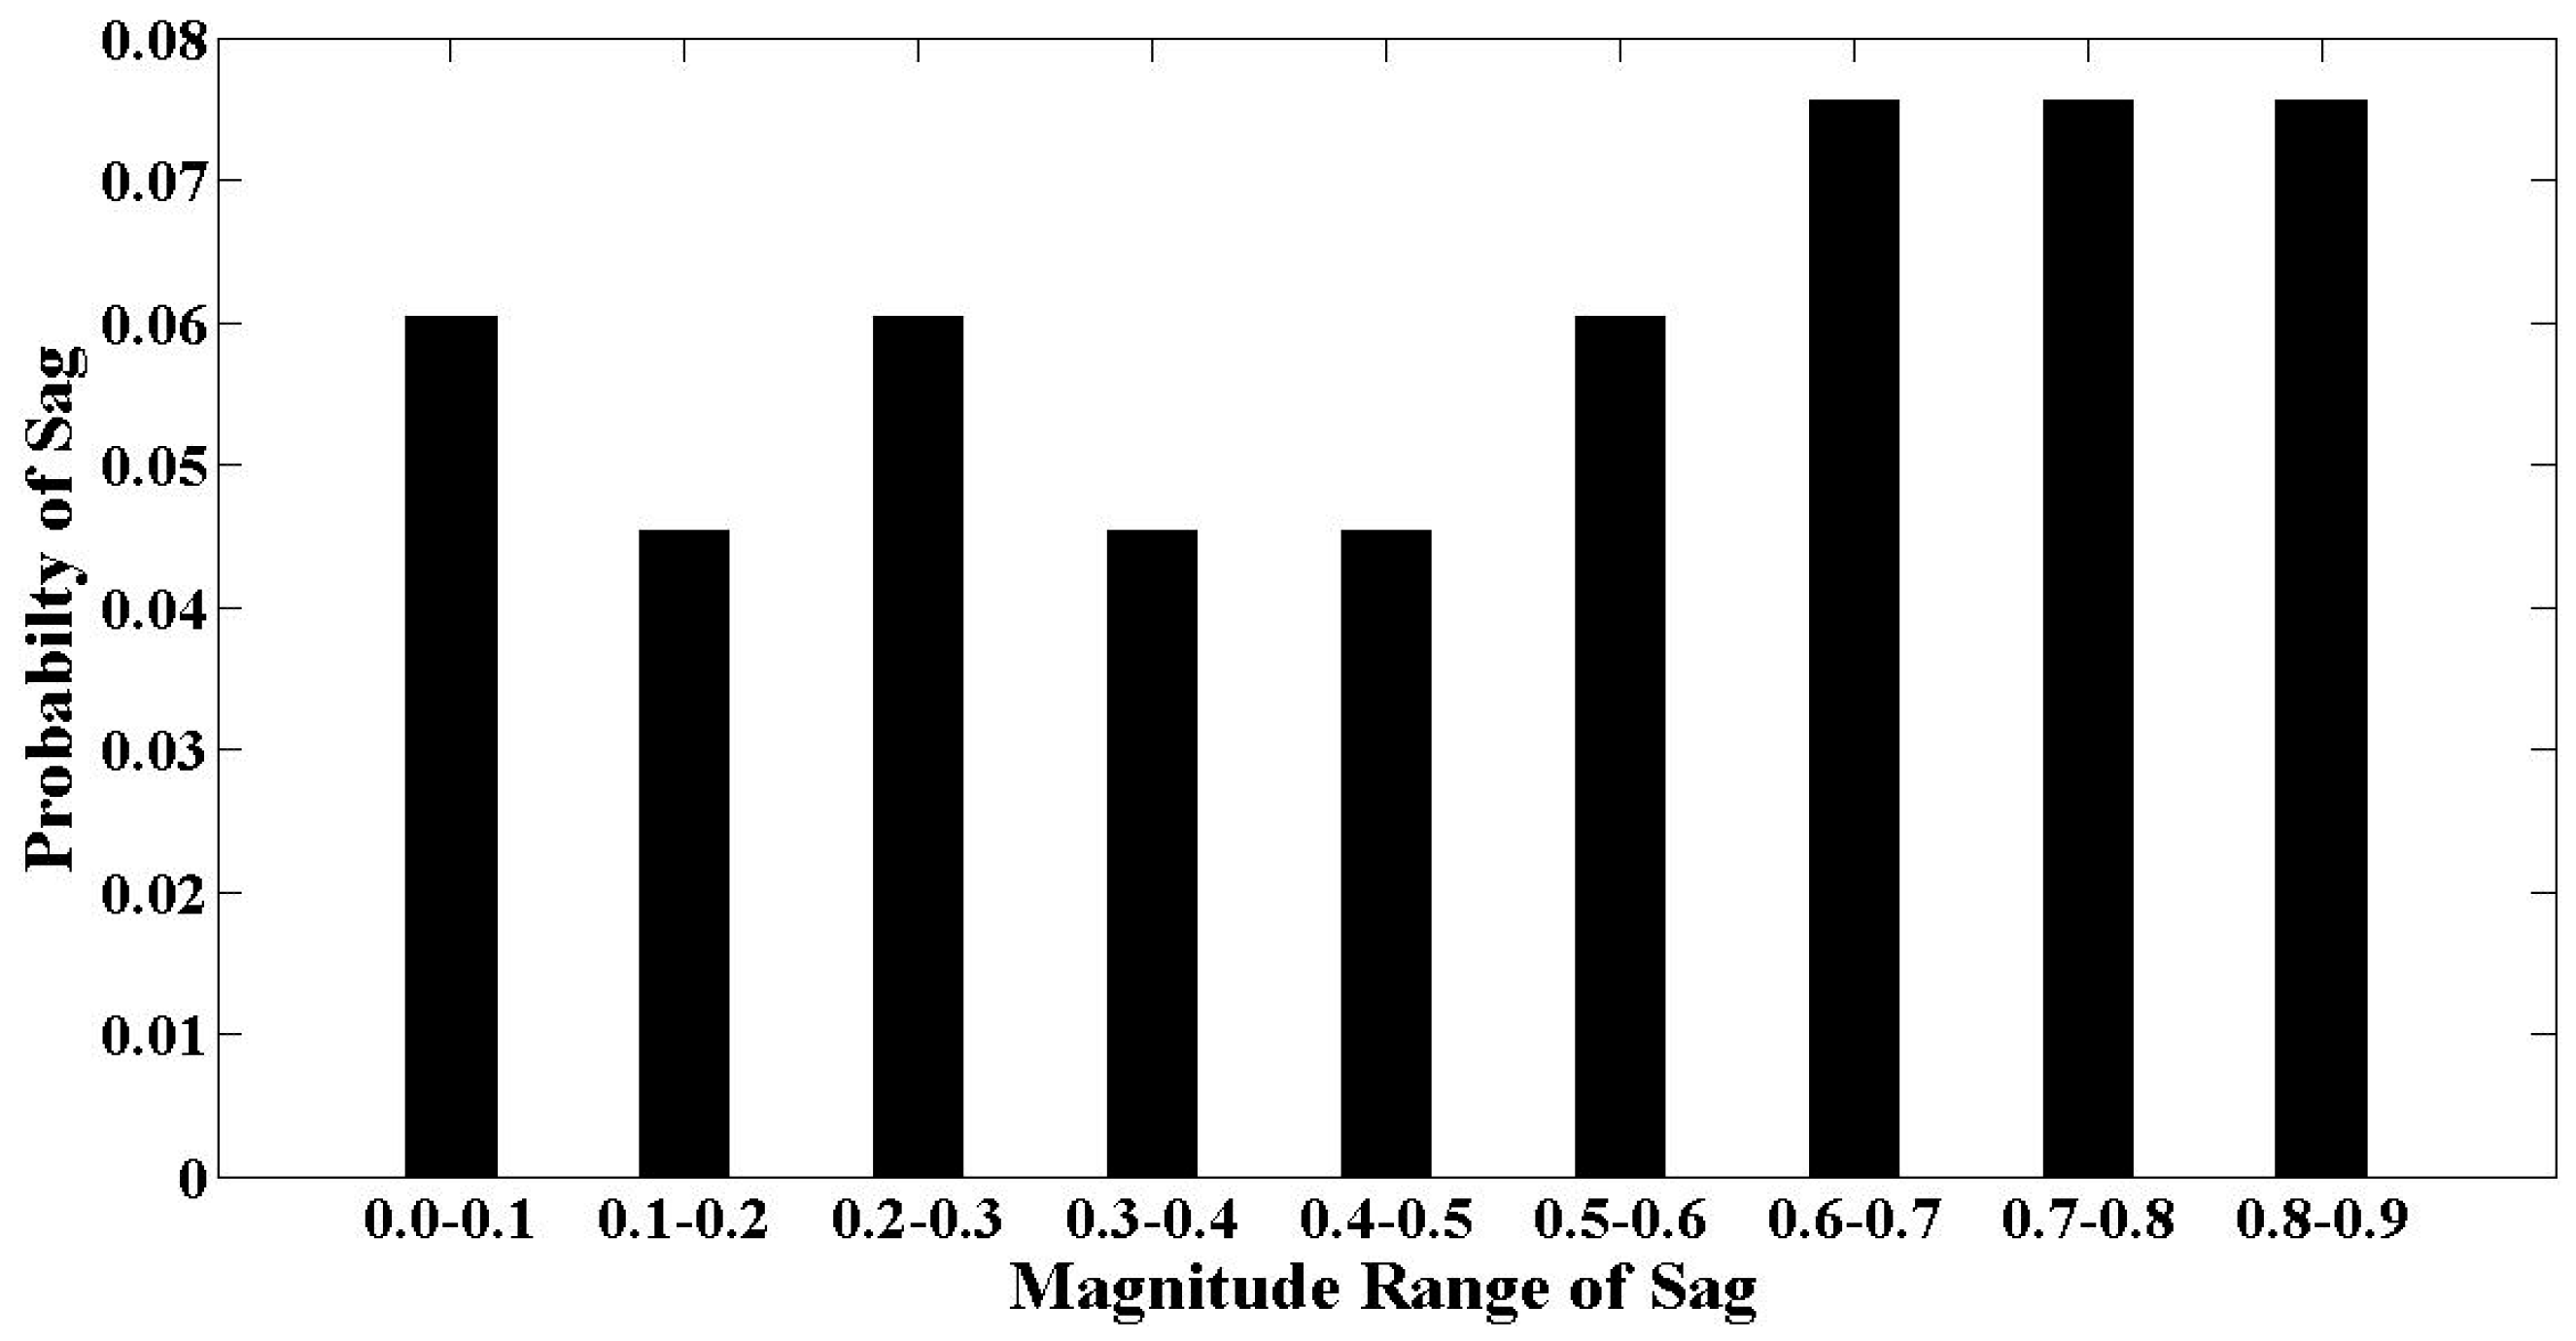
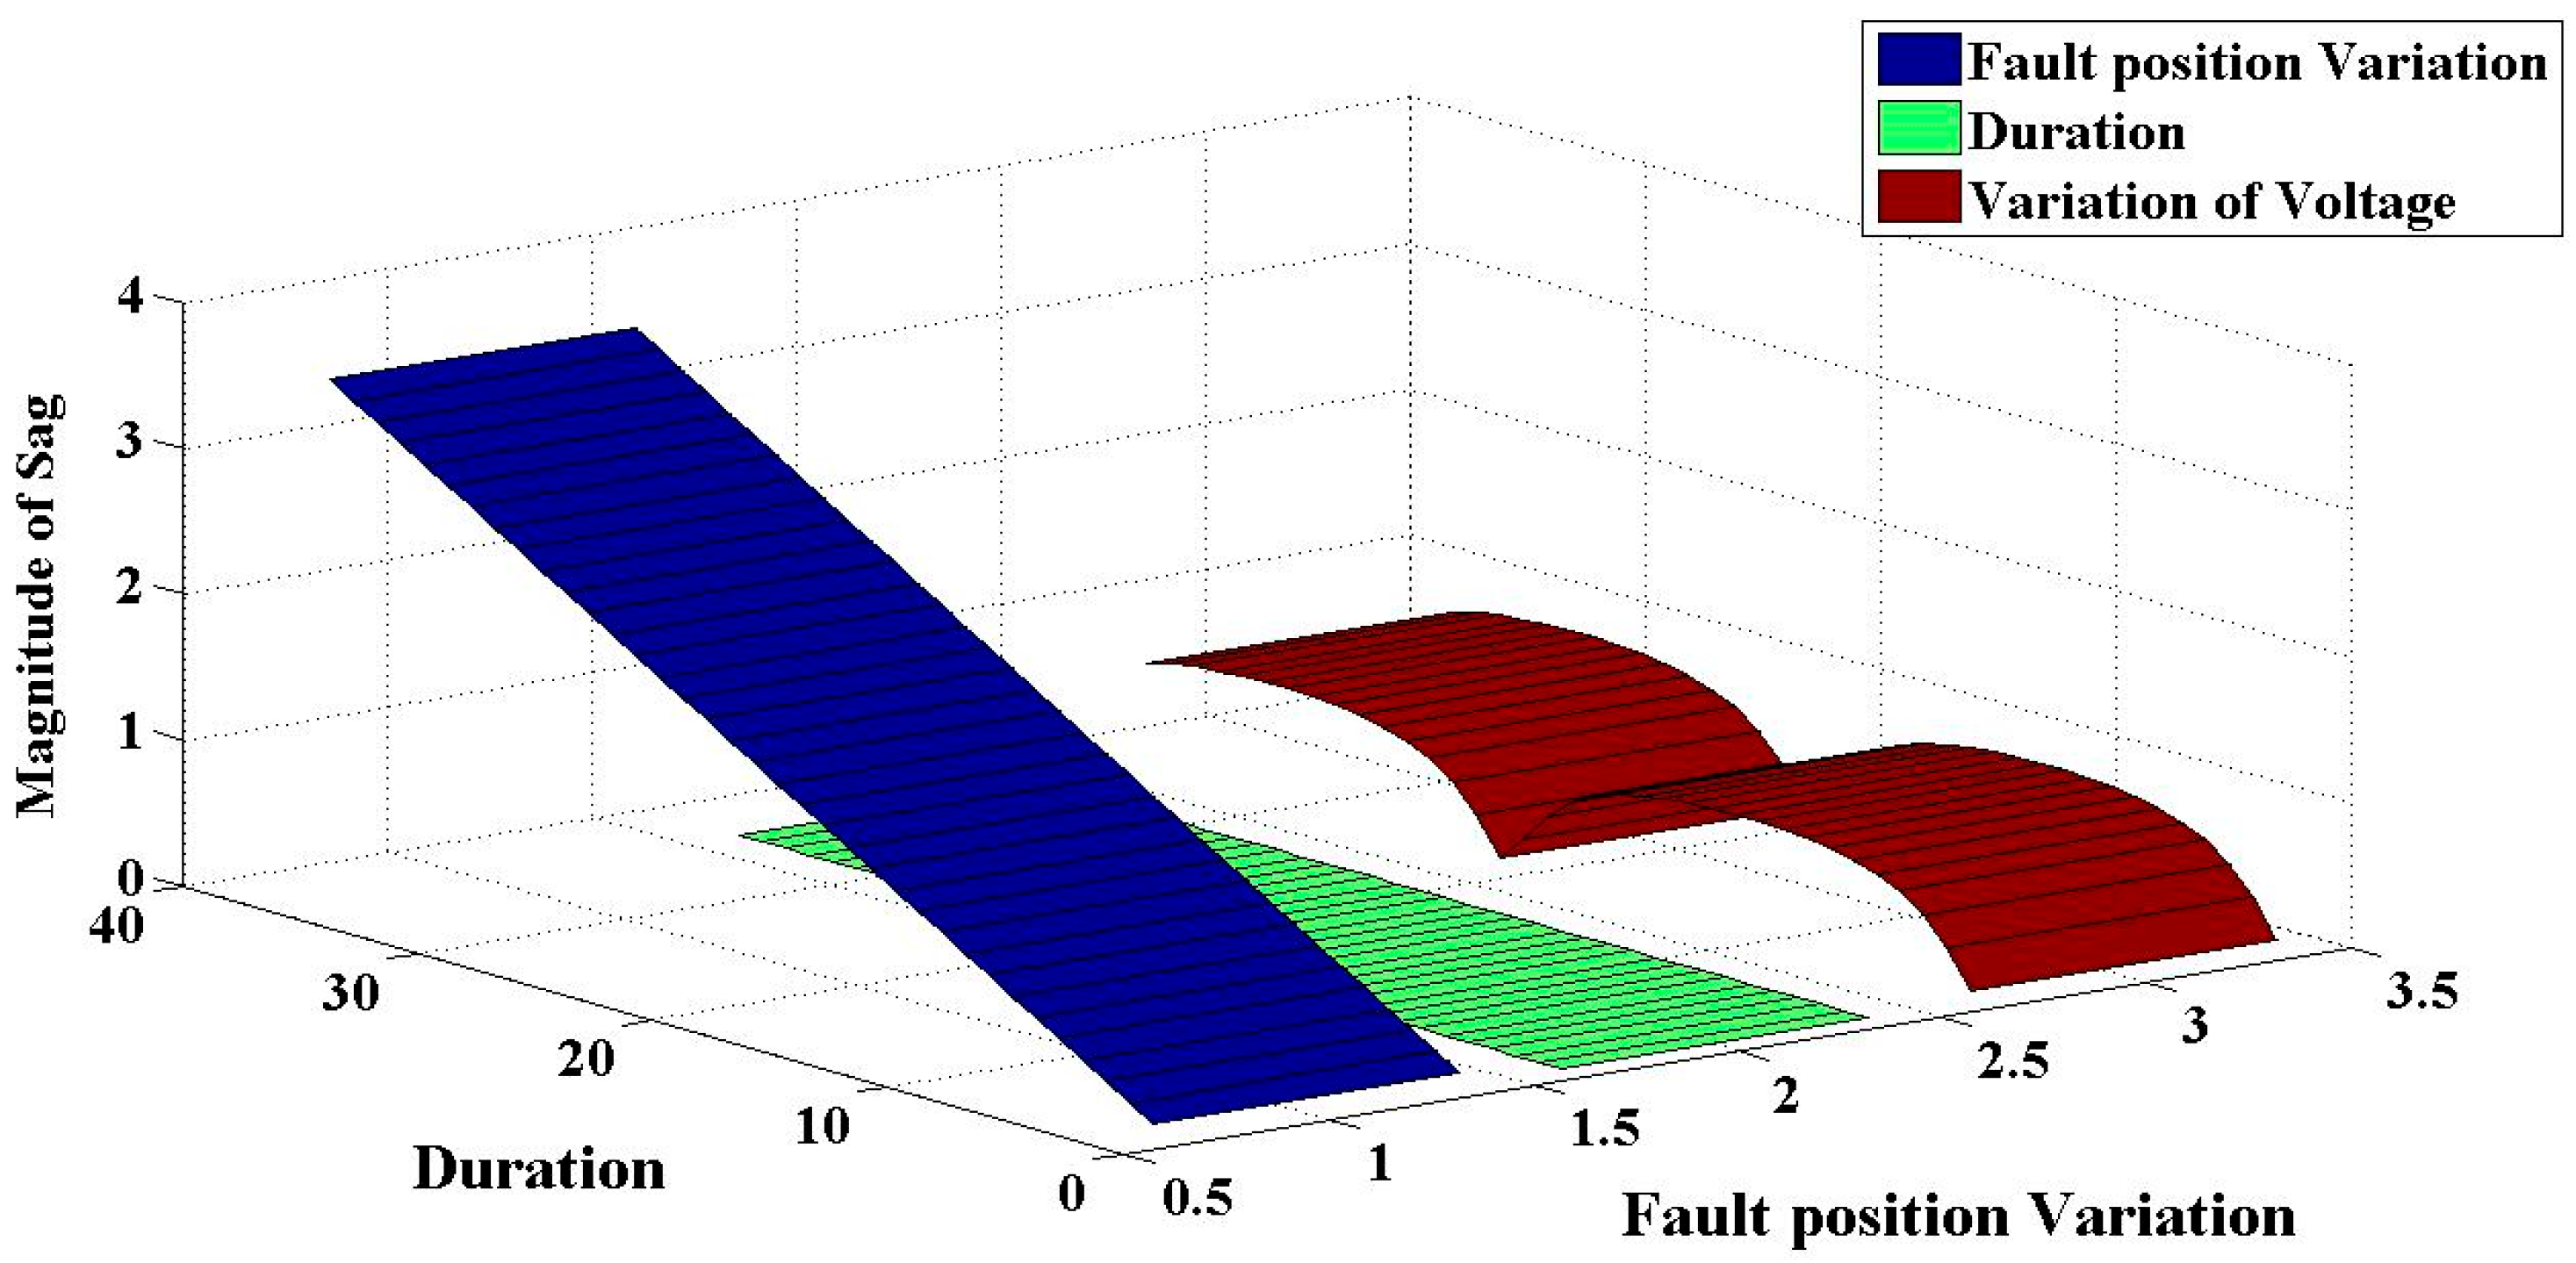

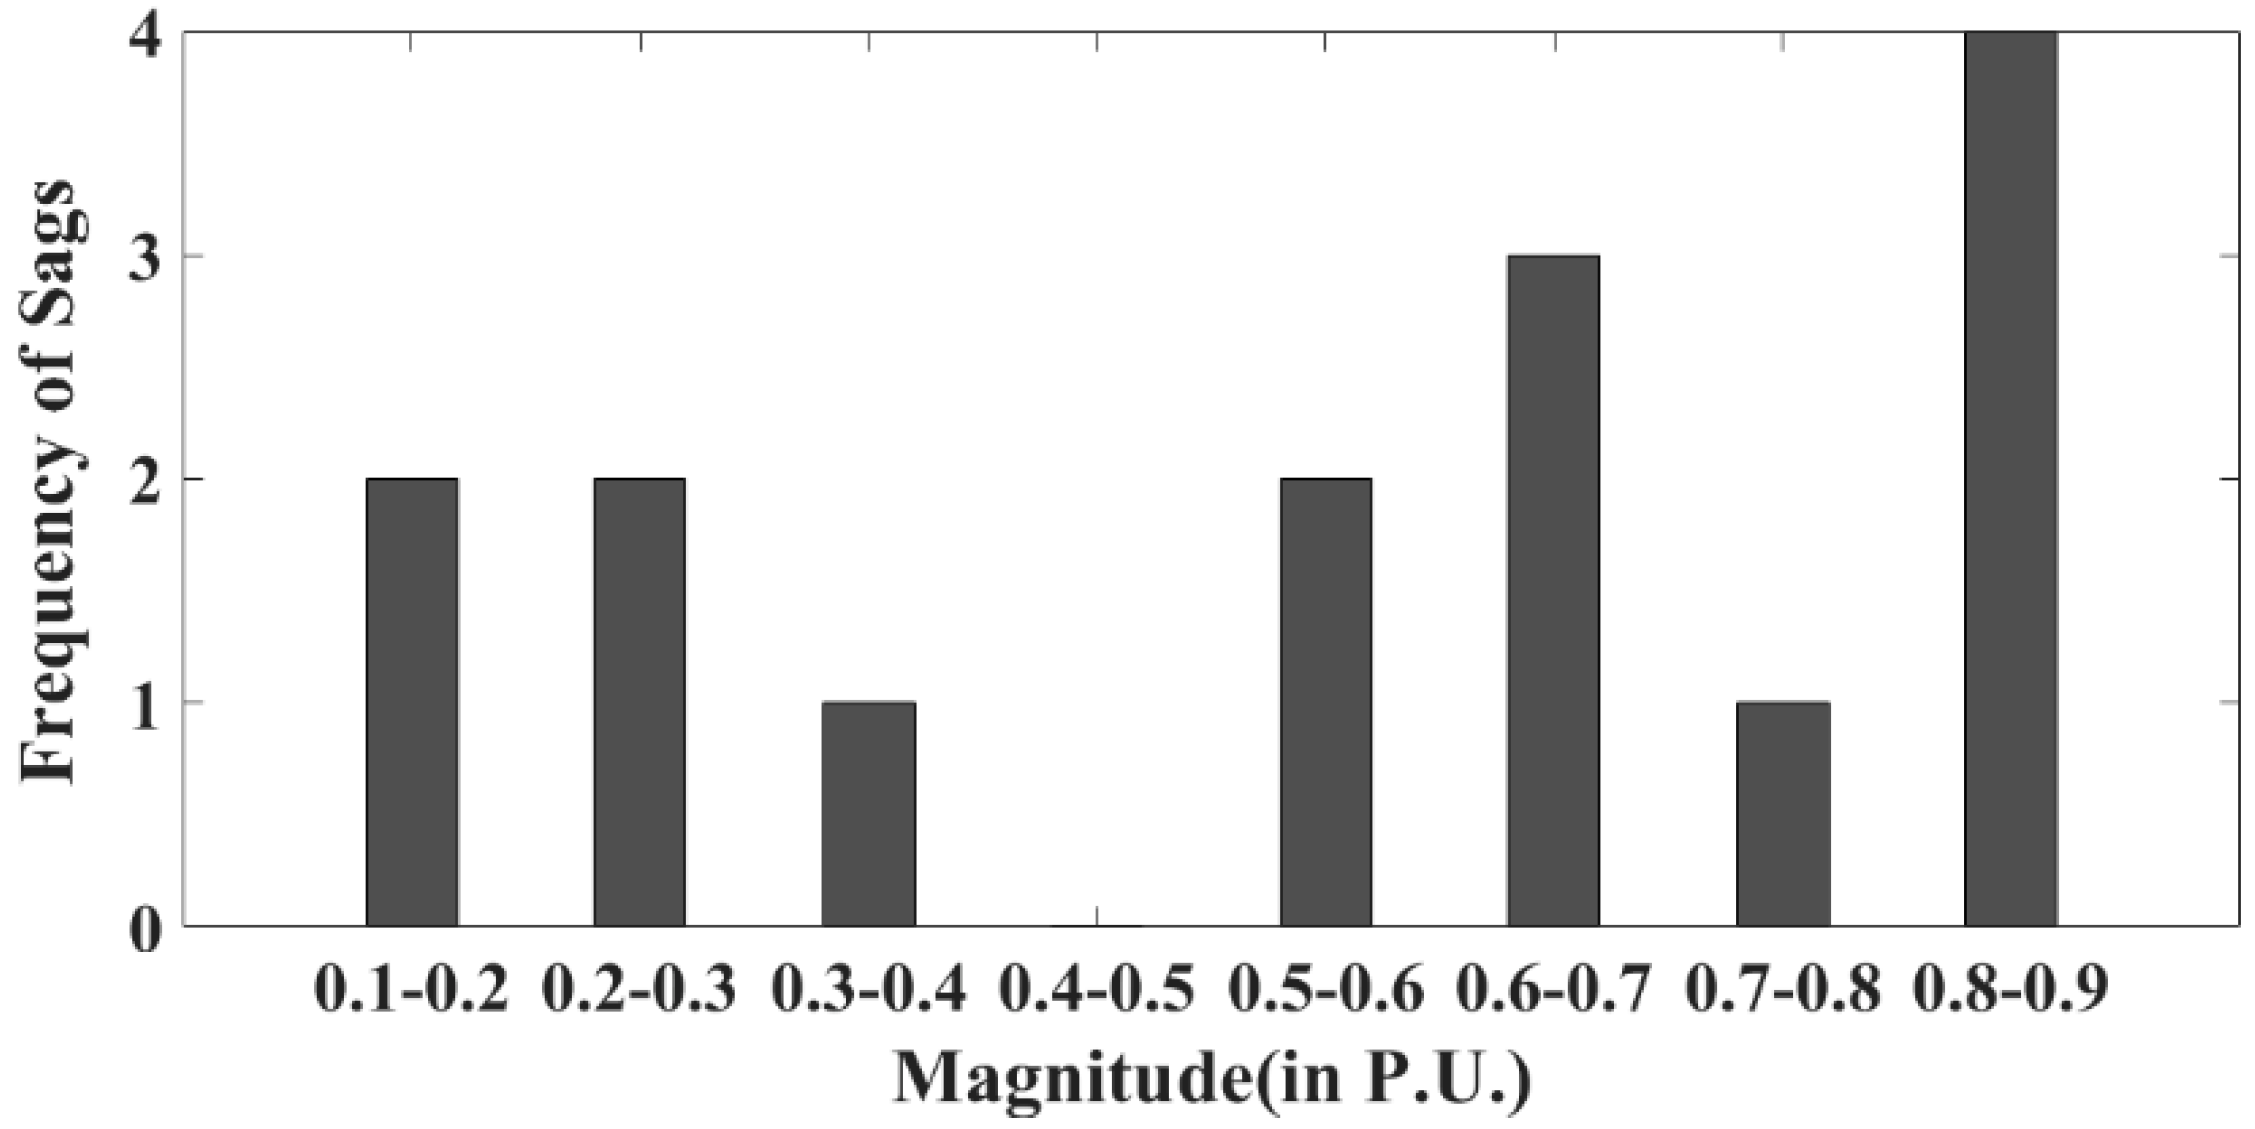
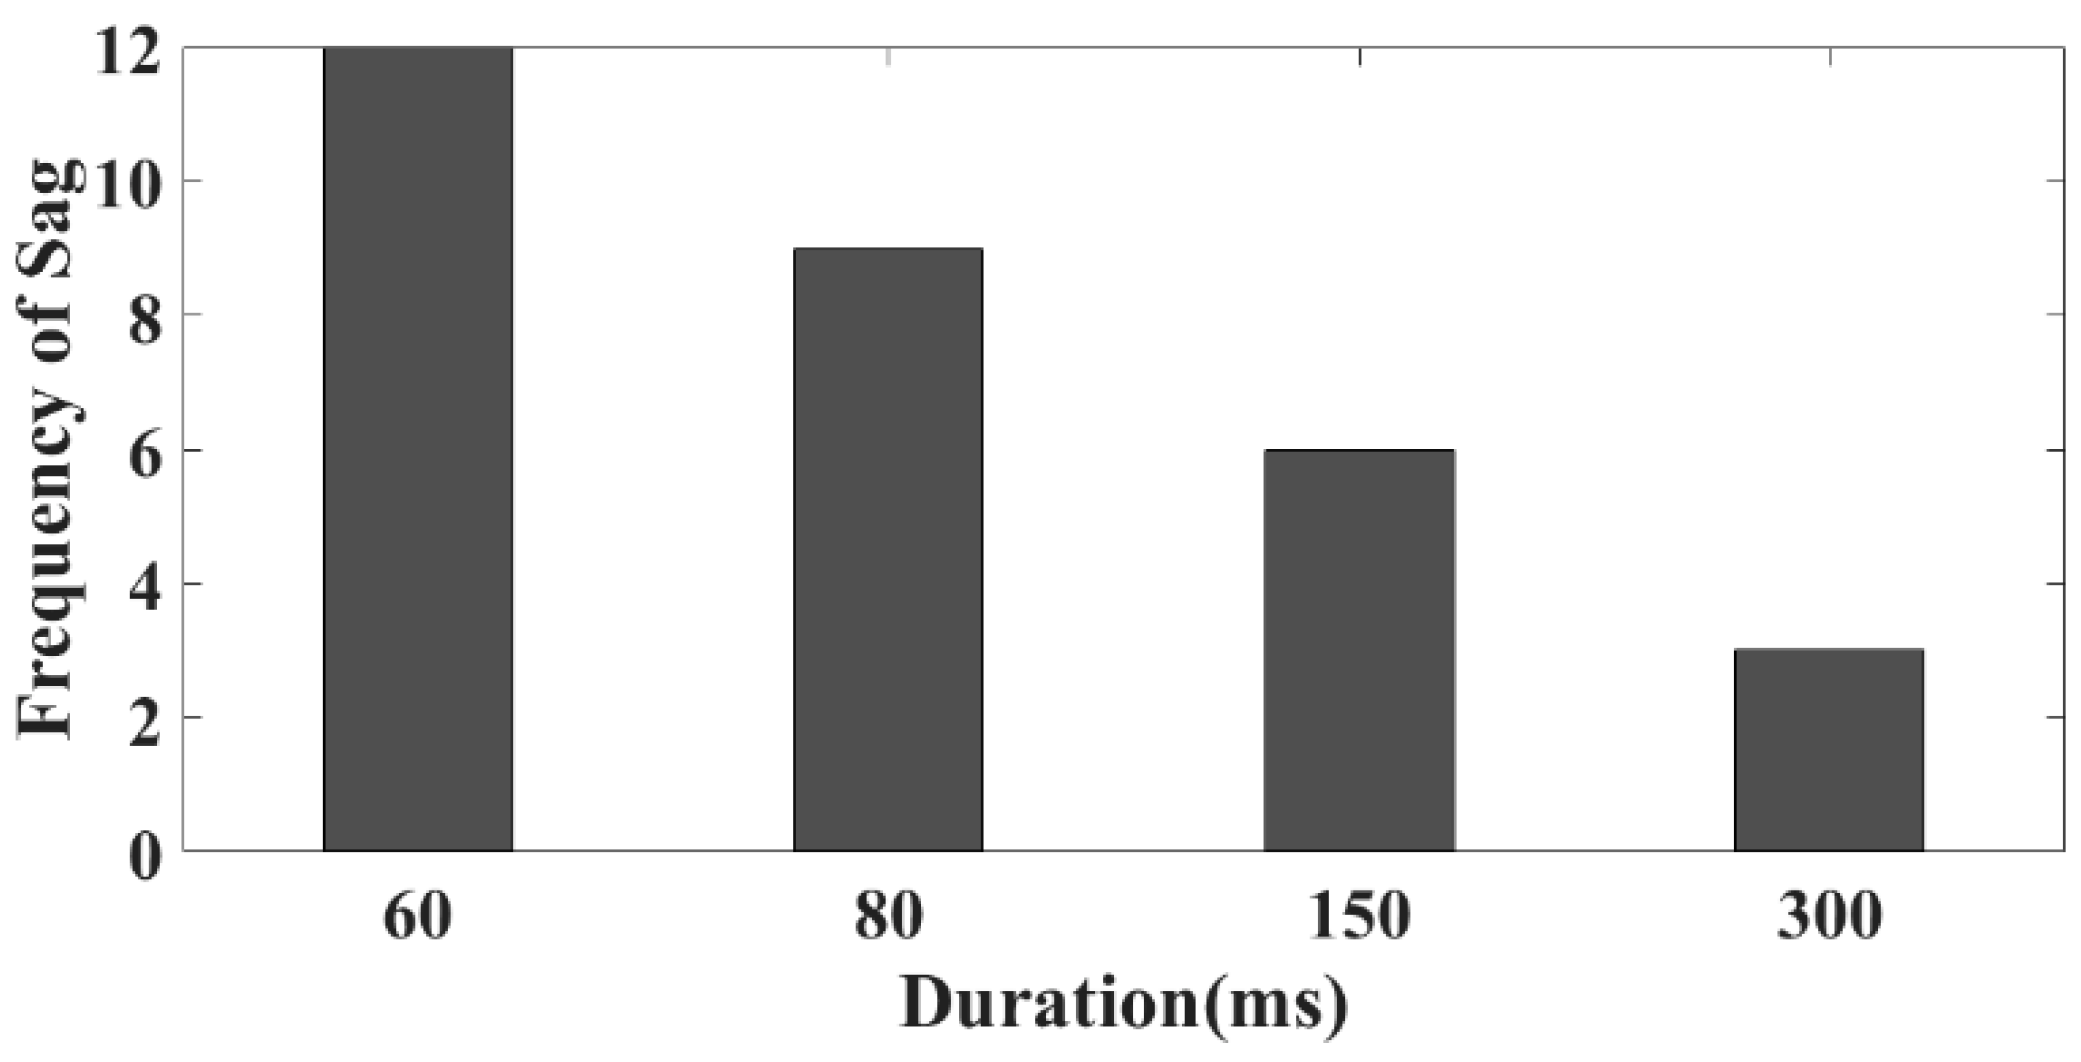


| Sag Range in p.u. (W) | Probabilities of Different Fault Type (K) | Total | |||
|---|---|---|---|---|---|
| 0.0–0.1 | 0.015152 | 0.060606 | 0.015152 | 0.015152 | 0.106061 |
| 0.1–0.2 | 0 | 0.045455 | 0.030303 | 0.015152 | 0.090909 |
| 0.2–0.3 | 0.015152 | 0.060606 | 0.015152 | 0.015152 | 0.106061 |
| 0.3–0.4 | 0 | 0.045455 | 0.030303 | 0.015152 | 0.090909 |
| 0.4–0.5 | 0 | 0.045455 | 0.030303 | 0.015152 | 0.090909 |
| 0.5–0.6 | 0.015152 | 0.060606 | 0.015152 | 0.015152 | 0.106061 |
| 0.6–0.7 | 0.015152 | 0.075758 | 0.030303 | 0.015152 | 0.136364 |
| 0.7–0.8 | 0.015152 | 0.075758 | 0.030303 | 0.015152 | 0.136364 |
| 0.8–0.9 | 0.015152 | 0.075758 | 0.030303 | 0.015152 | 0.136364 |
| 0.090909 | 0.545455 | 0.227273 | 0.136364 | ||
| S.N | Fault Position Variation | Duration for SLGF in Sec | Variation of Magnitude of Sag |
|---|---|---|---|
| 1. | 0.1 | 0.008 | 0.07 |
| 2. | 0.2 | 0.008 | 0.32 |
| 3. | 0.3 | 0.008 | 0.5 |
| 4. | 0.4 | 0.008 | 0.62 |
| 5. | 0.5 | 0.008 | 0.69 |
| 6. | 0.6 | 0.008 | 0.74 |
| 7. | 0.7 | 0.008 | 0.78 |
| 8. | 0.8 | 0.008 | 0.8 |
| 9. | 0.9 | 0.008 | 0.81 |
| 10. | 1 | 0.008 | 0.82 |
| 11. | 1.1 | 0.008 | 0.82 |
| 12. | 1.2 | 0.008 | 0.82 |
| 13. | 1.3 | 0.008 | 0.81 |
| 14. | 1.4 | 0.008 | 0.79 |
| 15. | 1.5 | 0.008 | 0.77 |
| 16. | 1.6 | 0.008 | 0.73 |
| 17. | 1.7 | 0.008 | 0.67 |
| 18. | 1.8 | 0.008 | 0.58 |
| 19. | 1.9 | 0.008 | 0.44 |
| 20. | 2 | 0.008 | 0.24 |
| 21. | 2.1 | 0.008 | 0.07 |
| 22. | 2.2 | 0.008 | 0.32 |
| 23. | 2.3 | 0.008 | 0.5 |
| 24. | 2.4 | 0.008 | 0.62 |
| 25. | 2.5 | 0.008 | 0.69 |
| 26. | 2.6 | 0.008 | 0.74 |
| 27. | 2.7 | 0.008 | 0.77 |
| 28. | 2.8 | 0.008 | 0.8 |
| 29. | 2.9 | 0.008 | 0.81 |
| 30. | 3 | 0.008 | 0.82 |
| 31. | 3.1 | 0.008 | 0.82 |
| 32. | 3.2 | 0.008 | 0.81 |
| 33. | 3.3 | 0.008 | 0.8 |
| 34. | 3.4 | 0.008 | 0.79 |
| 35. | 3.5 | 0.008 | 0.76 |
| 36. | 3.6 | 0.008 | 0.72 |
| Type of Fault | Fault Rate of Lines (Event/Year/100 km) | Fault Rate of Bus (Event/Year) |
|---|---|---|
| 3Ph | 0.100 | 0.003 |
| SLGF | 2.000 | 0.064 |
| DLGF | 0.300 | 0.008 |
| LLF | 0.125 | 0.004 |
| Duration in Milliseconds (ms) | ||||
|---|---|---|---|---|
| Magnitude Ranges (p.u.) | 60 ms | 80 ms | 150 ms | 300 ms |
| 0.1–0.3 | 1 | 1 | 0 | 0 |
| 0.3–0.5 | 2 | 1 | 1 | 0 |
| 0.5–0.7 | 4 | 3 | 2 | 1 |
| 0.7–0.9 | 5 | 4 | 3 | 2 |
| Duration (ms) | ||||
|---|---|---|---|---|
| Magnitude Ranges (p.u.) | 60 ms | 80 ms | 150 ms | 300 ms |
| 0.1–0.3 | 3 | 2 | 1 | 0 |
| 0.3–0.5 | 5 | 3 | 2 | 1 |
| 0.5–0.7 | 7 | 4 | 3 | 2 |
| 0.7–0.9 | 9 | 7 | 4 | 2 |
| Buses | ||||
|---|---|---|---|---|
| Magnitude Range | Bus 10 | Bus 15 | Bus 23 | Bus 29 |
| 0.0–0.1 | 0 | 7 | 3 | 6 |
| 0.1–0.2 | 1 | 6 | 2 | 5 |
| 0.2–0.3 | 1 | 7 | 2 | 6 |
| 0.3–0.4 | 2 | 6 | 0 | 4 |
| 0.4–0.5 | 1 | 6 | 2 | 5 |
| 0.5–0.6 | 2 | 7 | 3 | 6 |
| 0.6–0.7 | 4 | 9 | 4 | 7 |
| 0.7–0.8 | 3 | 9 | 2 | 6 |
| 0.8–0.9 | 4 | 9 | 6 | 7 |
Publisher’s Note: MDPI stays neutral with regard to jurisdictional claims in published maps and institutional affiliations. |
© 2022 by the authors. Licensee MDPI, Basel, Switzerland. This article is an open access article distributed under the terms and conditions of the Creative Commons Attribution (CC BY) license (https://creativecommons.org/licenses/by/4.0/).
Share and Cite
Patra, J.; Pal, N. A Mathematical Approach of Voltage Sag Analysis Incorporating Bivariate Probability Distribution in a Meshed System. Energies 2022, 15, 7592. https://doi.org/10.3390/en15207592
Patra J, Pal N. A Mathematical Approach of Voltage Sag Analysis Incorporating Bivariate Probability Distribution in a Meshed System. Energies. 2022; 15(20):7592. https://doi.org/10.3390/en15207592
Chicago/Turabian StylePatra, Jagannath, and Nitai Pal. 2022. "A Mathematical Approach of Voltage Sag Analysis Incorporating Bivariate Probability Distribution in a Meshed System" Energies 15, no. 20: 7592. https://doi.org/10.3390/en15207592
APA StylePatra, J., & Pal, N. (2022). A Mathematical Approach of Voltage Sag Analysis Incorporating Bivariate Probability Distribution in a Meshed System. Energies, 15(20), 7592. https://doi.org/10.3390/en15207592


