Article

E-Scooter Micro-Mobility Application for Postal Service: The Case of Turkey for Energy, Environment, and Economy Perspectives

by
Yunus Emre Ayözen
1,
Hakan İnaç
2,
Abdulkadir Atalan
3,* and
Cem Çağrı Dönmez
4
1
Strategy Development Department, Ministry of Transport and Infrastructure, 06338 Ankara, Turkey
2
Investment Management & Control Department, Strategy Development Department, Ministry of Transport and Infrastructure, 06338 Ankara, Turkey
3
Faculty of Engineering, Gaziantep Islam Science and Technology University, 27260 Gaziantep, Turkey
4
Department of Industrial Engineering, Marmara University, 34722 Istanbul, Turkey
*
Author to whom correspondence should be addressed.
Energies 2022, 15(20), 7587; https://doi.org/10.3390/en15207587
Submission received: 22 September 2022 / Revised: 10 October 2022 / Accepted: 11 October 2022 / Published: 14 October 2022
(This article belongs to the Special Issue Sustainable Shared Mobility: Current Status and Future Prospects)

Abstract

:
In this research, the advantages of the e-scooter tool used in the mail or package delivery process were discussed by considering the Turkish Post Office (PTT) data in the districts of Istanbul (Kadıköy, Üsküdar, Kartal, and Maltepe) in Turkey. The optimization Poisson regression model was utilized to deliver the maximum number of packages or mails with minimum cost and the shortest time in terms of energy consumption, cost, and environmental contribution. Statistical and optimization results of dependent and independent variables were calculated using numerical and categorical features of 100 e-scooter drivers. The Poisson regression analysis determined that the e-scooter driver’s gender (p|0.05 < 0.199) and age (p|0.05 < 0.679) factors were not effective on the dependent variable. We analysed that the experience in the profession (tenure), the size of the area responsible, and environmental factors is effective in the e-scooter distribution activity. The number of packages delivered was 234 in a day, and the delivery cost per package was calculated as 0.51 TL (Turkish Lira) for the optimum values of the dependent variables. The findings show that the choice of e-scooter vehicle in the mail or package delivery process is beneficial in terms of time, cost, energy, and environmental contribution in districts with higher population density. As the most important result, the operation of e-scooter vehicles with electrical energy shows that it is environmentally friendly and has no CO2 emission. The fact that the distribution of packages or mail should now turn to micro-mobility is emerging with the advantages of e-scooter vehicles in the mail and package delivery. Finally, this analysis aims to provide a model for integrating e-scooters in package or mail delivery to local authorities, especially in densely populated areas.

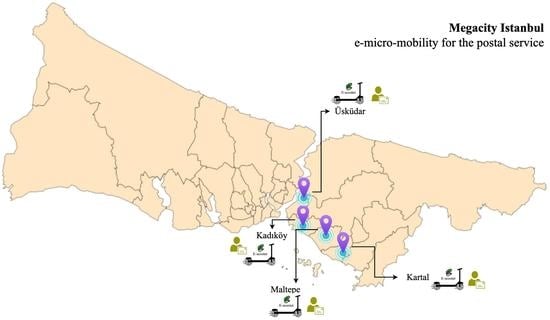
Graphical Abstract

1. Introduction

Micro-mobility seems to be a useful strategy for cities that want to reduce single-person vehicle journeys and improve multimodal amenities [1]. Since the micro-mobility revolution is still in its infancy, it is an important topic of discussion in the literature, especially with the mobility sector changing rapidly and moving away from trend vehicle ownership, causing uncertainty about how this sector will develop to arise [2,3].
Entrepreneurs and authorized institutions are constantly searching for package and postal transportation vehicles. In particular, traffic density, one of the big cities’ most significant problems, negatively affects package and mail delivery [4,5]. Significant congestion and dense urban structuring considerably impact distribution operations. To overcome such problems, although there are different opinions on the choice of distribution vehicles, enterprises and authorized institutions generally adopt scooter vehicles that are considered within the scope of micro-mobility and work with electric energy [6]. The advantages and disadvantages of e-scooters in various aspects, such as social, environmental, economic, and energy effects, have been studied in the literature [7,8]. This study deals with the energy, economy, and ecological factors of e-scooter vehicle preference in package and mail delivery activities.
The latest strategy for city authorities that allows users to gain temporary access to modes of transport “as needed” is the use of delivery of a vehicle, bike, car, or another mode [9]. Electric micro-mobility systems such as e-scooters are used independently and as a shared service to provide sustainable mobility solutions for city logistics, particularly for certain classes of package delivery, user characteristics, and journey distances [10]. In particular, given the growth of e-commerce and the proliferation of new options for package delivery, it helps spread new alternatives such as e-scooters and speed delivery operations (such as bulk shipping) [10]. Conventional vehicles constitute 8–18% of urban traffic flows, significantly affecting the traditional vehicles (combivan, pick-up, etc.) used in package and mail distribution in traffic jams. However, it has been determined that the current road capacity has been reduced by 30% with micro-mobility applications [11,12].
Many advantages of using vehicles within the scope of micro-mobility in postal and package service have been discussed in the literature [13,14]. The most important benefit is that it provides fast and timely delivery of packages or mail with micro-mobility vehicles [15]. In one study, a project funded under the Smart Energy Europe program referred to micro-mobility tools for the fastest response in terms of time [16]. Another study mentioned the advantage of using e-scooter rides by calculating the average travel distance and running time of e-scooter journeys of 1.24 km and 7.55 min., respectively. However, another study determined that the time savings of e-scooter journeys in congested areas close to the city centre are limited, depending on the average cluster speed of e-scooter vehicles [17]. This study emphasizes that the time required to complete package and postal service operations is advantageous with the e-scooter [18].
Another advantage of using the e-scooter, which is among the micro-mobility tools, is that it keeps the energy consumption at a minimum level and reduces the distribution cost [19]. Most vehicles used in package or mail distribution activities need fuel energy [20]. Today, fuel type is more costly than electrical energy [21]. Gebhardt et al. argue that e-scooters used for package and mail delivery operations have lower land use consumption and significantly better energy efficiency than other motor vehicles [22]. In another study, it was determined that the e-scooter is more advantageous in terms of energy savings as a result of the test of e-scooter and other vehicles to estimate the amount of energy consumption in an area with a 0-degree slope [23]. In this study, the energy efficiency of the e-scooter delivery vehicle used in package and mail distribution is discussed in detail, especially in terms of cost.
Many studies explaining the effects of vehicles used for transportation or logistics purposes in many ways, especially in terms of environmental health and energy consumption, have been analysed with different methods. The common aspect of these studies draws attention to CO2 emission, one of the environmental factors. A study aimed to overcome the many uncertainties and complexities in the mix of economy-energy-environment systems, random CO2 emission, and water consumption control policies by integrating multi-objective programming, fuzzy linear programming, and multiple scenarios [24]. Another study focused on the environmental cost of CO2 emissions, aiming to break the barrier of the CGE (the computable general equilibrium) model and provide researchers with a CGE model with available code and data [25]. As there is an important link between environmental factors and energy consumption, Miao et al. emphasized that CO2 emissions, SO₂ emissions, and atmospheric environmental inefficiency caused by primary energy use are the main causes [26]. Another study applied a multi-sector and multi-site dynamic recursive computable general equilibrium model to reduce coal consumption in order to reduce CO2 emissions to meet energy needs in the 2020–2030 period in China [27]. Using a multi-objective optimization model based on input–output analysis, Zhang et al. investigated China’s energy, water consumption, and CO2 emissions values, including the high resolution of the country’s electricity sector, in the period 2020–2030 [28]. Compared to studies dealing with the link between energy, cost, and environmental factors from different perspectives, this study also deals with the energy, cost, and environmental factors of e-scooter micro-mobility vehicle.
The environmental effects of e-scooter use are frequently discussed in the literature. At the beginning of environmental factors, the rate of CO2 emission has been tested by researchers with a wide range. One study highlights that approximately 5.8 kt of CO2 will be saved daily when e-scooter vehicles replace existing car trips [29]. Severengiz et al. investigated how using e-scooters for different purposes affect the crop greenhouse balance compared to alternative means of transportation by evaluating ecological factors [30]. Another study emphasizes that using e-scooters, among the smart mobility tools, will make urban life simpler, economical, and enjoyable with faster transportation, less congestion, and low CO2 emissions. The same study found that e-scooters emit almost 45% less CO2 than other vehicles, emphasizing that about 90% of people are exposed to air pollution [31]. According to the LCA results of personal e-scooter use, Moreau et al. calculated the environmental impact as approximately 67 g of CO2 emissions [32]. In another study, the authors highlight a net reduction in environmental effects when the e-scooter vehicle replaces the personal automobile vehicle, finding with Monte Carlo simulation models that 65% of the life-cycle greenhouse gas emissions associated with e-scooter use were higher than the modified set of transport models. In this study, the effects of e-scooters and other delivery vehicles on the environment were investigated by using e-scooter vehicles for package and mail distribution by government units [33].
With temporary delivery due to the increase in volume transported, operations involving a key logistics player often require electric-powered vehicles [34]. Scientific studies emphasized that tricycles or e-scooter vehicles provide significant advantages [35,36,37]. However, in using these vehicles, they must operate within the framework of some rules following the rules of the people and society [6]. In particular, in cities with crowded settlements, the authority departments need to exchange information with e-scooter companies to guide many driving rules and regulations, such as driving in the wrong direction, right of way, and speed [14]. In general, it can be said that adopting e-scooter vehicles in package and mail delivery significantly impacts the delivery system [36]. If generalization is made with the following important advantages in e-scooter preference, e-scooter vehicles:
  • are very suitable for providing transit first and last mile connections due to their low cost and high flexibility [38],
  • almost minimizing delivery time as long as a parking option is available [38],
  • have short charging cycles, which usually take place at night, and have the flexibility to recharge [39];
  • the range distance is 30–90 km,
  • easy supply of spare parts, such as additional provinces, so that distribution operation are not disrupted,
and offer many advantages. Another advantage of e-scooter vehicle preference is customer and rider satisfaction [14,40]. According to research conducted in northern European and North American countries over the last decade, user satisfaction with electric scooters and the service delivery process is high overall [41,42,43]. A study conducted in the Netherlands observed user satisfaction in the service delivery process. It was discovered that user happiness was associated with the length of actual waiting times [44]. Chinese customers seem to prefer e-scooters over public transport because of customers’ demand for more flexible, comfortable, and enjoyable (at a reasonable price) mobility [45]. This has led to an increase in the production of e-scooter vehicles that has contributed to customer satisfaction in recent years [46]. All these results mean that micro-mobility vehicles such as e-scooters will have more of a place in human life [47].
Scientific studies investigating the many advantages of using micro-mobility vehicles for different purposes in terms of environmental, cost, and energy have used different methods. Detailed information about the scientific studies in Table 1 is shared in order to reveal the difference between the Poisson optimization regression model method used in this study and other studies. The best statistical optimization model is the Poisson regression model method, especially for modelling situations that indicate the importance of the results of the objectives or output parameters in a subject [48]. In particular, we preferred methods for non-negative integer-valued variables that count information, such as specific counting data (such as the number of e-scooter vehicles and drivers) and the number of events occurring in a given time period (such as the number of packets delivered). Especially in a statistical or optimization model, if the values of the objective function or output parameter are positive and integer, the Poisson regression optimization model is preferred [49]. We contributed to obtaining numerical data of objective functions or output variables of micro-mobility vehicle applications (such as e-scooter, e-bike) with certain parameters with the statistical optimization model developed.
This study presents a case study of the advantages of using e-scooters vehicles in package and mail delivery services in Istanbul, Turkey. PTT provides package and mail distribution service with a total of 1915 vehicles throughout Istanbul megacity. Turkey postal service unit provides postal and package service, using approximately 1046 large vehicles (trucks, bus, van, combivans, minibus, etc.) and 655 motorbikes and other mobile vehicles. The use of e-scooters is used in four districts of Istanbul with a dense population. Around 161 e-scooters are allocated in these districts for postal and package services. The ratio of e-scooters to other vehicles is approximately 8.41% [59].
In this study, many independent parameters are considered to measure the effects of e-scooter vehicle choice in terms of environmental, economy (cost), and energy. These parameters are defined as the e-scooter driver’s gender, age, professional experience, area of responsibility, and environmental factors. This study consists of five different sections. The literature review about the advantages and disadvantages of using e-scooter within the scope of micro-mobility is discussed in the introduction part of the study. The methodology developed for the study is discussed in the second section. The numerical results of the study are shared in the third section. Discussion of significant findings is debated in the fourth part of the study. The conclusion of the study is mentioned in the last part of the study.

2. Materials and Methods

This study aims to calculate the optimum values of the objective functions by developing optimization Poisson regression models using the data of the e-scooter application for package and mail distribution in four different regions of Istanbul with the highest population density. This part of the study consists of three main parts: data preparation, statistical analysis, and development of optimization models.

2.1. Data

PTT (International Logistics Services), which has been using the bicycle for years (one of the micro-mobility vehicles, which is an environmentally friendly and more efficient alternative in urban use), has started to use the e-scooter in urban distribution/delivery operations as of July 2021. Kadıköy, Üsküdar, Kartal, and Maltepe Postal Distribution Directorates affiliated with PTT Istanbul Regional Directorate were selected as pilots for the e-scooter, which is more suitable for the distribution of registered-unregistered mail and cargo-courier shipments under 2 kg/decis. The total population of these regions is approximately 2.02 million, constituting 12.73% of Istanbul’s population as of 2021. The population density of these districts is 10,728 people per km squared. The pilot chosen areas for mail delivery with the e-scooter are illustrated in Figure 1.
One hundred e-scooters accompany one hundred drivers (each scooter belongs to only one driver, e-scooter vehicles are not shared between drivers) working in plot areas. The relationship between the age and occupational experience of 100 drivers employed in packages and mail delivery based on the delivery time by e-scooter is shown in Figure 2.
The technical specifications of the preferred e-scooter ranges for the distribution process are shared in Figure 3.
A total of 3000 data points were used, taking into account the 30-day working time of each driver. The average daily distribution numbers of 100 riders with the e-scooter are shown in Figure A1 in Appendix A Section. During the period in which the data were taken into account, a total of 351.180 distributions were made using e-scooters. The maximum distribution amount was computed as 8454, and the minimum distribution amount was calculated as 915. The monthly average distribution amount of these drivers was computed as 3511.8 packages.
For this study, the economic, energy, and environmental factors of both the e-scooter and other vehicles are utilized to compare the e-scooter distribution vehicle with other distribution vehicles. The monthly rental price of the vehicles, the energy (fuel and electric) used, the distribution flow, CO2 emission rates, and distance information are discussed in this study. The vehicles used in package distribution are given the combivan vehicle with a volume of 4 m3, and the motorcycle and e-scooter vehicles were used in the distribution at the PTT. Although many factors affect the performance of drivers in distribution planning with e-scooters, seven different parameters are considered in this research. Qualitative information about each parameter, such as variable type, units, status of variables, notation, and descriptive expressions, is shared in Table 2.
The driver’s age, gender, and experience (tenure) factors, which are among the decision variables of the study and affect the number of packages distributed daily and monthly, are only for drivers using e-scooters. In addition, the amount of CO2 emission, an environmental factor that is thought to affect the amount of distribution, was also included in this study. The area for which each driver is responsible is taken into account in km2. Descriptive statistics of the data used for the decision variables are discussed in Table 3. Descriptive statistics data such as sample size, mean, standard deviation, first and third quartiles, variance, kurtosis, and skewness were analyzed for the data set of this study.
Two methods, Poisson regression and response-optimization mathematical models, were used for the methodology of the study. Minitab-18 computer software, including statistical and optimization tools, was used to organize and analyze the raw data of the study [60]. There are theoretical explanations of the methods in the continuation of this section.

2.2. Statistical Analysis

The Poisson regression model, developed by Consul and Famoye (1992) and Famoye (1993), was used to model data for factors affected by a set of response variables [61]. The Poisson distribution regression model includes a series of statistical analyses for multiple-affected response variables and co-influencing variables in under- or over-dispersed count data. Generally, models are developed using maximum likelihood and moment methods in Poisson distribution regression analysis [62,63]. Poisson regression is one of the most preferred methods of analysis for modeling response variables with integer properties [64]. Poisson regression analysis was preferred because the data of the decision variables were integer in this study [65]. The vehicles (e-scooters) were used to make the distribution, and the number of packages and the drivers (human factor) who perform the distribution process represent the whole number. The Poisson regression model is formulated with the given by f μ i ,   α ,   y i [61]:
f μ i ,   α ,   y i = μ i 1 + α μ i y i 1 + α y i y i 1 1 + α μ i exp μ i 1 + α y i 1 + α μ i  
where y i donates the response or dependent variable of the regression model with i = 1 ,   2 ,   ,   n . Independent or decision variables are defined as x i and the mean and variance of the Poisson distribution are the same as:
E y i = V a r y i = μ i  
where the expected mean and variance value is defined as E y i and V a r y i , respectively.
μ i = μ i x i  
then;
μ i x i = exp x i j β j ,   j = 1 ,   2 ,   ,   k  
where β j represents the coefficient of independent variables of the regression equation [66]. In order to calculate the maximum likelihood estimator in the Poisson regression model, the response variable y i must be in the form of non-negative integers (or count data). In this study, since the response variables are integers, the maximum likelihood function is given as follows [67]:
y i = exp μ i μ i y i y i  
s.t.
μ i > 0
where the likelihood function ( l β j ) of the Poisson regression model is created as [67]:
l β j = i = 1 n exp ( μ i μ i y i y i !  
then;
l β j = i = 1 n μ i y i exp ( i = 1 n μ i ) i = 1 n y i !  
Approximate tests are considered for testing the adequacy of a Poisson distribution regression model. We adopted e-scooter delivery data to evaluate and analyze the performance of the response variables and other decision variables (independent factors) proposed in this study. In addition, as a result of Poisson regression statistical analysis, the optimum values of the response functions and the decision variables were calculated using the restrictive data belonging to the decision variables.

2.3. Optimization Models

Optimization (mathematical) modeling is generally defined as expressing real-life problems with equations. Optimization models consist of four different steps: determination of decision variables, the definition of objective functions, creation of limits of decision variables, and regulation of sign directions of decision variables. Independent factors (or decision variables) are based on Poisson distribution regression analysis and optimization models. The objective function equation of an optimization model given the decision variable as x i j is formed as follows [68]:
objective o f = i = 1 n j = 1 m c i x i j
where c i represents the coefficient of the decision variables with i = 1 ,   2 ,   ,   n . There are two versions of x, maximum and minimum. This version is preferred according to the purpose of the problem. Generally, the minimum preference is for the cost or time, while the maximum preference is for high-value purposes such as annual income or production amount [69]. Each optimization model has a limit of decision variables. These limits are defined as constraints in optimization models. In an optimization model, constraint equations are usually created as follows [70]:
i = 1 n j = 1 m a i x i j = v l , l = 1 ,   2 ,   ,   L  
where a i signifies the coefficient of the decision variables in the equations of the constraints. The values of the constraints’ limit are denoted by v l . The mixed-integer optimization model is created because some of the decision variables in the optimization models of this study are integers and others are natural numbers. The mixed-integer optimization model is constituted as [71]:
objective o     f = x t Q x + q t x
s.t.
A x = v   linear   contsraints l x u   bound   contsraints x t Q i x + q i t x b i   quadratic   contsraints Some   or   all   of   x   values   must   be   integer  
The objective function of the optimization model of this study constitutes the equation obtained from the Poisson distribution regression model. Decision variables were defined as independent variables affecting the response factor. The mixed integer optimization model then turns out to be as follows [72]:
objective maximize Equation   11
s.t.
l x i   lower   bound   contsraints x i u   upper   bound   contsraints 0 x i ,   and   integer  
where, x i = x a g e ,   x g e n d e r ,   x t e n u r e ,   x a r e a ,   x C O 2 . The MILP problem presented in this article is essentially an optimization problem, where the aim is to maximize the number of distributed packages by taking into account the effect of independent variables and which provides a set of feasible solutions belonging to the solution set within the limits of the decision variables of the system to be optimized. The desirability functions measure the degree of importance of the feasible values of the optimization model. For all feasible output values of the objective functions determined by the desirability equations, we ensure that the values suitable for the design factors are found simultaneously so that the optimization model reaches an optimal solution [73]. Desirability values ( d i ) are calculated according to the following formulation [74]:
  • for maximization problems:
d i y i x = 0 y i x l i u i l i r 1 1 if   y i x < l i                 if   l i y i x u i if   y i x u i  
  • for minimization problems:
d i y i x = 1 u i y i x u i l i r 2 0 if   y i x < l i                     if   l i y i x u i if   y i x u i  
  • for target values of the objective functions:
d i y i x = 0 y i x l i u i l i r 1 u i y i x u i l i r 2 if   y i x < l i                       if   l i y i x T i if   y i x = T i   if   T i y i x u i if   y i x u i  
where l i and l i are the upper and lower limit values of the desired response equation. The parameters of r 1 and r 1   express the importance of the response equations being close to the desired value [75]. We propose the limits of the independent variables for the plot regions, where the e-scooter application is planned with the Poisson distribution regression and optimization models we have developed.

3. Results

The numerical results of the study are discussed in this section. The statistical analyses and optimization results of the e-scooter data used for package and mail delivery were examined using the optimization Poisson regression distribution developed for the study. In addition, the numerical results were compared between the e-scooter vehicle and other distribution vehicles in terms of economic, environmental, and cost.

3.1. Statistical Results of Poisson Distribution Regression Analysis

Statistical data of the Poisson distribution regression analysis are given in Table 4. In the Poisson distribution regression analysis, data belonging to two dependent and five independent variables were used for statistical results. The regression analysis results for the dependent variable show that the independent factors have a significant effect with a p-value < 0.05. As a result of the statistical analysis, it has been determined that the amount of CO2 emission from the five independent variables, the driver’s experience in the profession (tenure), and the size of the area that the driver is responsible for distribution affect the number of packages distributed. The significance levels of x c o 2 , x t e n u r e , and x a r e a factors were calculated as 0.022, 0.001, and 0.001, respectively. The driver’s experience in the profession (tenure) and the size of the area affect the cost of the packages distributed. The significance levels of x t e n u r e , and x a r e a factors were calculated as 0.0001, and 0.000, respectively. The effects of driver gender and age on dependent variables are limited based on the significance levels of the Poisson distribution.
Goodness-of-fit tests were used to determine whether the dataset used deviated in a way that the Poisson distribution did not predict. The model’s data fit was assessed using the Pearson compatibility and Deviance tests. In these results, both goodness of fit tests had p values lower than the usual significance level of 0.05. Sufficient evidence has emerged to conclude that the number of predicted events does not deviate from the number of events observed. In addition, in terms of the accuracy and validity of the results of the Poisson distribution regression statistical analysis, the R-Squared (R-sq) and adjusted R-sq values for the packages delivered, which is a measure of goodness of fit for the model, were calculated as 90.24% and 90.21%, respectively. For the cost of the packages delivered, the value of the R-sq is computed as 90.24% and 90.19%, respectively.

3.2. Comparison of the Economy, Energy, and Environmental Dimensions of the E-Scooter Model with Other Vehicles Used in the Package Distribution

In this section, we have analyzed the numerical results in terms of economic, energy, and environmental aspects so as to reveal the difference between the distribution provided by the e-scooter and the distribution operations performed with other vehicles. This section consists of three different subsections.

3.2.1. Cost Analyses

In package or mail distribution, main expenses such as personnel, insurance, energy, car rental, and packaging are included in the general costs. In this study, it is understood that many advantages are obtained regarding cost with the e-scooter application in package distribution. As a result of distribution made by e-scooters and other vehicles, there are some differences between energy and package distribution costs (for example, distribution of more packages with the same personnel wage) apart from the common expenses. Table 5 includes the costs depending on the number of packages distributed with e-scooters and other vehicles. The cost information in this table represents the total cost of a package to the administration.
We calculated that the delivery cost of a package with an e-scooter is 16 times more advantageous than a combivan and three times more than a motorcycle. Considering the daily distribution amounts, it was determined that the cost of distribution with the e-scooter decreased by 96.49% compared to the motorcycle and 99.51% compared to the combivan. Similarly, it was calculated that the cost of package distribution with a motorcycle decreased by 86.13% compared to a combivan. The hourly distribution amounts determined that the cost of distribution with the e-scooter decreased by 65.27% compared to the motorcycle and 95.18% compared to the combivan. Similarly, it was calculated that the cost of package distribution with a motorcycle decreased by 86.13% compared to a combivan. Depending on the package distribution quantity, the distribution costs of the package distribution vehicles are shown in Figure 4. The e-scooter’s total distribution cost is minimal compared to other vehicles.

3.2.2. Energy Analyses

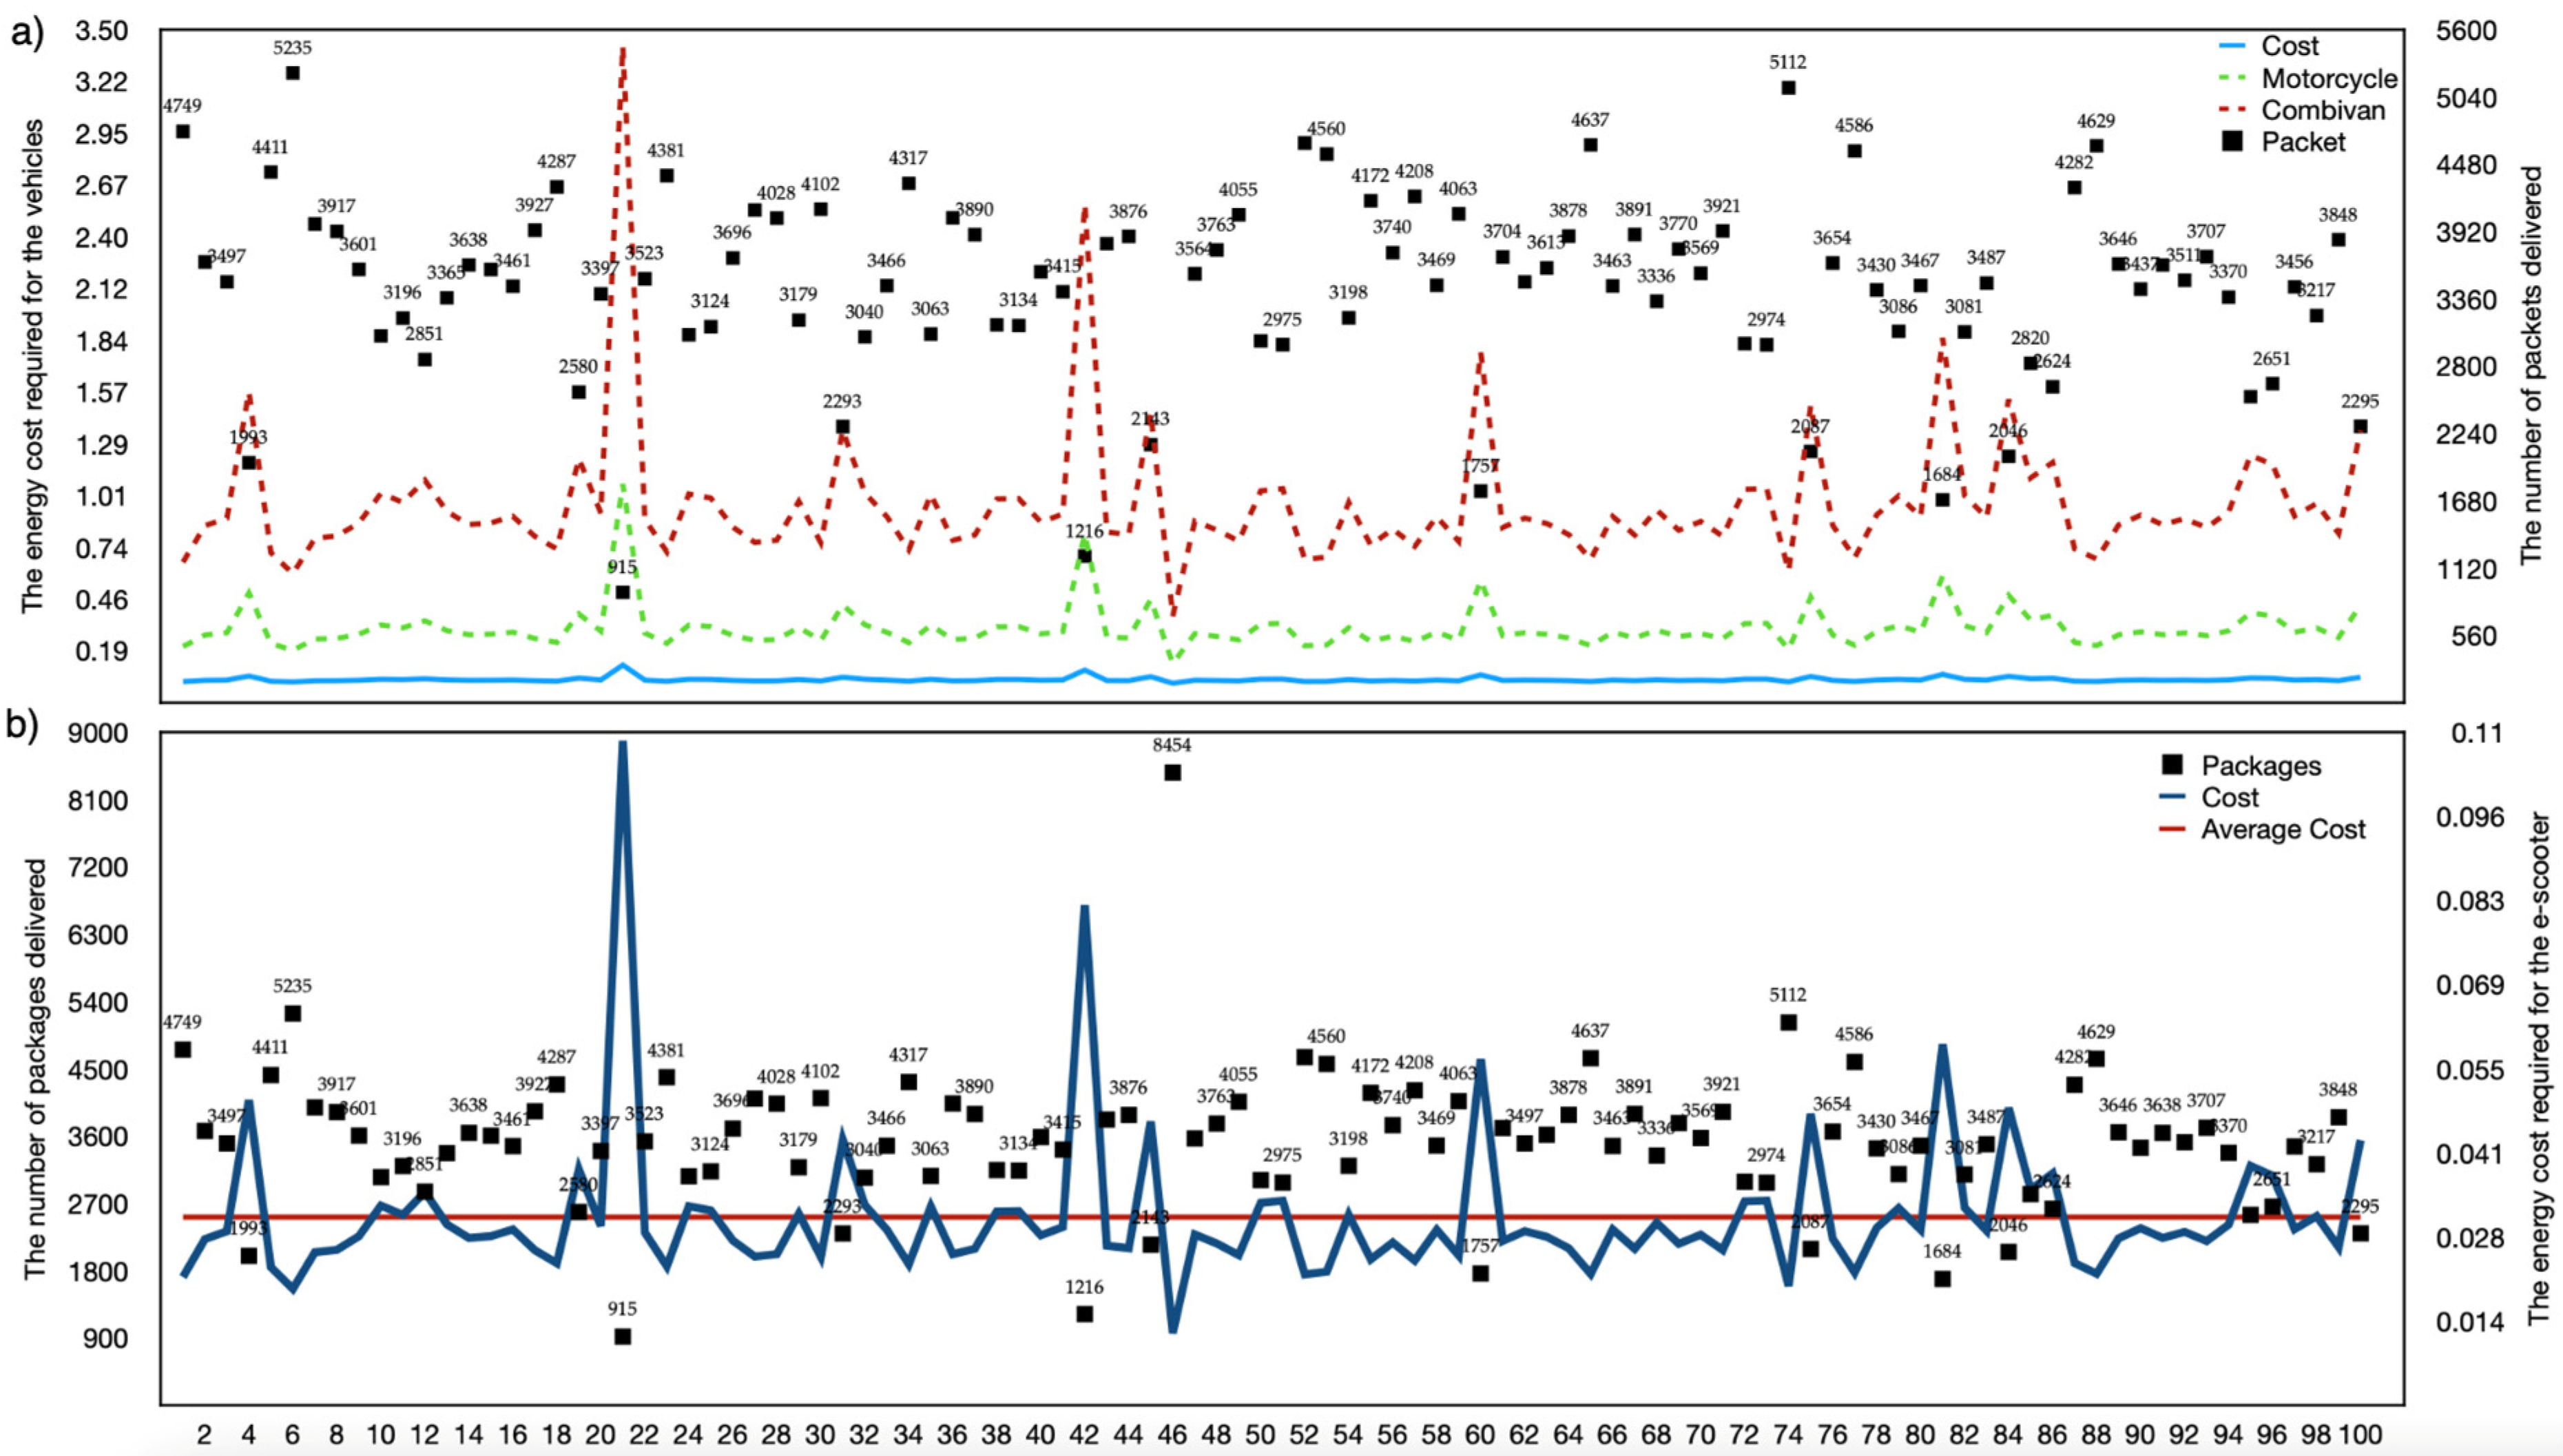
The type of energy required for the e-scooter is electrical energy. The fuel type meets the energy supply of other vehicles. For daily use, e-scooter batteries are made ready before working hours. An extra full battery is allocated to drivers in case of an unexpected situation during working hours. The difference between the amount of energy consumption of the e-scooter and other distribution vehicles is shown in Table 6.
Regarding energy, the advantage of using e-scooters in mail or package delivery is very high compared to other vehicles. While the use of a motorcycle is 64.74% advantageous compared to the combivan vehicle, it has an 88.52% disadvantage compared to the e-scooter. Similarly, it has been calculated that the use of combivan has a 64.74% disadvantage compared to the motorcycle vehicle and 95.95% compared to the e-scooter. The amount of energy consumption required for the e-scooter is less than other vehicles. For the use of e-scoter, energy consumption is ten times less than the amount of energy required for a motorcycle and almost 30 times less than the amount of energy required for a combivan. According to the number of packages distributed in a month, the amount of energy required varies according to the vehicles. The energy change rates based on the number of packages delivered are shown in Figure 5.

3.2.3. Environmental Analyses

The amount of CO2 emissions, which is one of the environmental factors that affects the amount of package distribution, varies considerably between distribution vehicles. The operation of e-scooter vehicles with electrical energy is environmentally friendly and the amount of CO2 emissions is very low. E-scooter use does not cause direct CO2 emission. However, this study did not consider CO2 emissions indirectly caused by e-scooter vehicles (e.g., battery charging, during the manufacturing process, transportation of e-scooter vehicles to users, etc.). The use of motorcycles and combivan vehicles in package distribution activities for many years has led to negative results in terms of environmental health.
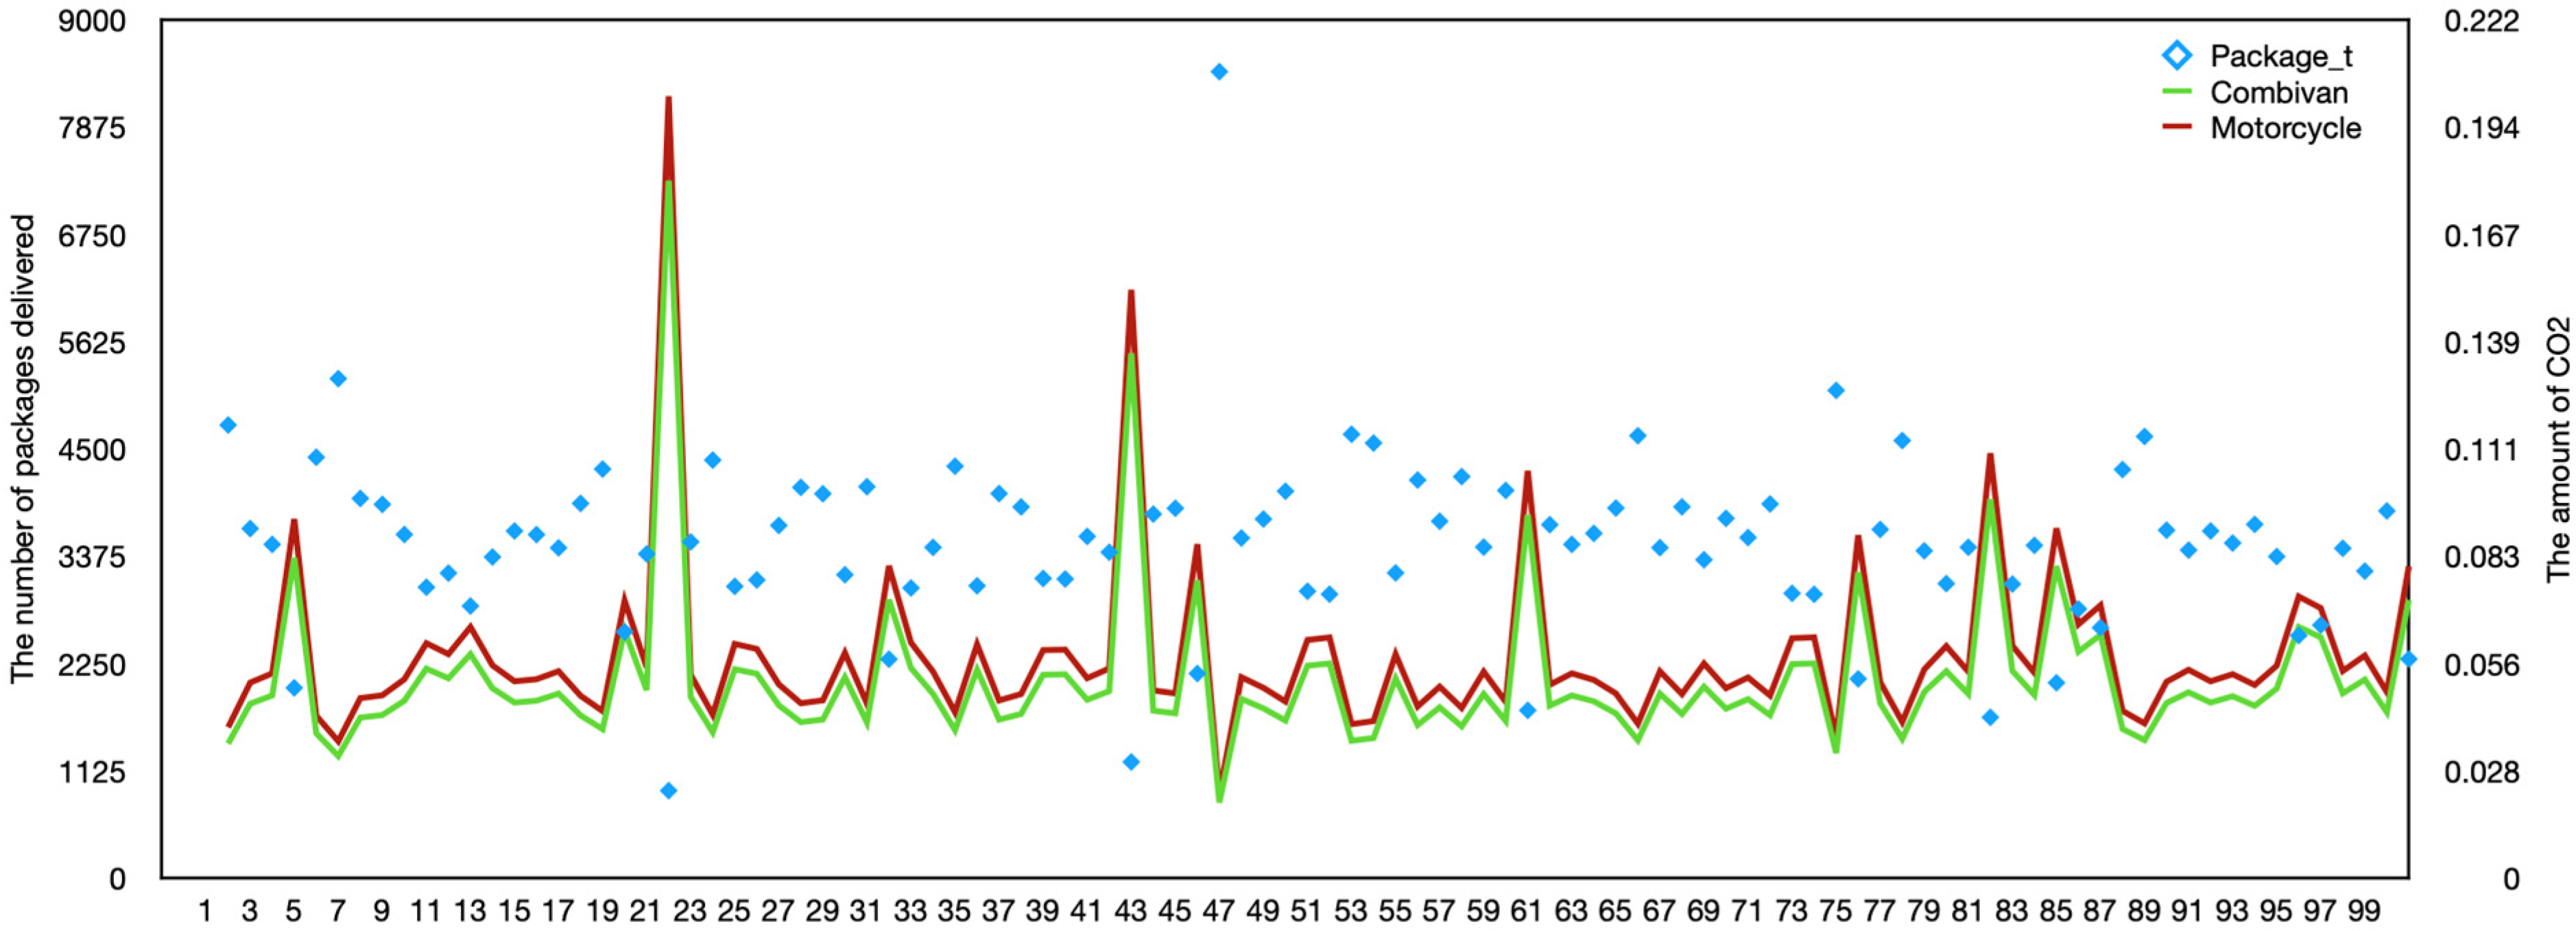
The CO2 emission amounts of the motorcycle and combivan distribution vehicles are compared to the e-scooter distribution vehicle since the emission amount of the e-scooter distribution vehicle is low (Parameters that indirectly cause CO2 emissions from using the e-scooter vehicle were not considered, so the value of 0 was used in this study to reference the values of other vehicles). In the case of distribution by motorcycle, it has been calculated that the amount of CO2 emission has a 190% disadvantage compared to the e-scooter delivery vehicle and an advantage of 13.15% compared to the combivan vehicle. We have determined that Combivan preference for distribution activities is 200% and 15.15% disadvantageous compared to e-scooter and motorcycle distribution vehicles, respectively. Figure 6 includes the CO2 emission amounts of the motorcycle and combivan distribution vehicles, excluding the e-scooter distribution vehicle, according to the number of packages distributed.

3.3. Results of the Optimization Models

Using mixed integer optimization models developed for this study, optimum values were obtained for objective functions and decision variables. Although these optimization models have the same constraints and decision variables, they have turned into a multi-objective optimization model type because they contain more than one objective function. Therefore, the optimum values obtained were also considered feasible values, as multi-objective optimization models also work like nonlinear optimization models. Generally, the results obtained in nonlinear optimization models are not optimum but feasible values.
Keeping the independent variables influencing the dependent variable at optimized values estimated by the desirability function approach allows one tfurther explore the effect of independent variables on individual output responses and overall desirability. In this study, Equations (14) and (15) were revised, and the following equation was used to obtain the desirability data obtained since two different objective functions were solved with the constraints consisting of five common independent variables:
2 Equation   14 ,   2 Equation   15
With the e-scooter tool, the best 14 results (the feasible results after 14 iterations are the same) were obtained by running non-linear and mixed integer optimization models for the transportation of large numbers of packages in the package distribution service with minimum cost. These results are included in the solution set of the optimization model. The feasible results of the optimization models are depicted in Figure 7.
The optimum levels for a driver to deliver in a maximum time in a month, age, gender, experience in the profession, and area of responsibility were calculated as 22.63, F, 24.8 (maximum), and 0.113 km2 (113,000 m2), respectively. Depending on the decision variables and objective functions, the optimum values of the age, gender, experience, and area size of a driver performing the distribution process in terms of the average values of the best 20 feasible results were calculated as 38.98, M/F, 14.91 years, and 0.953 km2, respectively. In the best 20 results of the optimization models, there were equal numbers of male and female drivers. The optimum values of the average number of packages distributed monthly and the monthly distribution cost, which are the objective functions, were calculated as 4685 and 2389 TL, respectively. The cost of distribution of a package to the administration was calculated as 0.509 TL based on the optimum results. We have determined that the effect of driver gender in the distribution process is low (unless physical characteristics are taken into account), and it is not essential in terms of distribution amount and cost.

4. Discussion

The Poisson distribution regression and optimization technique discussed in this paper is only applied to analyze the economic, energy, and environmental aspects of an e-scooter package delivery application in Turkey. The concept of micro-mobility has revealed that 40% of vehicle journeys worldwide are made at distances below 5 km, and only 5–10% of the fuel consumed in these vehicles is used to transport passengers. Micro-mobility has become an ideal system for journeys with vehicles traveling at a maximum speed of 20–25 km/h for distances up to 5–10 km. Considering that 70% of the world’s population will live in cities and the use of individual vehicles will increase in 2050, the importance of micro-mobility will gradually increase in solving the problems caused by the number and density of vehicles.
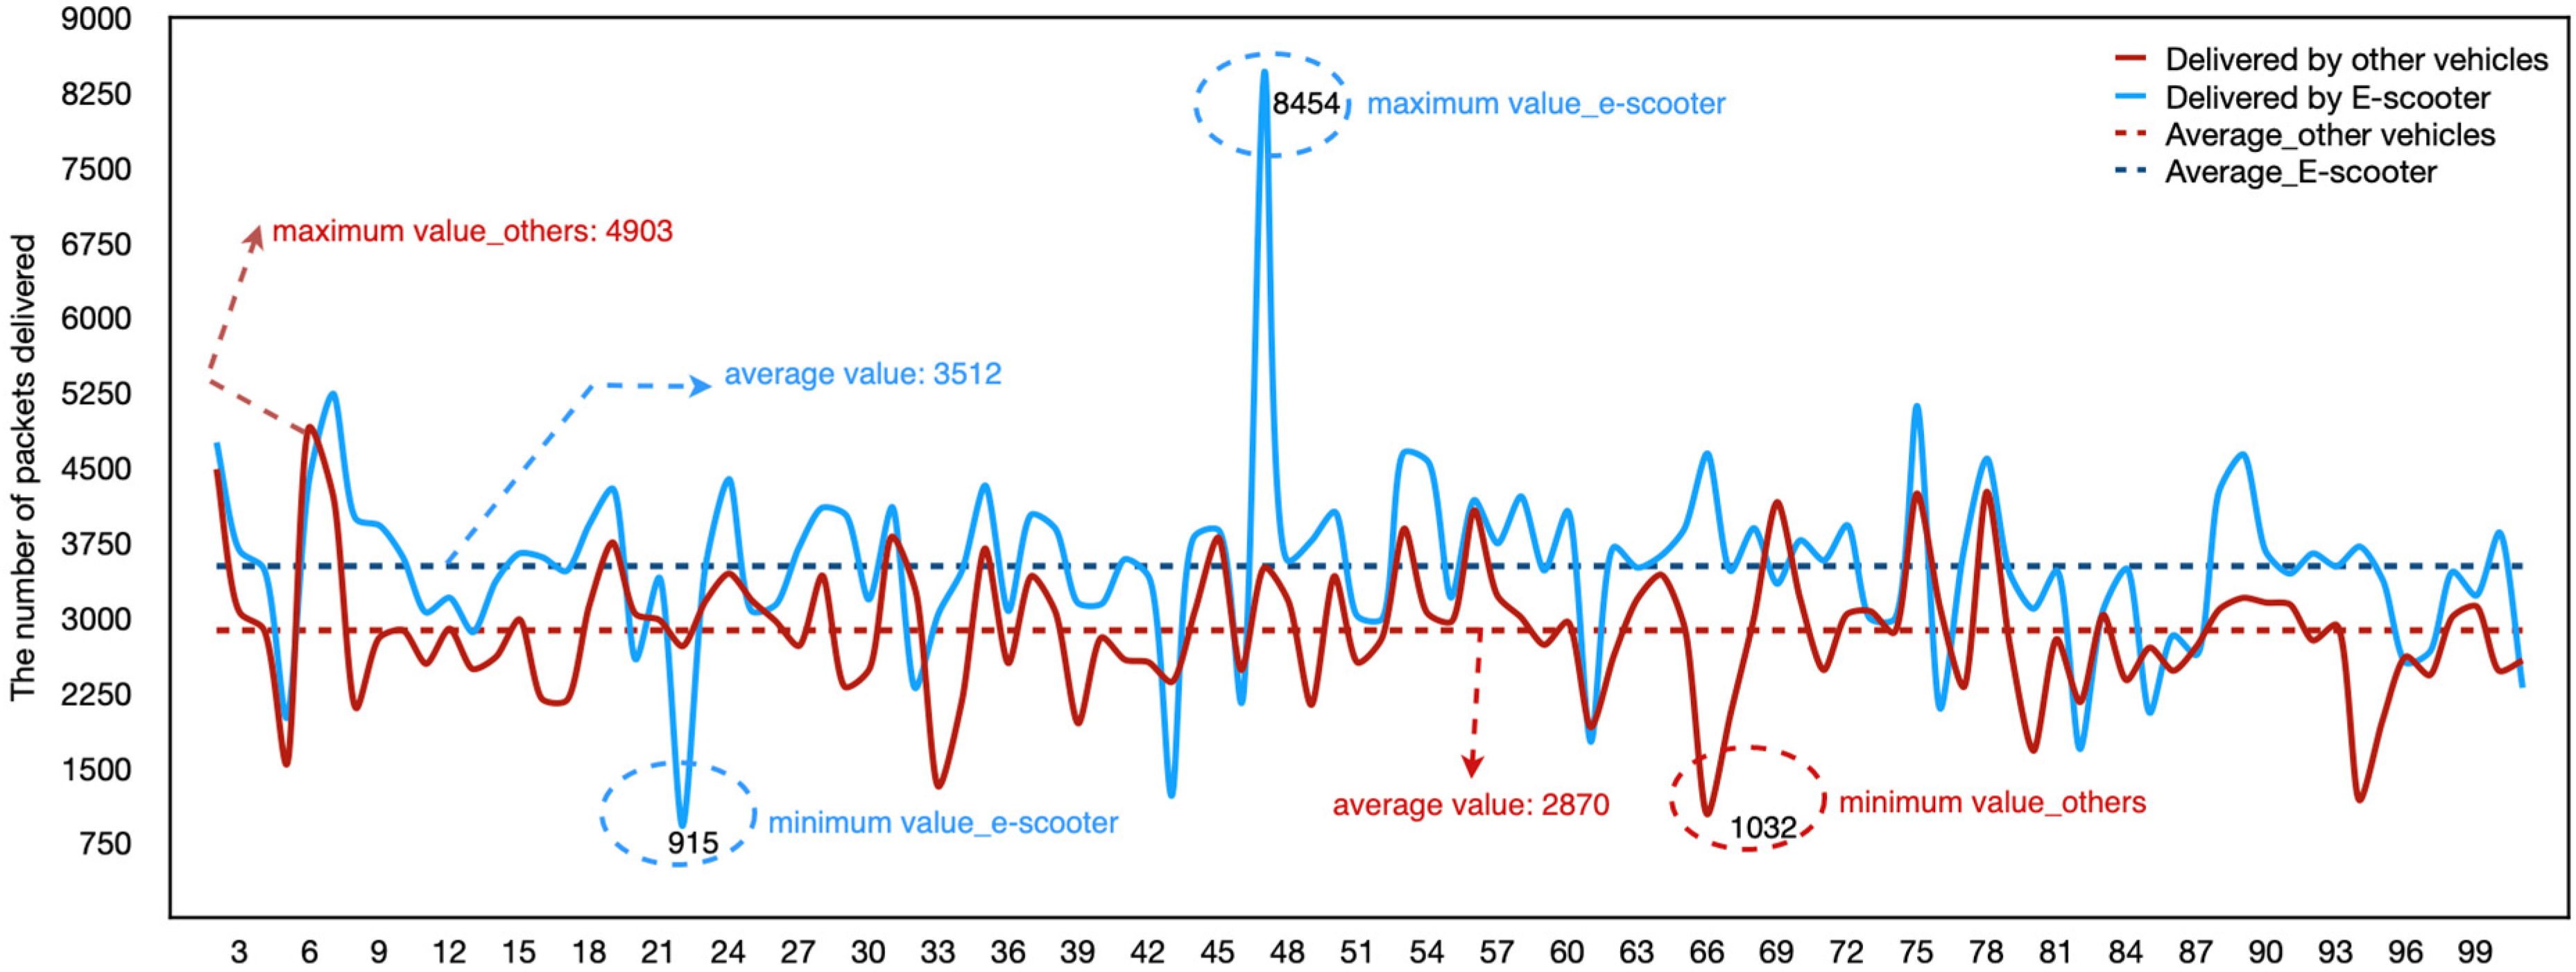
The period in which the amount of distribution made by e-scooters is discussed and the amount of distribution made with other vehicles (including pedestrian distribution personnel) in the same period of the previous year are discussed. Data for both distribution types (e-scooter and other vehicles) are shown in Figure 8. In the same period, a total of 286,953 distributions were made with other vehicles and pedestrians. In comparison, a total of 351,180 distributions were made after using e-scooters, increasing the delivery performance by 22%. It should not be forgotten that with the pilot application started in Istanbul, the e-scooter not only increased the speed and distance traveled (~2x) during the day but also increased the comfort it provided to the pedestrian distribution personnel, who took thousands of steps.
Therefore, as PTT, we can say that we see e-scooter as an important alternative not only for pedestrian distribution but also for motorcycle and vehicle distribution. As a matter of fact, PTT plans to increase the number of e-scooters, which was 100 in July 2021, to 500 as of July 2022, upon high demand from the personnel. Among the results of this study, it is clearly seen that the e-scooter, which is an environmentally friendly vehicle with zero carbon emissions, is three times more efficient than motorcycle distribution and 16 times more efficient than vehicle distribution in terms of unit cost. In addition to the economic, energy, and environmental advantages of package and mail distribution, the e-scooter also provides the benefit of timely and fast distribution of packages or mail. We observed the advantage in the time factor by comparing two different years of a one-month period in which the data were taken into account. The average delivery time of a package or mail was established based on the following formulation:
p = 1 / i = 1 n n i / m = 1 m t m d = 1 d t d
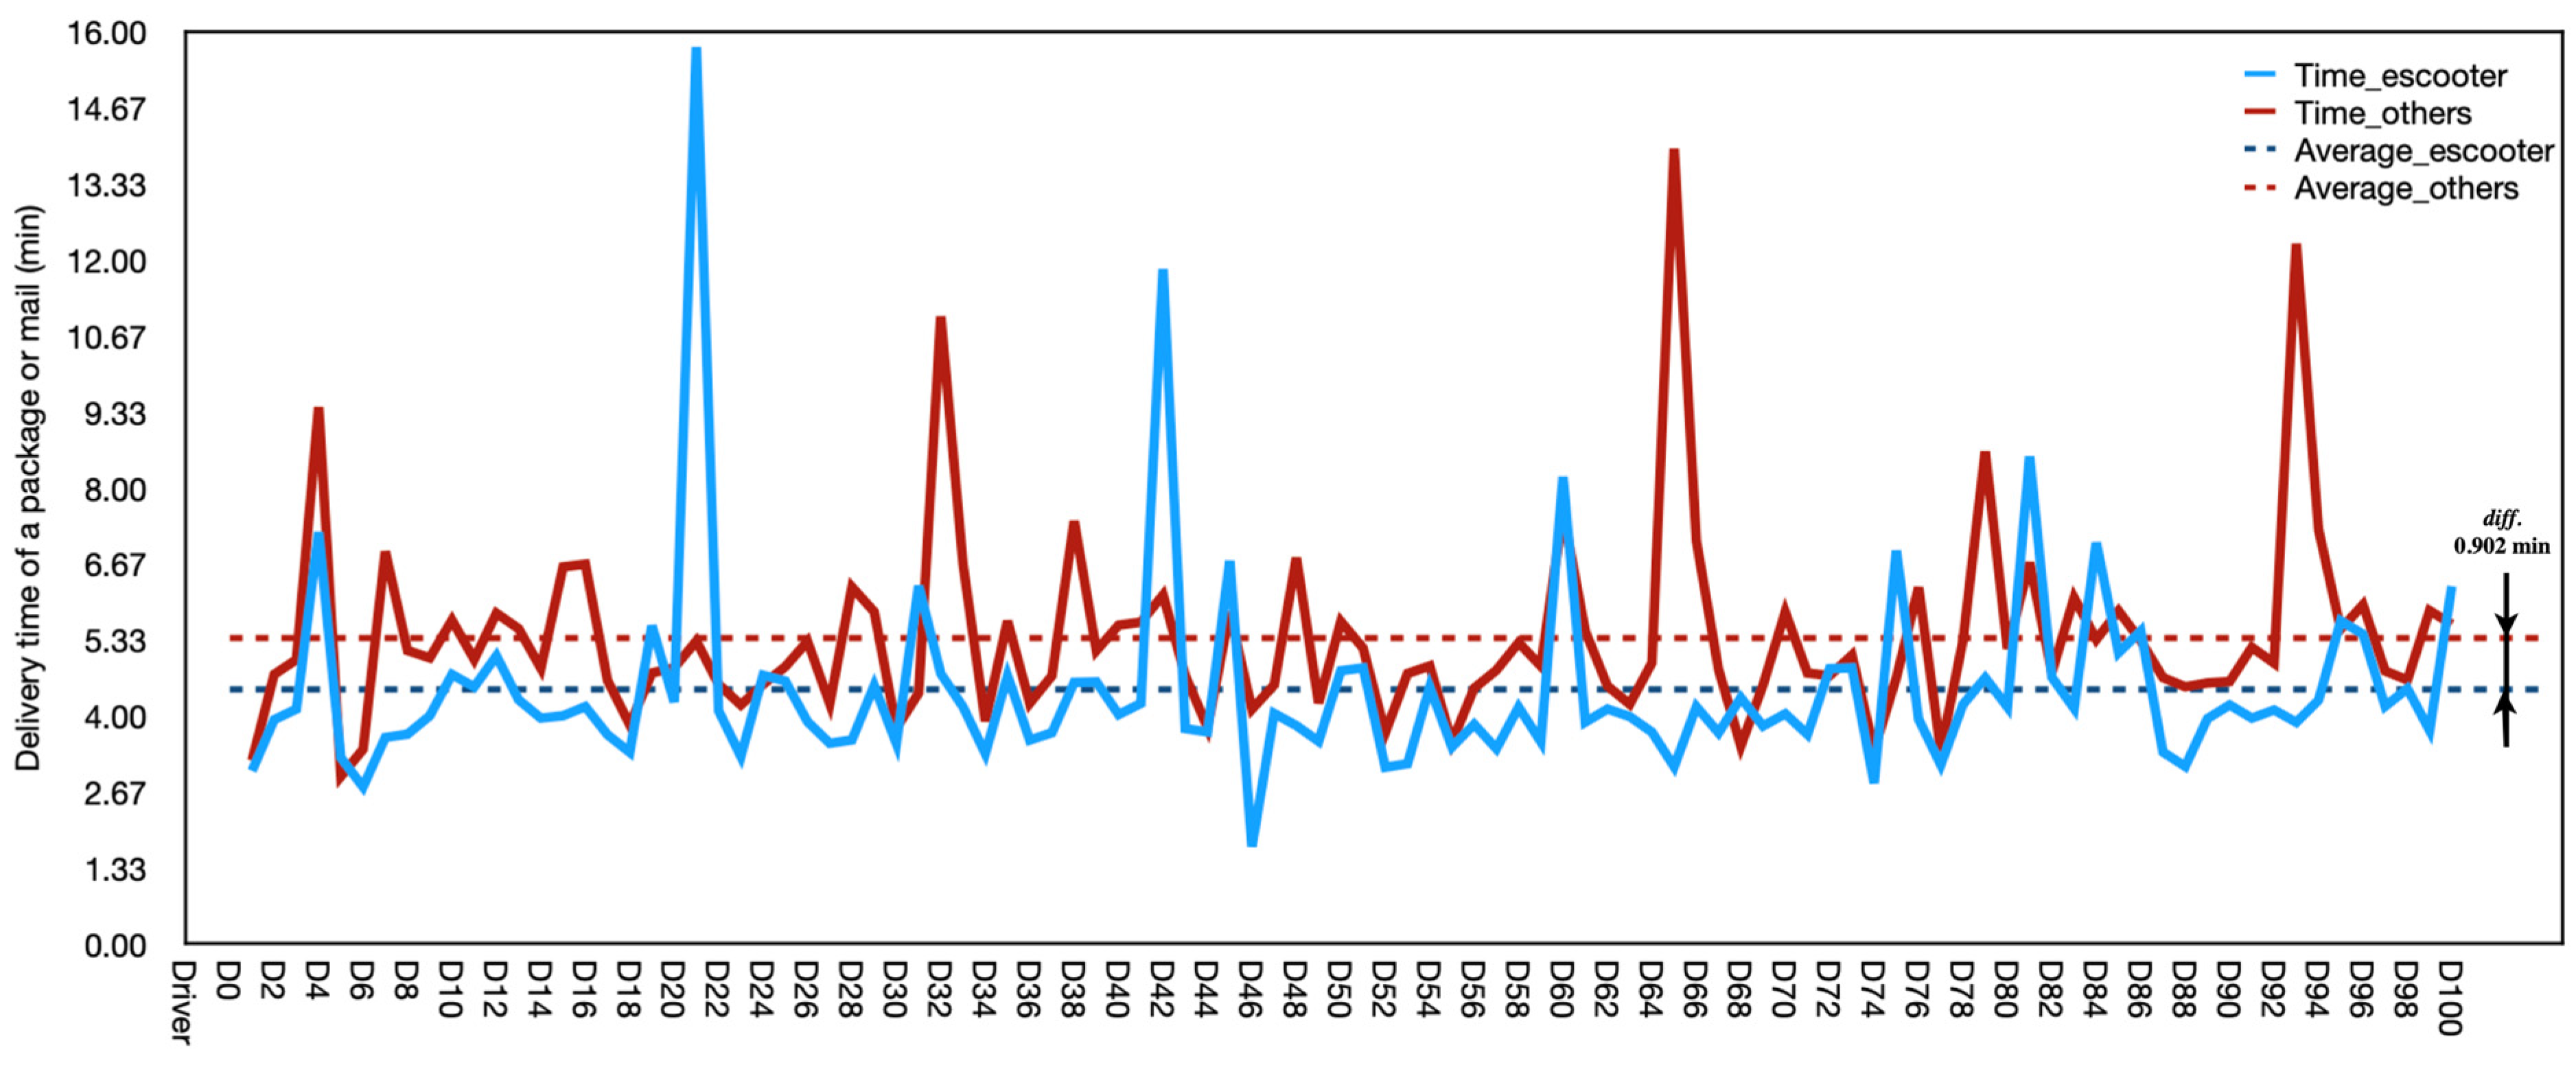
where the number of packages is symbolized by p and p = 1 is considered in this research. n i represents the number of packages delivered in a day. t m signifies the days of working in a month. t d denotes the daily working hours of an employee performing the distribution process. Average delivery times of a packet or mail in terms of data for two periods are shown in Figure 9.
Package or mail delivery times vary according to the distribution personnel due to factors such as gender, age, professional experience, and the extent of the responsible area. However, as a result of comparing the processing times of the same driver with different vehicles, it is understood that the e-scooter performs the distribution process in a faster time. While the average delivery time of a package or mail delivery is 4.462 min with the e-scooter of the driver who performs face distribution, the average delivery time is 5.364 min with the same driver with other vehicles. The delivery time of a package or mail is calculated to be shortened by approximately 0.902 min in terms of the means used for distribution. This period provides many benefits to the administration in terms of time, cost, and energy, as it is calculated for the distribution of numerous packages or mail. The use of other vehicles (especially combivan) in package or mail distribution, the physical structures of distribution locations such as road conditions, and parking problems are among the factors. However, considering that such problems are minimal with the e-scooter, the e-scooter makes a significant contribution to the delivery time of the package. Distance measures according to the type of vehicle used for a package are calculated as 0.61, 0.56, and 0.16 km for e-scooter, motorcycle, and combivan, respectively. We conclude that the most advantageous distribution vehicle is the e-scooter, as these vehicles differ in distance according to traffic, road, and building configurations.
This study has some limitations. While considering only the amount of CO2 emissions that cause air pollution, some factors such as temperature, humidity, pressure, and wind speed are not considered. Another gap in the research’s scope is that the physical (negative consequences of factors such as weight and height in driving) and psychological factors of the drivers who carry out the distribution business were not taken into account. It is requested by the administration to carry out the distribution operations upon the instruction given to the drivers. The physical structures of the region, such as road conditions, building configuration types, and parking problems in the plot areas considered in the e-scooter application, are not included in the study.

5. Conclusions

The postal or package delivery process is seeking faster, safer, and less costly options. Traditional distribution tools are lacking in meeting the necessary needs in today’s world. Today, in addition to conventional vehicles, the e-scooter preference, which is increasingly used in the postal service, provides significant advantages. Official institutions/organizations that prefer e-scooter vehicles for package and mail distribution support them, with the results of scientific studies showing that they have obtained many important benefits in terms of economy, environment, and energy. In particular, a significant reduction is achieved in CO2 emissions. In a project funded by Intelligent Energy Europe (IEE), researchers concluded that using electric micro-mobility vehicles in urban transport has a positive effect on reducing CO2 emissions and saving energy [36]. Ruesch et al. emphasized that using e-scooters is economically cheaper than other delivery vehicles to increase mail or mail delivery efficiency [76]. A report by the Swiss Federal Energy Office (SFOE) concluded that using e-scooters contributes to low energy consumption and CO2 emissions [77]. In general, many positive benefits are obtained by choosing e-scooters for package or mail delivery, and e-scooter vehicles are evaluated in many ways compared to traditional delivery vehicles with actual data in this study.
The e-scooter application has been started in four important districts of Istanbul, Turkey’s most cosmopolitan city. This study offers the opportunity to compare and analyze the data of the results of the e-scooter application with the data of traditional transportation vehicles. This study calculated optimum results by examining the factors affecting e-scooter transportation using the optimization Poisson regression model. In particular, the values or types of factors that are effective for the e-scooter driver to deliver the maximum number of packages or mail in the shortest time have been determined. The delivery time with the e-scooter was calculated to be 16.81% faster than the delivery time with conventional vehicles. In addition, the number of packages delivered on time, as the number of deliveries made with e-scooters increased by 58.53% compared to traditional vehicles.
This study includes three primary parameters: energy, cost, and environmental effects of e-scooter use, provided that it is a short distance for logistics purposes. Using these parameters, we concluded that e-scooters are more advantageous than other delivery vehicles in terms of time and product (number of packages). This study’s findings show that the average journey distance and travel time using the e-scooter is in the range of 0.113–1.98 km and 3.06 min [78]. An exemplary study of global findings showed that the average journey distance and travel time using an e-scooter was between 1.56 km and 10 min. However, in many studies, it has been noted that e-bikes, which are among the micro-mobility vehicles, cover a distance of 3.5 km in approximately 17.5 min [79]. The method we have developed shows that e-scooter vehicles, especially in courier services such as mail or package delivery, offer significant advantages to administrators compared to other studies. Therefore, the benefits of using micro-mobility vehicles such as e-scooters instead of traditional vehicles used in short-distance transportation contain great potential. This research presents the advantages of using e-scooters in urban package or mail delivery operations and offers models for future applications, making a significant contribution to the literature.

Author Contributions

Conceptualization, A.A. and C.Ç.D.; methodology, A.A.; software, A.A.; validation, A.A., C.Ç.D. and H.İ.; formal analysis, A.A.; investigation, A.A. and C.Ç.D.; resources, A.A., Y.E.A. and C.Ç.D.; data curation, Y.E.A., H.İ., A.A. and C.Ç.D.; writing—original draft preparation, A.A.; writing—review and editing, A.A.; visualization, A.A.; supervision, Y.E.A., H.İ. and C.Ç.D.; project administration, Y.E.A., H.İ. and C.Ç.D.; funding acquisition, Y.E.A. and H.İ. All authors have read and agreed to the published version of the manuscript.

Funding

This research received no external funding.

Institutional Review Board Statement

Not applicable.

Informed Consent Statement

Not applicable.

Data Availability Statement

Not applicable.

Conflicts of Interest

The authors declare no conflict of interest.

Appendix A

Number of packages or mails distributed monthly for 100 e-scooter drivers employed at PTT are represented in Figure A1.
Figure A1. The number of packages delivered by the e-scooter.
Energies 15 07587 g0a1

References

  1. Brown, A.; Klein, N.J.; Thigpen, C.; Williams, N. Impeding access: The frequency and characteristics of improper scooter, bike, and car parking. Transp. Res. Interdiscip. Perspect. 2020, 4, 100099. [Google Scholar] [CrossRef]
  2. Agriesti, S.; Brevi, F.; Gandini, P.; Marchionni, G.; Parmar, R.; Ponti, M.; Studer, L. Impact of driverless vehicles on urban environment and future mobility. Transp. Res. Procedia 2020, 49, 44–59. [Google Scholar] [CrossRef]
  3. Inac, H.; Oztemel, E. An Assessment Framework for the Transformation of Mobility 4.0 in Smart Cities. Systems 2021, 10, 1. [Google Scholar] [CrossRef]
  4. Iwan, S.; Kijewska, K.; Lemke, J. Analysis of parcel lockers’ efficiency as the last mile delivery solution—The results of the research in Poland. Transp. Res. Procedia 2016, 12, 644–655. [Google Scholar] [CrossRef] [Green Version]
  5. Kiziltaş, M.Ç.; Ayözen, Y. A Review of Electrical Bicycle Sharing Systems as an Innovative Application. Eur. J. Sci. Technol. 2022, 38, 270–275. [Google Scholar] [CrossRef]
  6. Sareen, S.; Remme, D.; Haarstad, H. E-scooter regulation: The micro-politics of market-making for micro-mobility in Bergen. Environ. Innov. Soc. Transit. 2021, 40, 461–473. [Google Scholar] [CrossRef]
  7. Kjærup, M.; Skov, M.B.; van Berkel, N. E-Scooter Sustainability—A Clash of Needs, Perspectives, and Experiences. In Proceedings of the Human-Computer Interaction—INTERACT 2021, Bari, Italy, 30 August–3 September 2021; Ardito, C., Lanzilotti, R., Malizia, A., Petrie, H., Piccinno, A., Desolda, G., Inkpen, K., Eds.; Springer International Publishing: Cham, Switzerland, 2021; pp. 365–383. [Google Scholar]
  8. Ebner, C.; Danzer, K.; Platz, C. Batteriepackage des E-Scooter-Konzepts von BMW Motorrad. ATZ-Automob. Zeitschrift 2012, 114, 248–253. [Google Scholar] [CrossRef]
  9. Shaheen, S.A.; Cohen, A.P.; Broader, J.; Davis, R.; Brown, L.; Neelakantan, R.; Gopalakrishna, D. Mobility on Demand Planning and Implementation: Current Practices, Innovations, and Emerging Mobility Futures; Department of Transportation, Intelligent Transportation Systems Joint Program Office: Washington, DC, USA, 2020. [Google Scholar]
  10. Castiglione, M.; Comi, A.; De Vincentis, R.; Dumitru, A.; Nigro, M. Delivering in Urban Areas: A Probabilistic-Behavioral Approach for Forecasting the Use of Electric Micromobility. Sustainability 2022, 14, 9075. [Google Scholar] [CrossRef]
  11. Schoemaker, J.; Allen, J.; Huschebeck, M.; Monigl, J. Quantification of Urban Freight Transport Effects I, Deliverable D5. 1; BESTUFS Project: Zoetermeer, The Netherlands, 2005. [Google Scholar]
  12. European Commission. MDS Transmodal and CTL (2012). Study on Urban Freight Transport. Final Report for DGMOVE of the European Commission; European Commission: Brussels, Belgium, 2022.
  13. Bieliński, T.; Ważna, A. Electric Scooter Sharing and Bike Sharing User Behaviour and Characteristics. Sustainability 2020, 12, 9640. [Google Scholar] [CrossRef]
  14. Aman, J.J.C.; Smith-Colin, J.; Zhang, W. Listen to E-scooter riders: Mining rider satisfaction factors from app store reviews. Transp. Res. Part D Transp. Environ. 2021, 95, 102856. [Google Scholar] [CrossRef]
  15. Siddiqui, S.; Makrakis, D. Mpls-Based Micro-Mobility Architecture for 5g Vehicular Visible Light Communication Networks. In Proceedings of the 2020 International Symposium on Networks, Computers and Communications (ISNCC), Montreal, QC, Canada, 20–22 October 2020; IEEE: Manhattan, NY, USA, 2020; pp. 1–7. [Google Scholar]
  16. Nocerino, R.; Colorni, A.; Lia, F.; Luè, A. E-bikes and E-scooters for Smart Logistics: Environmental and Economic Sustainability in Pro-E-bike Italian Pilots. Transp. Res. Procedia 2016, 14, 2362–2371. [Google Scholar] [CrossRef] [Green Version]
  17. Heumann, M.; Kraschewski, T.; Brauner, T.; Tilch, L.; Breitner, M.H. A Spatiotemporal Study and Location-Specific Trip Pattern Categorization of Shared E-Scooter Usage. Sustainability 2021, 13, 12527. [Google Scholar] [CrossRef]
  18. Jiao, J.; Bai, S. Understanding the Shared E-scooter Travels in Austin, TX. ISPRS Int. J. Geo-Inf. 2020, 9, 135. [Google Scholar] [CrossRef] [Green Version]
  19. Jettanasen, C.; Songsukthawan, P.; Ngaopitakkul, A. Development of micro-mobility based on piezoelectric energy harvesting for smart city applications. Sustainability 2020, 12, 2933. [Google Scholar] [CrossRef] [Green Version]
  20. Wu, H.; Dunn, S.C. Environmentally responsible logistics systems. Int. J. Phys. Distrib. Logist. Manag. 1995, 25, 20–38. [Google Scholar] [CrossRef]
  21. Mekhilef, S.; Saidur, R.; Safari, A. Comparative study of different fuel cell technologies. Renew. Sustain. Energy Rev. 2012, 16, 981–989. [Google Scholar] [CrossRef]
  22. Gebhardt, L.; Wolf, C.; Seiffert, R. “I’ll Take the E-Scooter Instead of My Car”—The Potential of E-Scooters as a Substitute for Car Trips in Germany. Sustainability 2021, 13, 7361. [Google Scholar] [CrossRef]
  23. Andreev, P.I.; Rupen Aprahamian, B.; Todorov, M.; Zhelev, G. Study of “MI Electric Scooter Pro” Capabilities. In Proceedings of the 2020 21st International Symposium on Electrical Apparatus & Technologies (SIELA), Bourgas, Bulgaria, 3–6 June 2020; IEEE: Manhattan, NY, USA, 2020; pp. 1–4. [Google Scholar]
  24. Fu, Z.; Zhang, Y.; He, S.; Wang, H.; Jiang, X.; Wang, S. Multi-objective programming for economy–energy–environment system and policy mix with dual constraints of carbon emission and water consumption based on multi-scenario analysis. Energy Rep. 2022, 8, 7884–7891. [Google Scholar] [CrossRef]
  25. Jia, Z.; Lin, B. CEEEA2.0 model: A dynamic CGE model for energy-environment-economy analysis with available data and code. Energy Econ. 2022, 112, 106117. [Google Scholar] [CrossRef]
  26. Miao, Z.; Zhang, Y.; Liu, S.; Chen, X.; Baležentis, T. Heterogeneous strategy and performance decomposition: Energy-economy-environment nexus in the light of natural & managerial disposability. Environ. Impact Assess. Rev. 2022, 95, 106777. [Google Scholar] [CrossRef]
  27. Wen, S.; Jia, Z. The energy, environment and economy impact of coal resource tax, renewable investment, and total factor productivity growth. Resour. Policy 2022, 77, 102742. [Google Scholar] [CrossRef]
  28. Zhang, S.; Yu, Y.; Kharrazi, A.; Ren, H.; Ma, T. Quantifying the synergy and trade-offs among economy–energy–environment–social targets: A perspective of industrial restructuring. J. Environ. Manag. 2022, 316, 115285. [Google Scholar] [CrossRef] [PubMed]
  29. Gebhardt, L.; Ehrenberger, S.; Wolf, C.; Cyganski, R. Can shared E-scooters reduce CO2 emissions by substituting car trips in Germany? Transp. Res. Part D Transp. Environ. 2022, 109, 103328. [Google Scholar] [CrossRef]
  30. Severengiz, S.; Finke, S.; Schelte, N.; Wendt, N. Life Cycle Assessment on the Mobility Service E-Scooter Sharing. In Proceedings of the 2020 IEEE European Technology and Engineering Management Summit (E-TEMS), Dortmund, Germany, 5–7 March 2020; IEEE: Manhattan, NY, USA, 2020; pp. 1–6. [Google Scholar]
  31. Wanganoo, L.; Shukla, V.; Mohan, V. Intelligent Micro-Mobility E-Scooter: Revolutionizing Urban Transport. In Trust-Based Communication Systems for Internet of Things Applications; John Wiley & Sons, Ltd.: Hoboken, NJ, USA, 2022; pp. 267–290. ISBN 9781119896746. [Google Scholar]
  32. Moreau, H.; de Jamblinne de Meux, L.; Zeller, V.; D’Ans, P.; Ruwet, C.; Achten, W.M.J. Dockless E-Scooter: A Green Solution for Mobility? Comparative Case Study between Dockless E-Scooters, Displaced Transport, and Personal E-Scooters. Sustainability 2020, 12, 1803. [Google Scholar] [CrossRef] [Green Version]
  33. Hollingsworth, J.; Copeland, B.; Johnson, J.X. Are e-scooters polluters? The environmental impacts of shared dockless electric scooters. Environ. Res. Lett. 2019, 14, 084031. [Google Scholar] [CrossRef]
  34. Quak, H.; Nesterova, N.; van Rooijen, T. Possibilities and barriers for using electric-powered vehicles in city logistics practice. Transp. Res. Procedia 2016, 12, 157–169. [Google Scholar] [CrossRef] [Green Version]
  35. Riggs, W.; Kawashima, M.; Batstone, D. Exploring best practice for municipal e-scooter policy in the United States. Transp. Res. Part A Policy Pract. 2021, 151, 18–27. [Google Scholar] [CrossRef]
  36. Lia, F.; Nocerino, R.; Bresciani, C.; Colorni Vitale, A.; Luè, A. Promotion of E-bikes for delivery of goods in European urban areas: An Italian case study. In Proceedings of the Transport Research Arena (TRA) 5th Conference: Transport Solutions from Research to Deployment, Paris, France, 14–17 April 2014; pp. 1–10. [Google Scholar]
  37. Abduljabbar, R.L.; Liyanage, S.; Dia, H. The role of micro-mobility in shaping sustainable cities: A systematic literature review. Transp. Res. Part D Transp. Environ. 2021, 92, 102734. [Google Scholar] [CrossRef]
  38. Zuniga-Garcia, N.; Tec, M.; Scott, J.G.; Machemehl, R.B. Evaluation of e-scooters as transit last-mile solution. Transp. Res. Part C Emerg. Technol. 2022, 139, 103660. [Google Scholar] [CrossRef]
  39. Yilmaz, M.; Krein, P.T. Review of battery charger topologies, charging power levels, and infrastructure for plug-in electric and hybrid vehicles. IEEE Trans. Power Electron. 2013, 28, 2151–2169. [Google Scholar] [CrossRef]
  40. Lee, H.; Baek, K.; Chung, J.-H.; Kim, J. Factors affecting heterogeneity in willingness to use e-scooter sharing services. Transp. Res. Part D Transp. Environ. 2021, 92, 102751. [Google Scholar] [CrossRef]
  41. Lacoste, M.; Weiss-Lambrou, R.; Allard, M.; Dansereau, J. Powered tilt/recline systems: Why and how are they used? Assist. Technol. 2003, 15, 58–68. [Google Scholar] [PubMed]
  42. Garber, S.L.; Bunzel, R.; Monga, T.N. Wheelchair utilization and satisfaction following cerebral vascular accident. J. Rehabil. Res. Dev. 2002, 39, 521–534. [Google Scholar] [PubMed]
  43. Evans, S.; Frank, A.O.; Neophytou, C.; De Souza, L. Older adults’ use of, and satisfaction with, electric powered indoor/outdoor wheelchairs. Age Ageing 2007, 36, 431–435. [Google Scholar] [CrossRef] [Green Version]
  44. Jedeloo, S.; De Witte, L.P.; Linssen, B.A.J.; Schrijvers, A.J.P. Client satisfaction with service delivery of assistive technology for outdoor mobility. Disabil. Rehabil. 2002, 24, 550–557. [Google Scholar] [CrossRef]
  45. Weinert, J.X. The Rise of Electric Two-Wheelers in China: Factors for Their Success and Implications for the Future; University of California: Davis, CA, USA, 2007; ISBN 0549494723. [Google Scholar]
  46. Schellong, D.; Sadek, P.; Schaetzberger, C.; Barrack, T. The promise and pitfalls of e-scooter sharing. Europe 2019, 12, 15. [Google Scholar]
  47. Tuncer, S.; Brown, B. E-scooters on the ground: Lessons for redesigning urban micro-mobility. In Proceedings of the 2020 CHI Conference on Human Factors in Computing Systems, Honolulu, HI, USA, 25–30 April 2020; pp. 1–14. [Google Scholar]
  48. Hayat, M.J.; Higgins, M. Understanding poisson regression. J. Nurs. Educ. 2014, 53, 207–215. [Google Scholar]
  49. Chesaniuk, M. Chapter 19: Logistic and Poisson Regression 2021. Available online: https://ademos.people.uic.edu/Chapter19.html (accessed on 21 September 2022).
  50. Eccarius, T.; Lu, C.-C. Adoption intentions for micro-mobility—Insights from electric scooter sharing in Taiwan. Transp. Res. Part D Transp. Environ. 2020, 84, 102327. [Google Scholar] [CrossRef]
  51. Reck, D.J.; Axhausen, K.W. Who uses shared micro-mobility services? Empirical evidence from Zurich, Switzerland. Transp. Res. Part D Transp. Environ. 2021, 94, 102803. [Google Scholar] [CrossRef]
  52. Bozzi, A.D.; Aguilera, A. Shared E-Scooters: A Review of Uses, Health and Environmental Impacts, and Policy Implications of a New Micro-Mobility Service. Sustainability 2021, 13, 8676. [Google Scholar] [CrossRef]
  53. Chiussi, F.A.; Khotimsky, D.A.; Krishnan, S. A network architecture for MPLS-based micro-mobility. In Proceedings of the 2002 IEEE Wireless Communications and Networking Conference Record. WCNC 2002 (Cat. No.02TH8609), Orlando, FL, USA, 17–21 March 2002; Volume 2, pp. 549–555. [Google Scholar]
  54. Zhao, P.; Haitao, H.; Li, A.; Mansourian, A. Impact of data processing on deriving micro-mobility patterns from vehicle availability data. Transp. Res. Part D Transp. Environ. 2021, 97, 102913. [Google Scholar] [CrossRef]
  55. Štefancová, V.; Kalašová, A.; Čulík, K.; Mazanec, J.; Vojtek, M.; Mašek, J. Research on the Impact of COVID-19 on Micromobility Using Statistical Methods. Appl. Sci. 2022, 12, 8128. [Google Scholar] [CrossRef]
  56. Liu, L.; Miller, H.J. Measuring the impacts of dockless micro-mobility services on public transit accessibility. Comput. Environ. Urban Syst. 2022, 98, 101885. [Google Scholar] [CrossRef]
  57. Sun, B.; Garikapati, V.; Wilson, A.; Duvall, A. Estimating energy bounds for adoption of shared micromobility. Transp. Res. Part D Transp. Environ. 2021, 100, 103012. [Google Scholar] [CrossRef]
  58. Medina-Molina, C.; Pérez-Macías, N.; Gismera-Tierno, L. The multi-level perspective and micromobility services. J. Innov. Knowl. 2022, 7, 100183. [Google Scholar] [CrossRef]
  59. PTT Turkish Post. Available online: https://www.ptt.gov.tr/ (accessed on 1 September 2022).
  60. Atalan, A. A cost analysis with the discrete-event simulation application in nurse and doctor employment management. J. Nurs. Manag. 2022, 30, 733–741. [Google Scholar] [CrossRef]
  61. Famoye, F.; Singh, K.P. Zero-inflated generalized Poisson regression model with an application to domestic violence data. J. Data Sci. 2006, 4, 117–130. [Google Scholar] [CrossRef]
  62. Consul, P.C.; Famoye, F. Generalized poisson regression model. Commun. Stat.-Theory Methods 1992, 21, 89–109. [Google Scholar] [CrossRef]
  63. Lu, Z.; Van Hui, Y.; Lee, A.H. Minimum Hellinger distance estimation for finite mixtures of Poisson regression models and its applications. Biometrics 2003, 59, 1016–1026. [Google Scholar] [CrossRef]
  64. Koç, H.; Dünder, E.; Gümüştekin, S.; Koç, T.; Cengiz, M.A. Particle swarm optimization-based variable selection in Poisson regression analysis via information complexity-type criteria. Commun. Stat.-Theory Methods 2018, 47, 5298–5306. [Google Scholar] [CrossRef]
  65. Gebski, V.; Ellingson, K.; Edwards, J.; Jernigan, J.; Kleinbaum, D. Modelling interrupted time series to evaluate prevention and control of infection in healthcare. Epidemiol. Infect. 2012, 140, 2131–2141. [Google Scholar] [CrossRef] [PubMed] [Green Version]
  66. Atalan, A.; Şahin, H.; Atalan, Y.A. Integration of Machine Learning Algorithms and Discrete-Event Simulation for the Cost of Healthcare Resources. Healthcare 2022, 10, 1920. [Google Scholar] [CrossRef]
  67. Lukman, A.F.; Adewuyi, E.; Månsson, K.; Kibria, B.M.G. A new estimator for the multicollinear Poisson regression model: Simulation and application. Sci. Rep. 2021, 11, 3732. [Google Scholar] [CrossRef] [PubMed]
  68. Hamdy, T.A. Operations Research: An Introduction, 9th ed.; Pearson: Upper Saddle River, NJ, USA, 2010. [Google Scholar]
  69. Atalan, A. Forecasting drinking milk price based on economic, social, and environmental factors using machine learning algorithms. Agribusiness 2022, 1–28. [Google Scholar] [CrossRef]
  70. Dönmez, N.F.K.; Atalan, A.; Dönmez, C.Ç. Desirability Optimization Models to Create the Global Healthcare Competitiveness Index. Arab. J. Sci. Eng. 2020, 45, 7065–7076. [Google Scholar] [CrossRef]
  71. Mistry, M.; Letsios, D.; Krennrich, G.; Lee, R.M.; Misener, R. Mixed-Integer Convex Nonlinear Optimization with Gradient-Boosted Trees Embedded. Optim. Control 2018, 33, 1–40. [Google Scholar] [CrossRef]
  72. Ayaz Atalan, Y.; Tayanç, M.; Erkan, K.; Atalan, A. Development of Nonlinear Optimization Models for Wind Power Plants Using Box-Behnken Design of Experiment: A Case Study for Turkey. Sustainability 2020, 12, 6017. [Google Scholar] [CrossRef]
  73. Saleem, M.; Farooq, U.; Izhar, U.; Khan, U. Multi-Response Optimization of Electrothermal Micromirror Using Desirability Function-Based Response Surface Methodology. Micromachines 2017, 8, 107. [Google Scholar] [CrossRef] [Green Version]
  74. Dönmez, C.Ç.; Atalan, A. Developing Statistical Optimization Models for Urban Competitiveness Index: Under the Boundaries of Econophysics Approach. Complexity 2019, 2019, 1–11. [Google Scholar] [CrossRef] [Green Version]
  75. Atalan, A. Desirability Optimization Based on the Poisson Regression Model: Estimation of the Optimum Dental Workforce Planning. Int. J. Health Manag. Tour. 2022, 7, 200–216. [Google Scholar] [CrossRef]
  76. Ruesch, M.; Schmid, T.; Bohne, S.; Haefeli, U.; Walker, D. Freight Transport with Vans: Developments and Measures. Transp. Res. Procedia 2016, 12, 79–92. [Google Scholar] [CrossRef] [Green Version]
  77. Fuchs, A. Energie-effizienter Leicht-Scooter im Gewichtsbereich eines Mofa; Technical Report; Swiss Federal Office of Energy: Berne, Switzerland, 2005. [Google Scholar]
  78. Şengül, B.; Mostofi, H. Impacts of E-Micromobility on the Sustainability of Urban Transportation—A Systematic Review. Appl. Sci. 2021, 11, 5851. [Google Scholar] [CrossRef]
  79. Heineke, K.; Kloss, B.; Scurtu, D.; Weig, F. Micromobility’s 15,000-Mile Checkup; McKinsey Company: Chicago, IL, USA, 2019; Volume 29. [Google Scholar]
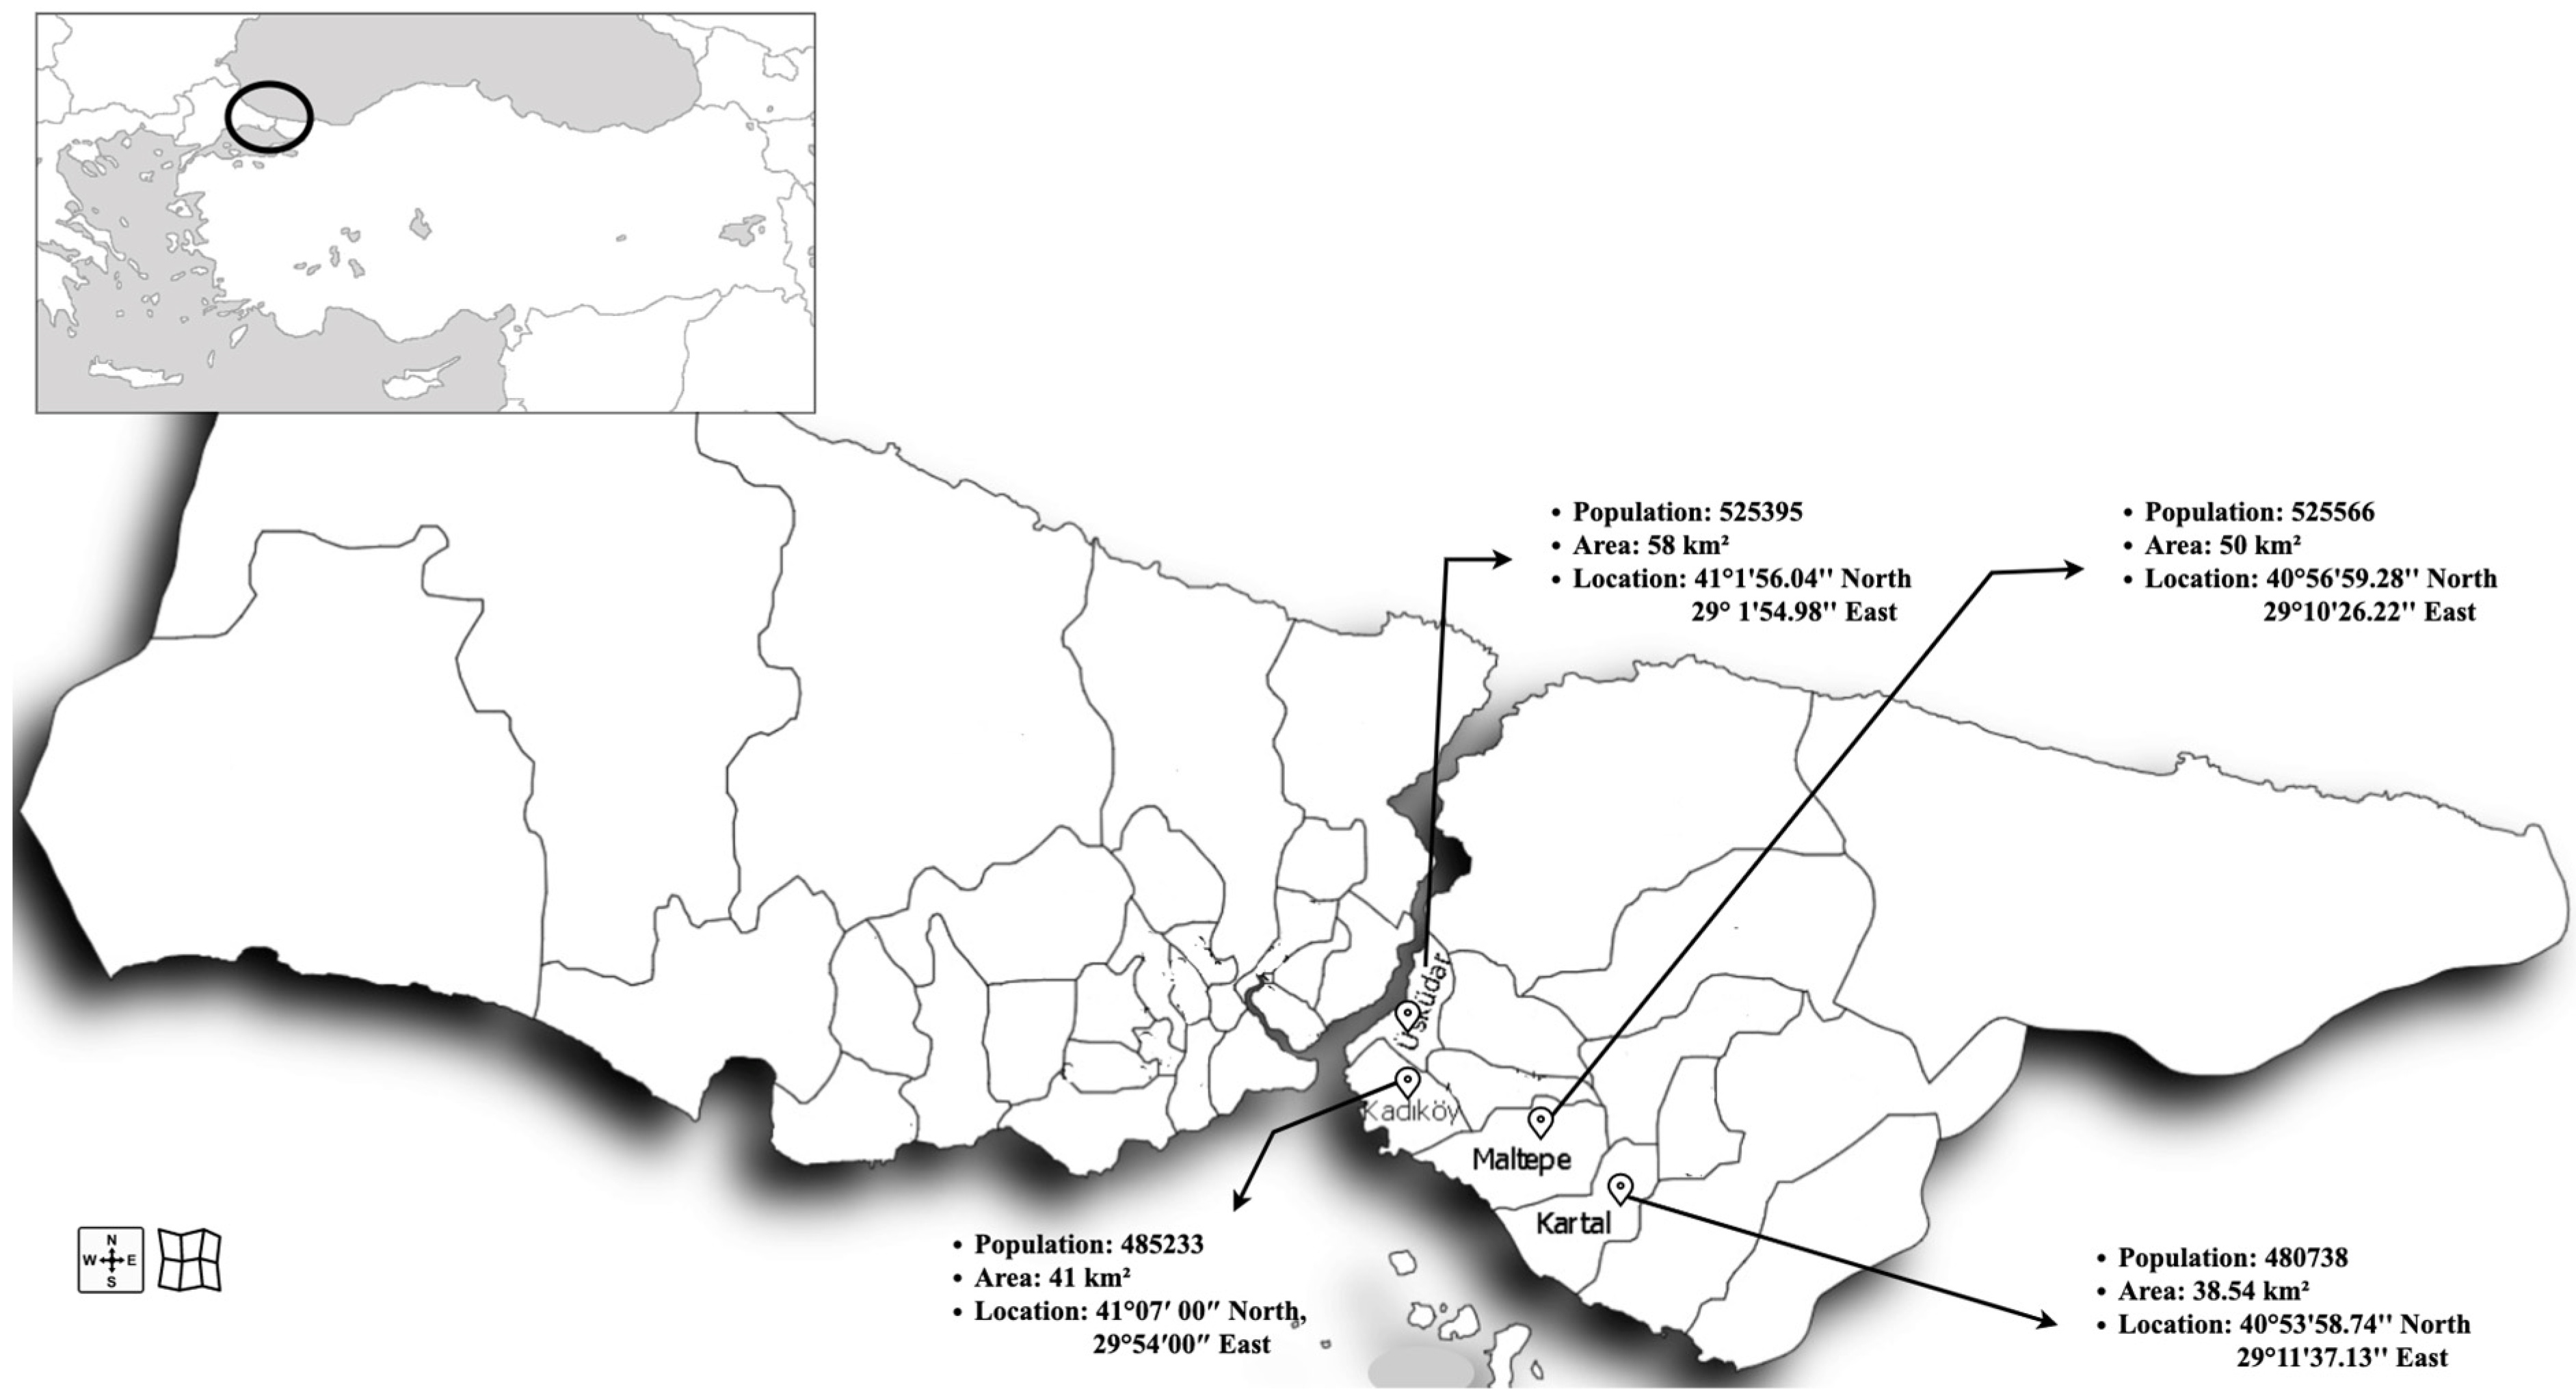
Figure 1. Plot zones selected for packages delivered with the e-scooter application.
Energies 15 07587 g001
Figure 2. The sort of the delivery drivers based on the delivery time by e-scooter.
Energies 15 07587 g002
Figure 3. Technical specifications of the e-scooter.
Energies 15 07587 g003
Figure 4. The total cost for a package delivered.
Energies 15 07587 g004
Figure 5. (a) The cost of energy required for a package delivered, (b) The number of packages or mails distributed with the e-scooter micro-mobility.
Energies 15 07587 g005
Figure 6. CO2 emission values of motorcycle and combivan distribution vehicles depending on the package density distributed.
Energies 15 07587 g006
Figure 7. Optimum values of the number of packages distributed and distribution cost depending on the desirability values.
Energies 15 07587 g007
Figure 8. The number of packages distributed with e-scooters and other vehicle delivery personnel.
Energies 15 07587 g008
Figure 9. The delivery time of a package or mail on behalf of delivery vehicles.
Energies 15 07587 g009
Table 1. Detailed information about the aims, methods, and factors of studies related to micro-mobility approaches and this study.
SourcePurpose (s)Factor (s)Method (s)
[50]To investigate the factors affecting the use of electric scooter sharing service by university studentsIntention,
Perceived behaviour control, attitude, subjective norm, compatibility, environmental value, awareness–knowledge
Factor analysis and structural equation modelling
[51]Adoption of shared micro-mobility in the city of ZurichPerson-specific socio-demographic, household-specific socio-demographic, person-specific mobility questionsMaximum simulated likelihood
[52]Review of uses of a new micro-mobility serviceHealth and environmental impacts, policy implicationsLiterature review
[53]Building a new multi-protocol tag switching (MPLS) based network architecture that implements micro-mobilityTunnel-based, routing-based schemesLabel edge mobility agent
[54]Creating a potential data source for micro-mobility research and applicationsA range of temporal, spatial, and statistical mobility descriptorsData processing framework
[55]Investigating the impact of COVID-19 on micro-mobilityRelax, health, speed, price, availabilityIndependence test, correspondence analysis
[56]Establish accessibility increase measures for micro-mobility servicesGeneral transit feed specification (GTFS), the locations of available of dockless vehicle, the empirical transit usageAccessibility increment, spatiotemporal analyses
[57]Exploring the energy limits of shared micro-mobility adoptionEnergy impacts: age, time of day, trip purpose, area types, travel party size, tour mode restrictionSensitivity statistical analysis
[19]Design of a pilot device to study the energy conversion and storage achieved by converting a micro-mobility device to a stationary exercise bike with a piezoelectric generatorEnergy, environmental factors, piezoelectric materialsThe piezoelectric material
[58]To clarify how the system, regime, and niche dynamics that make up the MLP are interrelatedLandscape, regime, nicheSociotechnical transition and the multi-level perspective
This StudyTo deliver the maximum number of packages or mails with minimum cost and the shortest timeCost, energy, environmental aspectsPoisson regression optimization model
Table 2. Indicators of the packages delivered by the e-scooters.
VariablesUnitsStatusNotationsDescription
Number of packages delivered Number,
(Integer)
Response y p The average number of packages delivered per hour by a worker
The total cost of distribution *TLResponse y c The cost of distribution of packages to the administration includes energy, rent, and personnel expenses.
AgeYearInput x a g e Age information of employees involved in the e-scooter package distribution project
GenderCategoricalInput x g e n d e r Gender information of employees engaged in the e-scooter package distribution project
Tenure in the professionYearInput x t e n u r e Working times of employees involved in the e-scooter package delivery project in the delivery job (before the e-scooter project)
Area Km2Input x a r e a Area sizes for which the employees involved in the e-scooter package distribution project are responsible
CO2 Emissiong/kmInput x C O 2 The amount of CO2 emissions per package
* Maintenance, repair, and insurance costs belong to the contractor company.
Table 3. Descriptive statistics of the variables of the e-scooter distribution.
VariableDecision VariableResponse Variables
x C O 2 x a g e x t e n u r e x a r e a y p y c
Cost_e-SCost_mCost_c
Mean33.517.3260.4680.0543511.81791.010,53573,748
SE Mean0.7610.5950.0320.00291.50046.700275.01922
StDev7.6115.9460.3130.021915.00466.70274519,216
Variance57.9235.360.0980.00183,72821,7787 × 1063.69 × 108
CoefVar22.7181.1766.9939.0426.06026.06026.0626.06
Minimum19.000.1000.1130.02191,500466.70274519,215
Q128.002.2000.2710.0453082.31571.9924764,727
Median33.007.4500.3530.05035171793.710,55173,857
Q338.7511.050.5650.05739201999.211,76082,320
Maximum55.0024.801.9890.19284544311.525,362177,534
Range36.0024.701.8760.17175393844.922,617158,319
IQR10.758.8500.2940.012837.8427.30251317,593
Mode
(Male,
Female)
31.008.300 0.051(3497,
3638)
(1784,
1856)
(10,491,
10,914)
(73,437,
76,398)
N for Mode8.008.000.003.0002.002.002.002.00
Skewness0.330.912.523.8401.101.101.101.10
Kurtosis−0.130.358.8820.088.318.318.318.31
Variable abbreviations: Delivery cost by package or postal vehicles: Cost_e-S: e-Scooter cost, Cost_m: motorcycle cost, Cost_c: combivan cost. Statistical abbreviations: SE Mean, standard error mean; StDev, standard deviation; CoefVar, variance coefficient; Q1, the first quartile, Q3, the third quartile; IQR, interquartile range; N, number of samples.
Table 4. Poisson distribution regression analysis data of the e-scooter distribution.
TermModel x C O 2 x a g e x t e n u r e x a r e a x g e n d e r DeviancePearson
Packages/
Mails
SE Coef.0.01230.00030.00040.00540.1530.008
Z-Value735.29−2.29−0.416.77−113.41−1.28
p-Value0.00010.0220.6790.0010.0010.1990.0010.022
VIF 1.671.691.041.061.01
R-Sq0.9024
R-Sq(adj)0.9021
DF5.0001.0001.0001.001.001.0089.0089.00
Chi-Square13,973.45.260.1745.8212,8621.651954.82463
Mean 33.517.3260.4680.05433.5121.96427.67
Estimate9.0622−0.0007−0.00020.0364−17.33−0.011954.82463
CostSE Coef.0.01730.000410.00050.00750.2140.011
Z-Value486.09−1.64−0.34.83−80.99−0.92
p-Value0.00010.1010.7670.0010.0000.360.0010.001
VIF 1.6701.691.041.061.01
R-Sq0.9024
R-Sq(adj)0.9019
DF5.00001.001.0001.001.001.0089.0089.000
Chi-Square7126.42.680.0923.376559.70.84996.91256.1
Mean 33.517.3260.4680.054233.5111.2014.114
Estimate9.0500−17.650.0000.000.020.00996.91256.1
SE Coef.: Coefficient of Standard Error, DF: Degree of Freedom, VIF: Variance Inflation Factor, R-Sq: R-squared, R-Sq (adj): Adjusted R-squared.
Table 5. The vehicle types in terms of the economic dimension.
Vehicle TypeNumber of Packets DistributedCost Per Package *
(TL ***)
Total Cost of Packages Distributed (TL ***)Savings
(%)
MonthlyDailyMonthlyDailyMonthlyDaily
Combivan1800908.2114,780.92739.05BaseBase
Motorcycle1600801.282049.46102.4786.13 *86.13 *
E-scooter1400700.51711.7735.5999.51 *, 96.49 **95.18 *, 65.27 **
* Based on the Combivan, ** Based on the Motorcycle, *** TL: Turkish Lira.
Table 6. The vehicle types in terms of energy dimension.
Vehicle TypeEnergy TypeEnergy Cost (TL)Savings (%)
MonthlyDailyPer Package
CombivanFuel3120155.71.73−95.95% * and −64.74 **
MotorcycleFuel982.848.80.61−88.52 * and +64.74 ***
E-scooterElectric99.34.90.07Base
* Based on the E-Scooter, ** Based on the Motorcycle, *** Based on the Combivan.
Publisher’s Note: MDPI stays neutral with regard to jurisdictional claims in published maps and institutional affiliations.