Article

A Recent Advance on Partial Evaporating Organic Rankine Cycle: Experimental Results on an Axial Turbine

1
CEA, DES, IRESNE, DER, SESI, LCOS, F-13108 Saint Paul Lez Durance, France
2
Université Grenoble Alpes, CEA, LITEN, LCST, F-38054 Grenoble, France
3
GRETh—Groupement pour la Recherche sur les Echangeurs Thermiques, F-73290 La Motte Servolex, France
*
Author to whom correspondence should be addressed.
Energies 2022, 15(20), 7559; https://doi.org/10.3390/en15207559
Submission received: 19 September 2022 / Revised: 6 October 2022 / Accepted: 11 October 2022 / Published: 13 October 2022
(This article belongs to the Special Issue Applications and New Technologies of Waste Heat Recovery)

Abstract

:
The organic Rankine cycle (ORC) technology is an efficient way to convert low-grade heat from renewable sources or waste heat for power generation. The partial evaporating organic Rankine cycle (PEORC) can be considered as a promising alternative as it can offer a higher utilization of the heat source. An experimental investigation of a small ORC system used in full or partial evaporation mode is performed. First characterized in superheated mode, which corresponds to standard ORC behavior, a semi-empirical correlative approach involving traditional non-dimensional turbomachinery parameters (specific speed, pressure ratio) can accurately describe one-phase turbine performance. In a second step, two-phase behavior is experimentally investigated. The efficiency loss caused by the two-phase inlet condition is quantified and considered acceptable. The turbine two-phase operation allows for an increase in the amount of recovered heat source. The ability to operate in two phases provides a new degree of flexibility when designing a PEORC. The semi-empirical correlative approach is then completed to take into account the partially evaporated turbine inlet condition. The qualitative description and the quantitative correlations in the one-phase and two-phase modes were applied to different pure working fluids (Novec649TM, HFE7000 and HFE7100) as well as to a zeotropic mixture (Novec649TM/HFE7000).

1. Introduction

The organic Rankine cycle (ORC) is a thermal-driven power cycle that uses a heat source to generate electricity. The difference between ORC and a classic Rankine cycle (RC) is the working fluid. Indeed, ORC uses a low-boiling-point fluid, which allows for the valorization of low and medium heat sources (lower than 300 °C) [1,2]. The heat sources used are mostly renewable (mainly geothermal with approximately 3 GW of cumulative installed capacity in 2020) and from waste heat, with a power range production from very few kW to several dozen MW [3]. These sources have some strong constraints (recovery, intermittency).
However, three major difficulties with heat recovery using ORC systems exist: the fouling of the heat exchanger, the total capital cost of ORC and the partial-load behavior:
  • Fouling reduces the performance of the heat exchangers and therefore the heat source received by the ORC. Moreover, geothermal waters, which as explained before is a very important heat source for ORC systems, contain many fouling and corrosion ions. Thus, ions cause serious problems of fouling and corrosion [4,5,6]. Similar problems occur with industrial waste heat. The degradation of the heat exchanger performance could prevent the working fluid from completely evaporating and thus cause liquid droplets in the turbine which could lead to its erosion [7,8]. As an illustration, the economic cost of fouling in heat exchangers is estimated as USD 14 billion per year in 2014 in the United States of America [9,10].
  • The total capital cost of ORC consists of the overall cost of ORC equipment (heat exchanger, pumps …). For ORC systems, this price remains high and many studies focus on reducing this price to increase the attractiveness of ORC [11,12].
  • The partial-load behavior of ORC systems is generally considered as satisfactory, compared to other thermodynamic cycles [1]. However, in large off-design conditions of a “normal” ORC system submitted to a large deviation of the heat source, partial evaporation can occur, leading to a two-phase condition at the turbine inlet. Generally, this behavior is forbidden and ORC production must be reduced or even stopped if the risk of a two-phase condition arises.
A particular strategy to overcome these three difficulties is to allow for the turbine to work under two-phase conditions in an acceptable way. Successful research on this task could make it possible to extend the behavior of “normal” ORC systems submitted to large off-design conditions and to study alternative ORC configurations which are able to decrease the size of the evaporator and thus the total capital cost of the ORC. In this way, several studies focus on the expansion process of the ORC under two-phase fluid conditions [13,14,15].
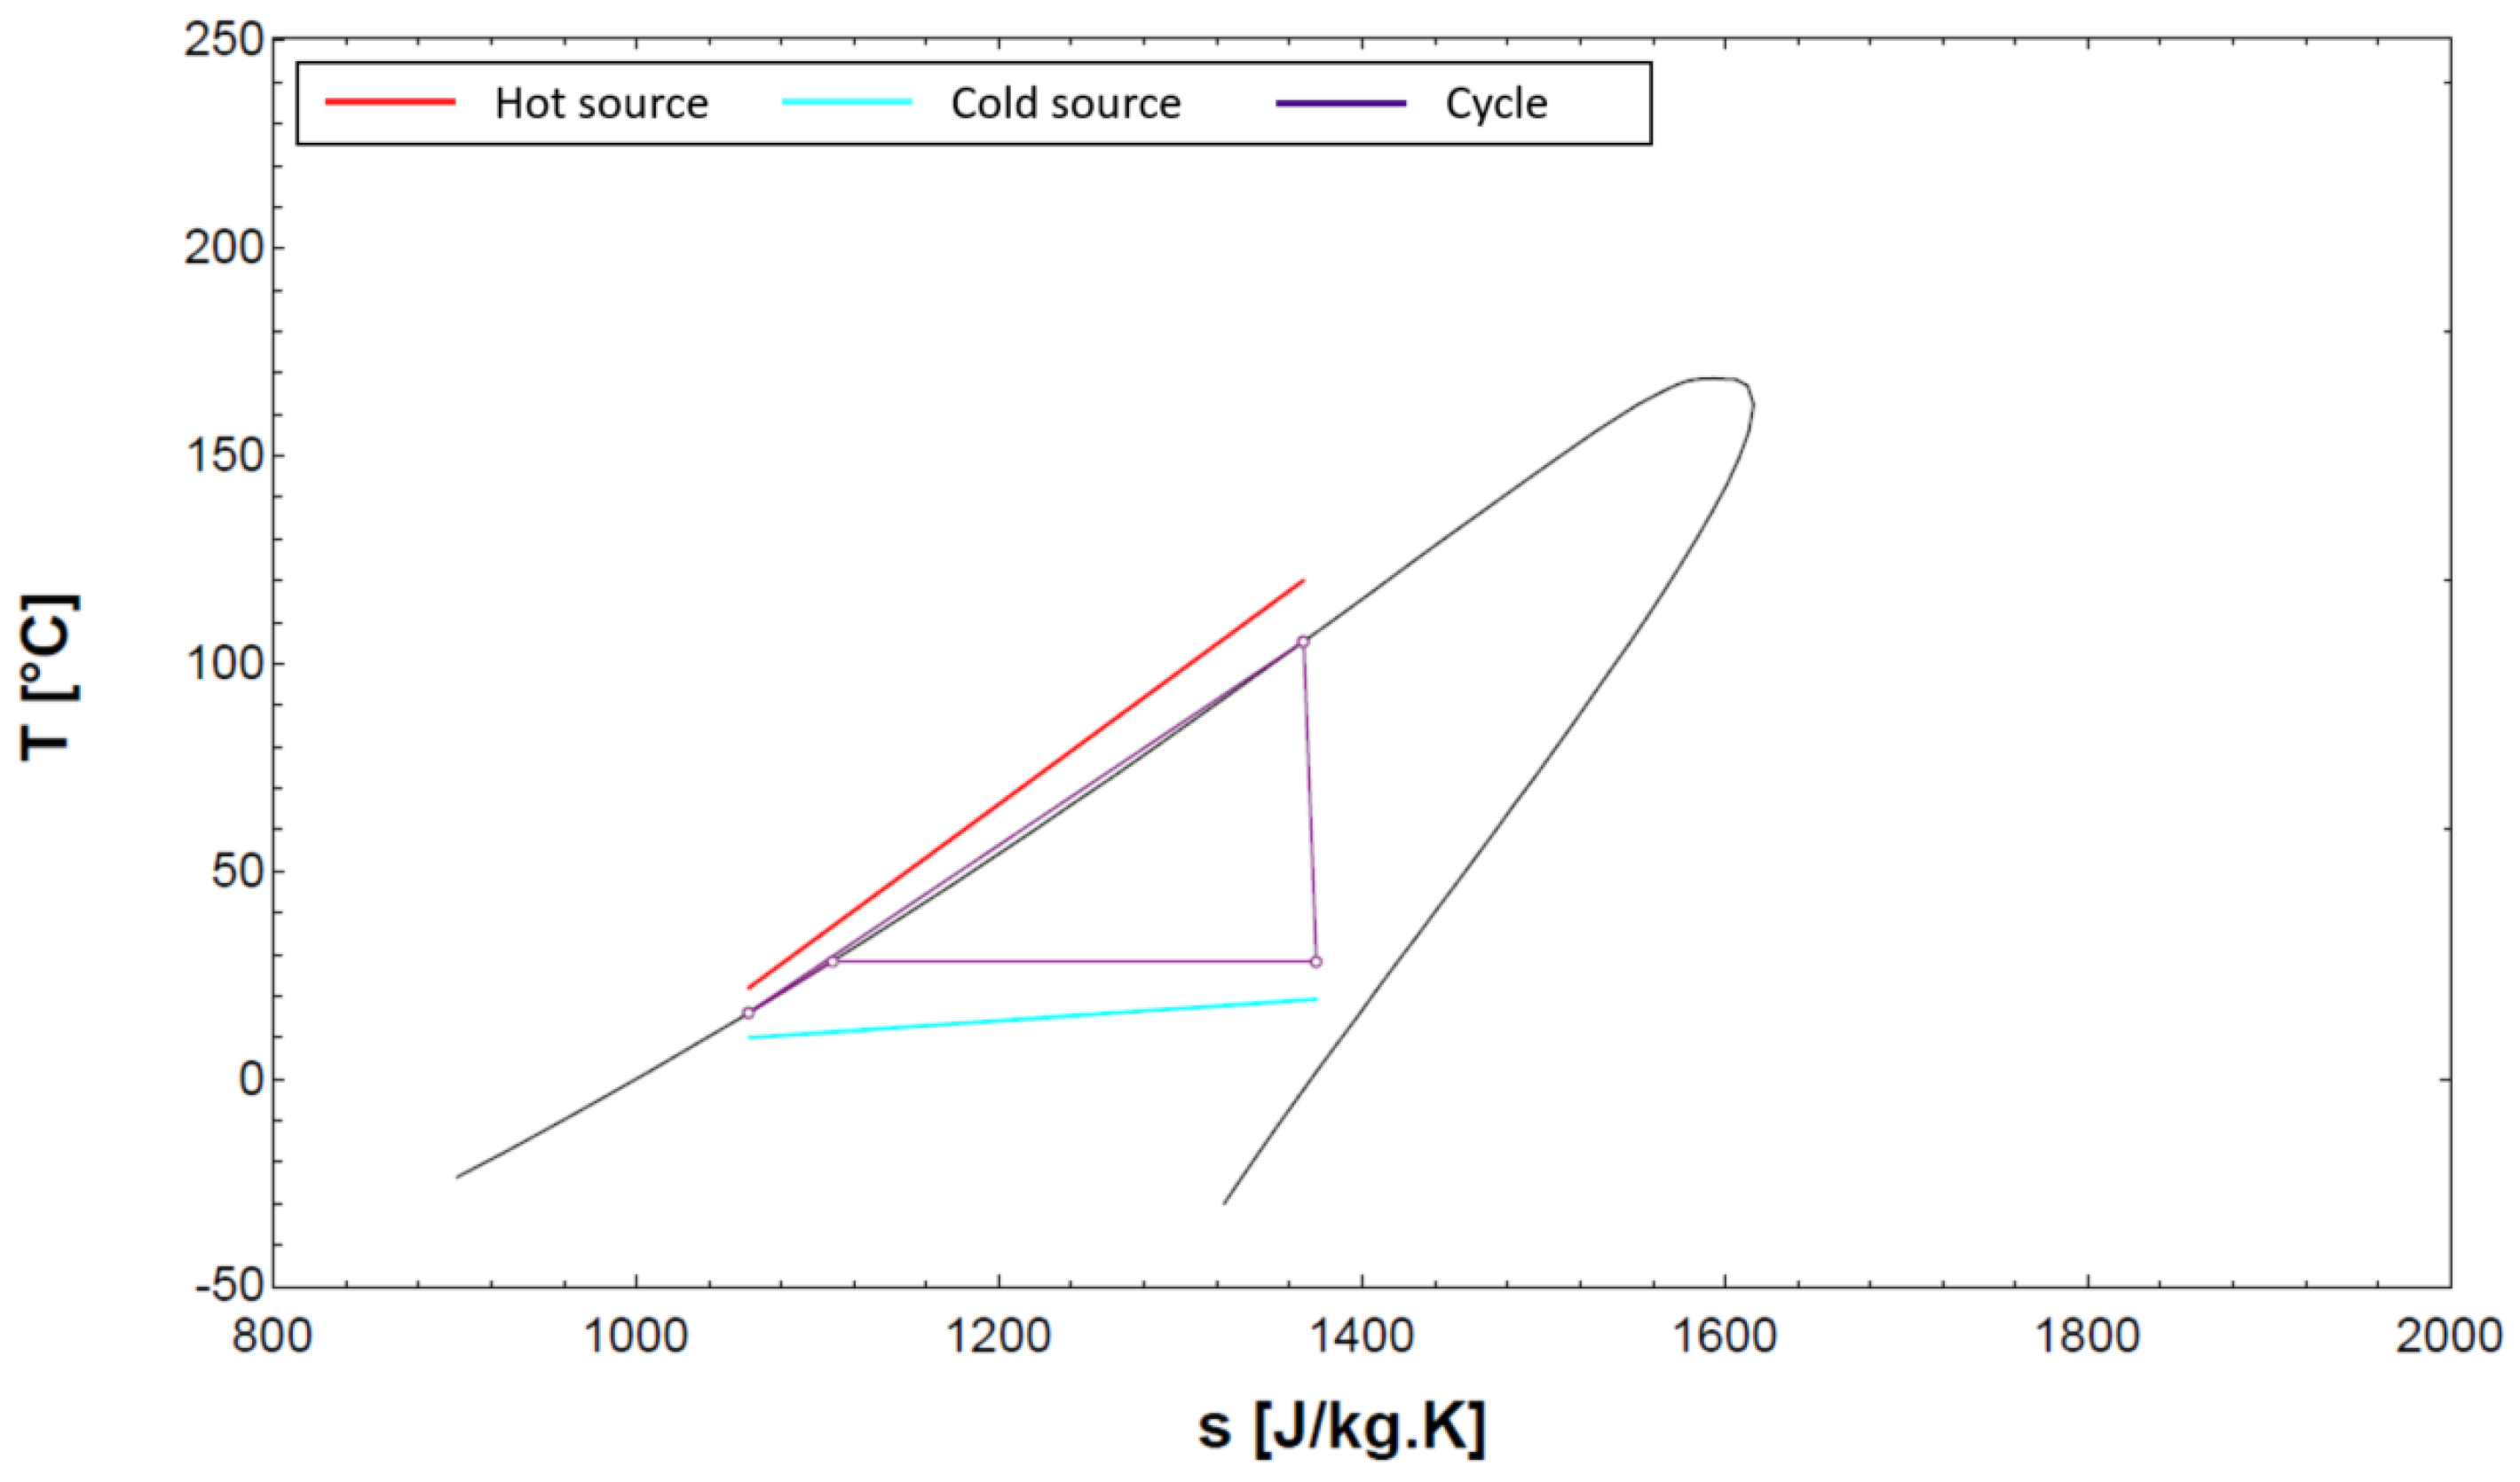
Usually, as explained previously, to increase the performance of the ORC and to avoid any erosion of the turbo-machine blades, the fluid needs to be fully evaporated [7]. However, due to the finite temperature difference, the extractable energy from a hot source is limited (Figure 1). It is from this observation of the non-valorization of an energy potential that new cycles, close to the ORC, have emerged.
Trilateral flash cycle (TFC) is composed of the same components as an ORC; the only difference between the two cycles resides in the working fluid inlet quality at the expander inlet. Where, in an ORC, the working fluid enters the expander in a superheated form, in a TFC, the working fluid enters the expander in a liquid form at saturation and leaves the expander as a liquid–vapor mixture [16,17]. Thus, the temperature profiles between heat source and working fluid represent a better match, allowing for a decrease in exergy loss (Figure 2). However, the great difficulty with TFC resides in the type of expander that is permanently resistant to the presence of liquid droplets. Two expanders have been identified in the literature as being able to withstand these constraints: screw expanders [18,19,20,21,22,23] and scroll expanders [24,25]. However, volumetric expansion devices necessitate large machine sizes, which might not be economically viable in some situations: the economic viability is determined by the case under consideration [26,27].
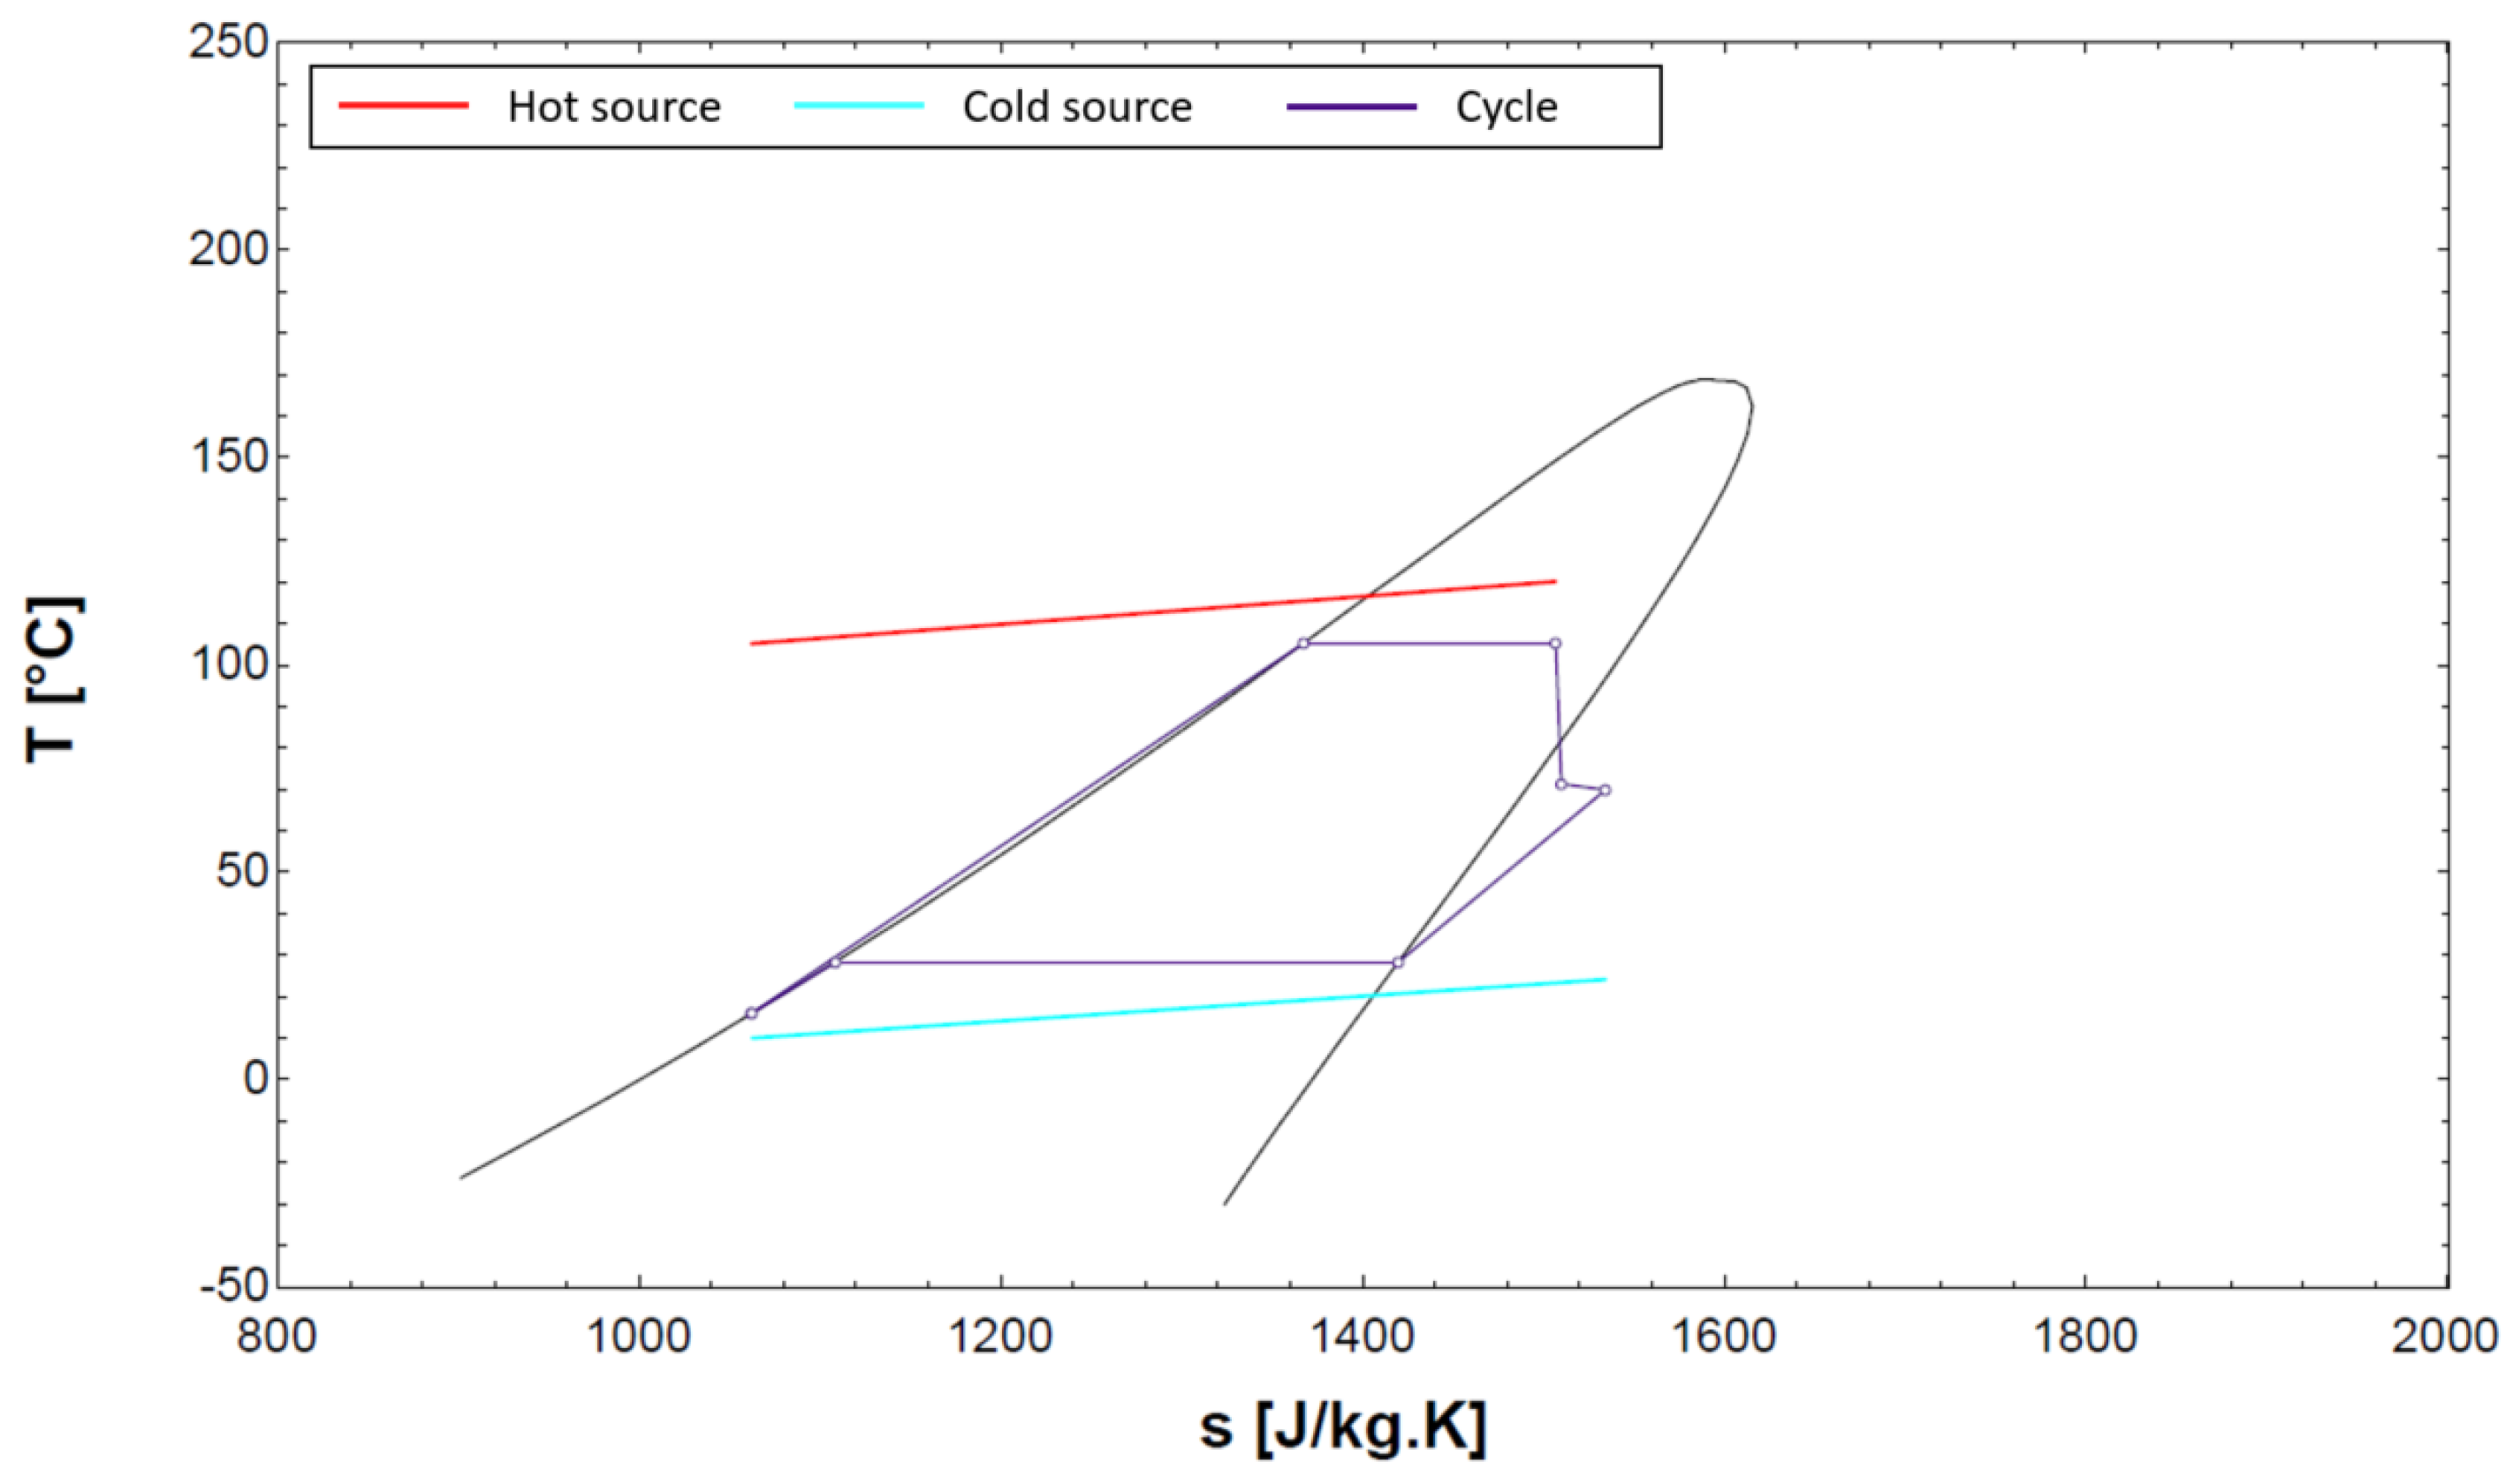
The partial evaporating organic Rankine cycle (PEORC) can be considered as a combination of an ORC and a TFC [28]: for a TFC, the fluid is heated to the boiling point, whereas for the PEORC the fluid starts to evaporate. Studies show that this cycle can reduce energy losses [29,30]. In fact, when compared to a traditional ORC system, PEORC exhibits a better match between the temperature profiles of the heat source and the working fluid. When compared to a TFC, a PEORC can provide more flexibility in system design.
Another option may be to use this type of cycle coupled with a nozzle and a dry working fluid. As on the TFC, the nozzle will allow for the fluid to flash, but this time, the dry aspect of the fluid (dT/ds > 0) will allow for the fluid to leave the nozzle as a pure vapor. The objective is to have a single-phase fluid at the inlet of the turbomachine, and to therefore use a turbomachine without taking any risks of damaging it. This option is called a wet-to-dry cycle (Figure 3). This type of cycle was originally explored in 1983 using toluene as a working fluid [31]. This study concluded with promising results for these wet-to-dry cycles, but very few studies followed this investigation [14].
Moreover, with the utilization of ‘dry fluids’ combined with a radial-inflow turbine, White [13] showed, through a theoretical model, that it is possible to insert the liquid–vapor mixture directly in the turbine rotor without harming the turbo-machine blades: the stator would act as a nozzle. The article’s conclusions indicate that a full transition from saturated two-phase conditions to superheated vapor can be achieved within the stator by using a dry fluid, such as Novec649TM. Our experimental contribution will concern a configuration including a turbo-machine, contrary to a more traditional two-phase expander, such as a screw expander or scroll expander. In nominal conditions, the turbine will operate under superheated conditions, and the cycle can be considered as a classical ORC. In highly off-design regimes, the turbine will operate under two-phase conditions, and the cycle can be considered as a PEORC. This configuration is anticipated to provide more flexibility in hot source recovery. Unfortunately, no experimental data are available for two-phase ORC using an axial or radial turbine as an expander.
Therefore, given the need for experimental results, the outcomes of this study will be to provide experimental results with two-phase expansion and the repercussion of this two-phase fluid on the system efficiency using a turbo-machine. This machine will be of axial type: this choice is motivated by the ambition to provide results which could be applied to large industrial machines [32].

2. Experimental Test Bench

2.1. ORC Loop

The process flow diagram (PFD) of the installation is shown in Figure 4 and a picture in Figure 5. The fluid at the entry of the volumetric pump is in a liquid state. Thanks to the volumetric pump, the working fluid flows to a high-pressure level. Then, the fluid is heated by two heat exchangers in series using water as heat source. This vapor, at high temperature and high pressure, is then expanded in a turbine. This expansion produces mechanical power which is then converted into electricity through a generator. The low-pressure vapor is then cooled by a plate condenser using water as a cold source, in order to go back into the pump.
The system is composed of an axial micro-turbine with a maximum power of about 1 kW. The lubrication of the system is ensured by the working fluid itself. An external circuit specific to the generator ensures its cooling. A small centrifugal pump is placed just before the volumetric pump with the objective of slightly increasing the pressure to avoid any cavitation risk. Located between the condenser and the centrifugal pump, a tank ensures a sufficient level of liquid at the inlet of the centrifugal pump. An additional system based on a heat exchanger and a bypass system provides the opportunity to investigate a wide range of cold source temperatures. Another bypass system on pumps 1, 2 and 3 coupled with a needle valve enables the investigation of a wide range of mass flow rates and pressures.
All sensors used for measurements and data acquisition are presented on the scheme in Figure 4. The characteristics of the measuring equipment are listed in Table 1.
The working fluid, hot and cold source loops are equipped with Type-T thermocouples to measure the temperatures between the various components. The working fluid circuit is instrumented with absolute pressure sensors (APSs) at the turbine inlet and outlet to measure the two pressure stages within the plant. The volume flow measurements of the hot and cold circuits are made with electromagnetic flow meters (EFMs) while the fluid flow is measured with a Coriolis-type mass flow rate meter. The gross power produced at the turbine is measured with a power meter.

2.2. Fluid Candidates

Candidate working fluids to enter a two-phase turbine must be of the dry type to bring single-phase expansion in the turbine rotor. Following White’s work [13], one of the theoretically tested fluid was Novec649TM. In addition, this fluid is non-toxic and non-flammable [33]. Moreover, due to its environmental characteristics (ozone depletion potential (ODP) = 0 and global warming potential (GWP) = 1), Novec649TM is not concerned by the Kyoto and Paris agreements on refrigerant working fluids (Table 2) [34,35].
Two other working fluids, namely HFE7000 and HFE7100 of the Hydrofluoroether (HFE) type, are identified as promising candidates for our study (Figure 6). These working fluids have been identified as possible replacements for Hydrofluorocarbures (HFCs) [36].
HFE7000 provides equivalent performance to an HFC-type fluid [37]. In addition, this working fluid provides a better performance than other HFE-type fluids [38]. Concerning HFE7100, reference [39] reports an overall ORC installation efficiency of approximately 6% for a power output of 1 kW. Such results, in view of the yields usually obtained by ORCs for the same power range, confirms a strong interest for this working fluid. However, although it has better environmental properties than HFCs, the GWP of these fluids remains relatively high (>150) (Table 2).
However, these replacement fluids are not always able to achieve the desired performance compared to the replaced fluids [40]. Thus, zeotropic mixtures of replacement fluids are supposed to be an interesting solution to increase the performance of an ORC [41]. Indeed, due to the difference in saturation temperature of the fluids composing the mixture, the saturation temperature of the fluid during the evaporation phase is not isothermal: this is called “temperature glide”. This temperature glide is the main characteristic of zeotropic mixtures which would make it possible to increase the performance of the ORC by reducing the losses at the hot source.
The thermodynamic properties of the Novec649TM, the HFE7000 and the HFE7100 come from EES (Engineering Equation Solver) software [42]. The properties of the mixtures are obtained with the software Refprop (NIST database) [43].

2.3. Partial Admission Micro Axial Turbine

The turbine studied in this work is an impulse partial admission micro axial turbine. Axial turbines are the most used turbines for powers of more than 0.5 MW [32]. However, it is possible to use them at lower powers, either by directly modifying the geometry of the rotor and stator or by modifying the stator to allow for a reduction in the flow entering the turbine: this is called a partial admission turbine.
In an axial turbine, the fluid is accelerated through a static guide (stator). The fluid, at high speed, is then directed towards a set of moving blades and causes the implementation of a mechanical movement. In impulse turbine, the pressure drop takes place only in the stator (stationary blades).
Generally, in the case of ORCs, axial turbines operate with pressure ratios lower than 8, but with high fluid velocities [44,45]. However, the impulse axial turbines can operate at higher fluid speeds while maintaining satisfactory efficiency.

2.4. Test Campaigns

The majority of the experimental tests were carried out with Novec649TM as the working fluid. Then, the performances of the ORC were compared with three other fluids presented earlier: HFE7000, HFE7100 and a 50/50 mixture between Novec649TM and HFE7000.
For a better understanding of the article, all results presented in Section 3 correspond to tests in Novec649TM following a quasi-constant hot and cold source (Table 3). Only the mass flow rate of the working fluid and sources change. In Section 4, all campaigns are considered (Table 4).

3. Results and Preliminary Analysis of the First Campaign

3.1. Nominal Working Point

In nominal operation, the ORC can produce a power of about 450 W for an electrical efficiency of the turbine of about 27% (Table 5).
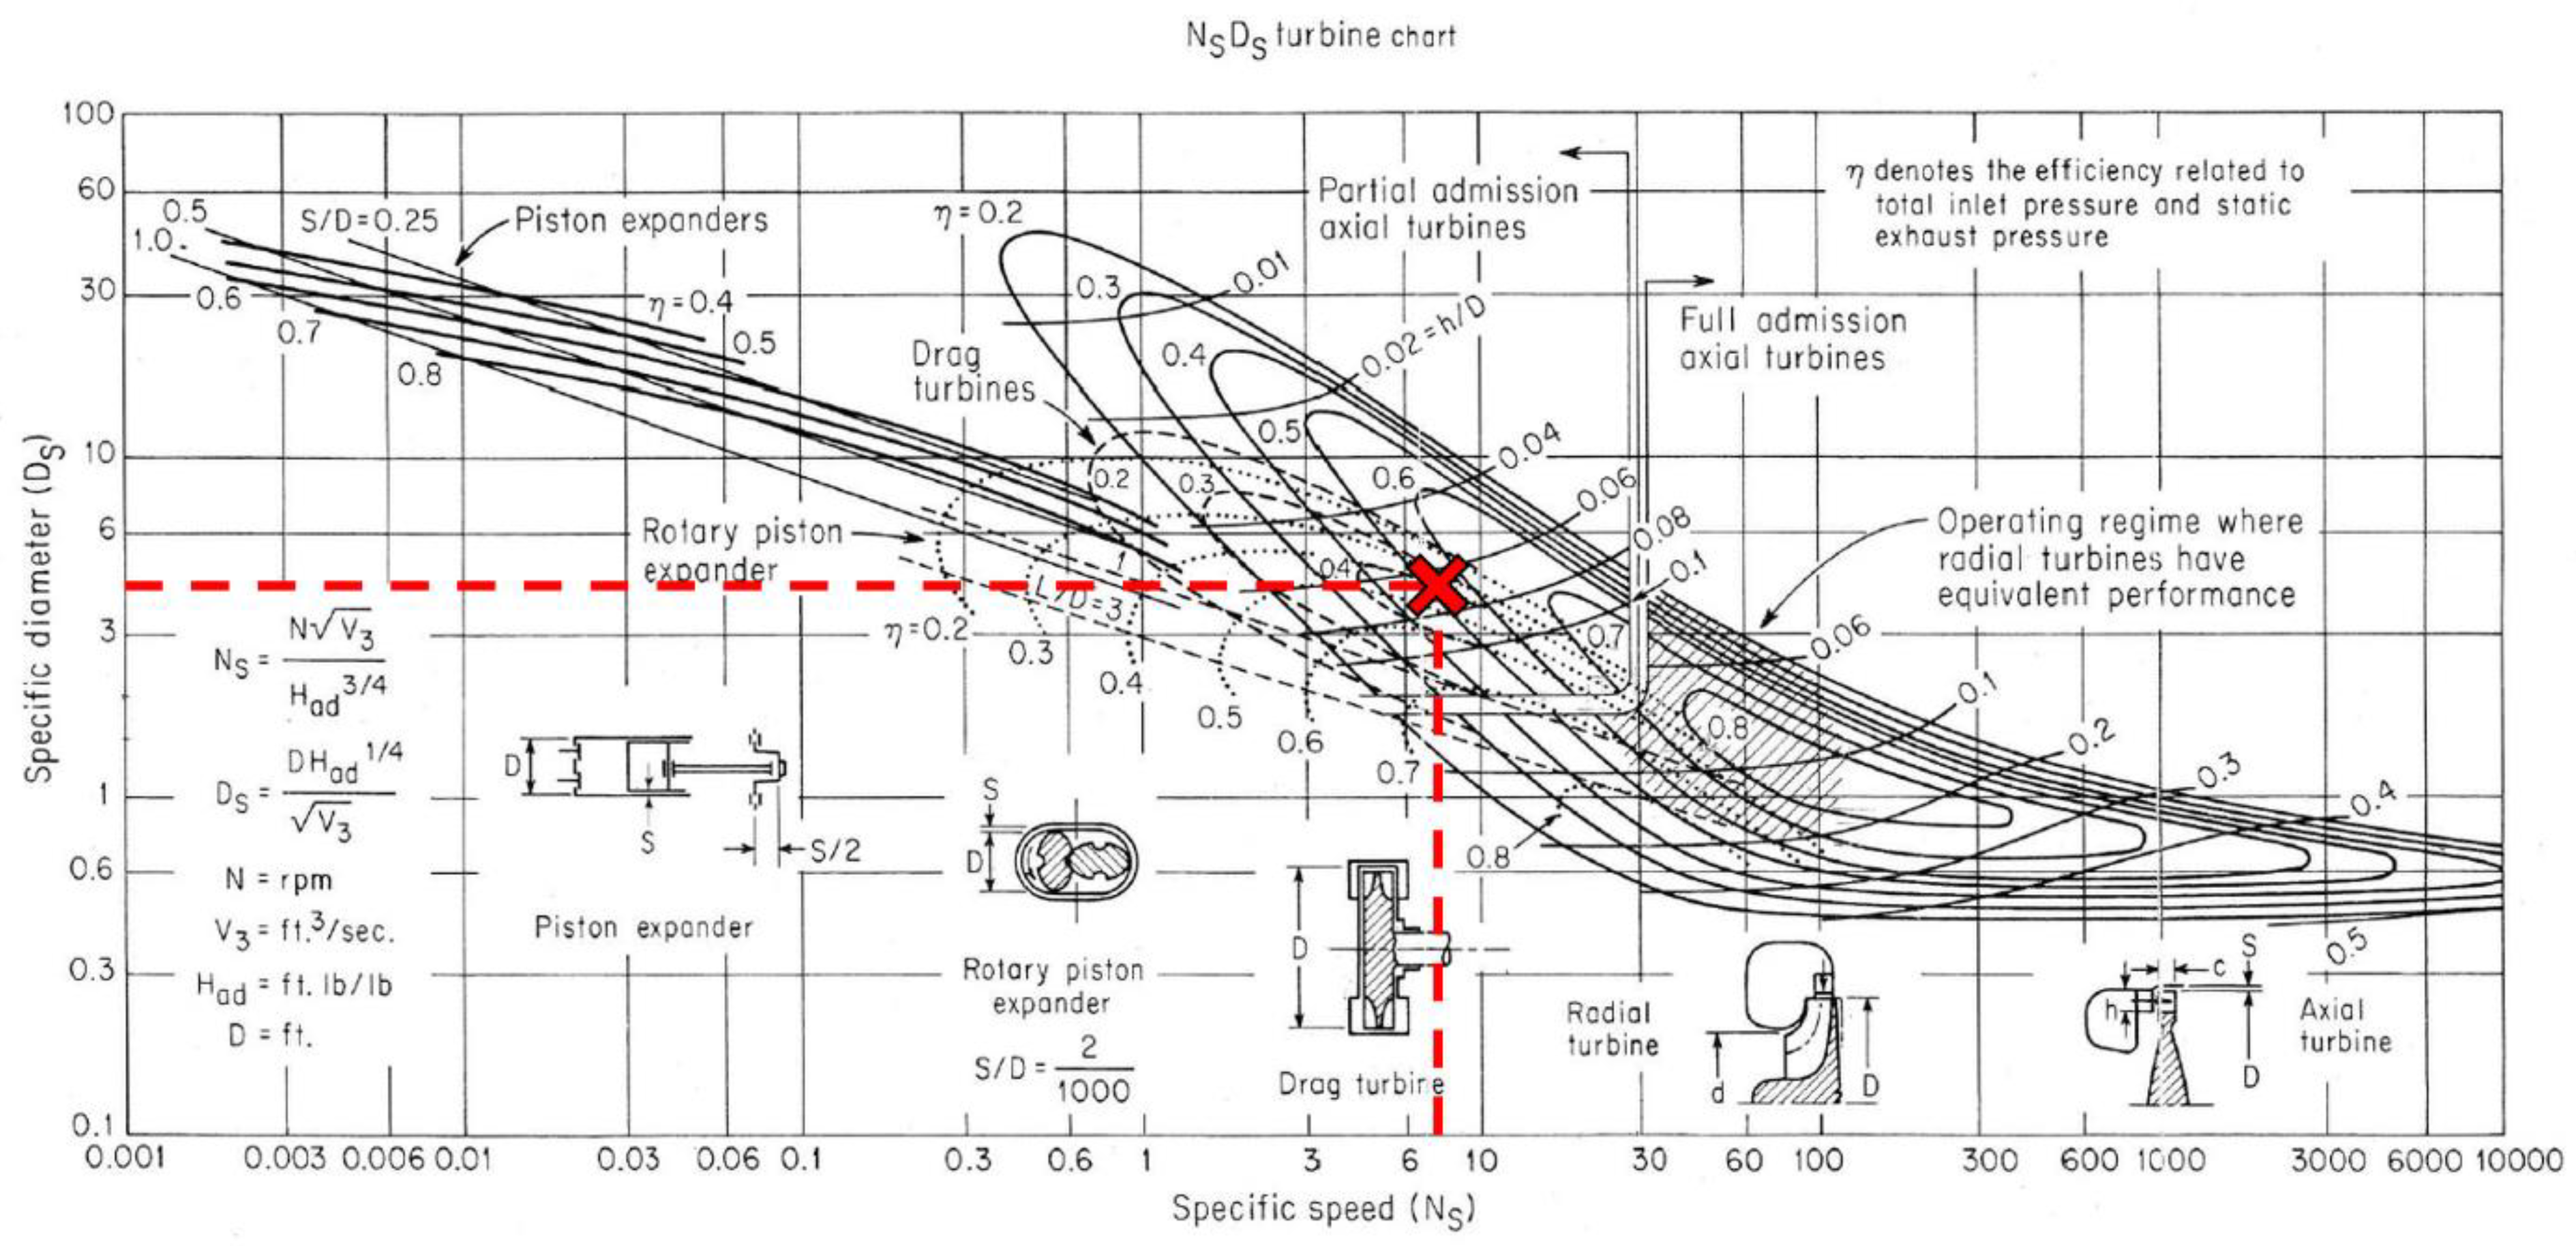
The similitude theory applied by Balje to expander technologies suggests a particular type of expander for a specific application. It is shown that two parameters are generally sufficient to fully describe the characteristics of turbo-machines: the specific diameter (   D s ) and the specific speed (   N s ), as represented in (Equations (1) and (2)) [46].
D s = D . Δ h i s 0.25 q o u t , i s ˙
N s = N r o t a . q o u t , i s ˙ Δ h i s 0.75  
The Balje diagram, illustrated in Figure 7, provides the specific speed N s and diameter   D s range at the design operation point for the different types of expansion systems. In the specific application, the conditions considered are detailed in Table 5. The calculated Ns and Ds, respectively around 7 and 4 (depending on the rotational speed and diameter supposed) suggested that the partial admission axial turbine was the best choice (with a total-to-static maximum isentropic efficiency of around 50%).
Thus, the ORC expander is a partial admission supersonic impulse axial turbine produced by the French manufacturer Enogia. This choice of expander makes it possible to avoid excessively small and unfeasible dimensions or too high and impracticable rotational speeds at the cost of increased partial admission losses. As a stator, the turbine has a convergent–divergent nozzle. The turbine’s partially admitted rate is in the order of several percentages.

3.2. Vapor Quality Estimation

Vapor quality corresponds to the mass fraction of vapor in a mixture. Vapor quality is a crucial parameter for two-phase condition evaluation. The vapor quality of the fluid at the turbine inlet is deduced from a heat balance on the evaporator component between the source and the working fluid ((3) and (4)).
Q ˙ e v a p = m ˙ w f   .   Δ h w f = m ˙ w f .   Δ h w f , s h   + m ˙ w f . x i n , t u r b . Δ h w f , l h
Q ˙ e v a p = m ˙ h s   .   Δ h h s
Thus, we are able to experimentally vary the quality of the working fluid at the turbine inlet between 0.5 and 1.
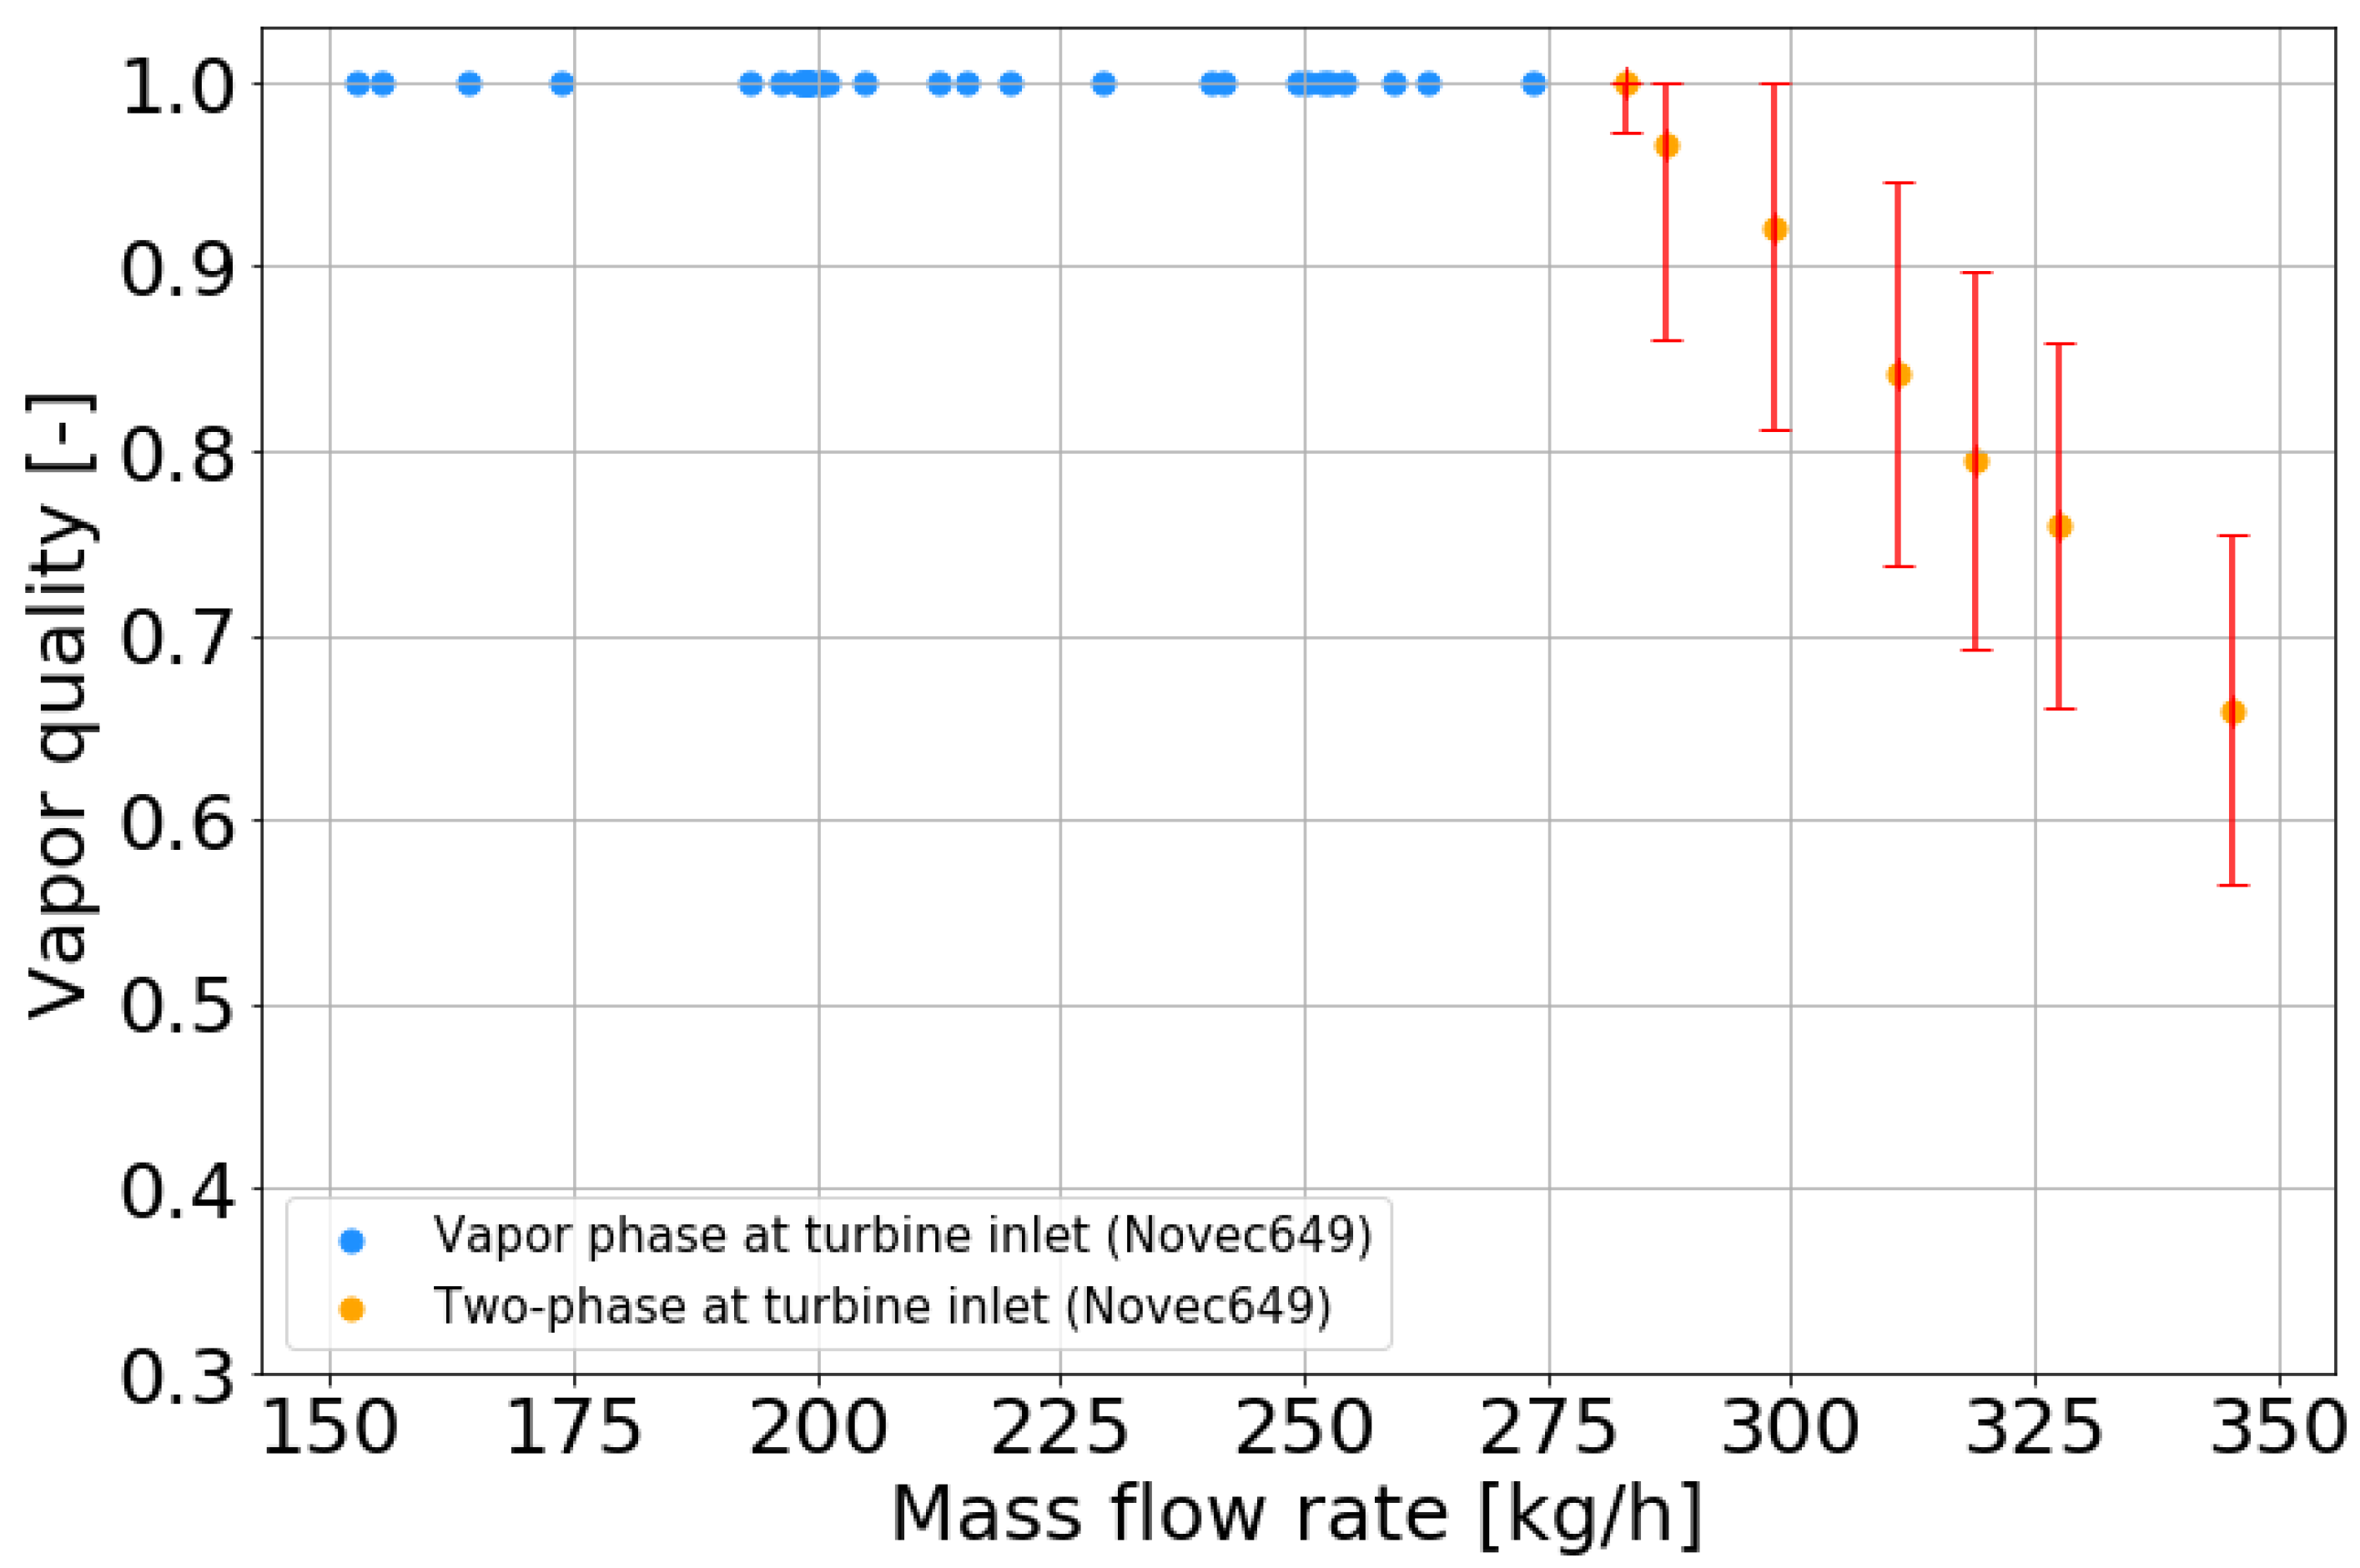
However, as explained earlier, in order to provide a clearer reading of the tests, the tests in Novec649TM were sorted with a quasi-constant hot and cold source. In Figure 8, we can observe that after a transition flow between single-phase and two-phase, the vapor quality is directly linked to the mass flow rate of the working fluid. The higher the working fluid mass flow rate is, the lower the vapor quality is. For the presented results, the vapor quality varies between 1 and 0.65. The high uncertainty level of the quality is due to the small temperature difference between inlet and outlet heat source.

3.3. Electrical Production

In Figure 9, we can observe that the electrical power produced by the turbo-generator increases with the mass flow rate of the working fluid until it reaches a maximum. After having reached this maximum, it decreases slightly with the working fluid mass flow rate. We can notice that the maximum point is reached during the transition of the fluid from the monophasic state to the diphasic state at the turbine inlet. By coupling the information in Figure 9 with Figure 8, for a vapor quality at the turbine inlet of 0.65, the power produced is 420 W, while at the maximum the turbo-generator could produce a power of 450 W, representing a decrease of 6.4%. It is thus interesting to notice that, even in the two-phase state, the turbo-generator continues to produce electrical power, with a slight decrease in comparison to the power produced in single phase.
In Figure 10, it is observed, in the same way as in Figure 9, that the high pressure within the ORC cycle increases with the flow rate of the working fluid. Once the working fluid is in two phase, the high pressure stabilizes.
At the last single-phase point (design point), the pressure ratio over the turbine is approximately 12. Most likely, it is equipped with a convergent–divergent supersonic nozzle. Its throat area is choking. In this case, the turbine inlet pressure is determined by the swallowing capacity of the turbine, i.e., by the fraction of the total mass flow rate which is vaporized. The liquid (droplets) does not have almost any volume. Therefore, in single phase, a linear increase in turbine inlet pressure with mass flow rate is observed. The further increase in mass flow rate is achieved at constant inlet pressure, because a fraction of the total mass flow rate is liquefied, with almost no volume.
The results in Figure 10 show the adaptability of the cycle in the case of two phase in the turbine. Furthermore, it can be deduced from this pressure stability that the only factor that affects the power output in the two-phase operation is the working fluid mass flow rate, and more precisely the liquid mass flow rate. Thus, it can be anticipated that the vapor mass flow rate on the last single-phase point is the same for all the two-phase points. The excess mass flow rate would be working fluid in liquid form.
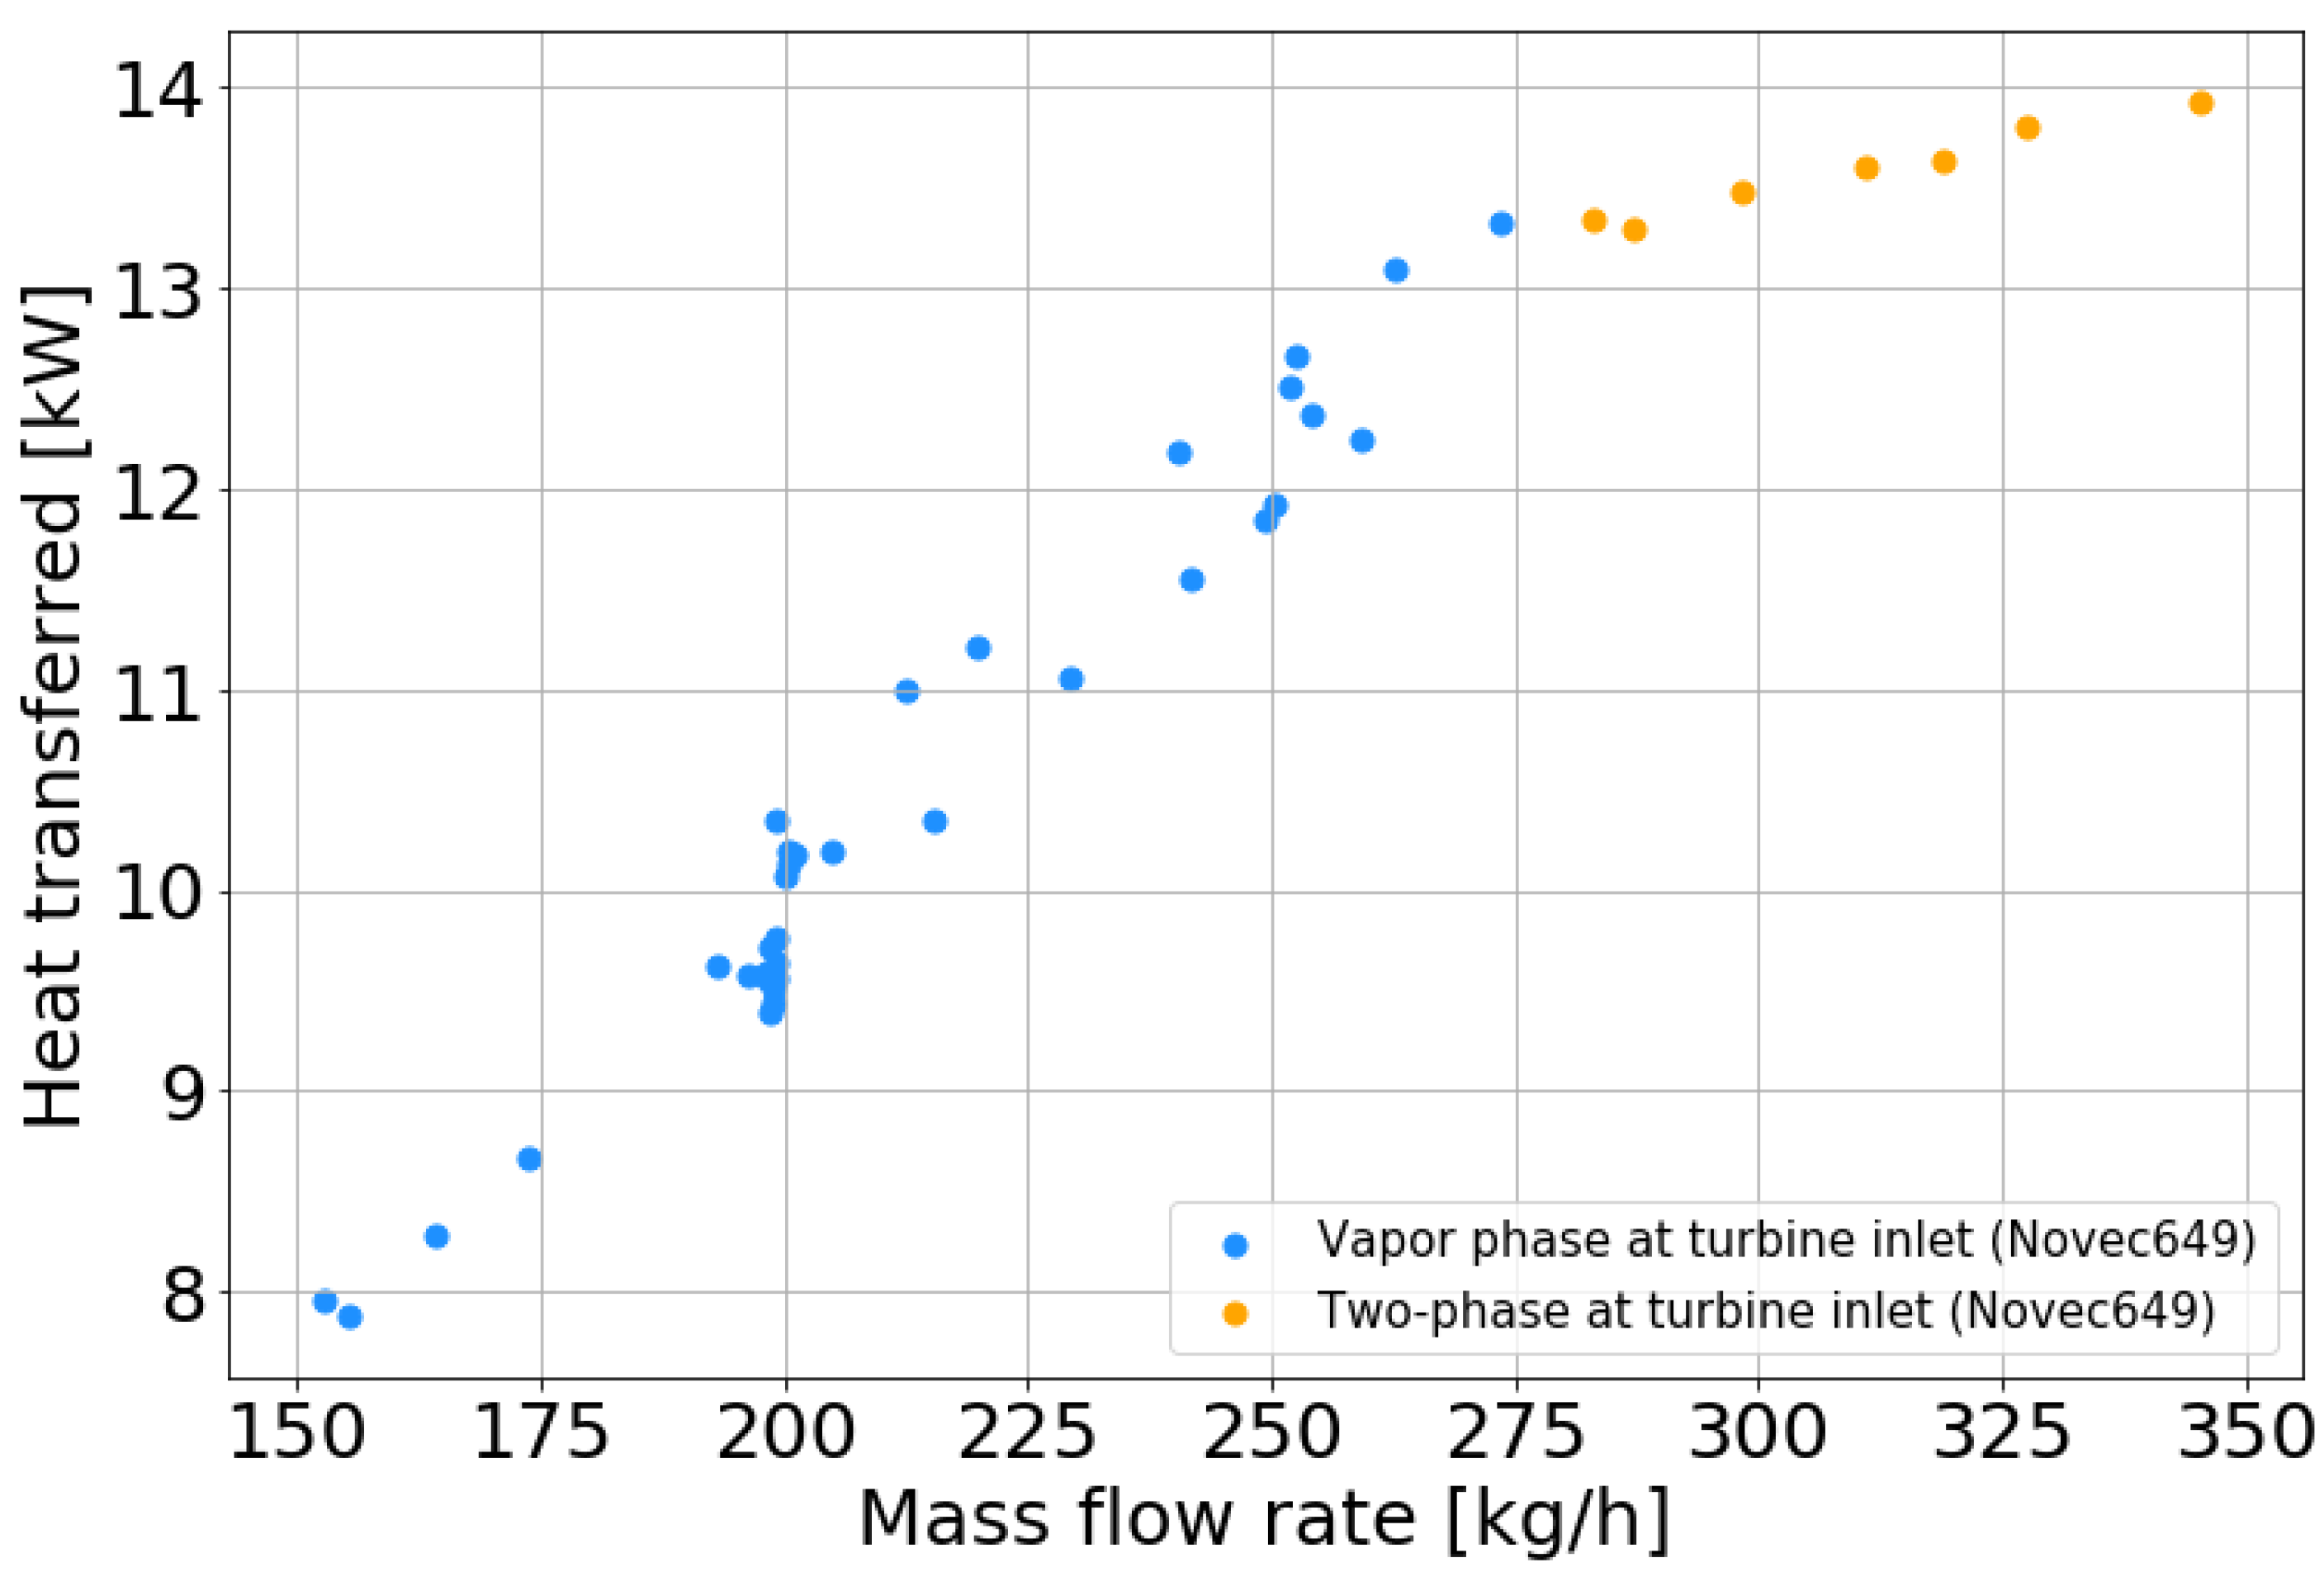
Moreover, in Figure 11, we can also observe that the transferred heat increases with the mass flow rate. Indeed, the augmentation of the working fluid mass flow rate increases the power exchanged at the exchanger until the exchange surface is no longer sufficient to evaporate the entire working fluid. However, even when the exchanger is no longer able to evaporate the entire working fluid, the total power exchanged continues to increase with the mass flow rate. In the two-phase operation, even though smaller than for the single-phase tests, the power transferred through the evaporator is still increased: 700 W for a quality down to 0.65, representing an improvement of 5% of heat transferred.
Hence, it can be added that the liquid heat transfer coefficient is higher than the evaporation heat transfer coefficient for Novec649TM at the corresponding pressure [36]. The tests for which the fluid leaves the evaporator with a high vapor quality correspond to a lower global heat transfer coefficient than the tests leaving the evaporator with a lower vapor quality.
We underline that even in the case of a two-phase entry in our turbine, the ORC continues to generate electricity at an acceptable level. We will now investigate the efficiency of the two-phase turbine to quantify efficiency variation.

3.4. Efficiency

In order to quantify the performance of the turbine, we focus on the electrical efficiency of the turbo-generator.
η t u r b = W ˙ e l e c , t g W ˙ i s , t u r b
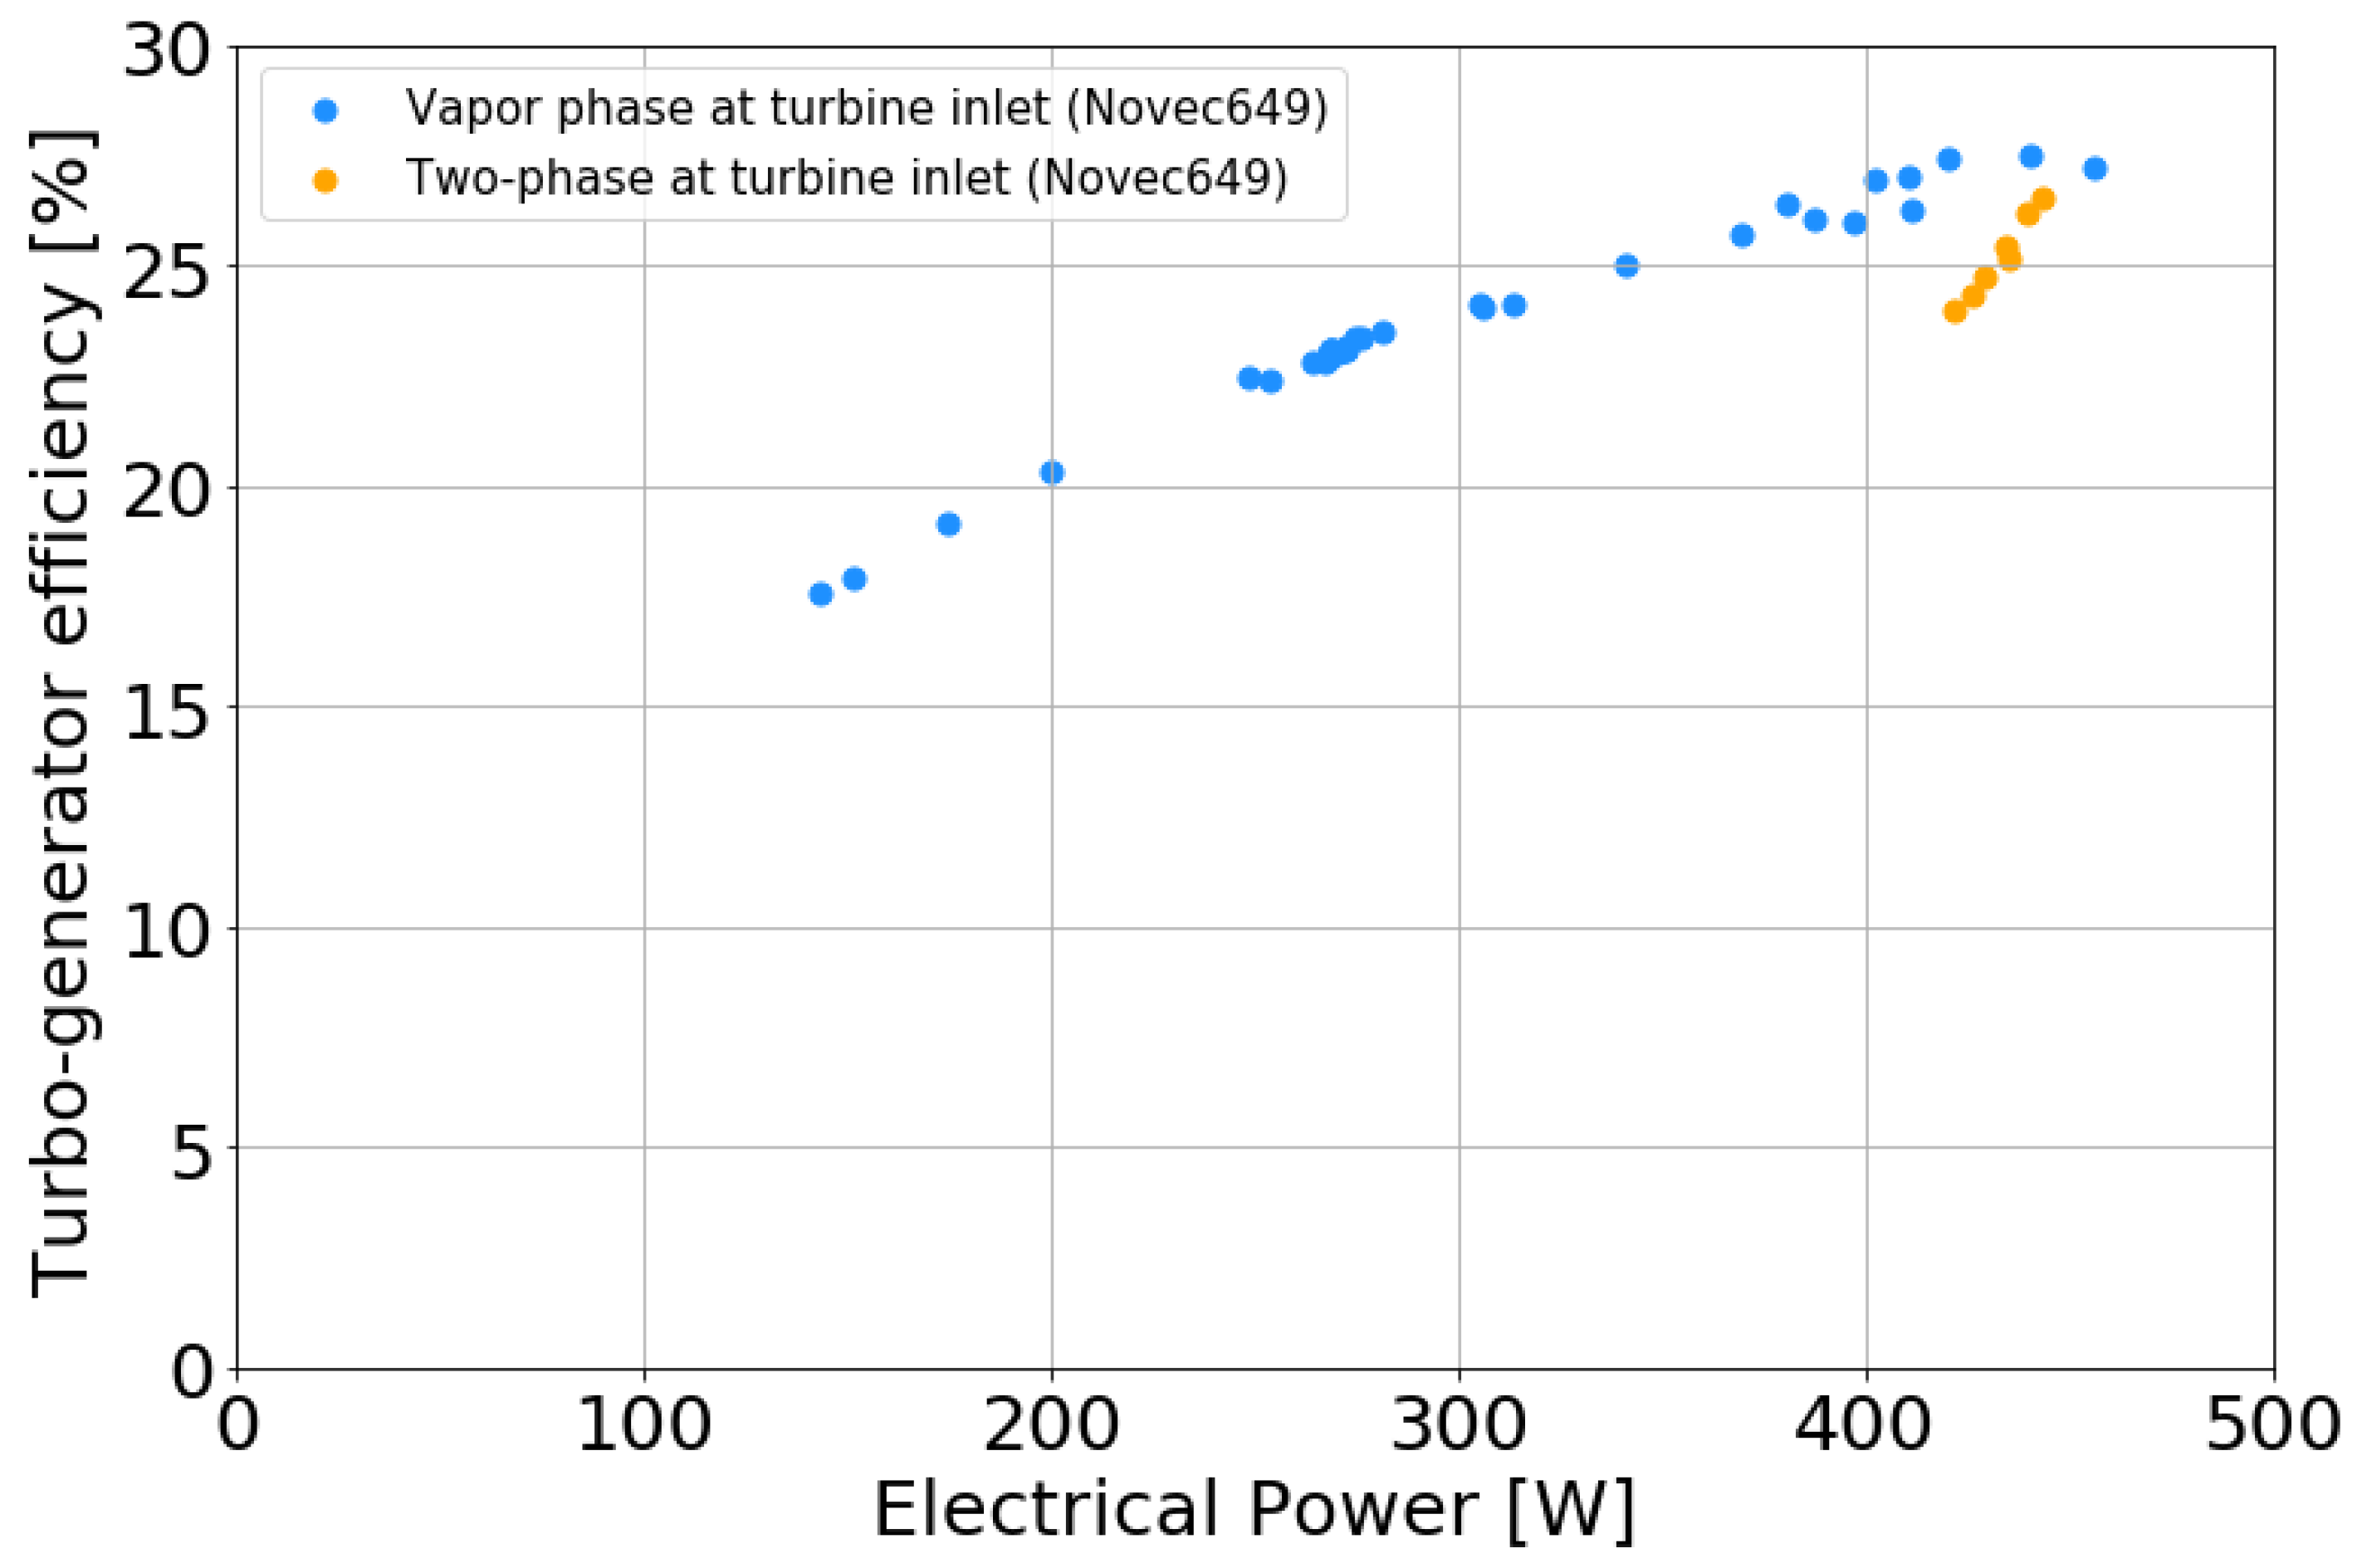
In Figure 12, it can be observed that the electrical efficiency of the turbo-generator increases with the power produced. We can also observe that the single-phase efficiency is, for any power, higher than the two-phase efficiency. Indeed, when changing from a single-phase to a two-phase fluid at the turbine inlet, the turbo-generator efficiency drops according to the vapor quality. Reducing the vapor quality from 1 to 0.65 leads to a decrease of four points of turbo-generator efficiency. Thus, even if the turbo-generator continues to produce power with a two-phase fluid flow, the efficiency of the turbo-generator in two phases will always be lower than the single-phase turbo-generator efficiency.
From a general point of view, these results demonstrate a high degree of adaptability of the ORC to a two-phase fluid condition at the turbine inlet. Indeed, although the electrical efficiency of the turbo-generator is lower in the two-phase condition, compared to its single-phase efficiency, the turbo-generator still produces significantly.
In Section 4, we will investigate the complete sets of data to confirm and quantify the role of the two-phase condition on electrical efficiency for different test conditions and fluids.

3.5. Vapor Mass Flow

In Figure 13, we can observe the evolution of the vapor quality as a function of the mass flow ratio between the vapor mass flow rate and the total mass flow rate. In the two-phase regime, the vapor mass flow rate was estimated by assuming that the vapor mass flow rate in all two-phase tests is equal to the vapor mass flow rate of the design test (last point in single phase). We can make this assumption because all of the two-phase tests were performed under constant conditions at heat sources and identical turbine inlet pressures and temperatures. We can notice that the vapor quality of the working fluid decreases with the ratio between the vapor mass flow rate and the total mass flow rate. This decreasing curve shape is of the form of a power curve (y = x α with α being between 1.5 and 2). This observation is in agreement with studies on nuclear turbines under critical mass flow rates and under two-phase conditions, which concludes on a quadratic relation between vapor mass flow rate, total mass flow rate and vapor quality [47]. This “model” is not expected to work for vapor quality close to zero due to changes in the working fluid behavior (liquid volume should be considered). Hence, due to the level of uncertainty, we propose to adopt the same relationship between vapor quality, vapor mass flow rate and total mass flow rate (Equation (6)): we consider this “model” as an accurate way to estimate the vapor quality at the turbine inlet.
x i n , t u r b = ( m ˙ v a p , t u r b , e s t i m a t e d m ˙ t o t , t u r b , m e a s u r e d ) α   with   α   2

4. Results and Analysis of All Tests

4.1. Mass Flow Rate Model: One-Phase, Two-Phase and Multi-Fluid Aspect

We can calculate the mass flow rate in the turbine by knowing the throat section of the turbine, the inlet and outlet pressures of the fluid and the intrinsic properties of the barotropic fluids [48].
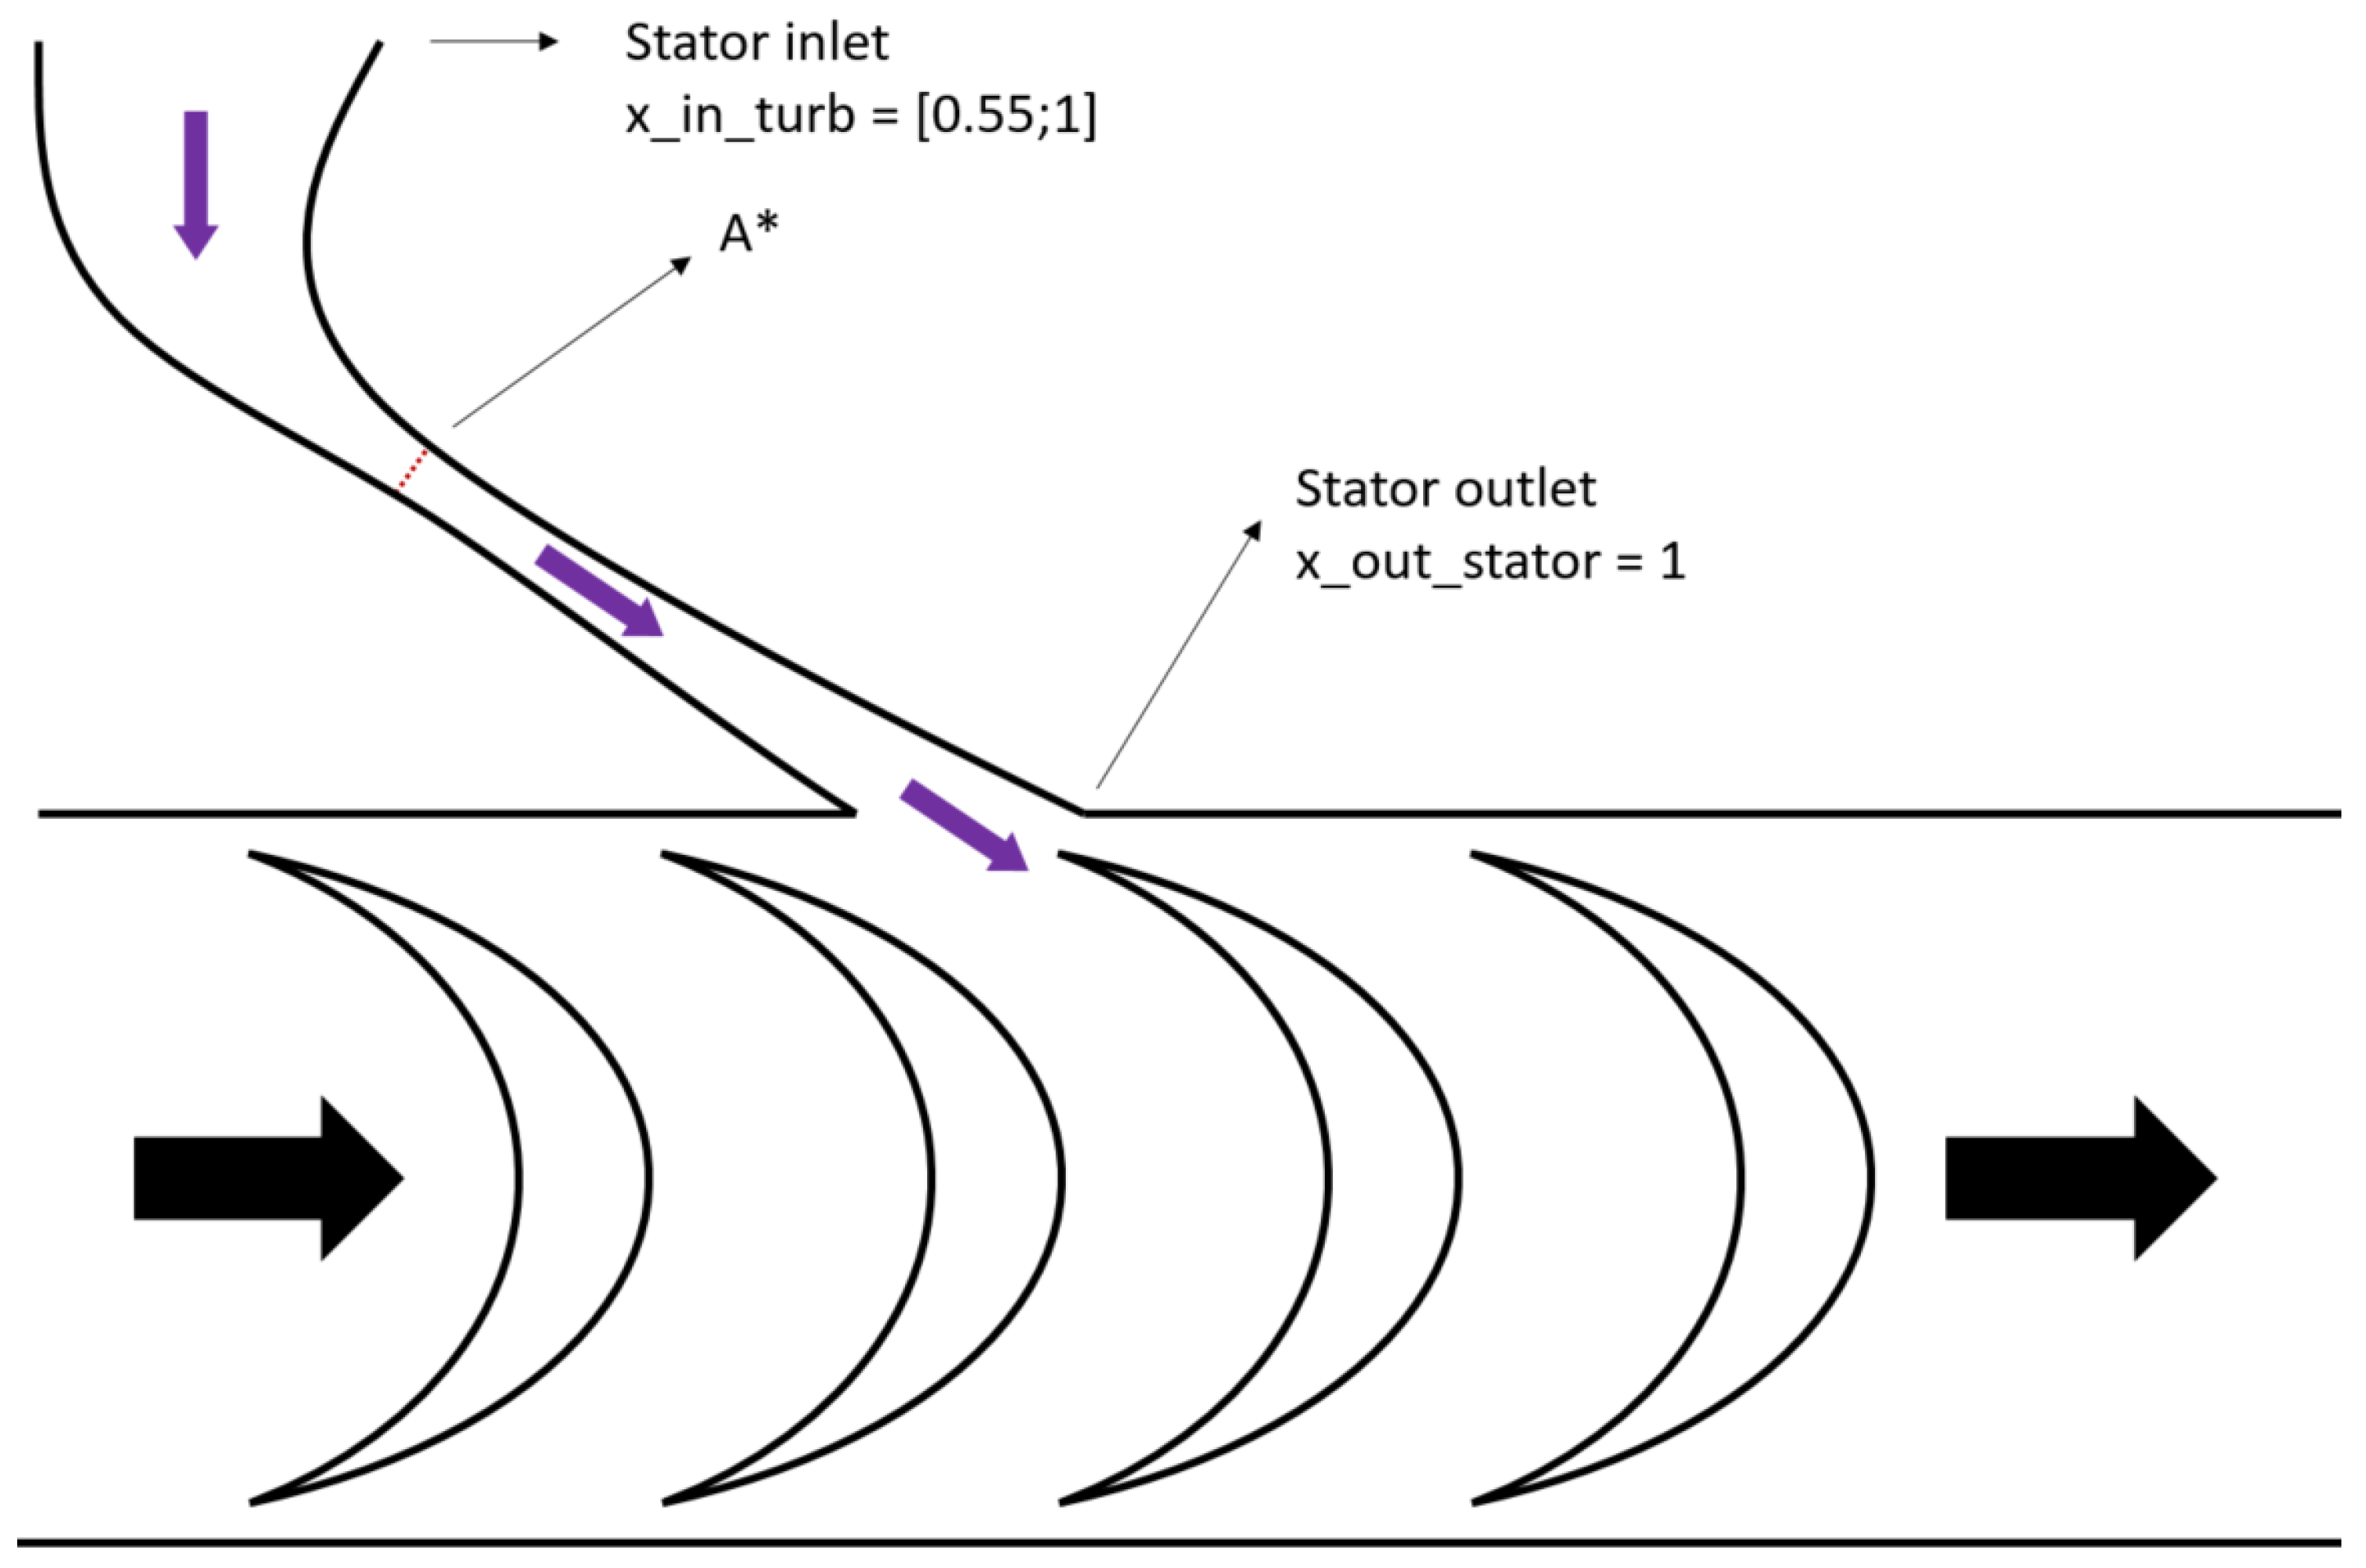
For brevity, only an overview of the model is given here. When the fluid passes through the throat section of the stator   A * , the Mach number is 1. This implies that the speed of the fluid in this section is equal to the speed of sound in the fluid. It is then, knowing A * , possible to determine the flow rate of the fluid flowing in the turbine (Equation (7)).
m ˙ v a p = A * . ρ i n , t u r b   . c i n , t u r b   .   [ 2 γ + 1 ] γ + 1 2 . ( γ 1 )
With ρ i n , t u r b as the stagnation density, c i n , t u r b as the stagnation speed of sound and γ as the polytropic exponent [48].
With this equation (Equation (7)), it was possible to estimate the mass flow rate of vapor circulating in the ORC for each of the two-phase tests. Then, by coupling the equation (Equation (6)) with the turbine mass flow rate prediction model (Equation (7)), it is possible to theoretically calculate the mass flow rate of fluid for every test (single phase or two phase).
m ˙ t o t = A * . ρ i n , t u r b   . c i n , t u r b   .   [ 2 γ + 1 ] γ + 1 2 . ( γ 1 ) x i n _ t u r b
Then, knowing that this theoretical mass flow rate model is taking into account the intrinsic properties of working fluids, it was evaluated for different working fluids (Figure 14).
It is therefore observed that the flow prediction model corrected with the vapor quality at the turbine inlet provides accurate results: +/− 10 % for 291 tests. It is thus very interesting to show that this method is suitable for different working fluids (Novec649TM, HFE7000 and HFE7100) as well as for mixtures of fluids (Novec649TM/HFE7000), for single-phase and for two-phase (quality ≥ 0.5) conditions at the turbine inlet.
Another way to interpret such results is to use (Equation (8)) as an indirect method to estimate the thermodynamic quality at the turbine inlet.

4.2. Efficiency Analysis

4.2.1. Single-Phase Condition at Turbine Inlet

Two standard dimensionless turbomachinery parameters are the total-to-static pressure ratio ( π ) and the specific speed ( N s ) [49].
π = P i n , t u r b , t o t a l P o u t , t u r b , s t a t i c
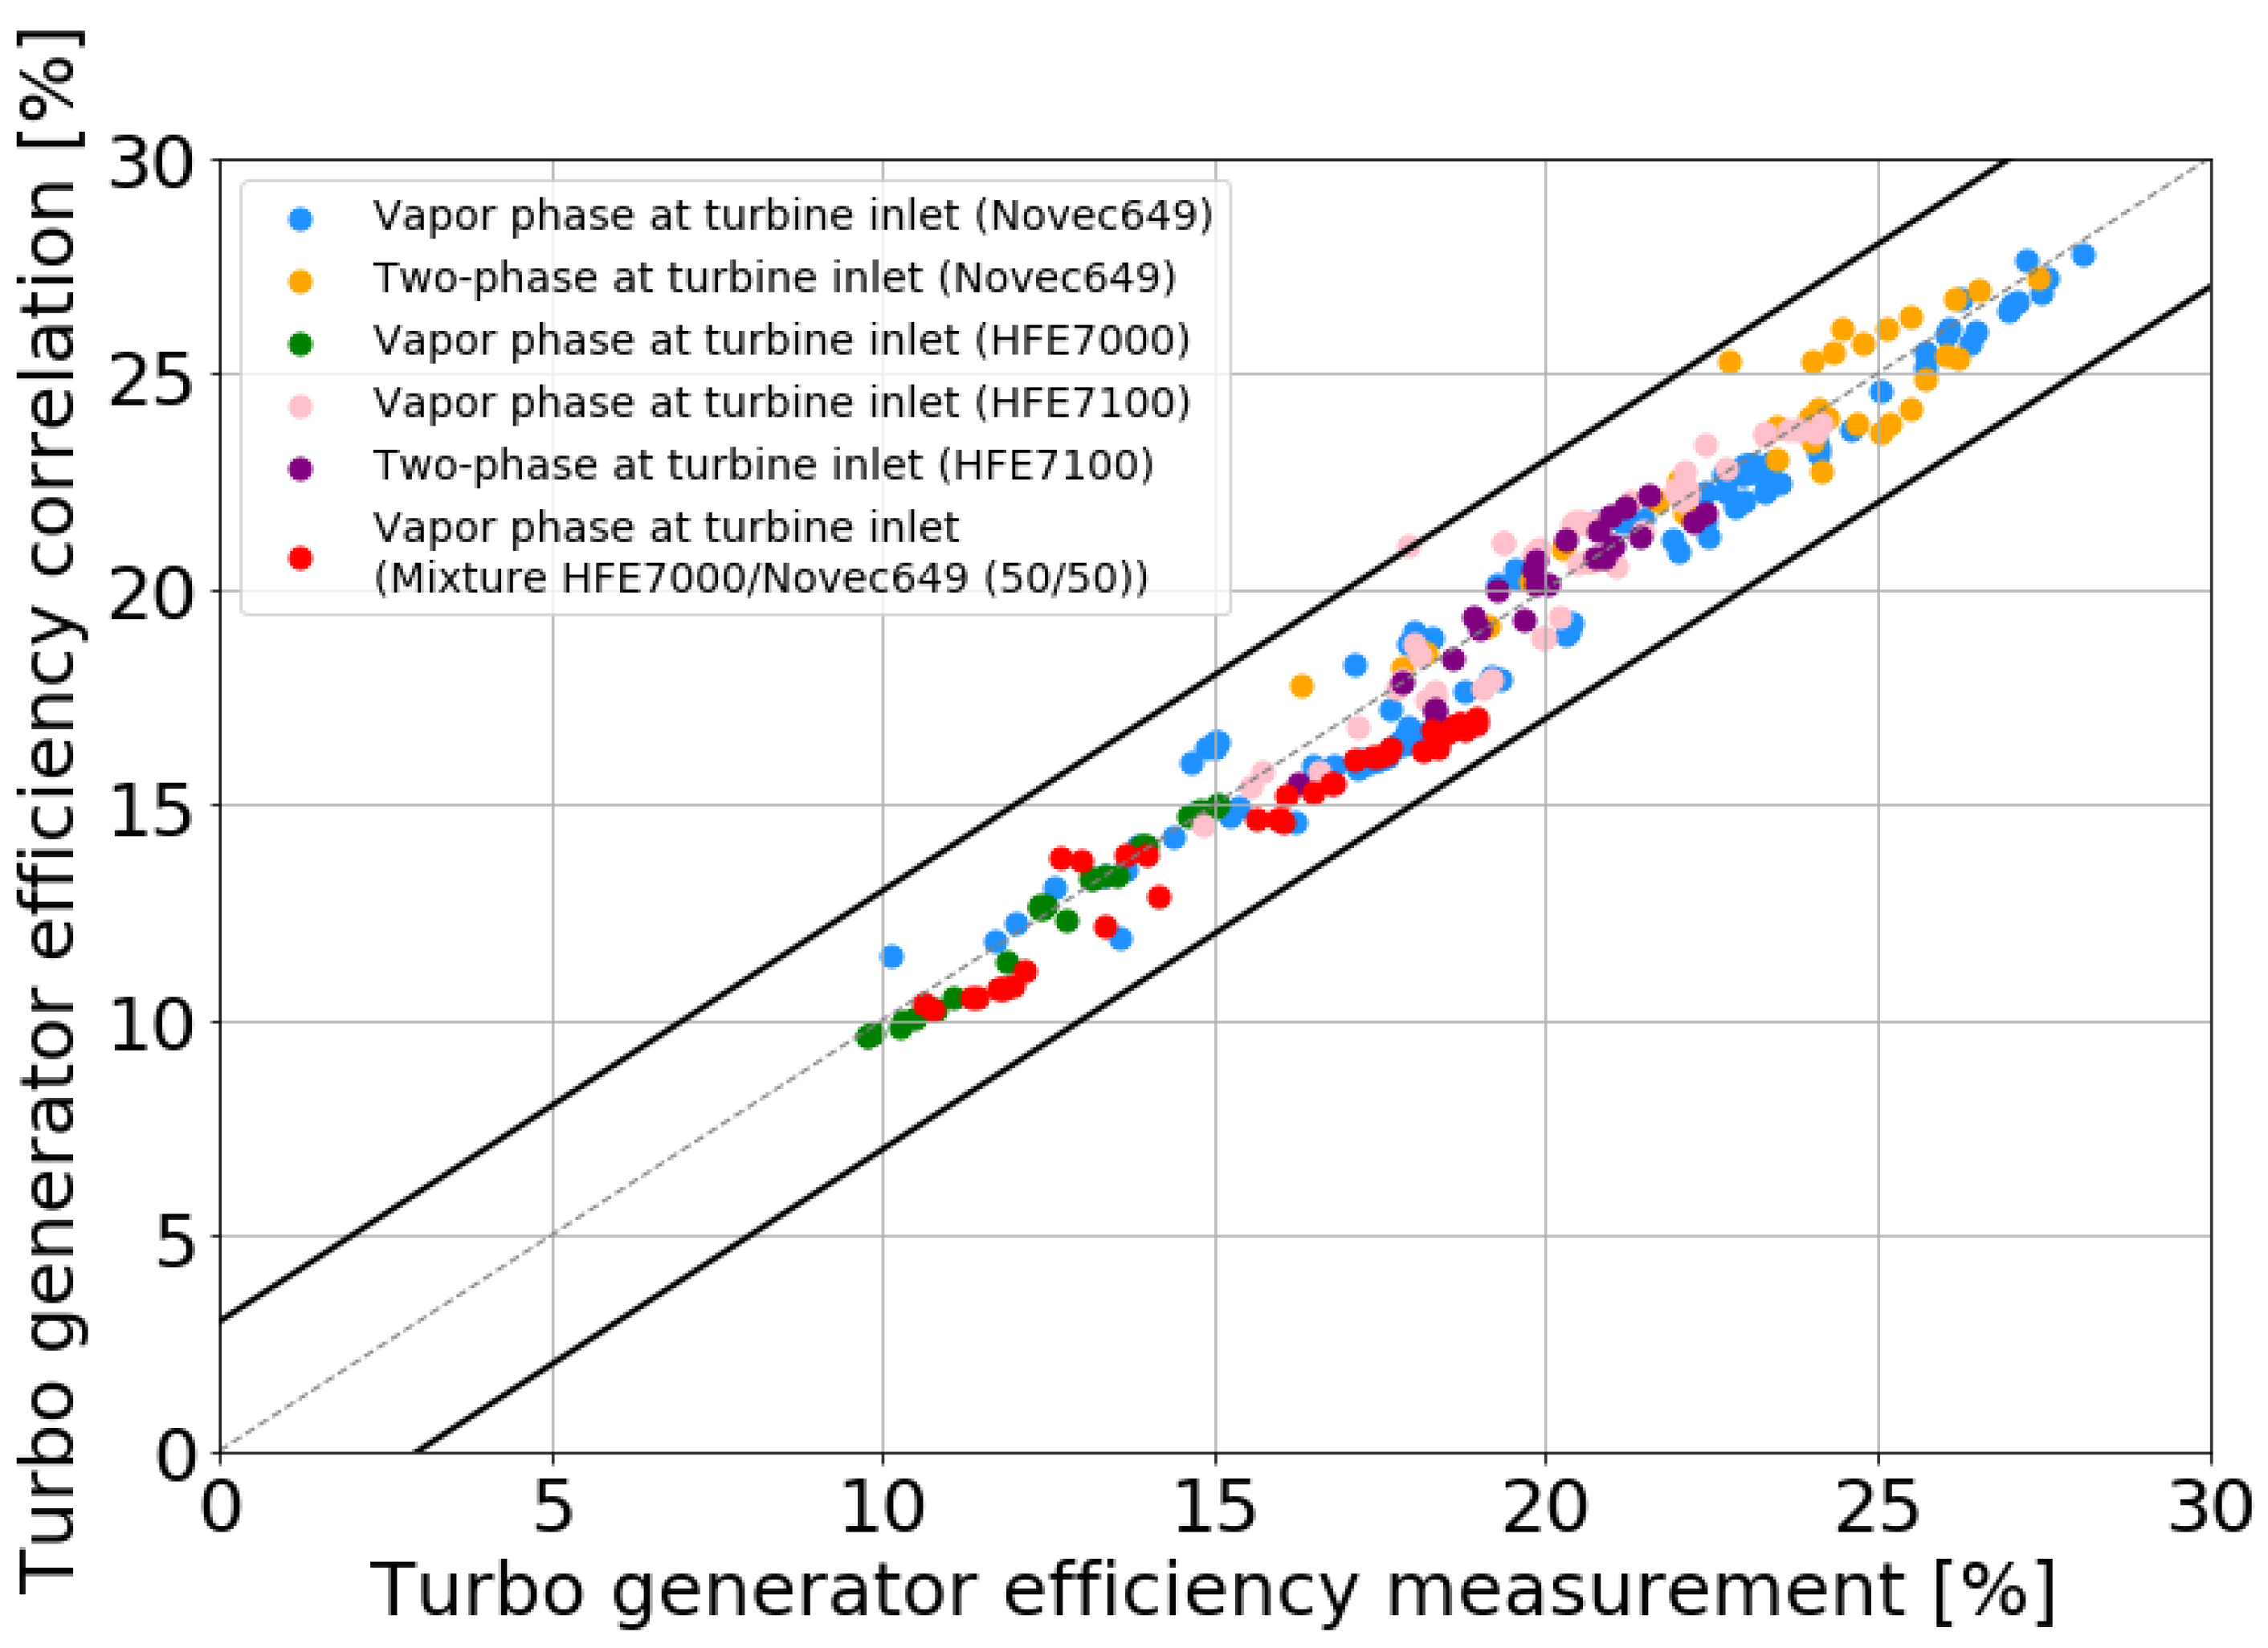
Using these two dimensionless parameters, it was possible to determine a correlation between the electrical efficiency of the turbo-generator for single-phase tests in Novec649TM, HFE7000, HFE7100 and a zeotropic mixture of 50%/50% mass composition between Novec649TM and HFE7000.
η t u r b , d r y   = a . N s + b . N s 2 + c π + d π 2
The result of the a, b, c and d optimization, in the one-phase condition ( x i n _ t u r b = 1 or superheated condition), is presented in Figure 15. We indicate the multi-fluid aspect of this correlation within a range of three points of efficiency.

4.2.2. Two-Phase Condition at Turbine Inlet

As seen in Figure 12, a two-phase condition at the turbine inlet reduces the efficiency of the turbo-generator: the lower the vapor quality in the tests, the lower their efficiency. Therefore, in order to include the two-phase conditions in the correlation, a fifth parameter was added: the fluid vapor quality at the turbine inlet ( x i n , t u r b ). The single-phase part of the correlation remains the same: a, b, c and d have the same values as in Section 4.2.1.
η t u r b , w e t = a . N s + b . N s 2 + c π + d π 2 + e . ( 1 x i n , t u r b )
This empirical correlation was set up with a range of validity of fluid vapor quality between 0.5 and 1. The optimization result of parameter e is presented in Figure 16. We underline that the accuracy of the correlation is similar to the one-phase correlation obtained in Section 4.2.1.

4.3. Two-Phase Expansion

The present experimental results illustrate the ability of the turbine to operate in a two-phase regime and to continuously produce electricity at an acceptable level. Moreover, as explained in the introduction, it is possible, with the use of a dry fluid, to flash the entire fluid before it enters the rotor. Indeed, according to the theoretical work of White, the internal geometry of the stator of a radial turbine allows for the entire working fluid to be flashed [13].
Thus, we can draw a parallel between White’s radial turbine study and the present axial turbine study. Indeed, the working fluid may be accelerated (Ma < 1) in the convergent part of the nozzle (here, the stator) until it reaches sound speed (Ma = 1) in the throat area. Downstream, in the divergent part of the nozzle, it may be accelerated (Ma > 1). Acceleration causes pressure to drop and vapor quality to increase, resulting in a complete flash from a two-phase state to a pure vapor state at the stator’s outlet. At the rotor inlet, the fluid may be in a low-pressure vapor state (Figure 17).
Thus, the turbine’s ability to operate in a two-phase regime may prevent rotor turbine blade erosion caused by liquid droplets. A specific long-term study could confirm this. This ability provides a more reliable response of the ORC system to evaporator fouling or large off-design conditions, for example.
Moreover, the total capital costs of the ORC in the case of heat recovery at medium temperature level remains very high [12]. It is therefore interesting to keep in mind that it is possible to reduce the size of the heat exchanger if partial evaporation is permitted. As shown in Figure 11, for the same evaporator size, running the evaporator in two phase allows it to operate on a wider range of hot sources.
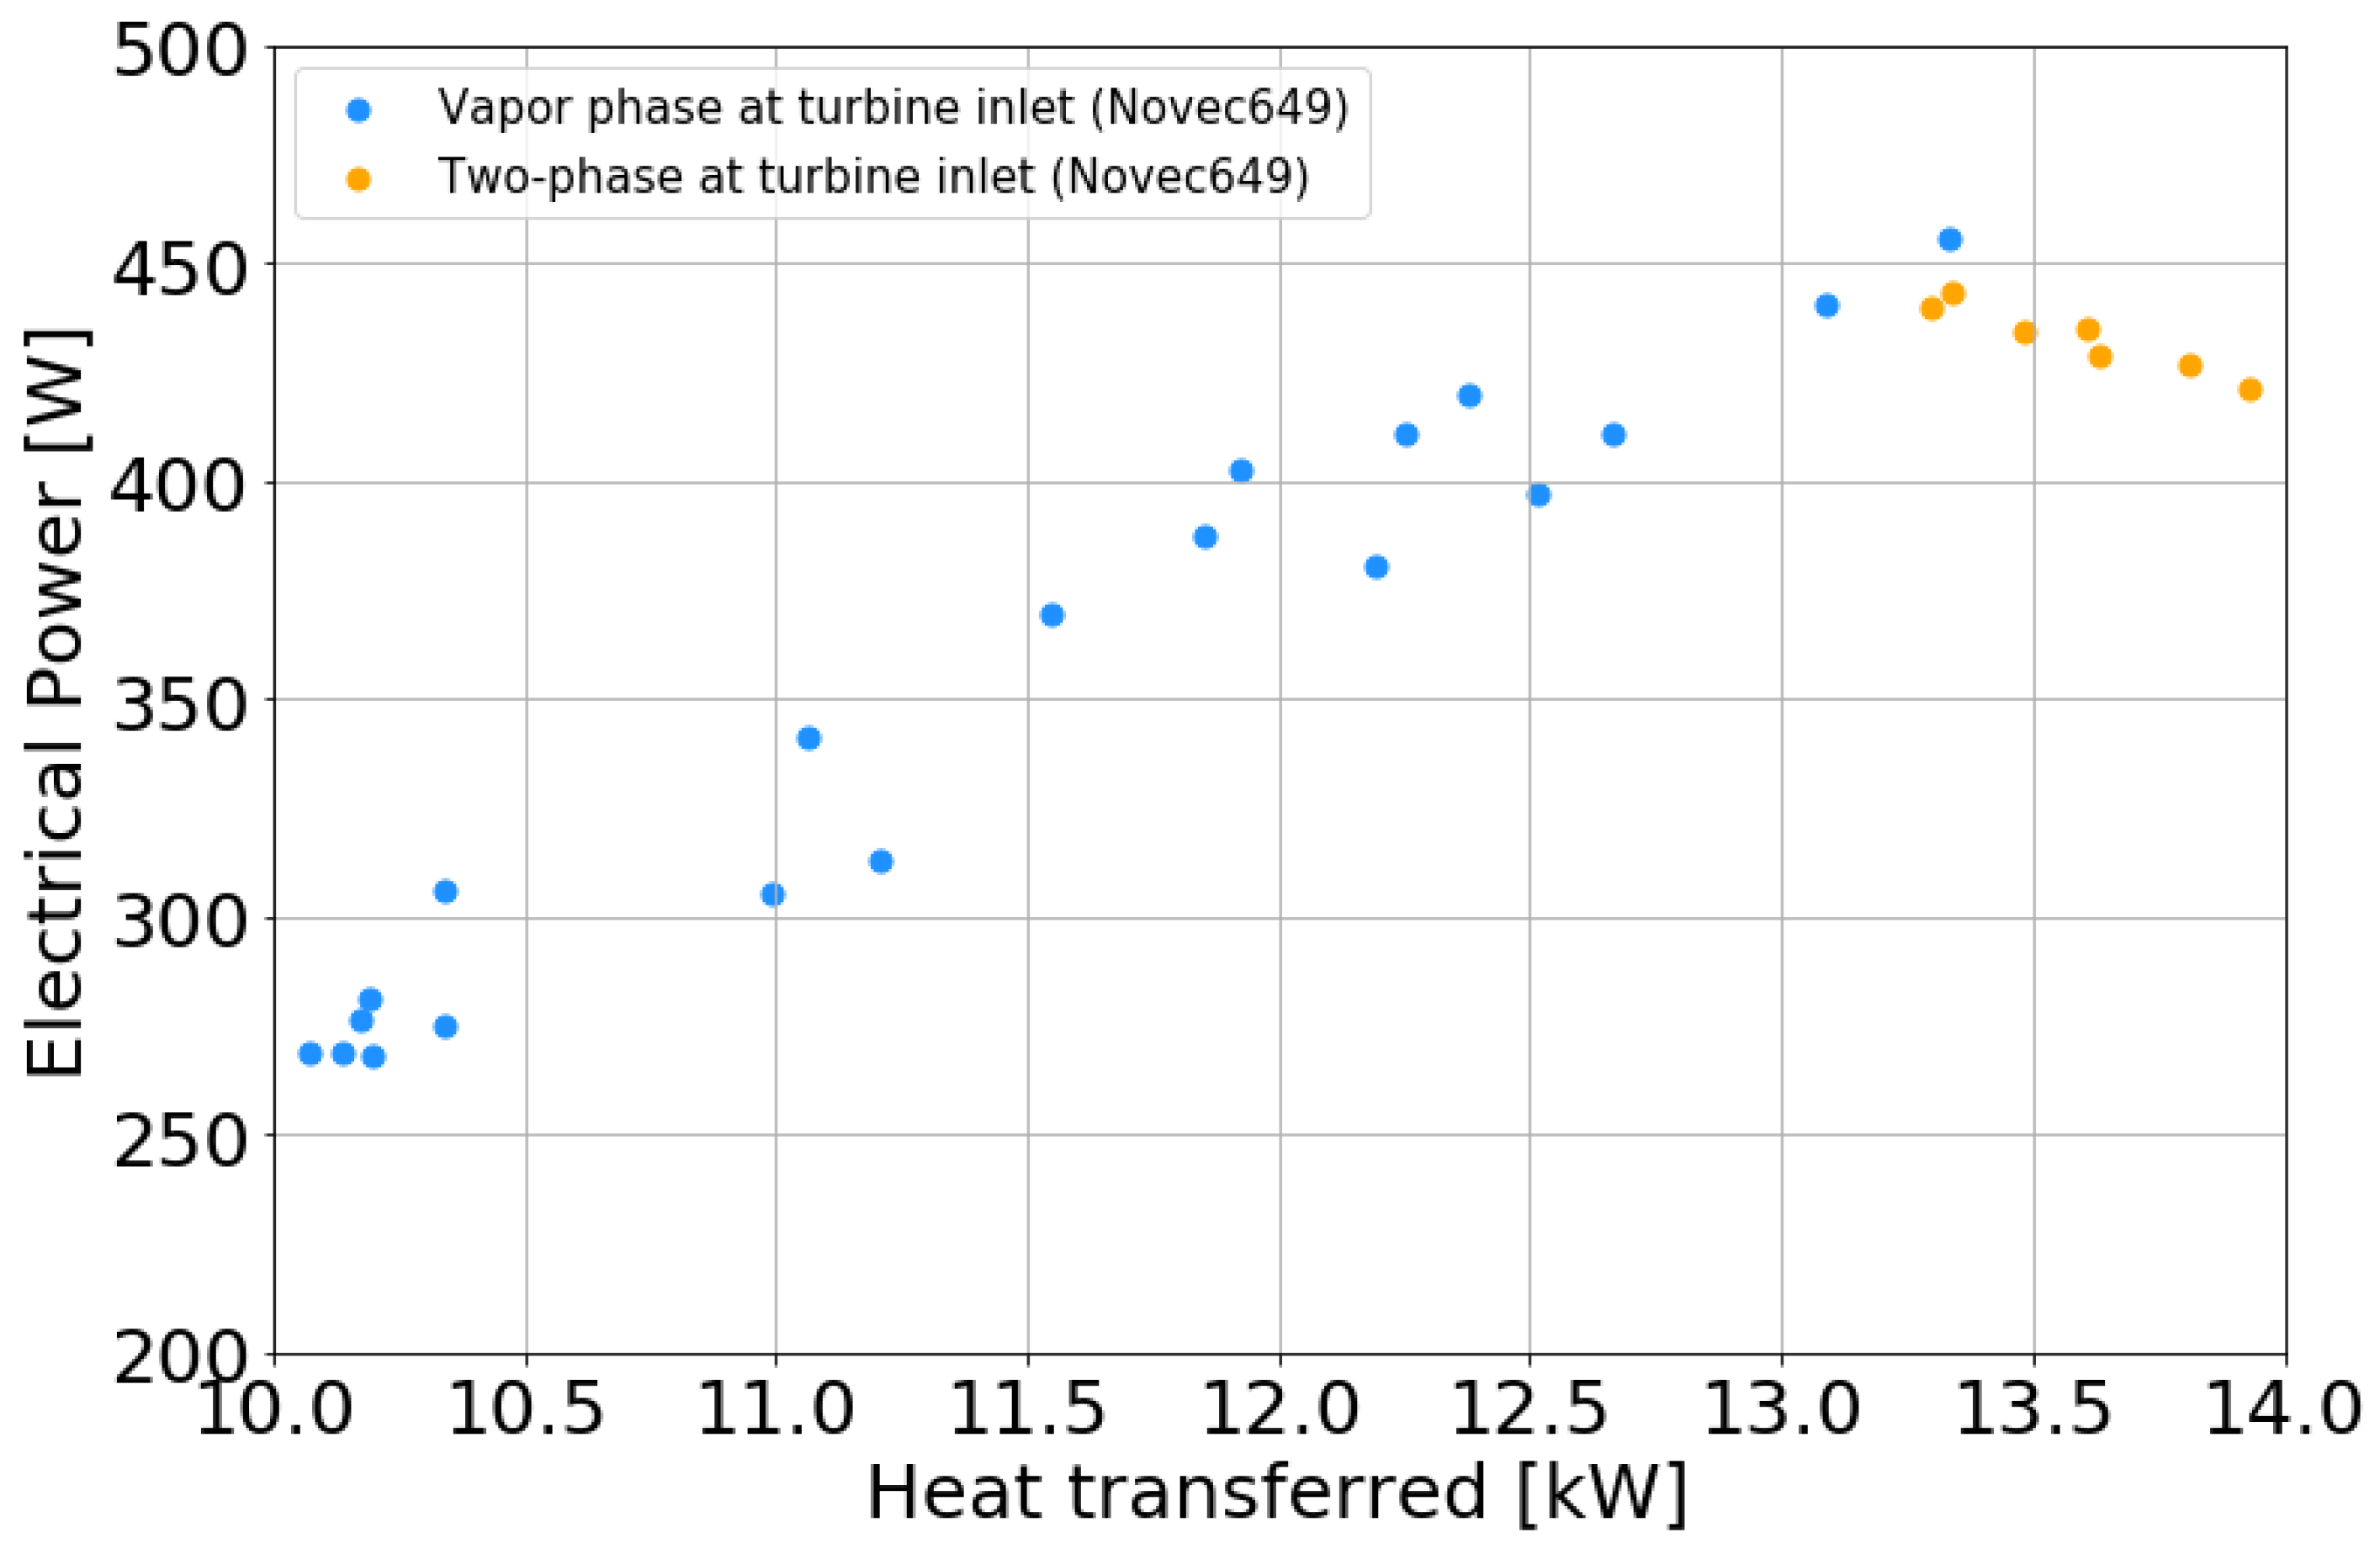
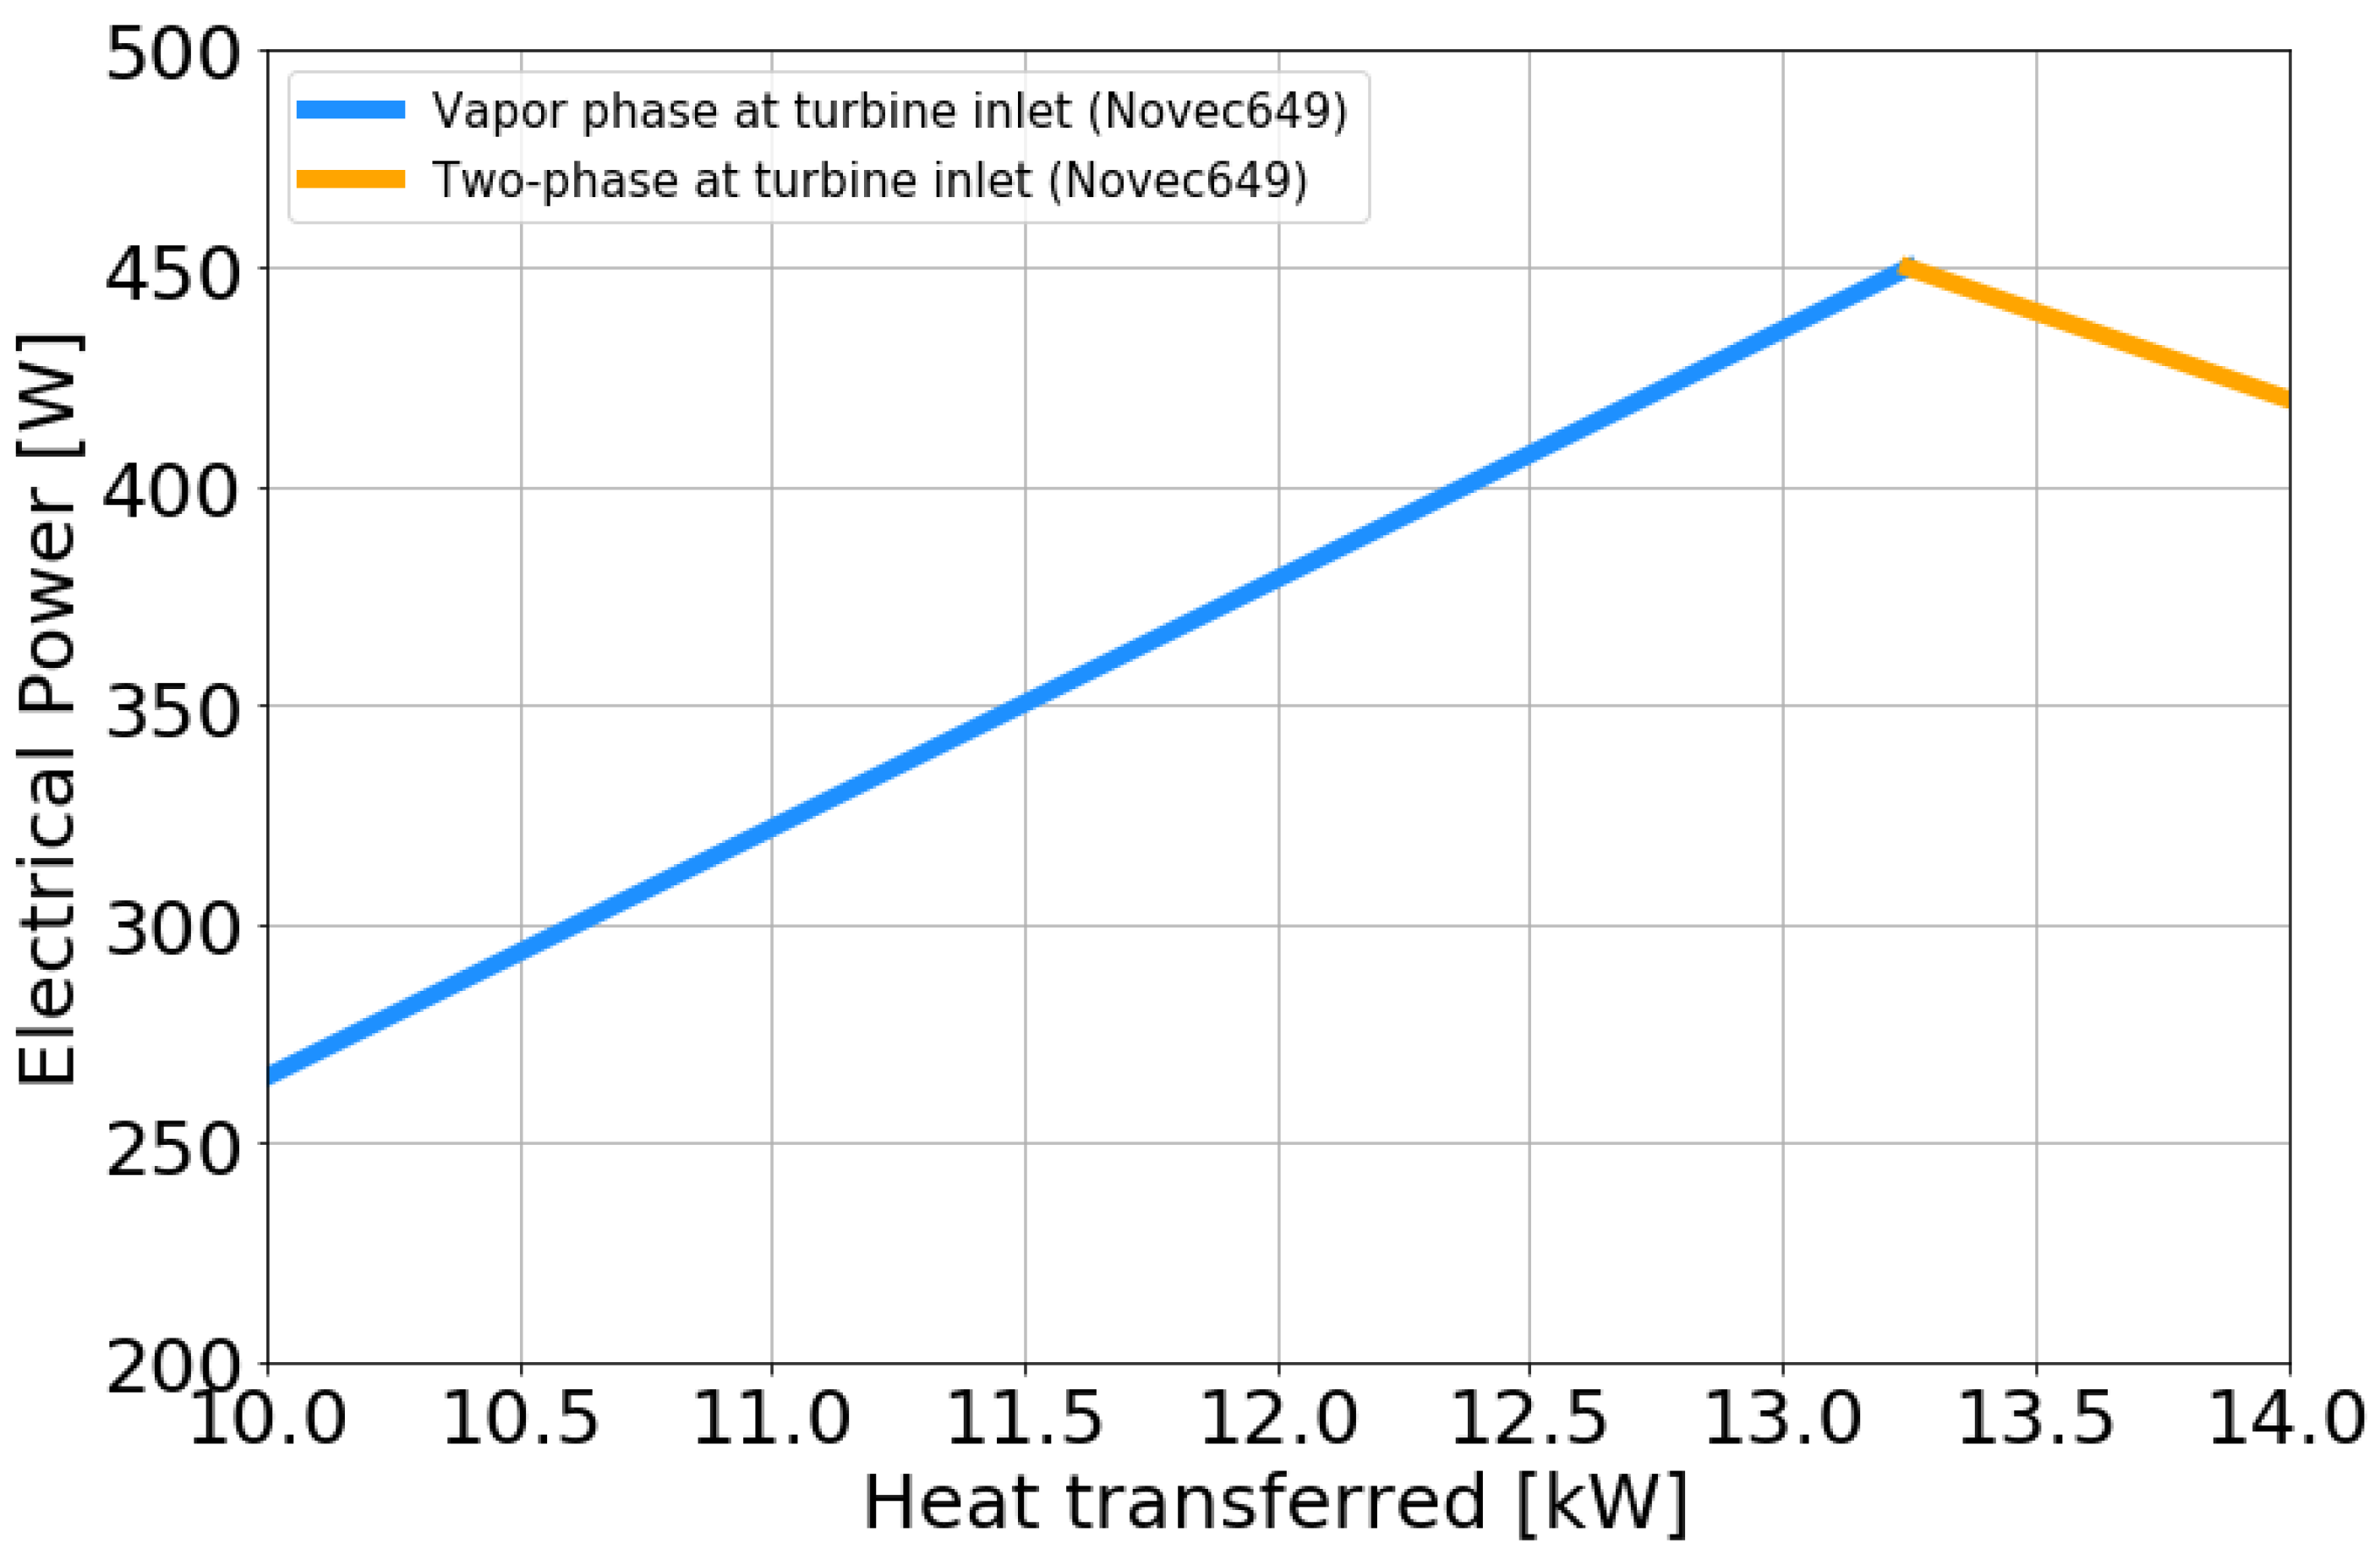
By plotting the electrical production of the ORC based on the hot source and by increasing the mass flow rate of the fluid circulating in the ORC, we can observe that the electrical production increases with the heat transferred at the hot source (Figure 18). Then, in the same way as shown in Figure 9, the ORC reaches a maximum of production during the passage from a single-phase to a two-phase regime. Two production curves can thus be drawn: the first one in a single-phase and the second one in a two-phase regime (Figure 19).
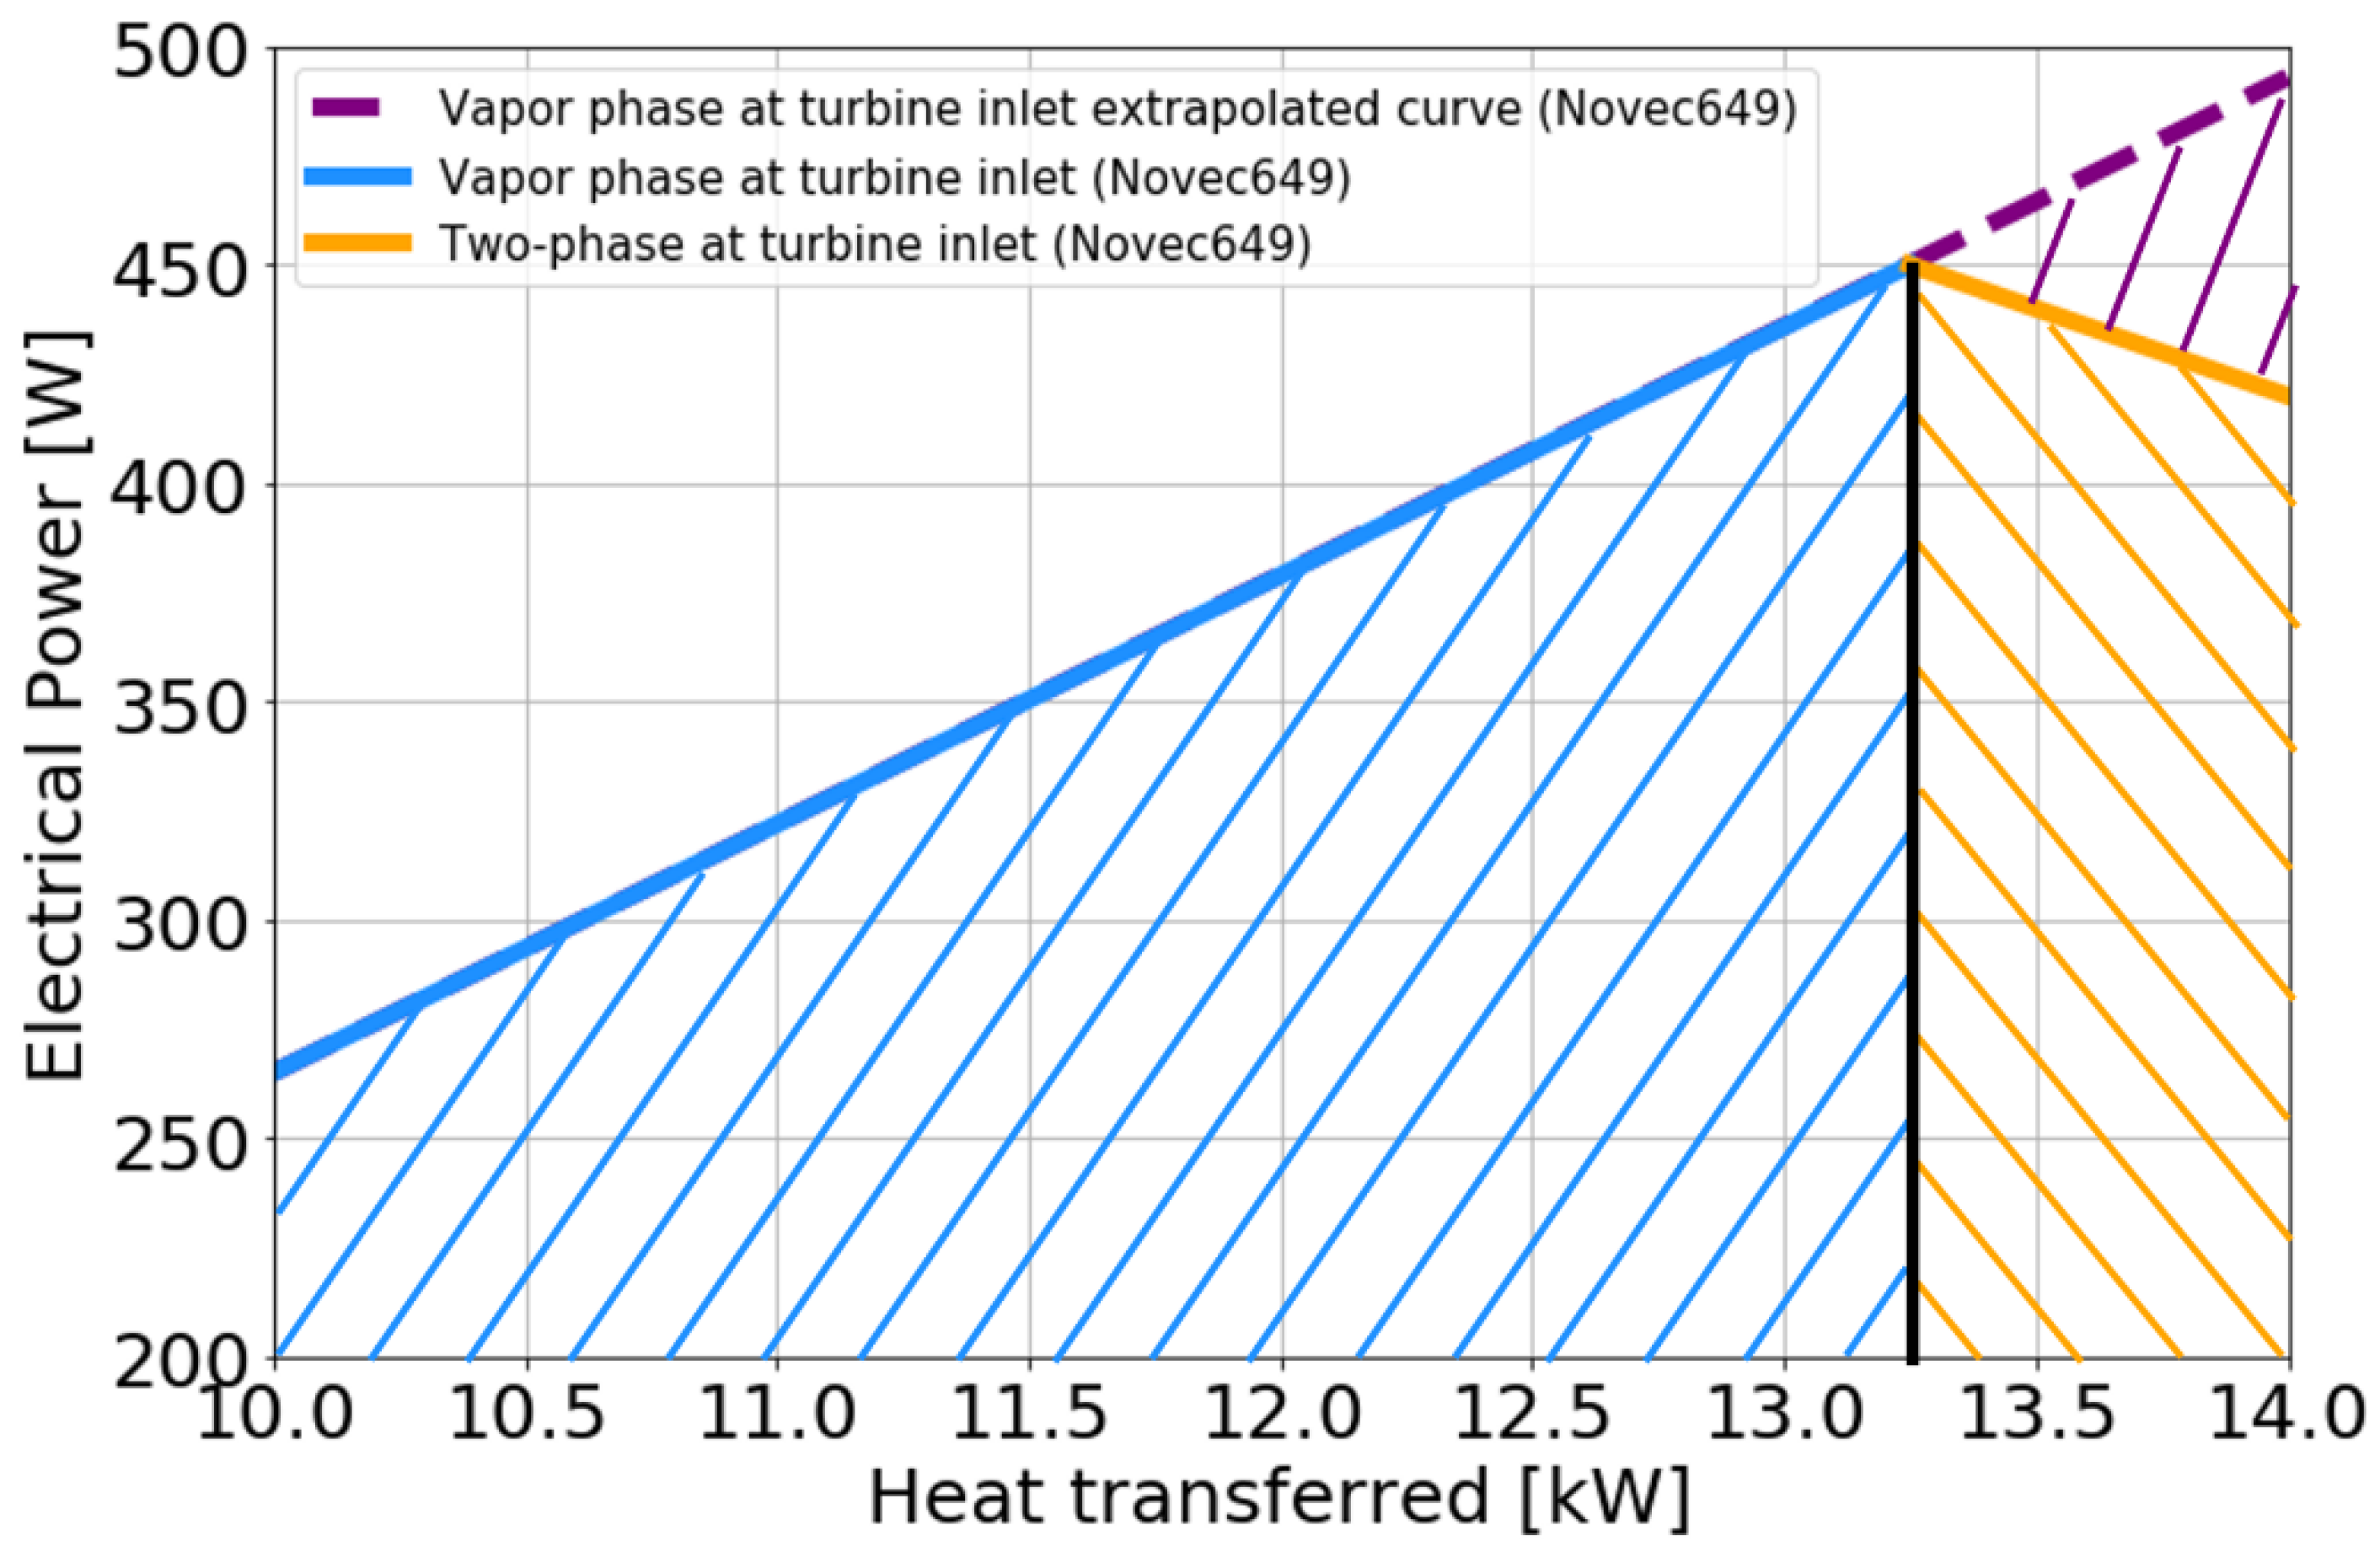
Based on this conversion profile, it can be interesting to compare different production cases based on different assumptions. This purely illustrative comparison relies on a simple hypothesis of a regular heat transfer profile:
  • Case 1: The turbine is only designed for single-phase operation. In this situation, only the blue part of Figure 20 makes electricity production possible and the maximum heat transferred at the evaporator is of about 13.3 kW.
  • Case 2: The turbine is designed for a single-phase and two-phase operation (case studied in this article). In this situation, the electrical production zone in Figure 20 corresponds to the orange and blue zones, and the maximum heat transferred at the evaporator is of about 14kW.
  • Case 3: The turbine is designed for a single-phase operation and the evaporator is redesigned to be of a larger size. In this situation, the electric production zone in Figure 20 corresponds to the orange zone, the blue zone and the purple zone, and the maximum heat transferred at the evaporator is of about 14kW. The single-phase production line of this case corresponds to the continuity of the turbine production line studied in this article.
Thus, if we compare case 1 with case 2, we can notice that for the same evaporator, it is more profitable to have the possibility to produce in two-phase conditions. We can estimate that operating the heat exchanger in a two-phase regime may lead to produce 20% more (the average electrical power increases from 293 to 369 W) for a heat source range between 10,000 and 14,000 W and for an equal-time repartition of the heat source (Table 6).
Then, if we compare case 2 and case 3, we can notice that electrical production increases slightly from 369 W to 376 W in case 3, but an increase in evaporator size is mandatory. Thus, even if the power that can be produced by the turbine will always be greater, if we remain on electric production with a single-phase fluid, the total capital cost will be higher due to the evaporator surface. For waste heat recovery and geothermal applications, the evaporator component is generally a technical challenge and expensive equipment.
However, the gain associated with the two-phase condition also has some limits: for an increase in consumption of 700 W hot source (Figure 18), the quality of the fluid varied from 1 to 0.65. This increase in the hot source range is thus limited by the quality of the fluid and cannot be extended over a very large hot source range.
As a conclusion, thanks to the possibility of two-phase conditions, a new axis of optimization between ORC size and electrical production has emerged. This optimization will depend on the source condition and the fluid used.

5. Conclusions

The organic Rankine cycle (ORC) technology is an efficient way to convert low-grade heat from renewable sources or waste heat for power generation. The partial evaporated organic Rankine cycle (PEORC) can be considered as a promising alternative as it can offer a higher utilization of the heat source. An experimental investigation of a small ORC system used in full or partial evaporation mode is performed. The work focuses on the behavior of an axial turbine, which is first characterized in a superheated mode that corresponds to standard ORC behavior.
Next, the experimental behavior of the micro axial turbine (with partial admission) in two-phase conditions is studied by increasing the mass flow rate circulating in the ORC. Partial evaporation of the fluid keeps on producing power. The efficiency decrease due to the two-phase turbine inlet condition is quantified and considered as sufficient. As an illustrative example, electrical power was reduced, at 6.4% lower with a vapor quality of 0.65 at the turbine inlet, than for a power produced with a superheated vapor. Nevertheless, for the same conditions, the thermal power exchanged at the evaporator is increased by 5% for the same surface.
A semi-empirical correlative approach involving traditional non-dimensional turbomachinery parameters (specific speed, pressure ratio) can accurately describe turbine performances in one-phase conditions. The semi-empirical correlative approach was completed to take into account the partially evaporated turbine inlet condition for various fluids, including pure fluids and zeotropic mixtures.
These recent achievements put forward the increase in the reliability of the ORC thanks to the operation of a turbine in two-phase conditions. They also make it possible to add more flexibility during the ORC’s design phase by reducing the size of the evaporator and then decreasing the total capital cost of the ORC without highly reducing the power produced by the turbine.
This work will provide experimental data for the development of numerical models able to describe the complex internal flow of an axial turbine with a partially evaporated inlet condition.

Author Contributions

Conceptualization, G.L., N.T., N.C., Q.B. and F.M.; methodology, G.L., N.T. and N.C.; formal analysis, G.L., N.T. and N.C.; investigation, G.L., N.T. and N.C.; writing—original draft preparation, G.L., N.T. and N.C.; writing—review and editing, G.L., N.T., N.C., Q.B. and F.M.; supervision, N.T., N.C. and F.M. All authors have read and agreed to the published version of the manuscript.

Funding

This research received funding from the Atomic Energy and Alternative Energies Commission (CEA) and Electricité de France (EDF).

Acknowledgments

The authors would like to express their gratitude to the Atomic Energy and Alternative Energies Commission (CEA) and Electricité de France (EDF).

Conflicts of Interest

The authors declare no conflict of interest.

Nomenclature

SymbolsSubscripts
A * Critical section stator(m2)elecElectric
cSpeed of sound(m. s−1)evapEvaporator
Δ h Enthalpy difference(J.kg−1)hsHot source
DDiameter(m)inInput
DsSpecific diameter(-)isIsentropic
ηEfficiency(-)lhLatent heat
γPolytropic exponent(-)liqLiquid
m ˙ Mass flow rate(kg.s−1)outOutput
NRotation speed(tr.min−1)rotaRotation
NsSpecific speed(-)shSensible heat
π Pressure Ratio(-)totTotal
PPressure(Pa)tgTurbo-generator
Q ˙ Thermal power(W)turbTurbine
qVolume flow(m3. s−1)vapVapor
ρ Density(kg. m−3)wfWorking fluid
W ˙ Turbine electrical power(W)
x Vapor quality(-)

References

  1. Astolfi, M. 3—Technical options for Organic Rankine Cycle systems. In Organic Rankine Cycle (ORC) Power Systems; Macchi, E., Astolfi, M., Eds.; Woodhead Publishing: Sawston, UK, 2017; pp. 67–89. ISBN 978-0-08-100510-1. [Google Scholar]
  2. Obi, J.B. State of Art on ORC Applications for Waste Heat Recovery and Micro-cogeneration for Installations up to 100kWe. Energy Procedia 2015, 82, 994–1001. [Google Scholar] [CrossRef] [Green Version]
  3. Wieland, C.; Dawo, F.; Schifflechner, C.; Astolfi, M. Market report on organic rankine cycle power systems: Recent developments and outlook. In Proceedings of the 6th International Seminar on ORC Power Systems, Munich, Germany, 11–13 October 2021; Volume 10, pp. 11–13. [Google Scholar]
  4. Wang, G.G.; Zhu, L.Q.; Liu, H.C.; Li, W.P. Galvanic corrosion of Ni–Cu–Al composite coating and its anti-fouling property for metal pipeline in simulated geothermal water. Surf. Coat. Technol. 2012, 206, 3728–3732. [Google Scholar] [CrossRef]
  5. Cheng, Y.H.; Zou, Y.; Cheng, L.; Liu, W. Effect of the microstructure on the properties of Ni–P deposits on heat transfer surface. Surf. Coat. Technol. 2009, 203, 1559–1564. [Google Scholar] [CrossRef]
  6. Wu, K.; Zhu, L.; Li, W.; Liu, H. Effect of Ca2+and Mg2+ on corrosion and scaling of galvanized steel pipe in simulated geothermal water. Corros. Sci. 2010, 52, 2244–2249. [Google Scholar] [CrossRef]
  7. Stijepovic, M.Z.; Linke, P.; Papadopoulos, A.I.; Grujic, A.S. On the role of working fluid properties in Organic Rankine Cycle performance. Appl. Therm. Eng. 2012, 36, 406–413. [Google Scholar] [CrossRef]
  8. Staniša, B.; Ivušić, V. Erosion behaviour and mechanisms for steam turbine rotor blades. Wear 1995, 186–187, 395–400. [Google Scholar] [CrossRef]
  9. Hou, T.K.; Kazi, S.N.; Mahat, A.B.; Teng, C.B.; Al-Shamma’a, A.; Shaw, A. Industrial Heat Exchanger: Operation and Maintenance to Minimize Fouling and Corrosion. In Heat Exchangers—Advanced Features and Applications; Murshed, S.M.S., Lopes, M.M., Eds.; IntechOpen: London, UK, 2017; ISBN 978-953-51-3091-8. [Google Scholar]
  10. Sheriff, M.Z.; Karim, M.N.; Kravaris, C.; Nounou, H.N.; Nounou, M.N. An operating economics-driven perspective on monitoring and maintenance in multiple operating regimes: Application to monitor fouling in heat exchangers. Chem. Eng. Res. Des. 2022, 184, 233–245. [Google Scholar] [CrossRef]
  11. Joy, J.; Kochunni, S.K.; Chowdhury, K. Size reduction and enhanced power generation in ORC by vaporizing LNG at high supercritical pressure irrespective of delivery pressure. Energy 2022, 260, 124922. [Google Scholar] [CrossRef]
  12. Desai, N.B.; Tammone, C.; Haglind, F. Comparative analysis of two-phase expansion and sub-critical organic Rankine cycle systems for solar and geothermal applications. In Proceedings of the 35th International Conference on Efficiency, Cost, Optimization, Simulation and Environmental Impact of Energy Systems, Copenhagen, Denmark, 3–7 July 2022. [Google Scholar]
  13. White, M.T. Cycle and turbine optimisation for an ORC operating with two-phase expansion. Appl. Therm. Eng. 2021, 192, 116852. [Google Scholar] [CrossRef]
  14. Lai, N.A.; Fischer, J. Efficiencies of power flash cycles. Energy 2012, 44, 1017–1027. [Google Scholar] [CrossRef]
  15. Ortego Sampedro, E.; Breque, F.; Nemer, M. Two-phase nozzles performances CFD modeling for low-grade heat to power generation: Mass transfer models assessment and a novel transitional formulation. Therm. Sci. Eng. Prog. 2022, 27, 101139. [Google Scholar] [CrossRef]
  16. Smith, I.K. Development of the Trilateral Flash Cycle System: Part 1: Fundamental Considerations. Proc. Inst. Mech. Eng. Part J. Power Energy 1993, 207, 179–194. [Google Scholar] [CrossRef]
  17. Iqbal, M.A.; Rana, S.; Ahmadi, M.; Date, A.; Akbarzadeh, A. Trilateral Flash Cycle (TFC): A promising thermodynamic cycle for low grade heat to power generation. Energy Procedia 2019, 160, 208–214. [Google Scholar] [CrossRef]
  18. Öhman, H.; Lundqvist, P. Experimental investigation of a Lysholm Turbine operating with superheated, saturated and 2-phase inlet conditions. Appl. Therm. Eng. 2013, 50, 1211–1218. [Google Scholar] [CrossRef]
  19. Bianchi, G.; McGinty, R.; Oliver, D.; Brightman, D.; Zaher, O.; Tassou, S.A.; Miller, J.; Jouhara, H. Development and analysis of a packaged Trilateral Flash Cycle system for low grade heat to power conversion applications. Therm. Sci. Eng. Prog. 2017, 4, 113–121. [Google Scholar] [CrossRef]
  20. Xia, G.-D.; Zhang, Y.-Q.; Wu, Y.-T.; Ma, C.-F.; Ji, W.-N.; Liu, S.-W.; Guo, H. Experimental study on the performance of single-screw expander with different inlet vapor dryness. Appl. Therm. Eng. 2015, 87, 34–40. [Google Scholar] [CrossRef]
  21. Papes, I.; Degroote, J.; Vierendeels, J. New insights in twin screw expander performance for small scale ORC systems from 3D CFD analysis. Appl. Therm. Eng. 2015, 91, 535–546. [Google Scholar] [CrossRef] [Green Version]
  22. Read, M.; Smith, I.; Stosic, N. Optimisation of Screw Expanders for Power Recovery From Low Grade Heat Sources. Energy Technol. Policy 2013, 1, 131–142. [Google Scholar]
  23. Tang, H.; Wu, H.; Wang, X.; Xing, Z. Performance study of a twin-screw expander used in a geothermal organic Rankine cycle power generator. Energy 2015, 90, 631–642. [Google Scholar] [CrossRef]
  24. Wu, Z.; Pan, D.; Gao, N.; Zhu, T.; Xie, F. Experimental testing and numerical simulation of scroll expander in a small scale organic Rankine cycle system. Appl. Therm. Eng. 2015, 87, 529–537. [Google Scholar] [CrossRef]
  25. Liu, Z.; Tian, G.; Wei, M.; Song, P.; Lu, Y.; Ashby, G.; Roskilly, A.P. Modellingand Optimisation on Scroll Expander for Waste Heat Recovery Organic Rankine Cycle. Energy Procedia 2015, 75, 1603–1608. [Google Scholar] [CrossRef]
  26. Fischer, J. Comparison of trilateral cycles and organic Rankine cycles. Energy 2011, 36, 6208–6219. [Google Scholar] [CrossRef]
  27. Iqbal, M.A.; Rana, S.; Ahmadi, M.; Date, A.; Akbarzadeh, A. Experimental study on the prospect of low-temperature heat to power generation using Trilateral Flash Cycle (TFC). Appl. Therm. Eng. 2020, 172, 115139. [Google Scholar] [CrossRef]
  28. Dawo, F.; Buhr, J.; Wieland, C.; Hartmut, S. Experimental Investigation of the Partially Evaporated Organic Rankine Cycle for Various Heat Source Conditions. In Proceedings of the 6th International Seminar on ORC Power Systems, Munich, Germany, 11–13 October 2021. [Google Scholar]
  29. Lecompte, S.; Huisseune, H.; van den Broek, M.; De Paepe, M. Methodical thermodynamic analysis and regression models of organic Rankine cycle architectures for waste heat recovery. Energy 2015, 87, 60–76. [Google Scholar] [CrossRef]
  30. Zhou, Y.; Zhang, F.; Yu, L. Performance analysis of the partial evaporating organic Rankine cycle (PEORC) using zeotropic mixtures. Energy Convers. Manag. 2016, 129, 89–99. [Google Scholar] [CrossRef]
  31. Elliot, D.G. Theory and Tests of Two-Phase Turbines; Jet Propulsion Lab.: Pasadena, CA, USA; National Aeronautics and Space Administration: Washington, DC, USA, 1982.
  32. Macchi, E.; Astolfi, M. 9-Axial flow turbines for Organic Rankine Cycle applications. In Organic Rankine Cycle (ORC) Power Systems; Macchi, E., Astolfi, M., Eds.; Woodhead Publishing: Sawston, UK, 2017; pp. 299–319. ISBN 978-0-08-100510-1. [Google Scholar]
  33. 3MTM NovecTM 649 Engineering Fluid. Available online: https://multimedia.3m.com/mws/media/569865O/3m-novec-engineered-fluid-649.pdf (accessed on 7 January 2022).
  34. Proposal for a Regulation of the European Parliament and of the Council on Fluorinated Greenhouse Gases, COM(2012) 643 Final, 11 July 2012.
  35. UNFCCC. UN Framwork Convention on Climate Change, Kyoto Protocol Reference Manual on Accounting of Emissions and Assigned Amount, Working Papers; UN Framwork Convention on Climate Change: New York, NY, USA, 2009. [Google Scholar]
  36. Blondel, Q. Etude et Optimisation Énergétique des Mélanges Zéotropes Pour Les Cycles Thermodynamiques de Rankine; Université Grenoble Alpes: Grenoble, France, 2021. [Google Scholar]
  37. Scaccabarozzi, R.; Tavano, M.; Invernizzi, C.M.; Martelli, E. Comparison of working fluids and cycle optimization for heat recovery ORCs from large internal combustion engines. Energy 2018, 158, 396–416. [Google Scholar] [CrossRef]
  38. Wang, H.; Li, H.; Wang, L.; Bu, X. Thermodynamic Analysis of Organic Rankine Cycle with Hydrofluoroethers as Working Fluids. Energy Procedia 2017, 105, 1889–1894. [Google Scholar] [CrossRef]
  39. Kaczmarczyk, T.; Zywica, G.; Ihnatowicz, E. Experimental Investigation of a Radial Microturbine in Organic Rankine Cycle System With Hfe7100 as Working Fluid. In Proceedings of the 3rd International Seminar on ORC Power Systems, Brussel, Belgium, 12–14 October 2015. [Google Scholar]
  40. Blondel, Q.; Tauveron, N.; Caney, N.; Voeltzel, N. Experimental study and optimization of the Organic Rankine Cycle with pure NovecTM649 and zeotropic mixture NovecTM649/HFE7000 as working fluid. Appl. Sci. Switz. 2019, 9, 1865. [Google Scholar] [CrossRef] [Green Version]
  41. Krempus, D.; Bahamonde, S. On Mixtures as Working Fluids for Air-cooled ORC Bottoming Power Plants of Gas Turbines. In Proceedings of the 6th International Seminar on ORC Power Systems, Munich, Germany, 11–13 October 2021. [Google Scholar]
  42. EES: Engineering Equation Solver. F-Chart Software: Engineering Software. Available online: https://fchartsoftware.com/ees/ (accessed on 12 July 2021).
  43. [email protected], ‘REFPROP’, NIST, 18 April 2013. Available online: https://www.nist.gov/srd/refprop (accessed on 12 July 2021).
  44. Bao, J.; Zhao, L. A review of working fluid and expander selections for organic Rankine cycle. Renew. Sustain. Energy Rev. 2013, 24, 325–342. [Google Scholar] [CrossRef]
  45. Weiß, A.P.; Popp, T.; Müller, J.; Hauer, J.; Brüggemann, D.; Preißinger, M. Experimental characterization and comparison of an axial and a cantilever micro-turbine for small-scale Organic Rankine Cycle. Appl. Therm. Eng. 2018, 140, 235–244. [Google Scholar] [CrossRef]
  46. Balje´, O.E. A Study on Design Criteria and Matching of Turbomachines: Part A—Similarity Relations and Design Criteria of Turbines. J. Eng. Power 1962, 84, 83–102. [Google Scholar] [CrossRef]
  47. Wet Steam Turbines for Nuclear Power Plants By Alexander S Leyzerovich. Technical Books Pdf | Download Free PDF Books, Notes, and Study Material. Available online: https://www.technicalbookspdf.com/wet-steam-turbines-for-nuclear-power-plants-by-alexander-s-leyzerovich/ (accessed on 24 July 2022).
  48. Nederstigt, P. Real Gas Thermodynamics: And the Isentropic Behavior of Substances; Delft University of Technology: Delft, The Netherlands, 2017. [Google Scholar]
  49. Galuppo, F. Design, Optimization and Control by Condensation Pressure Manipulation of an ORC Based Waste Heat Recovery System in Heavy-Duty Trucks; Université de Lyon: Lyon, France, 2021. [Google Scholar]
Figure 1. ORC (Novec649TM).
Energies 15 07559 g001
Figure 2. TFC (Novec649TM).
Energies 15 07559 g002
Figure 3. PEORC (Novec649TM).
Energies 15 07559 g003
Figure 4. PFD of the experimental ORC.
Energies 15 07559 g004
Figure 5. Experimental test bench.
Energies 15 07559 g005
Figure 6. T-s diagram of Novec649TM, HFE7100, HF7000 and Novec649TM/HFE7000 mixture (50/50).
Energies 15 07559 g006
Figure 7. Balje’s diagram including turbine reference conditions (adapted from [46]).
Energies 15 07559 g007
Figure 8. Vapor quality based on the working fluid mass flow rate.
Energies 15 07559 g008
Figure 9. Electrical power based on the ORC mass flow rate (single phase and two phase).
Energies 15 07559 g009
Figure 10. High pressure based on the ORC mass flow rate (Novec649TM).
Energies 15 07559 g010
Figure 11. Heat transferred based on the ORC mass flow rate (Novec649TM).
Energies 15 07559 g011
Figure 12. Efficiency based on electrical power.
Energies 15 07559 g012
Figure 13. Quality based on the vapor mass flow rate/total mass flow rate.
Energies 15 07559 g013
Figure 14. Turbine mass flow rate model vs. turbine mass flow rate measurement.
Energies 15 07559 g014
Figure 15. Turbo-generator efficiency correlation based on turbo-generator efficiency measurement.
Energies 15 07559 g015
Figure 16. Turbo-generator efficiency correlation based on turbo-generator efficiency measurement (single and two phase).
Energies 15 07559 g016
Figure 17. Simplified diagram of a partial admission micro axial turbine stator.
Energies 15 07559 g017
Figure 18. Electrical power production based on the heat source.
Energies 15 07559 g018
Figure 19. Electrical power production based on the heat source (smoothed curve).
Energies 15 07559 g019
Figure 20. Comparison of the electrical production between two sizes of heat exchangers.
Energies 15 07559 g020
Table 1. Uncertainty of measurement equipment.
VariableEquipmentRangeUncertainty
Electrical powerWattmeter0–3250 W±0.3%
Volume flow (hot source)EFM0–3500 L/h±0.23%
Volume flow (cold source)EFM0–2500 L/h±0.33%
Mass flow rate (working fluid)Coriolis50–500 kg/h±0.30%
TemperatureThermocouple Type-T−200–200 °C±0.1 °C
PressureAPS0–7 bar±1%
Table 2. Main properties of the working fluids studied.
PropertiesNovec649TMHFE7000HFE7100Blend 50% Novec649TM
50%HFE7000
Fluid typeDryDryDryDry
Fluid classFluoroketoneHydrofluoroetherHydrofluoroether-
FormulaCF3CF2C(O)CF(CF3)2C3F7OCH3C4F9OCH3-
Critical temperature (°C)169165195162
Critical pressure (bar)18.724.822.322
Normal glide0002
ODP0000
GWP1530320266
FlammabilityNoNoNoNo
ToxicityNullLowLowLow
Table 3. Variable parameter and variable range (campaign 1).
Variable ParameterVariation Range
Heat sourceInlet temperature110 °C
Flow rate2000–3500 L.h−1
Cooling sourceInlet temperature13 °C
Flow rate1000–2500 L.h−1
Working fluidFluid type (number of tests)Novec649TM (42)
Flow rate0.03–0.09 kg.s−1
Table 4. Variable parameter and variable range (campaign 2).
Variable ParameterVariation Range
Heat sourceInlet temperature90–110 °C
Flow rate200–3500 L.h−1
Cooling sourceInlet temperature13–35 °C
Flow rate250–2500 L.h−1
Working fluidFluid type (number of tests)Novec649TM (106)
HFE7000 (28)
HFE7100 (75)
50%Novec649–50%HFE7000 (40)
Flow rate0.03–0.09 kg.s−1
Table 5. Design point.
ParametersData
FluidNovec649TM[-]
Mass flow rate0.076[kg.s−1]
Inlet temperature108.2[°C]
Inlet pressure5.30[bar]
Outlet pressure0.44[bar]
Rotation speed9750[RPM]
Table 6. Electrical production for case 1, 2 and 3.
Blue Zone Production (Figure 20) Orange Zone Production (Figure 20)Purple Zone Production (Figure 20)Average Production between 10 and 13.3 kW Hot SourceAverage Production between 13.3 and 14 kW Hot SourceAverage Production between 10and 14 kW Hot Source
[-][-][-][W][W][W]
Case 1Ok NoNo3550293
Case 2OKOkNo355435369
Case 3OkOkOk355475376
Publisher’s Note: MDPI stays neutral with regard to jurisdictional claims in published maps and institutional affiliations.