Abstract
The increasing importance of renewable energy capacity in the power generation scenario, together with the fluctuating consumer energy demand, forces conventional fossil fuel power generation systems to promptly respond to relevant and rapid load variations and to operate under off-design conditions during a major fraction of their lives. In order to improve existing power plants’ flexibility in facing energy surplus or deficit, retrofittable solutions for gas turbine compressors are proposed. In this paper, two different operation strategies, variable inlet guide vanes (IGVs) and blow-off extraction (BO), are considered for enabling partial load and minimum environmental load operation, and thus to identify implementation opportunities in existing thermal power plants. A typical 15-stage F-class gas turbine compressor is chosen as a test case and some energy demand scenarios are selected to validate the adopted solutions. The results of an extensive 3D, steady, CFD analysis are compared with the measurements coming from an experimental campaign carried out in the framework of the European Turbo-Reflex project. It will be shown how the combined strategies can reduce gas turbine mass flow rate and power plant output, without significantly penalizing efficiency, and how such off-design performance figures can be reliably predicted by employing state-of-the-art CFD models.
1. Introduction
The challenges presented by European policies towards the decarbonization of the energy industry for cleaner environmental and sustainable energy calls for the incremental introduction of renewable energy sources (RES) [1,2]. By 2025, these sources are expected to overtake coal as the primary source for electricity generation and to account for almost half of the total global power generation by 2050 [3,4]. Figure 1 shows the expectations of the International Renewable Energy Agency (IRENA) for the years up to 2050. As one can see, a massive increase in the proportion of RESs in the energy global system is expected, with a significant amount of that increase attributable to solar and wind systems.
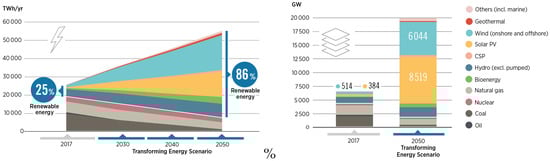
Figure 1.
Electricity generation scenario, Remap case 2017–2050, IRENA [5].
This scenario represents a challenge, not only from an environmental point of view, but also for traditional power plants operations [6]. The intermittent nature of RESs and the fluctuating consumer energy demand are well known and documented [7,8,9]. A typical trend in daily energy consumption in Italy is shown in Figure 2, as reported by TERNA S.p.A., Rome, Italy the energy company that manages the Italian transmission grid.
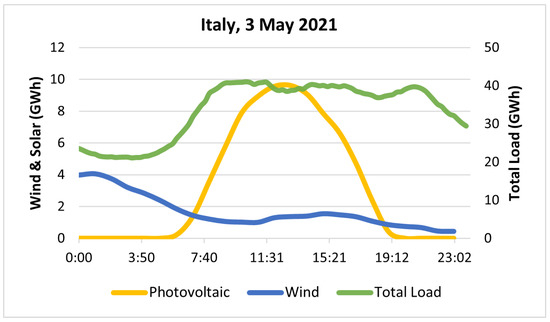
Figure 2.
Typical daily Italian grid electricity demand, May 2021, TERNA S.p.A. [10].
As it can be seen that in the future the power from RESs will be increasingly prioritized, gas turbines will have a supporting role for fulfilling the energy demand, depending on the wind capacity and the solar radiation. Therefore, the installation of RESs has a significant impact on the grid stability and on the operation of the traditional power plant, requiring more and more backup capacity that should become almost equal to renewable generation [11]. As a result, combined cycles have to explore a wider range of operating conditions and improve their flexibility as much as possible in order to combine the best performance with extended start-up and ramping capability and enhanced minimum environmental load [12,13].
In this scenario, thanks to European Union’s Horizon 2020 research and innovation program, the Turbo-Reflex project (TURBOmachinery REtrofits enabling FLEXible back-up capacity for the transition of the European energy system) was launched with the aim of developing and optimizing technologies that can be used to retrofit existing power plants in order to enable more flexible operation. Within the project, a dedicated session has been reserved for retrofittable features for compressors that play a key role in the flexibility of power plants [14]. On the compressor side, the possible actions for reducing the load of a gas turbine without negatively impacting the carbon dioxide emissions, include blow-off extraction, inlet guide vane extra-closure, and bleed heating, also known as anti-icing. Among these, as a part of the European project, two different operational strategies have been investigated, including variable inlet guide vanes (IGVs) and blow-off extraction (BO). These two strategies allow for a reduction in the minimum environmental load (MEL) that the power plant can be operated at, thus avoiding shutdown when the power demand from the grid is low. This allows conventional power plants to be more flexible, reliable, and resilient, while ensuring full compliance with the restrictive environmental regulations imposed by several countries. The first solution consists of the variation of the IGV stagger angle (a practice that is generally used to change load condition), to decrease the inlet compressor mass flow below the standard MEL value. The second solution opens one or more blow-off valves at the core of the compressor in order to bypass part of the compressed air directly in the exhaust diffuser and save the fuel needed to heat it [15,16,17].
In this paper, numerical compressor stability limits have been investigated using a state-of-the-art 3D CFD approach. A fifteen-stage, IGV, OGV, heavy-duty axial GT compressor of the F-class Ansaldo fleet, equipped with four ON/OFF blow-off lines and two VGVs, has been considered for the purpose of validating the CFD framework. Field measurements were made available through an experimental campaign carried out by Ansaldo Energia in the framework of the European Turbo-Reflex project. The test matrix comprises a combination of different IGV configurations (from minimum to maximum load), reduced speed values, mass flow extraction rates, and ambient conditions. A detailed comparison with the available experimental data will show how a carefully selected CFD setup is able to predict compressor performance and the numerical stability limits in such extreme operating conditions and thus can be capable of supporting the choice and the design of retrofitting solutions.
The first two sections of the paper are devoted to descriptions of the experimental and numerical setups, respectively. Then, the partial load conditions will be discussed in terms of comparisons between the computed results and the available experimental data. Following the assessment of the numerical setup, the proposed computational approach is employed in order to investigate numerical compressor limits with reference to the minimum environmental load condition. Finally, some conclusions are reported.
2. Experimental Setup
The compressor has been instrumented by means of the probes that are typically used to monitoring the normal operation of the engine with additional instrumentation dedicated to monitoring the compressor behavior in off-design conditions. All the probes have a sampling frequency of 2 Hz. The signals monitored in standard conditions are associated with the operating parameters listed below:
- IGV and EB1 (first extraction slot) valve position;
- Ambient temperature, pressure and relative humidity;
- Grid frequency;
- Inlet compressor temperature and pressure;
- Outlet compressor temperature and pressure.
The additional instrumentation is installed inside the compressor flowpath at the outer case, as shown in Figure 3. Such additional probes have been installed in the front, core, and rear part of the compressor in order to study how the different blocks behave in case of different load and ambient conditions. There are six static pressure transducers (upstream from the rotor blades, CB01, CB02, CB09, and CB15, and inside the extraction slots, EB1 and EB2), and five total temperature taps (upstream of the stator blades, CV02 and CV04, upstream of the rotor blades, CB09, and inside the extraction slots, EB1 and EB2).
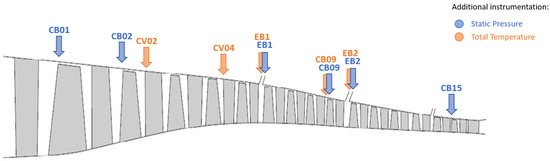
Figure 3.
Meridional channel of the F-class Ansaldo Energia compressor.
3. Computational Framework
In the present work, a state-of-the-art, in-house-developed, RANS/URANS flow solver (TRAF code [18]) has been used. The 3D Reynolds-averaged Navier–Stokes equations are written in conservative form in a curvilinear coordinate system and solved for density, absolute momentum components, and total energy. Several advection schemes are available in the code [19], and the one adopted in the present work is a 2nd-order central scheme with the scalar-valued artificial dissipation proposed by Jameson, Schmidt, and Turkel [20]. The CFD results discussed in the paper come from RANS analyses carried out with the mixing-plane approach, which allows a steady coupling between fixed and rotating blade rows [21]. Here, a non-reflecting mixing-plane treatment based on the method proposed by Giles [22,23] has been selected. The last stage stator and the OGV, which are both stationary components, share the same blade number and thus a local matching interface was employed solely for the interface between these two blade rows, as in [24,25]. For large-scale industrial calculations, such as the ones discussed here that cover an entire 15-stage compressor with (with IGV and OGV), affordable CPU times represent a mandatory requirement. To this end, several steady-state convergence acceleration techniques, such as local time stepping, implicit residual smoothing and multigridding [19], have been adopted.
The Wilcox model [26] was used for turbulence closure. It has proven to be robust and reliable for RANS/URANS analyses of multistage axial compressors over a wide range of operating conditions [21].
As mentioned above, the computational domain takes into account the full compressor module composed by fifteen-stages with IGV and OGV. Each blade row was discretized using O-type grids with about cells per block, while the inlet and outlet guide vanes were discretized using H-type meshes with about cells per block. The mesh density has been selected on the base of previous grid dependency analyses [21]. In order to guarantee a proper resolution of boundary layers, the value of the grid nodes closest to the blade surface is between 1 and 2.
The experimental radial distributions in terms of total pressure, total temperature, and flow angle are imposed as inlet boundary conditions, while at the outlet of the computational domain, the static pressure value was prescribed at the hub, and the radial equilibrium was used to obtain the spanwise distribution. Inlet turbulent quantities were assigned in terms of turbulence level and non-dimensional turbulent length. The prescribed values are and of the reference length (the IGV axial chord at the hub).
The compressed fluid is humid air and it was modeled as a real gas with variable specific heats.
The code, together with the described numerical setup, has recently been validated for the prediction of the operating characteristics of multistage axial compressors [21,27].
4. Partial Load Conditions
The variable IGV and the first stator row were allowed to span the compressor’s operating range from full load to minimum load. The mass flow and pressure ratio changes were accomplished by varying the stagger of both the IGV and the first stator row.
In the present work, six different IGV configurations were selected and reported in Table 1. The IGV position at 100% corresponds to the base load condition (test T17), while the one at about 42% corresponds to the partial load (test T11). The maximum IGV closure considered, which corresponds to the minimum load condition, is associated with test T12.

Table 1.
IGV positions considered for the partial load compressor operation.
As previously mentioned, the experimental measurements carried out by Ansaldo Energia Switzerland under the framework of the European Turbo-Reflex project have been used for assessing the numerical simulations. The operating points were investigated with a rotational speed equal to 3000 rpm.
The averaged inlet values of total temperature and total pressure that were considered for the different computations are reported in Figure 4.
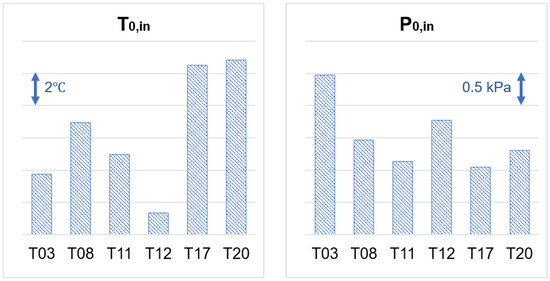
Figure 4.
Average dimensional inlet total temperature and total pressure for the six cases experimentally tested by Ansaldo Energia Switzerland.
Off-design performance is depicted in Figure 5 in terms of compressor inlet mass flow, polytropic efficiency, and isentropic efficiency. All values are scaled with respect to the experimental ones corresponding to the operating point T03. It is worth noting that the configuration with the higher IGV extra-closure (T12), allows an inlet mass flow reduction of around 25% with respect to the base-load one (T17). Furthermore, as can be seen, the compressor efficiency is lower. Compared to the T17 test, the test T12 loses about of the polytropic efficiency, while about of the isentropic efficiency. Such a trend is reasonably well reproduced by the CFD computations and the calculated values are in satisfactory agreement with the measured ones. The most prominent discrepancies are detected in terms of polytropic efficiency, especially with higher IGV stagger values, with a relative difference of up to % between predictions and measurements, as can be observed for the test T12. This is consistent with the outlet’s total temperature prediction, as shown in Figure 6, in terms of:
where the greatest difference between the experimental and the computed value is always associated with the IGV extra-closure. In terms of relative error, it is approximately %.
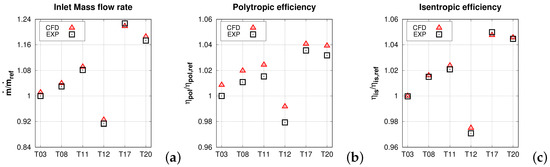
Figure 5.
Compressor inlet mass flow rate (a), polytropic efficiency (b), and isentropic efficiency (c) for the six cases experimentally tested by Ansaldo Energia Switzerland.
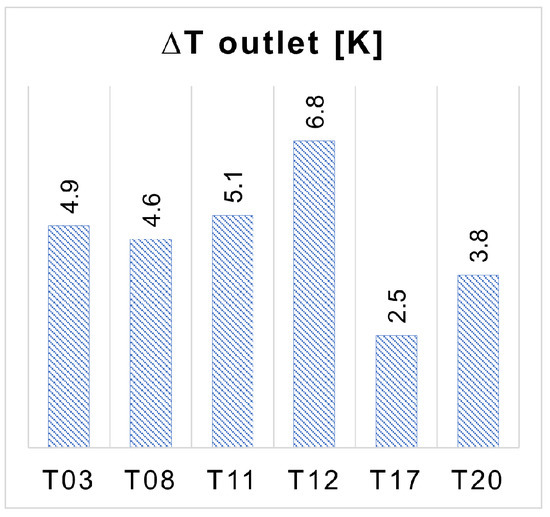
Figure 6.
Discharge outlet total temperature for the six cases experimentally tested by Ansaldo Energia Switzerland.
Examining the customer benefit, a 50% compressor power reduction obtained by extra-closing the IGV (from tests T17 to T12) saves approximately 30% inlet mass flow and fuel mass flow in comparison to the base load. In addition, the achievement of a lower absolute power increases the power plant’s capability to support the grid. It is worthwhile to notice how a carefully designed CFD setup, such as the one proposed in this paper, can give reliable estimates of such crucial figures.
Figure 7a shows the total temperature distribution at the casing compared with the values measured by six temperature taps along the meridional channel. These are positioned upstream to the second, the fourth, and the ninth vane blades, two for each circular sector. The predicted values along the compressor axis reproduce well the sensor data for all the experimentally tested operating conditions.
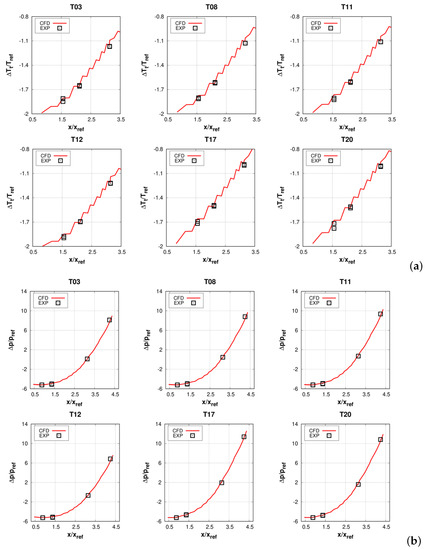
Figure 7.
Measured and predicted total temperature (a) and static pressure (b) distributions at casing for the six configurations experimentally tested by Ansaldo Energia Switzerland.
The computed evolution of the static pressure at the casing for the full compressor is reported in Figure 7b. A comparison is made using the experimental value obtained through eight Kulite transducers along the compressor itself, located before the first, the second, the ninth, and the last rotor blades, two for each circular sector. Furthermore, in this case, a good agreement between numerical results and experimental data can be appreciated for all the considered operating conditions.
As observed for the compressor efficiency, moving from the base load to the minimum load, there is an outlet static pressure reduction of about 500 kPa. This is in line with the aim of the strategy: by extra-closing the IGV, the mass flow elaborated by the gas turbine and the pressure ratio and efficiency are reduced. Again, this feature is correctly reproduced by the CFD approach.
The gas turbine at partial load operation can be regulated according to two different methods with respect to the base load reference cycle: constant turbine inlet temperature (TIT) and constant turbine exhaust temperature (TET). As observed, the consequence of an IGV extra-closure is a decrease in the pressure ratio which would require a decrease in the firing temperature in order to keep the TET constant, with detrimental effect on the CO emissions. In order to control the CO emissions when pursuing a reduction in the standard MEL with this strategy, the flame temperature is fixed and the TET increases. As a result, less power is produced with a lower fuel consumption.
One of the critical aspects of IGV variation is the inception of dangerous flow instabilities. In particular, due to high flow incidence, the front compressor stages undergo incipient surging conditions, while the rear ones undergo incipient choking conditions. Validated CFD predictions can be very helpful in monitoring the onset of instabilities. For example, surge inception in the first stages can be monitored by looking at separated flow regions that can be visualized as reversed axial velocity zones. Figure 8 shows regions of recirculating flow for the IGV and the first two stages, for the T11, T12, and T17 operating conditions. Different configurations for the corner separation can be appreciated on the first stator. By extra-closing the IGV, the recirculation increases its spanwise penetration, up to 40% of the span (test T12).
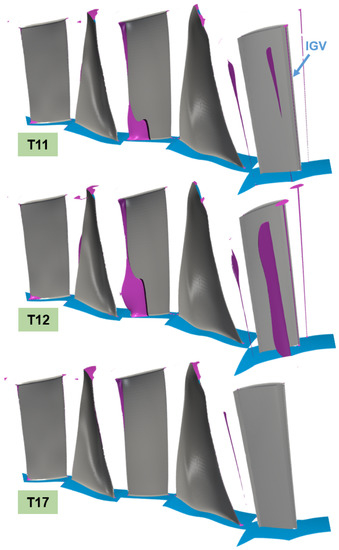
Figure 8.
View of IGV with the first two stages, recirculating flow regions highlighted by iso-surface of zero axial velocity.
5. Minimum Environmental Load Condition
Once the performance of the proposed CFD setup has been assessed, as discussed in the previous section of the paper, a computational strategy has been applied to investigate numerical compressor limits regarding the minimum environmental load reduction. To this end, a test matrix with a combination of different IGV position and mass flow blow-off extraction rates has been defined. Eight operating conditions for the full compressor have been selected for the 3D CFD analyses and reported in Table 2. In particular, these conditions consider different ambient temperatures (the reference one, with a value of 15 °C and a lower one, with a value of 0 °C), with IGV standard configuration or extra-closure (IX), and, finally, with and without the first blow-off valve completely open, for a mass flow rate extraction equal to the 12% of the inlet one.
Table 2.
Analyzed compressor operating conditions.
The operating conditions are analyzed at a fixed 1013 mbar ambient pressure, 60% ambient relative humidity air and rotational speed equal to 3000 rpm. For six of the eight configurations, the discharge pressure of the compressor was varied in a wide range, starting from the working line condition, in order to estimate the numerical surge margin of the full compressor.
With the IGV position variation and the blow-off opening, it is possible to explore the compressor performance map, as shown for the total pressure ratio (Figure 9a) and polytropic efficiency (Figure 9b). Ambient temperature also affects the compressor characteristic parameters. In fact, with an inlet temperature change, from 15 °C to 0 °C, it is possible to modify not only the reduced speed, but also the air density, and therefore the inlet flow function. This is the case, for example, when the standard MEL configuration moves from the reference ambient temperature to the lower one, where an increase in mass flow rate, pressure ratio and power, and a reduction in efficiency are obtained. Given the reduced speed, pressure ratio, and IGV, the three independent parameters governing the compressor behavior, mass flow rate, and efficiency vary accordingly.
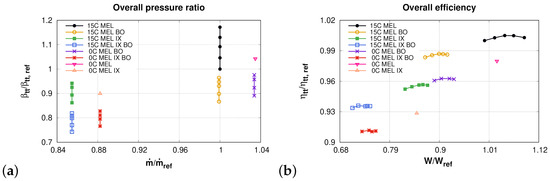
Figure 9.
Test matrix overall pressure ratio (a) and polytropic efficiency (b) for the six configurations analyzed.
The combination of blow-off opening and the IGV extra-closure (for both the ambient temperature) reduces the power plant output and penalizes the compressor efficiency. As an example, let us consider the 15C MEL case (Figure 9). By opening the blow-off valves, it is possible to observe a reduction in the pressure ratio with the same mass flow rate. Therefore, the input power and efficiency of the compressor are lowered. This strategy reduces the minimum load because a significant amount of air is extracted from the blow-off, so the operating mass flow in the turbine, combustor, and the last part of the compressor is lower than that of the standard MEL. The blow-off mass flow is re-injected into the diffuser, which significantly reduces the gas turbine’s exhaust temperature.
On the other hand, with the extra-closure of the IGV, it is possible to observe a reduction in both the pressure ratio and the mass flow rate. It is also possible to notice a larger reduction in power and efficiency when compared to simply opening the blow-off. With this new strategy, a standard thermodynamic cycle is obtained, which operates at a lower air mass flow rate relative to the standard MEL condition. The mass flow reduction leads to a lower pressure ratio; therefore, if the flame temperature is kept fixed, the turbine exit temperature increases.
The main operating differences between the six speedline configurations can be appreciated in Figure 10 in terms of stage load coefficient and flow coefficient:
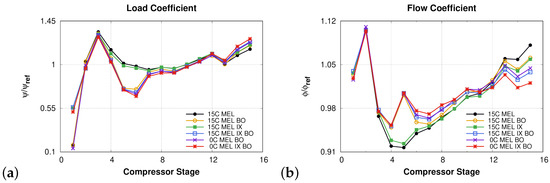
Figure 10.
Test matrix stage flow coefficient (a) and stage load coefficient (b) for the six configurations analyzed.
Close to the bleed position, which is located upstream the sixth rotor blade, there is a load reduction (Figure 10a), followed by a gradual increase towards the last stator of the compressor, where the highest value is reached. The opening of the blow-off has a particular effect from stage four to seven. In fact, initially there is a strong reduction of the load linked to the total enthalpy variation, followed by a considerable increase immediately after the position of the valve itself.
In terms of flow coefficient, as reported in Figure 10b, the IGV position considerably increases the meridional velocity up to the second stage. Subsequently, there is a strong reduction up to the fifth stage, while in the case of an open blow-off we can note an increase (fifth stage), followed by a decrease to the seventh stage. Then there is a gradual increase with two different slopes. Without the opening blow-off, it is possible to obtain a greater slope and therefore a greater flow coefficient at the exit of the compressor.
The same considerations of the flow parameters can be made for Figure 11, with the diffusion coefficient comparison at working line, for the six configurations analyzed. The Lieblein’s diffusion factor is defined as:
where w is the relative velocity, the circumferential velocity and the solidity. The averaged on each row is used as a sensor for the loading limit and its increase indicates a reduction in the aerodynamic stability. As soon as the flow approaches the bleed, the diffusion factor decreases. Overcoming the bleed, the diffusion factor increases sharply, up to the thirty-first row, i.e., the last stator blades, where it reaches the highest value. For both reference ambient temperatures, the maximum value is obtained with the combination of the two strategies: open blow-off and IGV extra-closure.
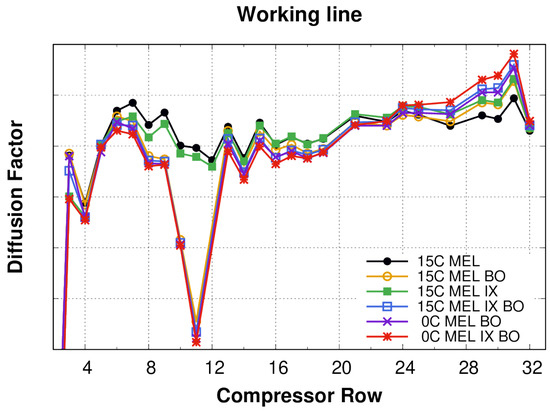
Figure 11.
Test matrix diffusion factor for the working line condition for the six configurations analyzed.
Figure 12 reports the compressor map from stage 11 to 15. The numerical surge margin is defined on the base of the numerical stability limit, which is given by the peak stage pressure ratio. If we consider the 15 °C MEL, it is possible to observe how for the stage 15 characteristic the numerical stability margin is progressively reduced: for the standard MEL, the MEL with IGV extra-closure, the MEL with opening blow-off, and the MEL with both of the two strategies, the margin is reached at 14%, 10%, 8%, and 4% of the discharge pressure, respectively.
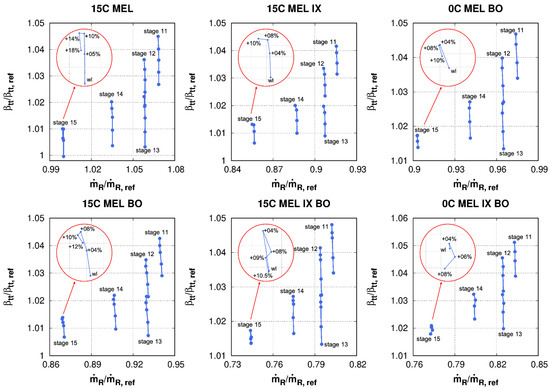
Figure 12.
Map of the last five stages of the compressor for the six configurations analyzed.
From a computational point of view, the stability limit can also be appreciated in terms of recirculation area at the endwall of the last two rear stators, as shown in Figure 13, illustrating the operating condition at 15 °C MEL with IGV extra-closure and blow-off extraction. When increasing the back-pressure, the hub corner stall grows both in size and spanwise penetration. Up to 4% of the discharge pressure, the corner stall is limited to the fifteenth stator blade, after which it arrives inside the OGV, indicating that they are close to stall.
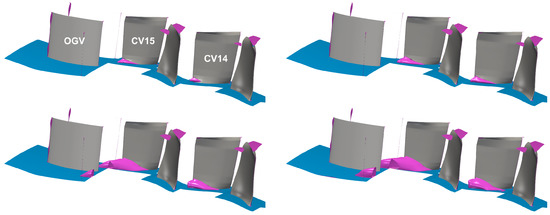
Figure 13.
Recirculation flow regions highlighted by iso-surface of zero axial velocity for the 15C MEL IX BO operating condition.
6. Conclusions
Although the expansion of renewable energy systems is increasingly relevant, gas-fired power plants keep a primary role within the energy sector by supporting the grid stability and the peak demand. The choice of managing gas-fired power plants at a minimum environmental load allows for the avoidance of concentrated or transient thermomechanical stresses. In this way, the plant is able to quickly ramp up to provide its grid stabilization services to the network manager.
In the present work, a typical F-class gas turbine compressor has been considered. In order to improve the existing power plant flexibility at partial load and minimum load, two different retrofittable solutions have been proposed: variable inlet guide vanes and blow-off extraction. The impact of these solutions on the full compressor was evaluated with a 3D CFD flow solver.
The numerical steady-state results at the base load condition, with a stagger variation of both the IGV and the first stator row, have been presented and validated with an experimental campaign, carried out by Ansaldo Energia Switzerland. The CFD results are perfectly aligned with the experimental ones, even in the case of significant reductions in mass flow rate, pressure ratio, and power plant output.
The numerical compressor limits at the minimum environmental load have been subsequently investigated through a combination of different IGV position and blow-off extraction. The proposed computational setup has been able to provide reliable performance figures for all these strong off-design conditions.
In terms of compressor efficiency, the IGV extra-closure is the worst option. Although the load and flow coefficients and diffusion factor behavior between the IGV extra-closure and the opening blow-off are similar for the last stages, in the first case it is possible to obtain a greater reduction in mass flow and power at an almost equal pressure ratio. An important difference is highlighted by the characteristics of the fifteenth stage, in which the numerical stability margin for MEL IX and MEL BO is reduced from 10% to 8% of the back pressure.
From a thermodynamic point of view, however, the IGV extra-closure has the lowest impact on the cycle because it remains the standard cycle operated with less airflow, just as with an “extreme off-design”. On the other hand, the blow-off strategy has a strong impact on the cycle because a part of the compressor air mass flow is compressed but does not participate to power generation. The most extreme minimum load is achieved by combining both retrofittable strategies. If this is not sufficient for the reduction target, anti-icing should be additionally provided. In this way, a part of the air is bled from the compressor outlet and recirculated at the inlet.
The discussed combined experimental/numerical study has proven the viability of the two retrofittable technologies. The benefits of MEL reduction, with positive implications for RES operation and storage and a reduction in start-up and shut-down parameters, have been validated and assessed without any restrictions and penalties on conventional operation such as partial load and start-up.
Author Contributions
Conceptualization, M.B. and S.G.M.; methodology, R.P. and M.M.; software, R.P., M.M. and M.R.; validation, M.R., R.P., M.M., S.G.M., formal analysis, R.P., M.M.; investigation, M.R., M.B. and S.G.M.; writing—original draft preparation, M.R., M.B.; writing—review and editing R.P., M.M.; visualization, M.R.; supervision, R.P., M.M., M.B. and S.G.M. All authors have read and agreed to the published version of the manuscript.
Funding
These research’s results are part of the TURBO-REFLEX project, which has received funding from European Union’s Horizon 2020 research and innovation programme under grant agreement No 764545.
Data Availability Statement
Not applicable.
Conflicts of Interest
The authors declare that they have no known competing financial interests or personal relationships that could have appeared to influence the work reported in this paper.
Abbreviations
The following abbreviations are used in this manuscript:
| CV | stator blade |
| CB | r otor blade |
| EB | extraction bleed |
| MEL | minimum environmental load |
| BO | blow off |
| IGV | inlet guide vane |
| OGV | outlet guide vane |
| RES | renewable energy sources |
| TET | turbine exhaust temperature |
| TIT | turbine inlet temperature |
| IX | extra-closure |
| EXP | experimental measurements |
| T | temperature |
| p | pressure |
| stage load coefficient | |
| stage flow coefficient | |
| pressure ratio | |
| efficiency | |
| W | power |
| mass flow rate | |
| diffusion factor |
References
- Papadis, E.; Tsatsaronis, G. Challenges in the decarbonization of the energy sector. Energy 2020, 205, 118025. [Google Scholar] [CrossRef]
- IRENA. World Energy Transitions Outlook: 1.5°C Pathway; IRENA: Abu Dhabi, United Arab Emirates, 2021; ISBN 978-92-9260-334-2. Available online: https://www.irena.org/publications/2021/March/World-Energy-Transitions-Outlook (accessed on 27 May 2021).
- Brouwer, A.S.; van den Broek, M.; Zappa, W.; Turkenburg, W.C.; Faaij, A. Least-cost options for integrating intermittent renewables in low-carbon power systems. Appl. Energy 2016, 161, 48–74. [Google Scholar] [CrossRef]
- Pietzcker, R.C.; Osorio, S.; Rodrigues, R. Tightening EU ETS targets in line with the European Green Deal: Impacts on the decarbonization of the EU power sector. Appl. Energy 2021, 293, 116914. [Google Scholar] [CrossRef]
- IRENA. Global Renewables Outlook: Energy Transformation 2050; International Renewable Energy Agency: Abu Dhabi, United Arab Emirates, 2020; ISBN 978-92-9260-238-3. Available online: https://www.irena.org/publications/2020/Apr/Global-Renewables-Outlook-2020 (accessed on 27 May 2021).
- Gonzalez-Salazar, M.A.; Kirsten, T.; Prchlik, L. Review of the operational flexibility and emissions of gas- and coal-fired power plants in a future with growing renewables. Renew. Sustain. Energy Rev. 2018, 82, 1497–1513. [Google Scholar] [CrossRef]
- Knopf, B.; Nahmmacher, P.; Schmid, E. The European renewable energy target for 2030—An impact assessment of the electricity sector. Energy Policy 2015, 85, 50–60. [Google Scholar] [CrossRef]
- Lunz, B.; Stöcker, P.; Eckstein, S.; Nebel, A.; Samadi, S.; Erlach, B.; Fischedick, M.; Elsner, P.; Sauer, D.U. Scenario-based comparative assessment of potential future electricity systems—A new methodological approach using Germany in 2050 as an example. Appl. Energy 2016, 171, 555–580. [Google Scholar] [CrossRef]
- DinAli, M.N.; Dincer, I. Development and analysis of an integrated gas turbine system with compressed air energy storage for load leveling and energy management. Energy 2018, 163, 604–617. [Google Scholar] [CrossRef]
- TERNA, S.p.A. Electricity System. 2021. Available online: https://www.terna.it/en/electric-system (accessed on 27 May 2021).
- Lynch, M.; Devine, M.T.; Bertsch, V. The role of power-to-gas in the future energy system: Market and portfolio effects. Energy 2019, 185, 1197–1209. [Google Scholar] [CrossRef]
- Abudu, K.; Igie, U.; Minervino, O.; Hamilton, R. Gas turbine minimum environmental load extension with compressed air extraction for storage. Appl. Therm. Eng. 2020, 180, 115869. [Google Scholar] [CrossRef]
- Abudu, K.; Igie, U.; Roumeliotis, I.; Hamilton, R. Impact of gas turbine flexibility improvements on combined cycle gas turbine performance. Appl. Therm. Eng. 2021, 189, 116703. [Google Scholar] [CrossRef]
- Aalburg, C.; Szymanski, A.; Schwagerus, A.; Liska, J.; Cerny, V.; Wiedermann, A.; Bernstrauch, O.; Benvenuto, M. Special Technical Session: TURBO-REFLEX European Project. In Proceedings of the 14th European Turbomachinery Conference (ETC14), Gdansk, Poland, 12–16 April 2021. [Google Scholar]
- Mosele, S.G.; Garbarino, T.; Schneider, A.; Cozzi, L.; Arnone, A.; Goinis, G.; Hedkvist, S. Compressor Retrofittable Solutions in Heavy-Duty Gas Turbines for Minimum Environmental Load Reduction. E3S Web Conf. 2019, 113, 01012. [Google Scholar] [CrossRef]
- Ricci, M.; Mosele, S.G.; Benvenuto, M.; Pio, A.; Pacciani, R.; Marconcini, M. Retrofittable Solutions Capability for a Gas Turbine Compressor. Int. J. Turbomach. Propuls. Power 2022, 7, 3. [Google Scholar] [CrossRef]
- Goinis, G.; Benvenuto, M.; Mosele, S.G.; Schneider, A. Simulation of a Multistage Compressor at Low Load Operation with Additional Bleed Air Extraction for Minimum Environmental Load Reduction. In Proceedings of the Global Power & Propulsion Society (GPPS) Technical Conference 2022 (GPPS Chania22), Chania, Greece, 18–20 September 2022. [Google Scholar]
- Arnone, A. Viscous Analysis of Three-Dimensional Rotor Flow Using a Multigrid Method. J. Turbomach. 1994, 116, 435–445. [Google Scholar] [CrossRef]
- Pacciani, R.; Marconcini, M.; Arnone, A. Comparison of the AUSM+-up and Other Advection Schemes for Turbomachinery Applications. Shock Waves 2019, 29, 705–716. [Google Scholar] [CrossRef]
- Jameson, A.; Schmidt, W.; Turkel, E. Numerical Solutions of the Euler Equations by Finite Volume Methods Using Runge–Kutta Time–Stepping Schemes. In Proceedings of the 14th Fluid and Plasma Dynamics Conference, Palo Alto, CA, USA, 23–25 June 1981. AIAA paper 81–1259. [Google Scholar]
- Burberi, C.; Michelassi, V.; Scotti del Greco, A.; Lorusso, S.; Tapinassi, L.; Marconcini, M.; Pacciani, R. Validation of steady and unsteady CFD strategies in the design of axial compressors for gas turbine engines. Aerosp. Sci. Technol. 2020, 107, 106307. [Google Scholar] [CrossRef]
- Giles, M.B. Non-Reflecting Boundary Conditions for the Euler Equations; Technical report, CFDL Report 88-1; Dept. of Aeronautics & Astronautics, MIT: Cambridge, MA, USA, 1988. [Google Scholar]
- Giles, M.B. UNSFLO: A Numerical Method for Unsteady Inviscid Flow in Turbomachinery; Technical report, GTL 195; Department of Aeronautics & Astronautics, MIT: Cambridge, MA, USA, 1988. [Google Scholar]
- Cioffi, M.; Puppo, E.; Silingardi, A. Fanno Design of Blow-Off Lines in Heavy Duty Gas Turbine. In Proceedings of the ASME Turbo Expo 2013: Turbine Technical Conference and Exposition, San Antonio, TX, USA, 3–7 June 2013. [Google Scholar] [CrossRef]
- Cioffi, M.; Piola, S.; Puppo, E.; Silingardi, A.; Bonzani, F. Minimum Environmental Load Reduction in Heavy Duty Gas Turbine by Bleeding Lines. In Proceedings of the ASME Turbo Expo 2014: Turbine Technical Conference and Exposition, Düsseldorf, Germany, 16–20 June 2014. [Google Scholar] [CrossRef]
- Wilcox, D.C. Multiscale Model for Turbulent Flows. AIAA J. 1988, 26, 1311–1320. [Google Scholar] [CrossRef]
- Cozzi, L.; Rubechini, F.; Giovannini, M.; Marconcini, M.; Arnone, A.; Schneider, A.; Astrua, P. Capturing Radial Mixing in Axial Compressors With Computational Fluid Dynamics. J. Turbomach. 2019, 141, 031012. [Google Scholar] [CrossRef]


Publisher’s Note: MDPI stays neutral with regard to jurisdictional claims in published maps and institutional affiliations. |
© 2022 by the authors. Licensee MDPI, Basel, Switzerland. This article is an open access article distributed under the terms and conditions of the Creative Commons Attribution (CC BY) license (https://creativecommons.org/licenses/by/4.0/).