Article

Numerical Analysis of a Horizontal Pressure Differential Wave Energy Converter

by
Manimaran Renganathan
1 and
Mamdud Hossain
2,*
1
School of Mechanical Engineering, Vellore Institute of Technology, Vandalur-Kelambakkam Road, Chennai 600127, India
2
School of Engineering, Robert Gordon University, Gathdee Road, Aberdeen AB10 7GJ, UK
*
Author to whom correspondence should be addressed.
Energies 2022, 15(20), 7513; https://doi.org/10.3390/en15207513
Submission received: 30 August 2022 / Revised: 5 October 2022 / Accepted: 7 October 2022 / Published: 12 October 2022
(This article belongs to the Topic Energy from Sea Waves)

Abstract

:
CFD modeling of an innovative wave energy device has been carried out in this study. OpenFoam wave modeling solver interFoam has been employed in order to investigate the energy extraction capability of the wave energy device. The innovative concept is based on utilizing the pressure differential under the crest and trough of a wave to drive flow through a pipe. The simulated surface elevation of a wave has been validated against the reported wave tank experimental data in order to provide confidence in the modeling outcome. Further, simulations have been carried out with the device placed near to the bottom of the numerical wave tank in order establish the energy extraction potential. The simulation results confirm that effective power can be generated from the wave energy device. The efficiency of the device decreases with the increase in wave height, although it increases with the wave period. Higher power-take off (PTO) damping is also beneficial in extracting increased energy from waves.

1. Introduction

Climate change is creating unwanted consequences in many parts of the world. The increased global demand for energy is continuously being met by fossil fuels with the increase in carbon emissions aggravating the situation. To keep climate change under control, many countries have set a net zero emission target and as a result, various renewable energy sources are making an impact in delivering clean energy. Both onshore and offshore wind energy technologies have gained maturity and commercial uses in many countries. However, wind energy alone is not enough to provide all the energy demands. Energy from waves promises to be a key renewable energy source due to its abundant availability in many places. Several attempts have been made to develop various concepts of wave energy converters (WECs) and general reviews of existing design concepts can be found in Falcao [1], Guedes et al. [2], Falnes [3], and Drew et al. [4]. The most mature wave energy extraction devices include: (i) wave activated body, (ii) point absorber, (iii) oscillating water column, and (iv) overtopping device (Mustapa et al. [5]). A wave activated body extracts energy by moving the body under the influence of wave interactions. The body movement is allowed by using universal joints and the body movement is converted into power through hydraulic or mechanical transmission. A point absorber is a floating body which oscillates in the heave motion of waves. A point absorber typically consists of a floater and a power take-off unit. An oscillating water column works by the heaving motion of a water body through a chamber above which air is compressed and passes through a bi-directional turbine. An overtopping device works by bringing water from waves in a reservoir and converting the potential energy into mechanical energy through a turbine. One of the major challenges faced by all wave energy converter designs is the high cost of energy production as well as the high capital cost of device construction. This is due to the fact that wave energy converter devices should be designed to withstand rarely occurring extreme wave conditions. If a wave converter is made submersible, it will not be subjected to extreme wave conditions. Several submersible wave energy converters have been proposed that make use of differential dynamic pressure in a wave field to drive fluid flow to run a turbine. McNatt et al. [6] provided an analysis of available pressure resources for optimizing the length of a generic pressure differential device placed on a seabed. Pressure differential (PD)-based devices with different concepts such as a cylindrical duct (Simon [7]), horizontal plates (Graw [8] and Orer and Ozdamar [9]), and deformable air chambers connected by a pipe with an internal bi-directional turbine (Barbarit et al. [10]) have been proposed. A harmonic pressure differential device driving a linear induction generator from a hydraulic piston operated by a horizontally oscillating water body has been investigated analytically (Schonborn [11]). In this present study, an innovative concept has been developed using a submerged pipe with a bi-directional turbine placed inside the middle of the pipe to extract wave energy. In this concept, the dynamic pressure difference under a crest compared to that of under a trough of a gravity wave drives a bi-directional oscillating flow through a pipe placed horizontally in a wavefield. This oscillating flow in turn drives a bidirectional turbine such as a wells turbine extracting wave energy. In the present study, CFD modeling has been used to prove the concept and provide performance optimization.
CFD modeling has become one of the most suitable techniques for testing the concept of wave energy devices. Notably, it has been extensively used for testing the concept of oscillating water column devices in a numerical wave tank. A numerical wave tank model uses the volume of fluid (VOF) technique with the use of various wave-generating and damping schemes to generate regular and irregular waves. Windt et al. [12] provided an extensive review of numerical wave tank modeling strategies under CFD open source software OpenFoam. Rezanejad et al. [13] used OpenFoam CFD software to investigate a new concept of the oscillating water column with a stepped bottom condition. They used an orifice outlet to represent the power take-off (PTO) damping. Their model used the VOF method for wave surface tracking and the SST k ω model for capturing turbulence effects. The relaxation zone technique was used to generate and absorb free surface waves at inlet and outlet boundaries. Simulated wave elevations have been verified against experimental measurements and the performance of the device has been shown to improve with the stepped bottom geometry. Dai et al. [14] used commercial CFD software Star-CCM+ to simulate a wave tank using the VOF model for wave surface tracking and the SST k ω model for treating turbulence. They have investigated the scaling effects in oscillating water column devices using an orifice plate to represent the power take-off (PTO) damping. In their simulations, waves were generated by specifying a time-varying velocity and elevation at the inlet using the fifth order Stokes wave theory. Their simulation results show that the power output does not scale with the geometry linearly. Kamath et al. [15] used an open source CFD code REEF3D to simulate the OWC performance under various PTO damping in a two-dimensional numerical wave tank. The wave generation and absorption have been tackled by using the relaxation technique and the PTO has been modeled using a porous layer. Their simulation results show that the hydrodynamic efficiency increases, reaches a maximum value and then decreases with the increase in PTO damping. Monino et al. [16] used commercial software Fluent to simulate OWC performance in a two-dimensional numerical wave tank with the PTO modeled as a porous media. Waves were generated by a piston type paddle using dynamic mesh scheme assigned to the paddle. Their simulation results show that even the simplified numerical setup produced the wave-OWC interaction well. Many CFD articles (Sha et al. [17] and Hasan et al. [18]) have contributed to the methodology adopted in this study.
The aim of the present study is to apply the CFD technique to studying the hydrodynamics efficiency of an innovative wave energy device that utilizes differential pressure-driven flow through a submerged pipe. In the present study, simulations have been carried out using an open-source CFD software OpenFoam. First, the numerical algorithm and boundary conditions for generating regular waves in a tank were validated against the reported wave tank experimental data of Rezanejad et al. [13]. Then, CFD simulations were performed to investigate the hydrodynamics efficiency of the proposed device.

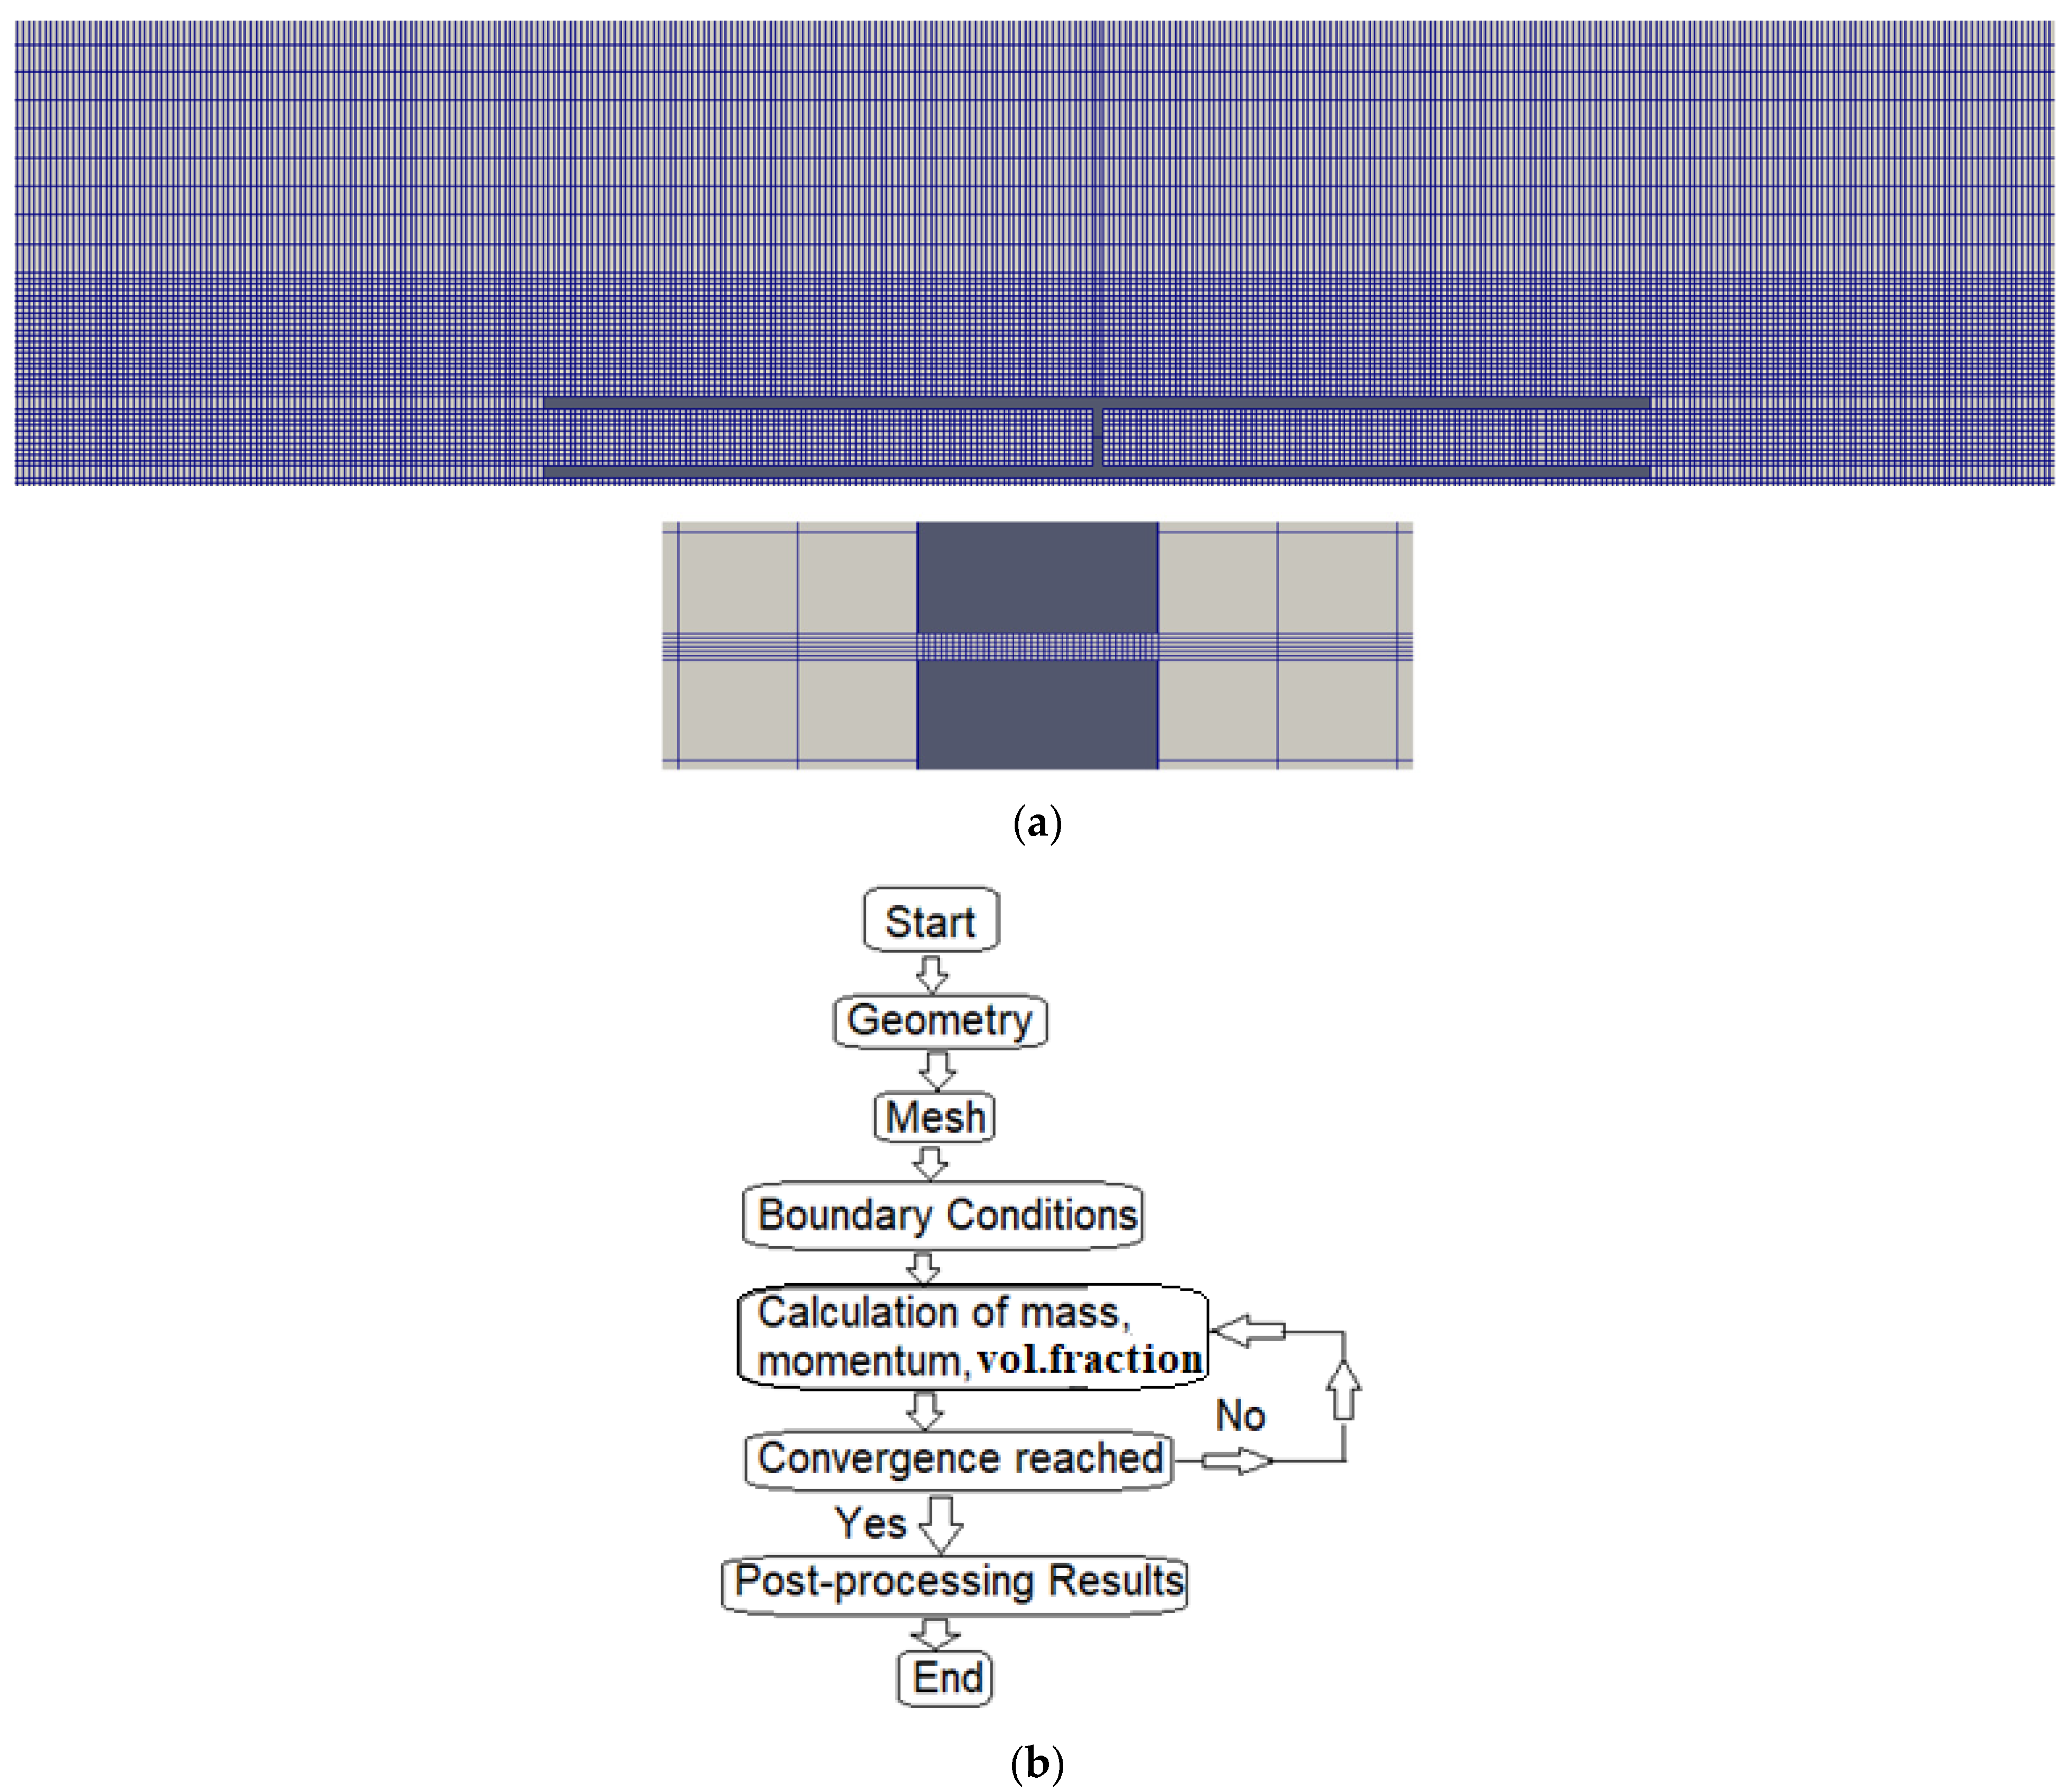
2. Numerical Modeling

The CFD software employed here is OpenFoam, which has an extensive range of features to solve a vast number of complex fluid dynamics problems. The OpenFoam code has a built-in solver named interFoam that predicts the wave surface elevation using the Navier Stokes equation coupled with the volume of fluid (VOF) method.

2.1. Continuity, Momentum, and Volume Fraction

In the VOF method, a single set of continuity and momentum equations is shared by phases (here, air and water) and the volume fraction of each phase is tracked through the computational domain. The governing equations for the VOF model are given below:
Continuity:
. v = 0
Momentum:
ρ v t + v . v = P + μ 2 v + ρ g + F
where, ρ (kg/m3) is the density of the fluid, v (m/s) is the velocity, P (Pa) is the pressure, g (m/s2) is the acceleration due to gravity, μ is the dynamic viscosity (Pa s), t (s) is the time.
The surface tension force in Equation (2) is represented by F (N/m3). The surface tension force is expressed as a volume force and is added to the momentum equation as a source term.
To track the interface between phases, a volume fraction (α) is defined, and the volume fraction equation for one of the phases (α = 1 for water and α = 0 for air) is solved along with the above equations:
α t + . α v = 0
where, v (m/s) is the velocity field, α is the volume fraction of water and varies between 0 to 1.
The properties appearing in the transport equations are determined by the presence of the component phases in each control volume. For example, the density ( ρ ) (kg/m3) is:
ρ = q = 1 2 α q ρ q
Waves were generated using the cnoidal boundary condition at the inlet boundary. The equation for wave elevation at the inlet is given by Wang et al. [19]:
η = H 1 m 1 E m K m 1 + c n 2 ( 2 K m x c t λ )
where, λ (m) is the wavelength, c (m/s) is wave celerity, H (m) is wave height, t (s) is time, K m and E m are the elliptical integral of the first and second kind respectively, c n is the Jacobi’s elliptic function, m is elliptic parameter and it determines the shape of the cnoidal wave.
Following simplified assumptions were made for the simulations:
  • Laminar flow
  • Regular gravity waves
  • Shallow water
  • Two-dimensional geometry

Boundary Conditions

The wave generation model requires the specification of wave height and wave period at the inlet boundary. At the outlet boundary, the shallowWaterAbsortion model was used to absorb the wave. At the inlet and outlet, velocities were specified as zero and an analytical wave modeling equation is used to calculate wave velocities at the inlet and outlet boundaries. At the top boundary, the zero gradient boundary condition has been specified, while the no-slip boundary condition has been used for the tank bed. Further details on the numerical wave tank modeling can be found in Colling et al. [20].

2.2. Performance Assessment

The performance of the wave energy device can be evaluated by estimating the available power in the incident wave and the power absorbed from the wave. The average power absorbed from a regular wave can be determined from the numerical data in the time domain as:
P = 1 t m a x 0 t m a x Δ p t q t d t
where, t m a x (s) is the duration of simulation time, Δ p t (Pa) is the pressure difference across the pipe and q t (m3/s) is the flowrate through the pipe. The available wave power per unit width can be determined by:
P a v a i l = 1 8 ρ g H 2 C g
where, C g (m/s) is the group velocity of the wave and H   m is the wave height. The group velocity is given by,
C g = 1 2 ω k 1 + 2 k h s i n h   2 k h
where, ω , κ , h (rad/s), (/m), and (m) are circular frequency, wave number, and water depth respectively. In shallow water, circular frequency and wave number are related by,
ω 2 = g k   t a n h k h
The efficacy of the wave energy device then can be determined as:
η = P P a v a i l D
where, D (m) is the diameter of the pipe.

2.3. Pressure Resource

The pressure resource can be described as the amount of pressure difference available to the device for forcing water to flow through the pipe. The pressure difference between two arbitrary points in a wave field can be written as,
Δ P t = P 1 x 1 , y 1 , z 1 , t P 2 x 2 , y 2 , z 2 , t
where, x , y , z (m), (m), (m) represent location, while t (s) is time.
According to the linear wave theory, the pressure due to a wave field in an undisturbed water can be given as:
P = ρ g H 2 c o s κ x ω t c o s h   κ h + z c o s h   κ h
where, ρ (kg/m3) is density, H (m) wave height, κ (m−1) is wave number, h (m) is water depth, and z (m) is the depth of device measured from the free surface. Combining Equations (11) and (12), the maximum pressure difference between two points is achieved, when one point is under the crest and the other point is under the trough of the wave i.e., the distance between two points is half or any multiple of the half of the wave length. However, in the presence of a submerged body, the pressure field will be modified due to the diffraction pressure which is the component of pressure due to the presence of a body, and the radiation pressure which is due to the power absorbed or radiated back to the wave due to the body motion. The CFD modeling allows the inclusion of the effects of diffraction and radiation in the pressure calculation.

3. Results and Discussion

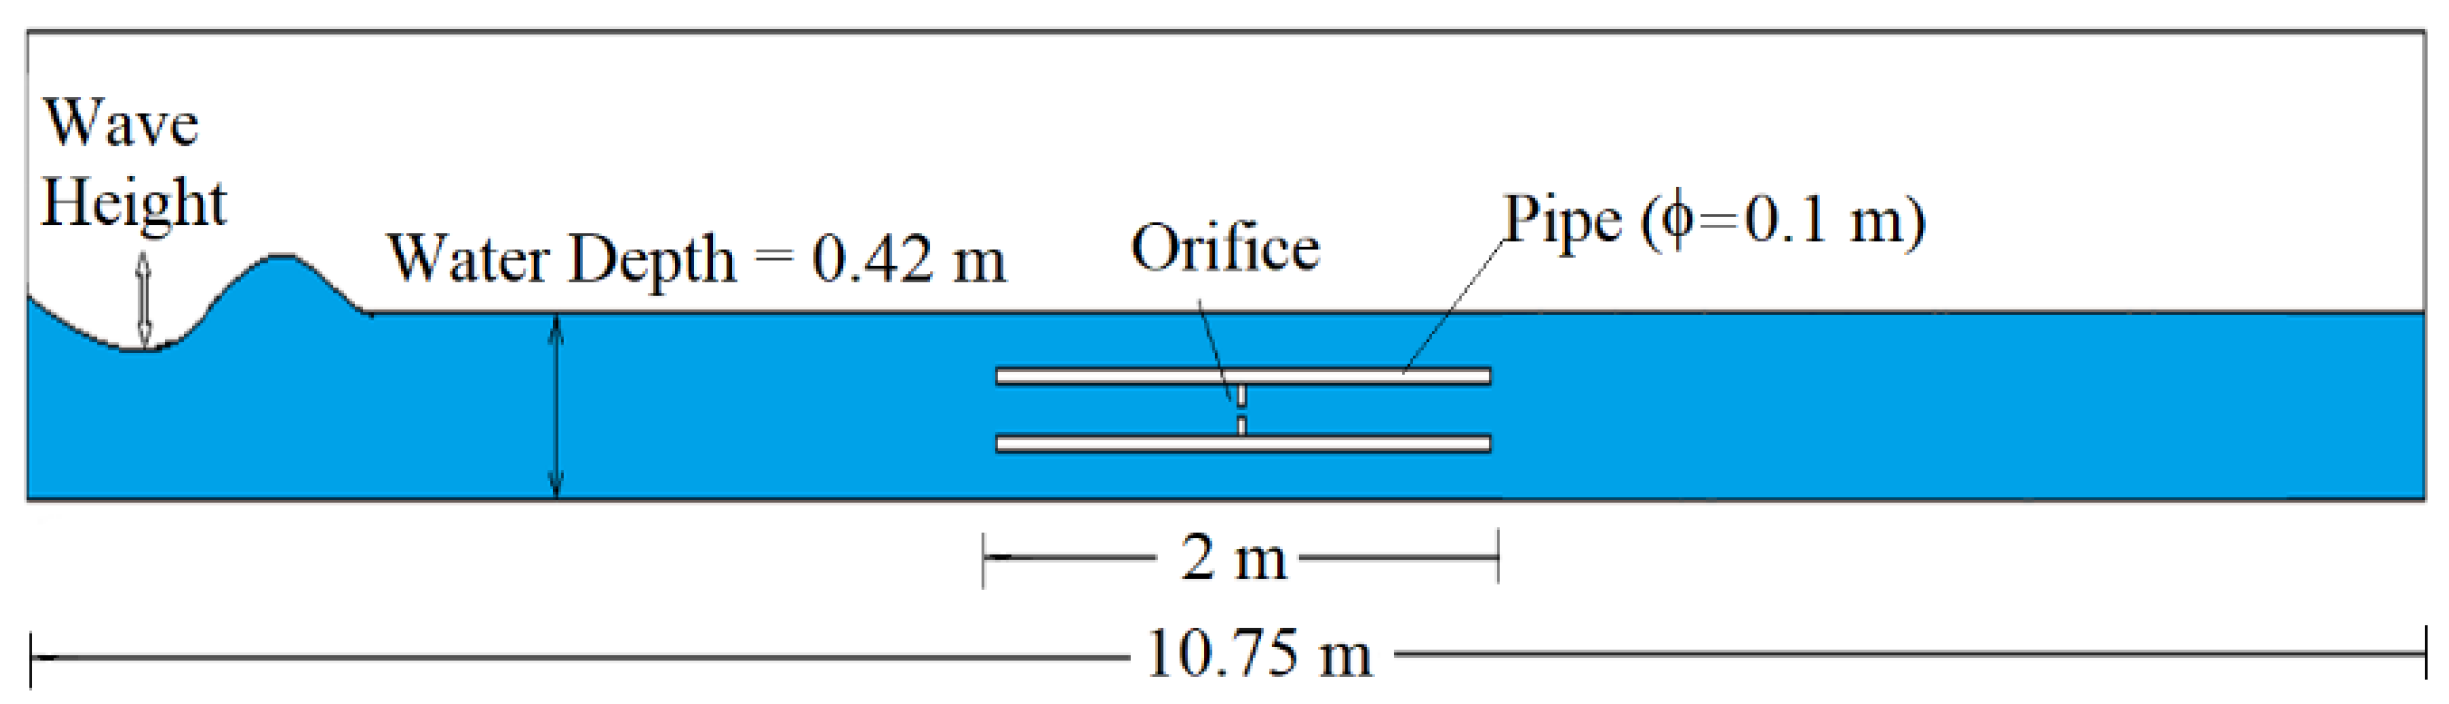
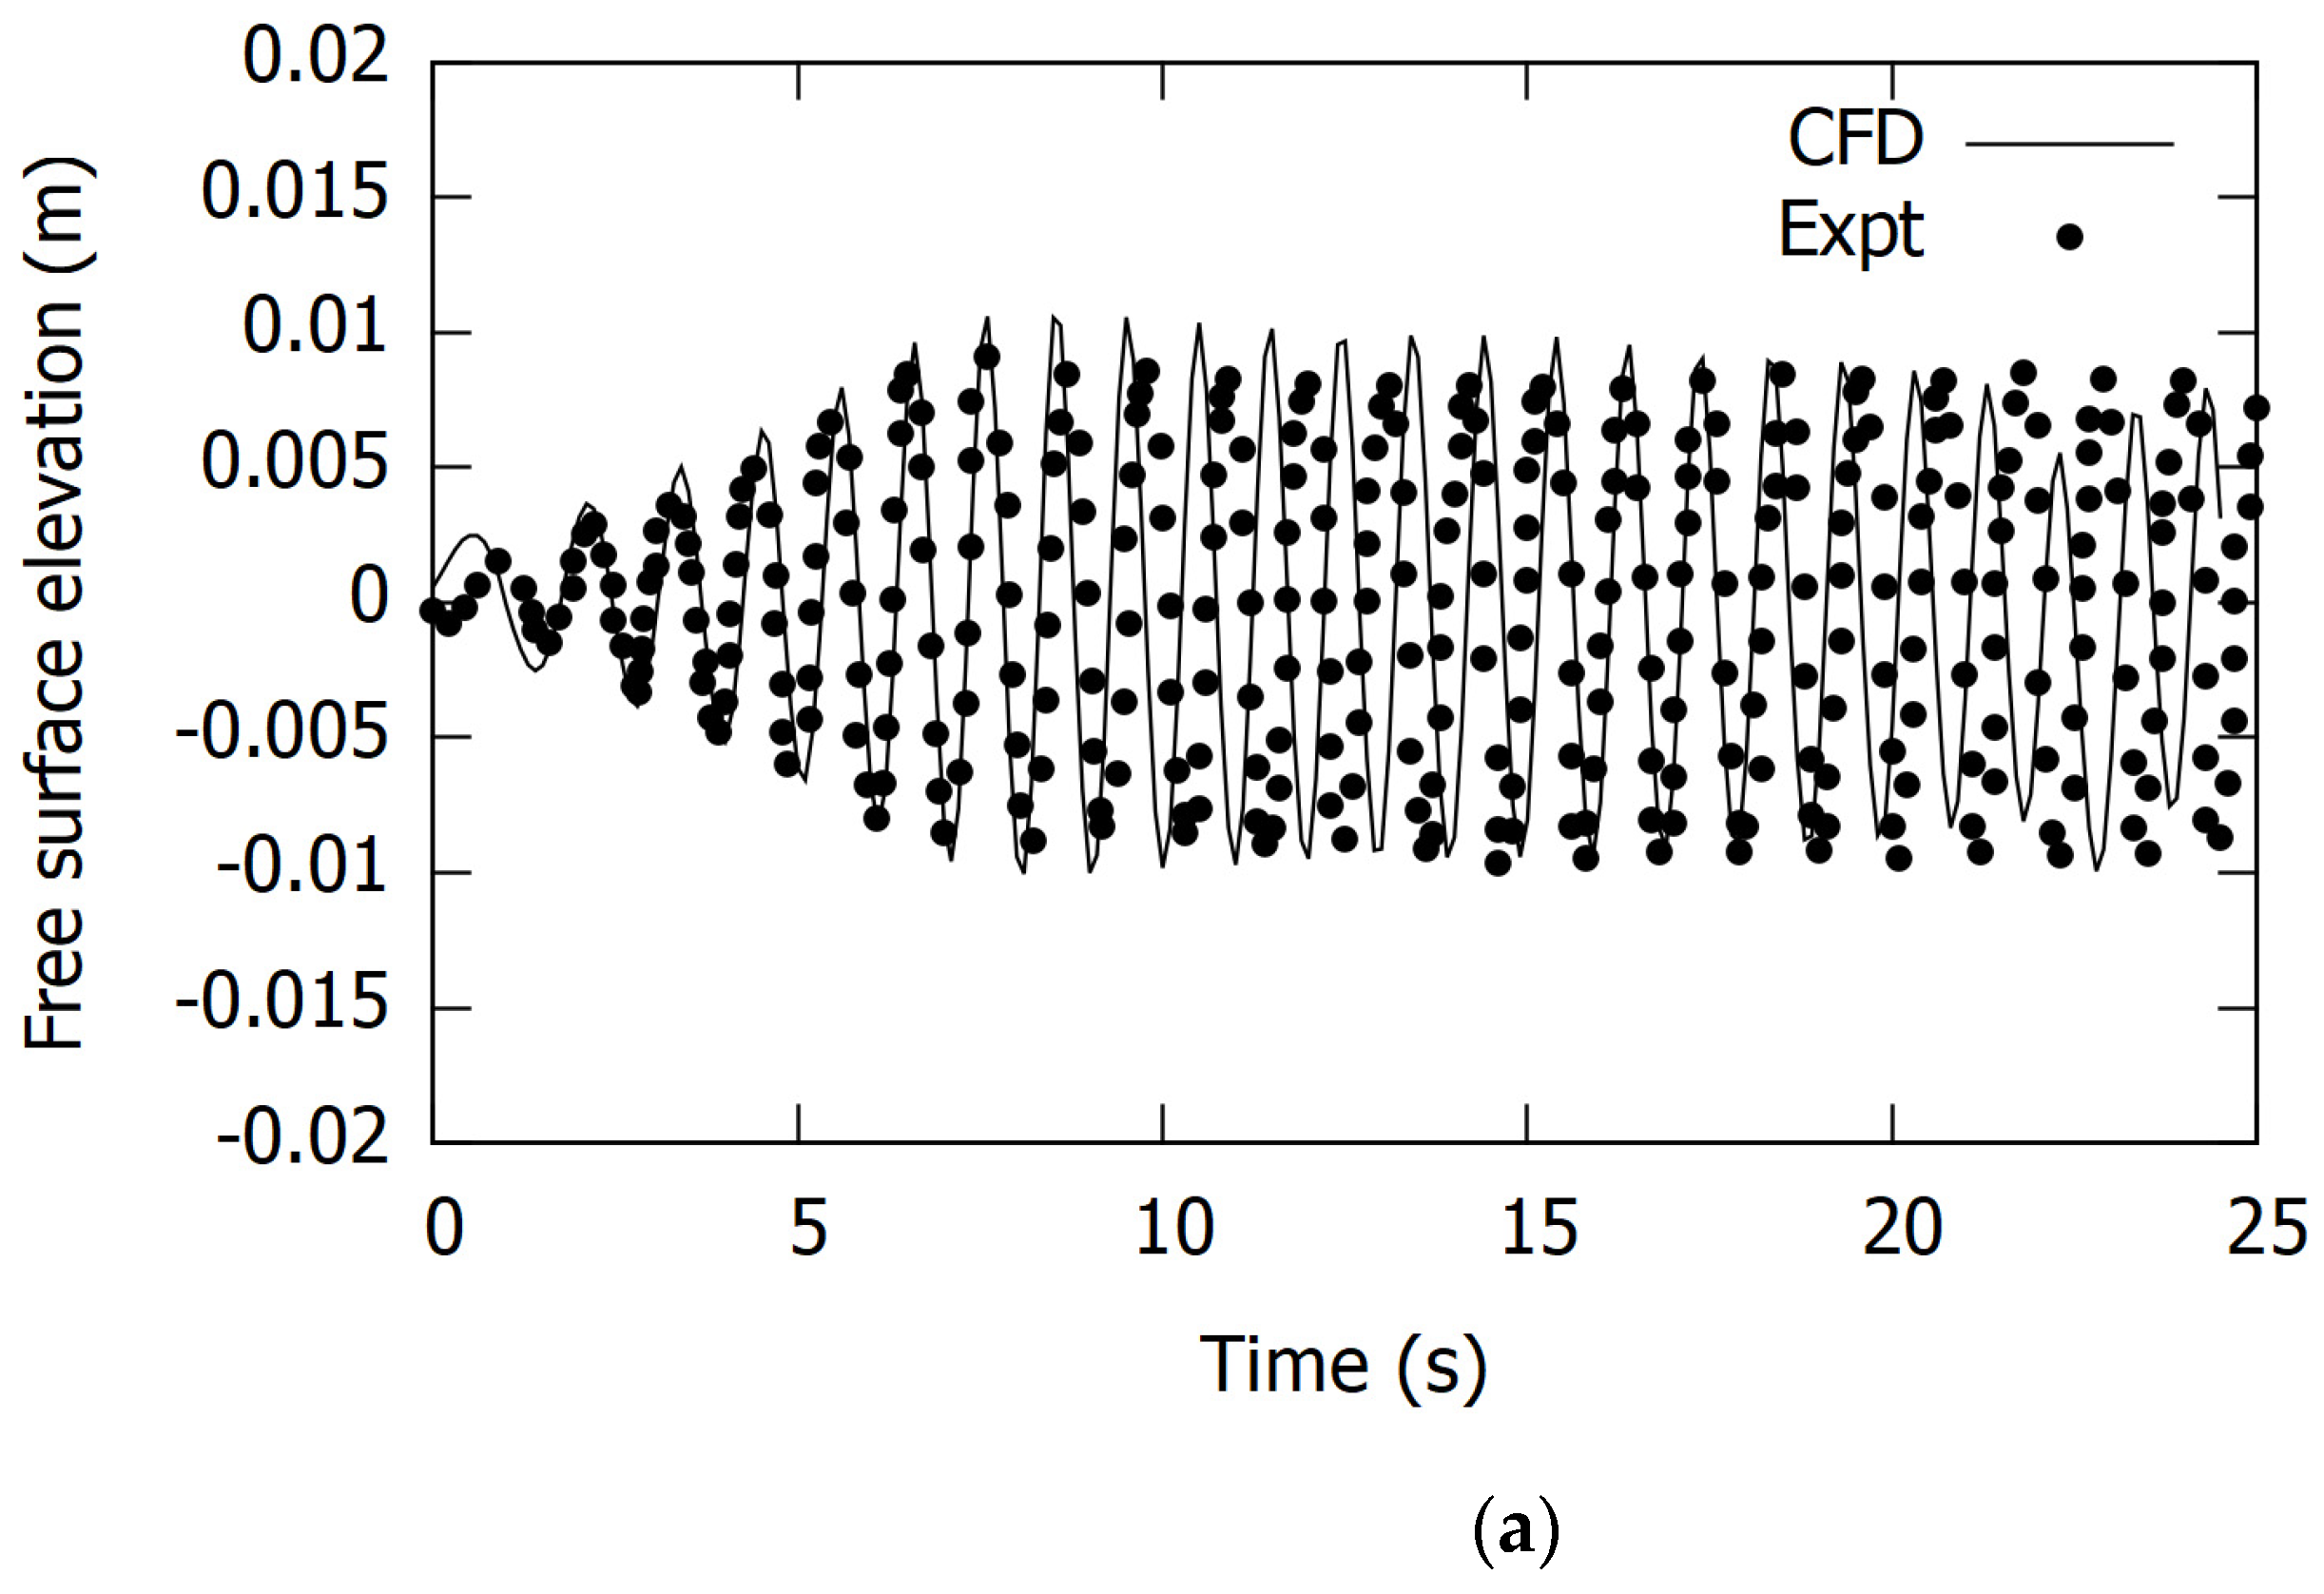
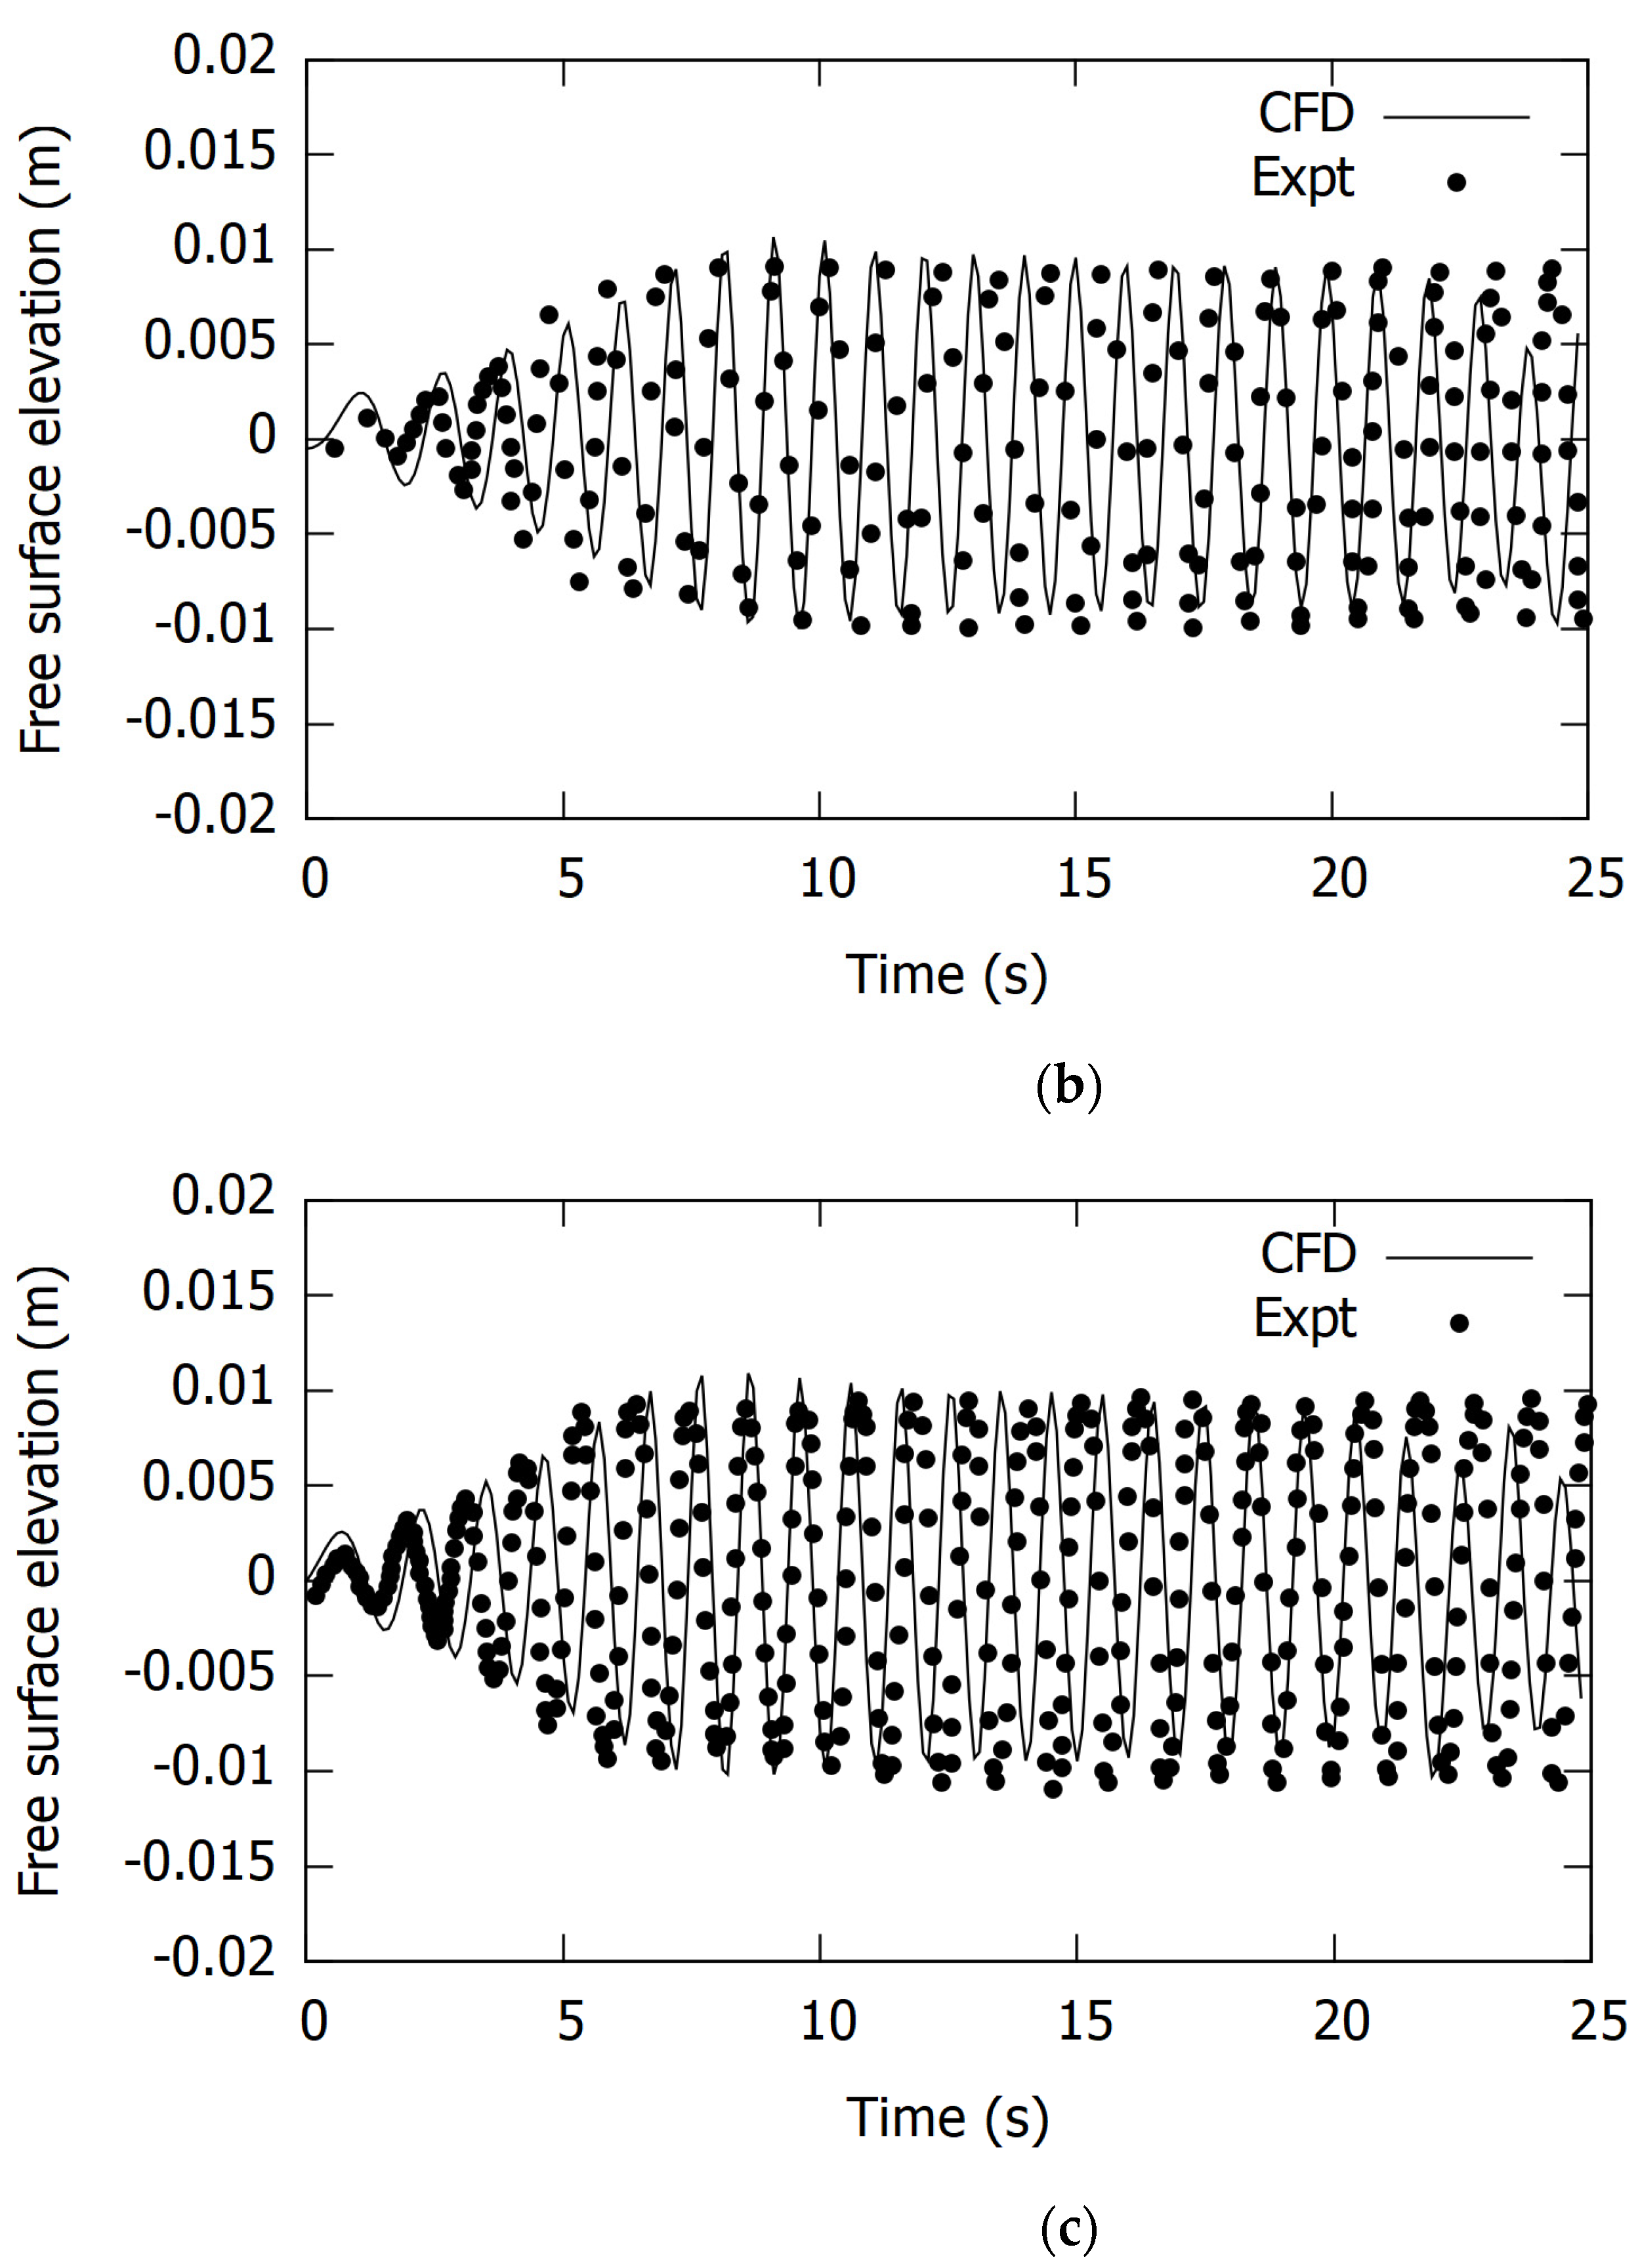
3.1. Model Setup and Validation

The schematic drawing of the proposed wave energy device is given in Figure 1. The main feature of the device is a circular pipe of 0.1 m in diameter and 2 m long. In the simulation, the pipe is placed at the bottom of the tank. To simulate the damping effect of a turbine, an orifice plate is placed at the center of the pipe. Two different orifice sizes of 1 mm and 2.5 mm were used in the simulation. Table 1 shows the design parameters considered in the present study. Simulations have been carried out on two-dimensional geometry and thus the pipe is represented by a duct. The wave tank is 10.75 m long and 0.65 m wide, and the water depth is 0.42 m, which is taken from Rezanejad et al. [13]. Figure 2a shows the mesh generated using Salome 9.3 software, and meshes were concentrated inside the pipe and near the orifice. Meshes were successively coarsened away from the pipe. The flow chart on the sequence of the CFD methodology is shown in Figure 2b. A total of 1.12 million cells were used in the simulation after carrying out a progressive mesh independence test (Table 2). The free surface elevation is normalized with wave height between experiments (Rezanejad et al. [13]) and computational tests in this study. The maximum deviation of this parameter varies from 0.5% with 1.12 million cells to 20% with 31,500 cells. In order to verify the accuracy of the numerical set-up, first, a numerical wave was generated in an empty tank without the presence of the pipe. Numerical regular waves were generated in the simulation for a time period T = 1.0 s and wave height of H = 0.02 m. Figure 3 shows the surface wave elevation at three different locations within the wave tank. This figure shows that the surface wave elevations have very well reproduced the experimental data of Rezanejad et al. [13] in the early stage of wave development. The wave surface elevation prediction somewhat deteriorates after 20 s, most possibly due to a non-accurate prediction of turbulence. The maximum difference between experimental wave elevation and CFD wave elevation is less than 5%. In the present model, water flow within the wave is modeled as laminar. Detailed interaction of air-water at the interface including air-entrainment, air vortices, and turbulence effects have not been considered. However, the results from the present computational study with 1.12 million cells match well with the experiment (Rezanejad et al., [13]) with up to 95% accuracy at all three water gage locations, WG1, WG2, and WG3 respectively. Hence the validation tests are proved to be successful and further tests on PTO with the orifice are allowed.

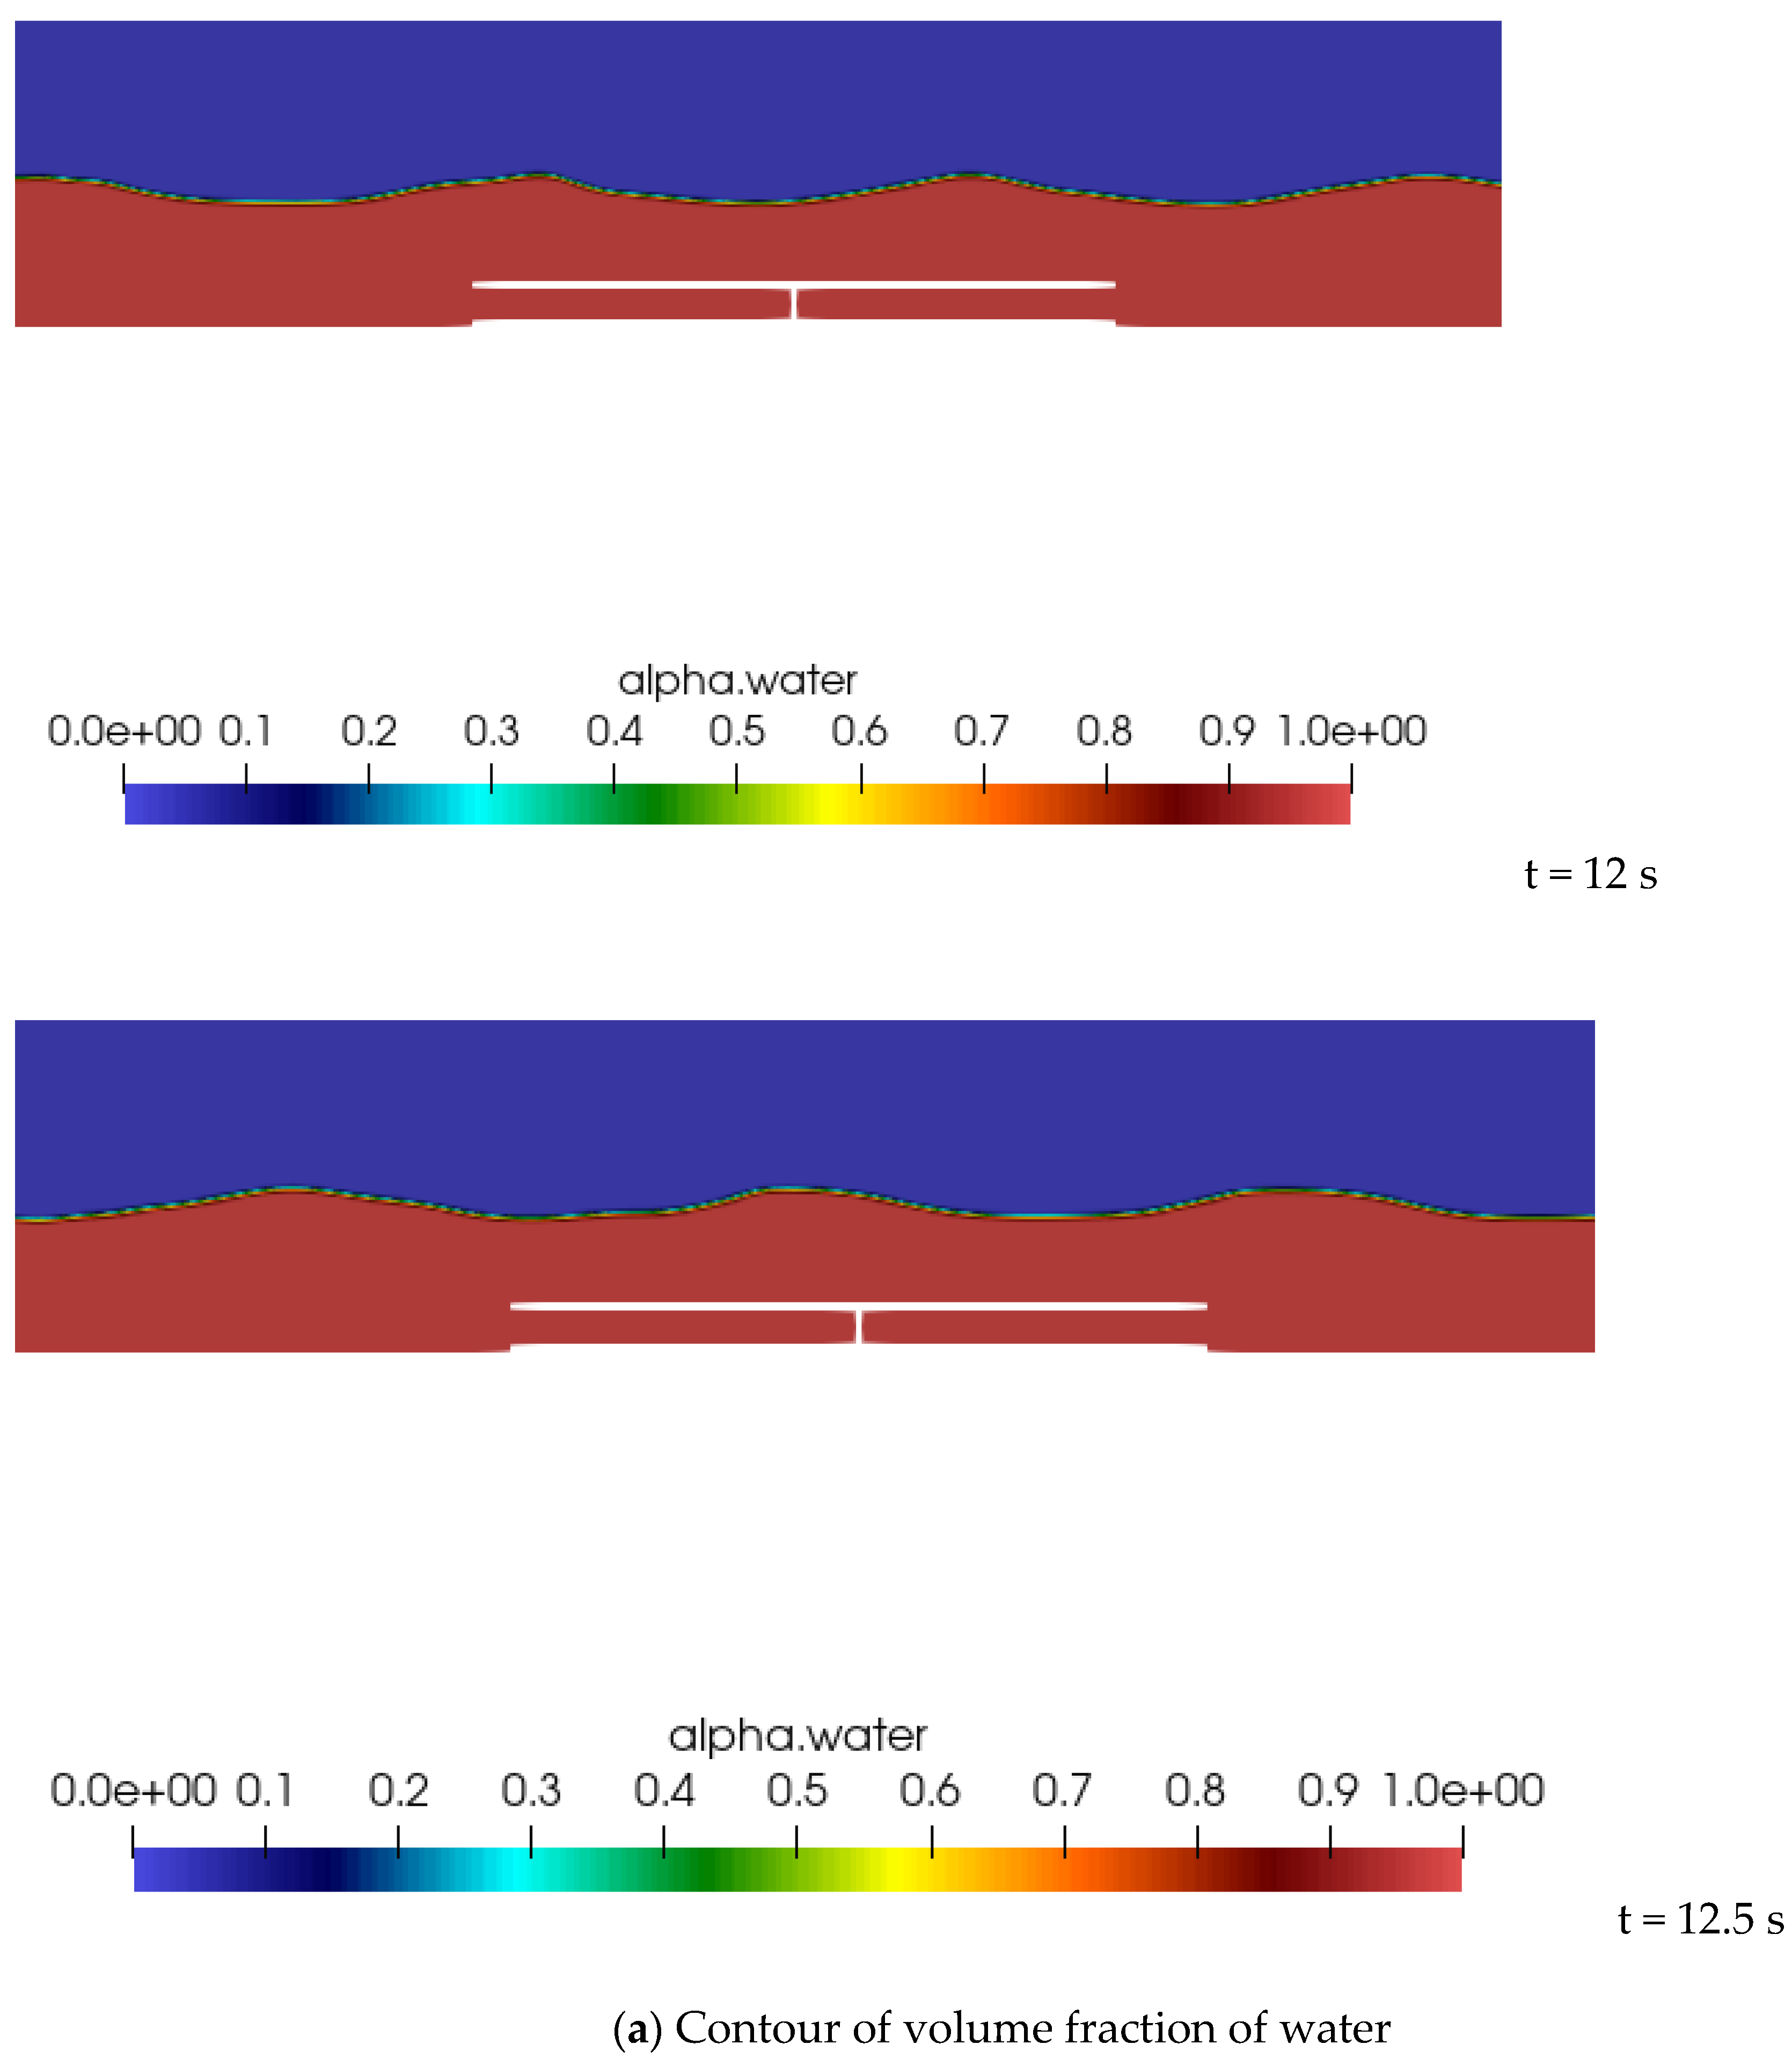
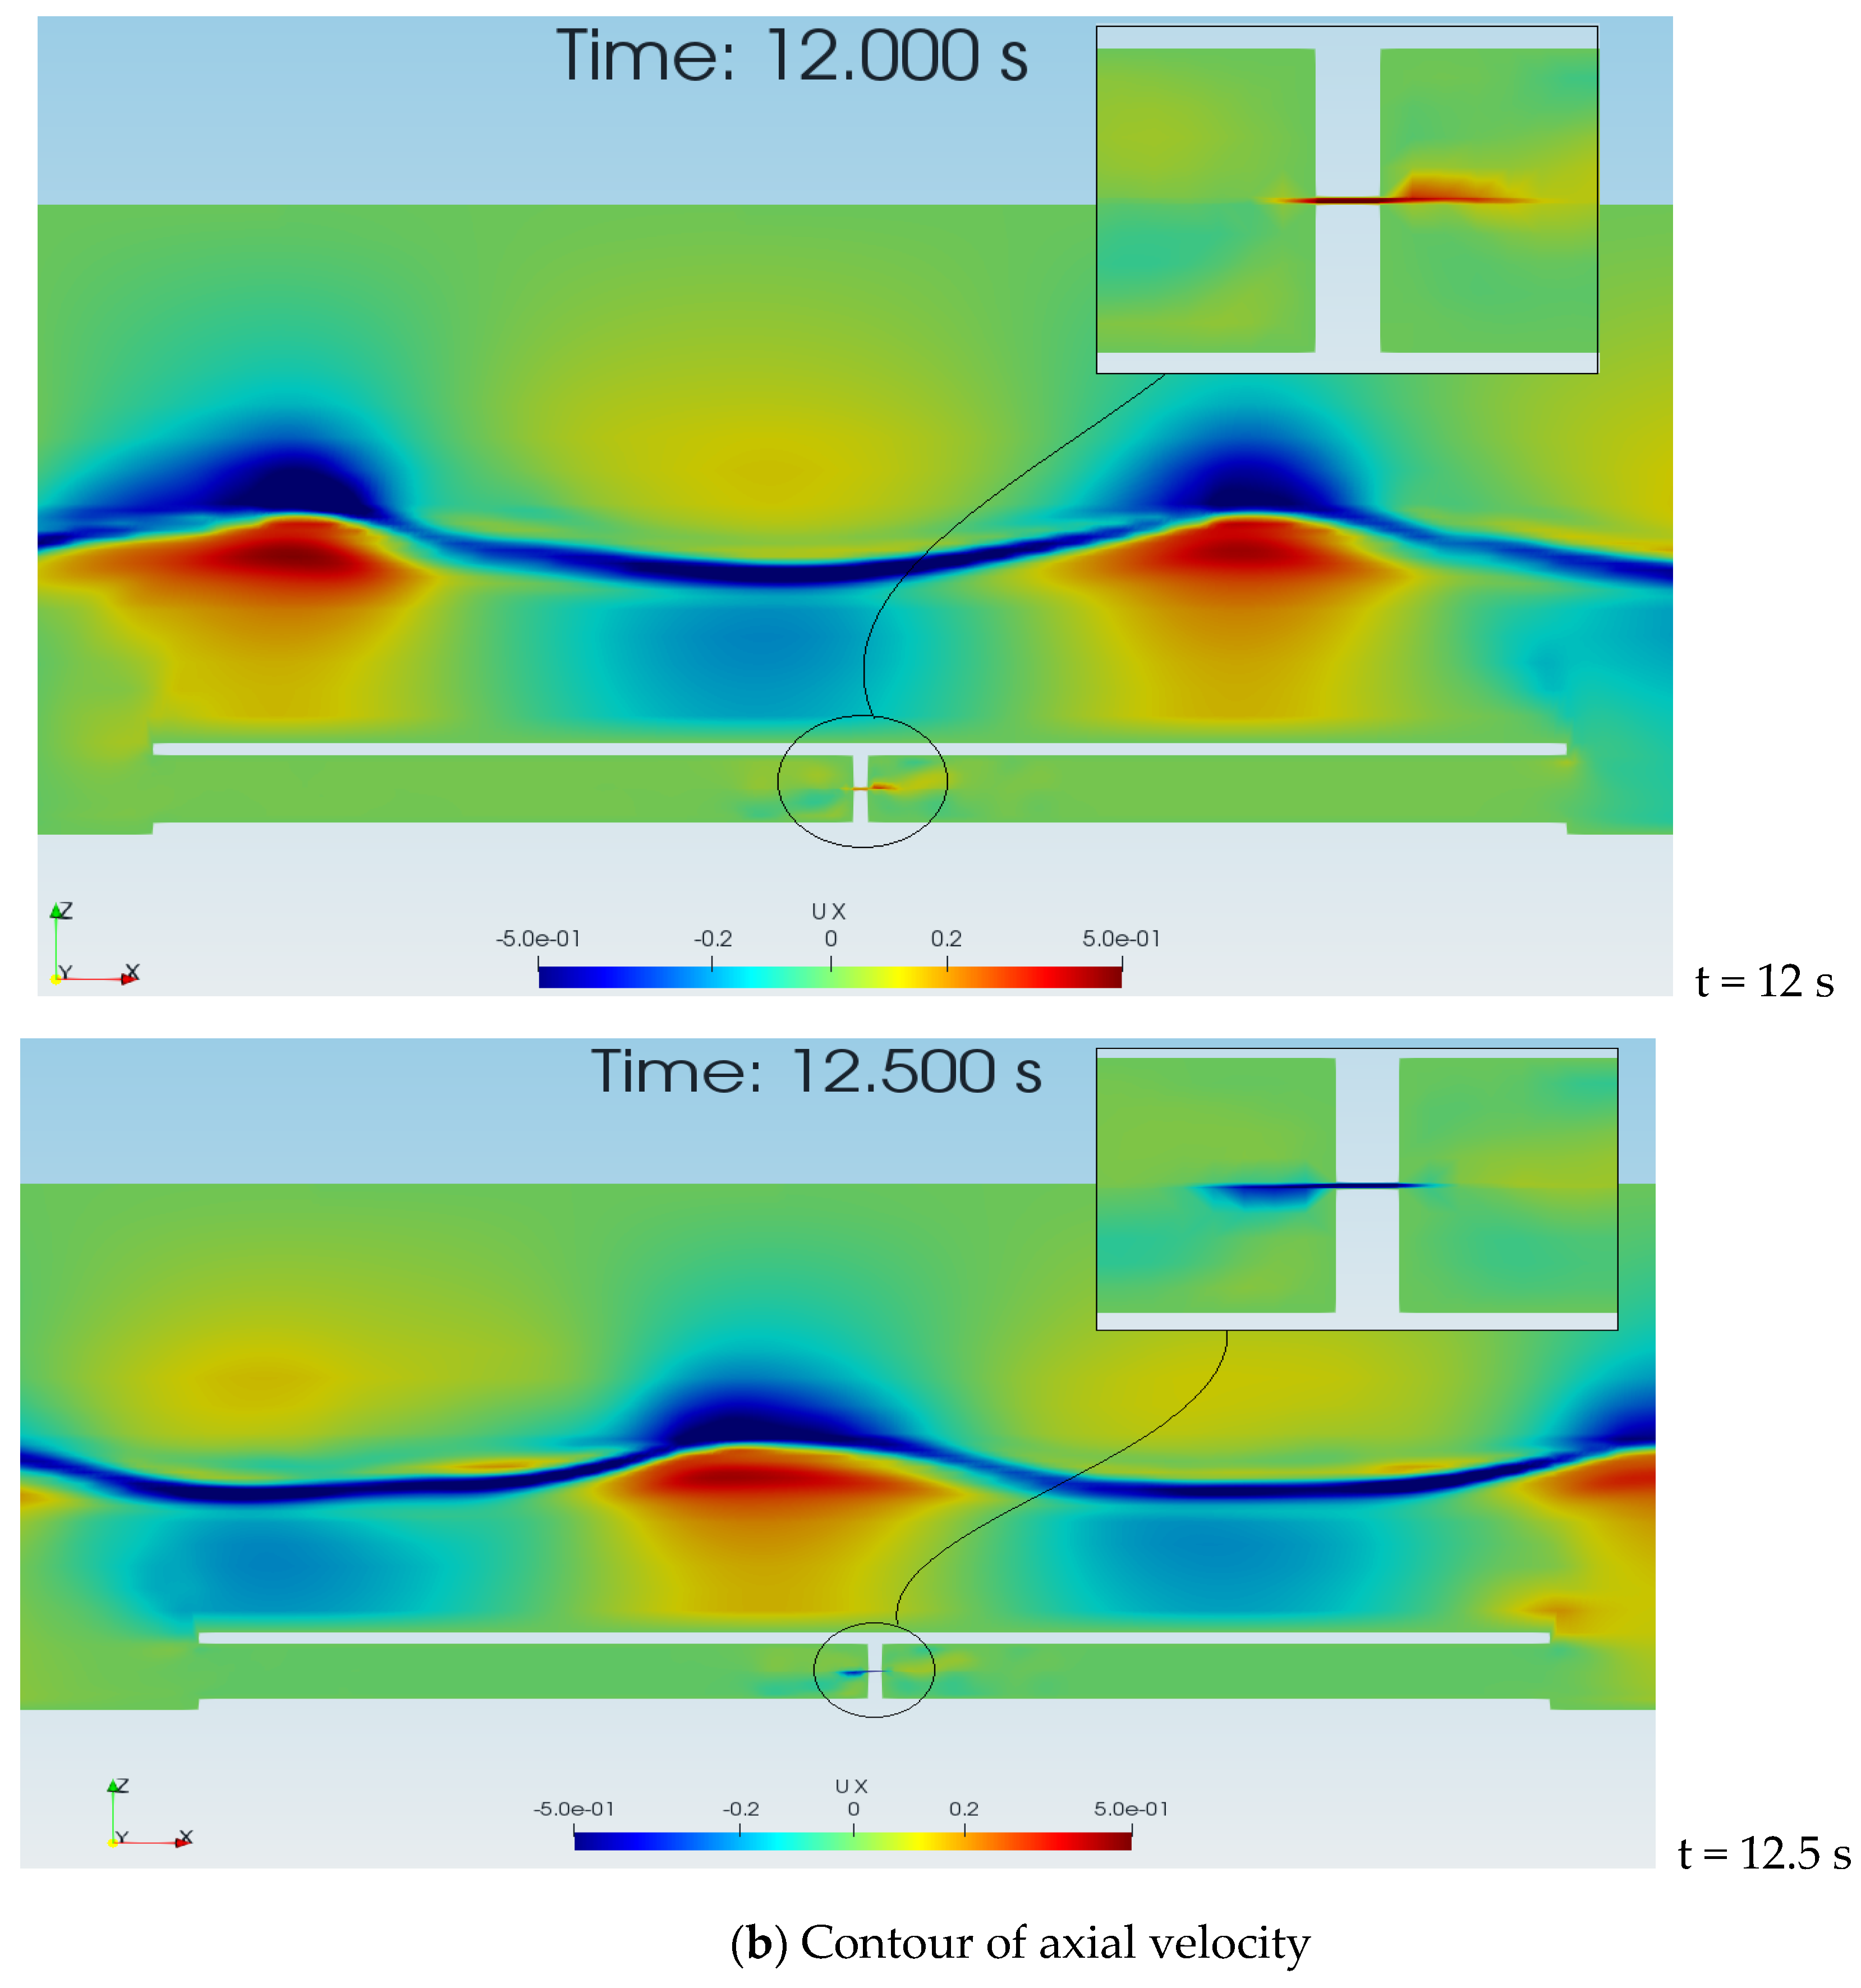
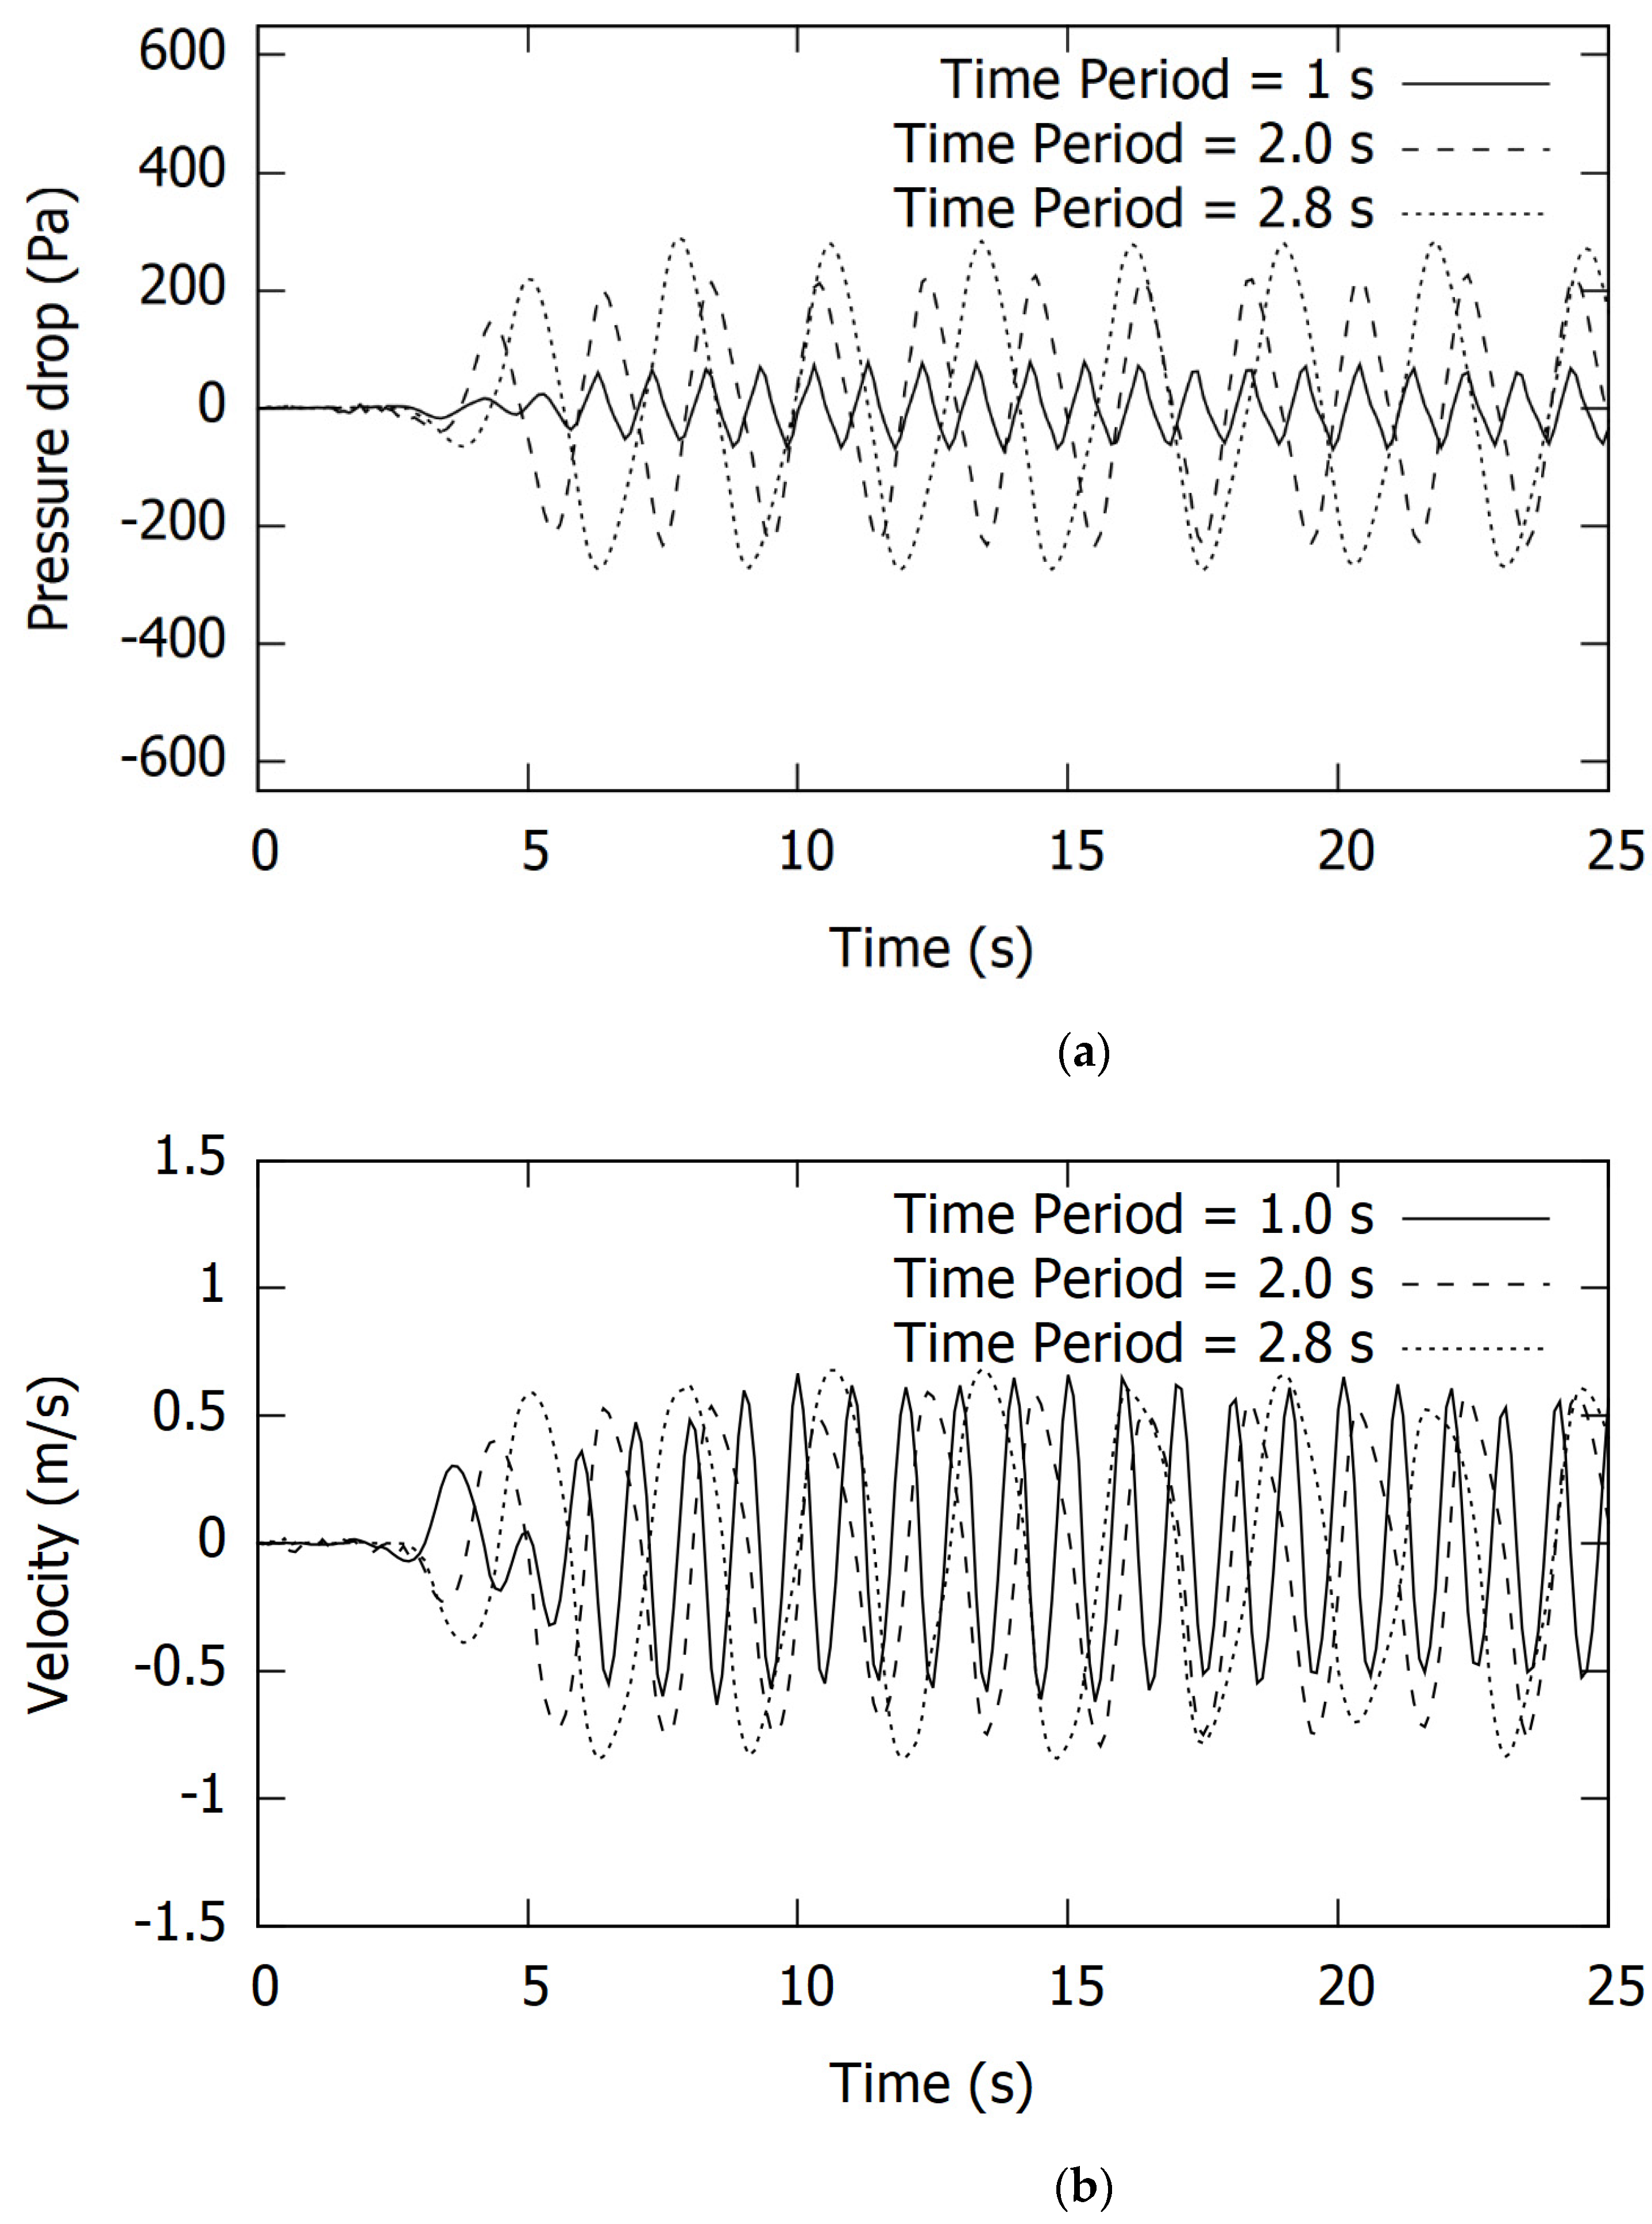
3.2. Flow Dynamics in the Wave Energy Extraction Device

CFD simulations have been carried out for several wave heights, time periods, and orifice sizes with the base case set as the 6 cm wave height, 2.5 mm orifice size, and 1.0 s time period of the wave.
Figure 4a shows the contour plots of the volume fraction of water at two different times. This figure shows the development and movement of waves within the tank and the differences in the height of crests and troughs. These crests and troughs create a differential pressure at the inlet and out of the pipe driving a fluid flow.
Figure 4b shows the contour plots of velocity at instances when the velocity is maximum through the orifice for the base case. It is evident from the figure that the concept of differential pressure-driven submersible devices works well in driving water through the orifice plate. The figure also shows that there is a time lag between the peak wave elevation and the peak velocity through the orifice. The peak velocity occurs when the wave crest has already moved away from over inlet of the pipe. An optimization of the pipe length or operating conditions is needed so that the peak velocity occurs when the inlet is over the crest, while the outlet is under the trough of the wave for extracting the maximum available energy.

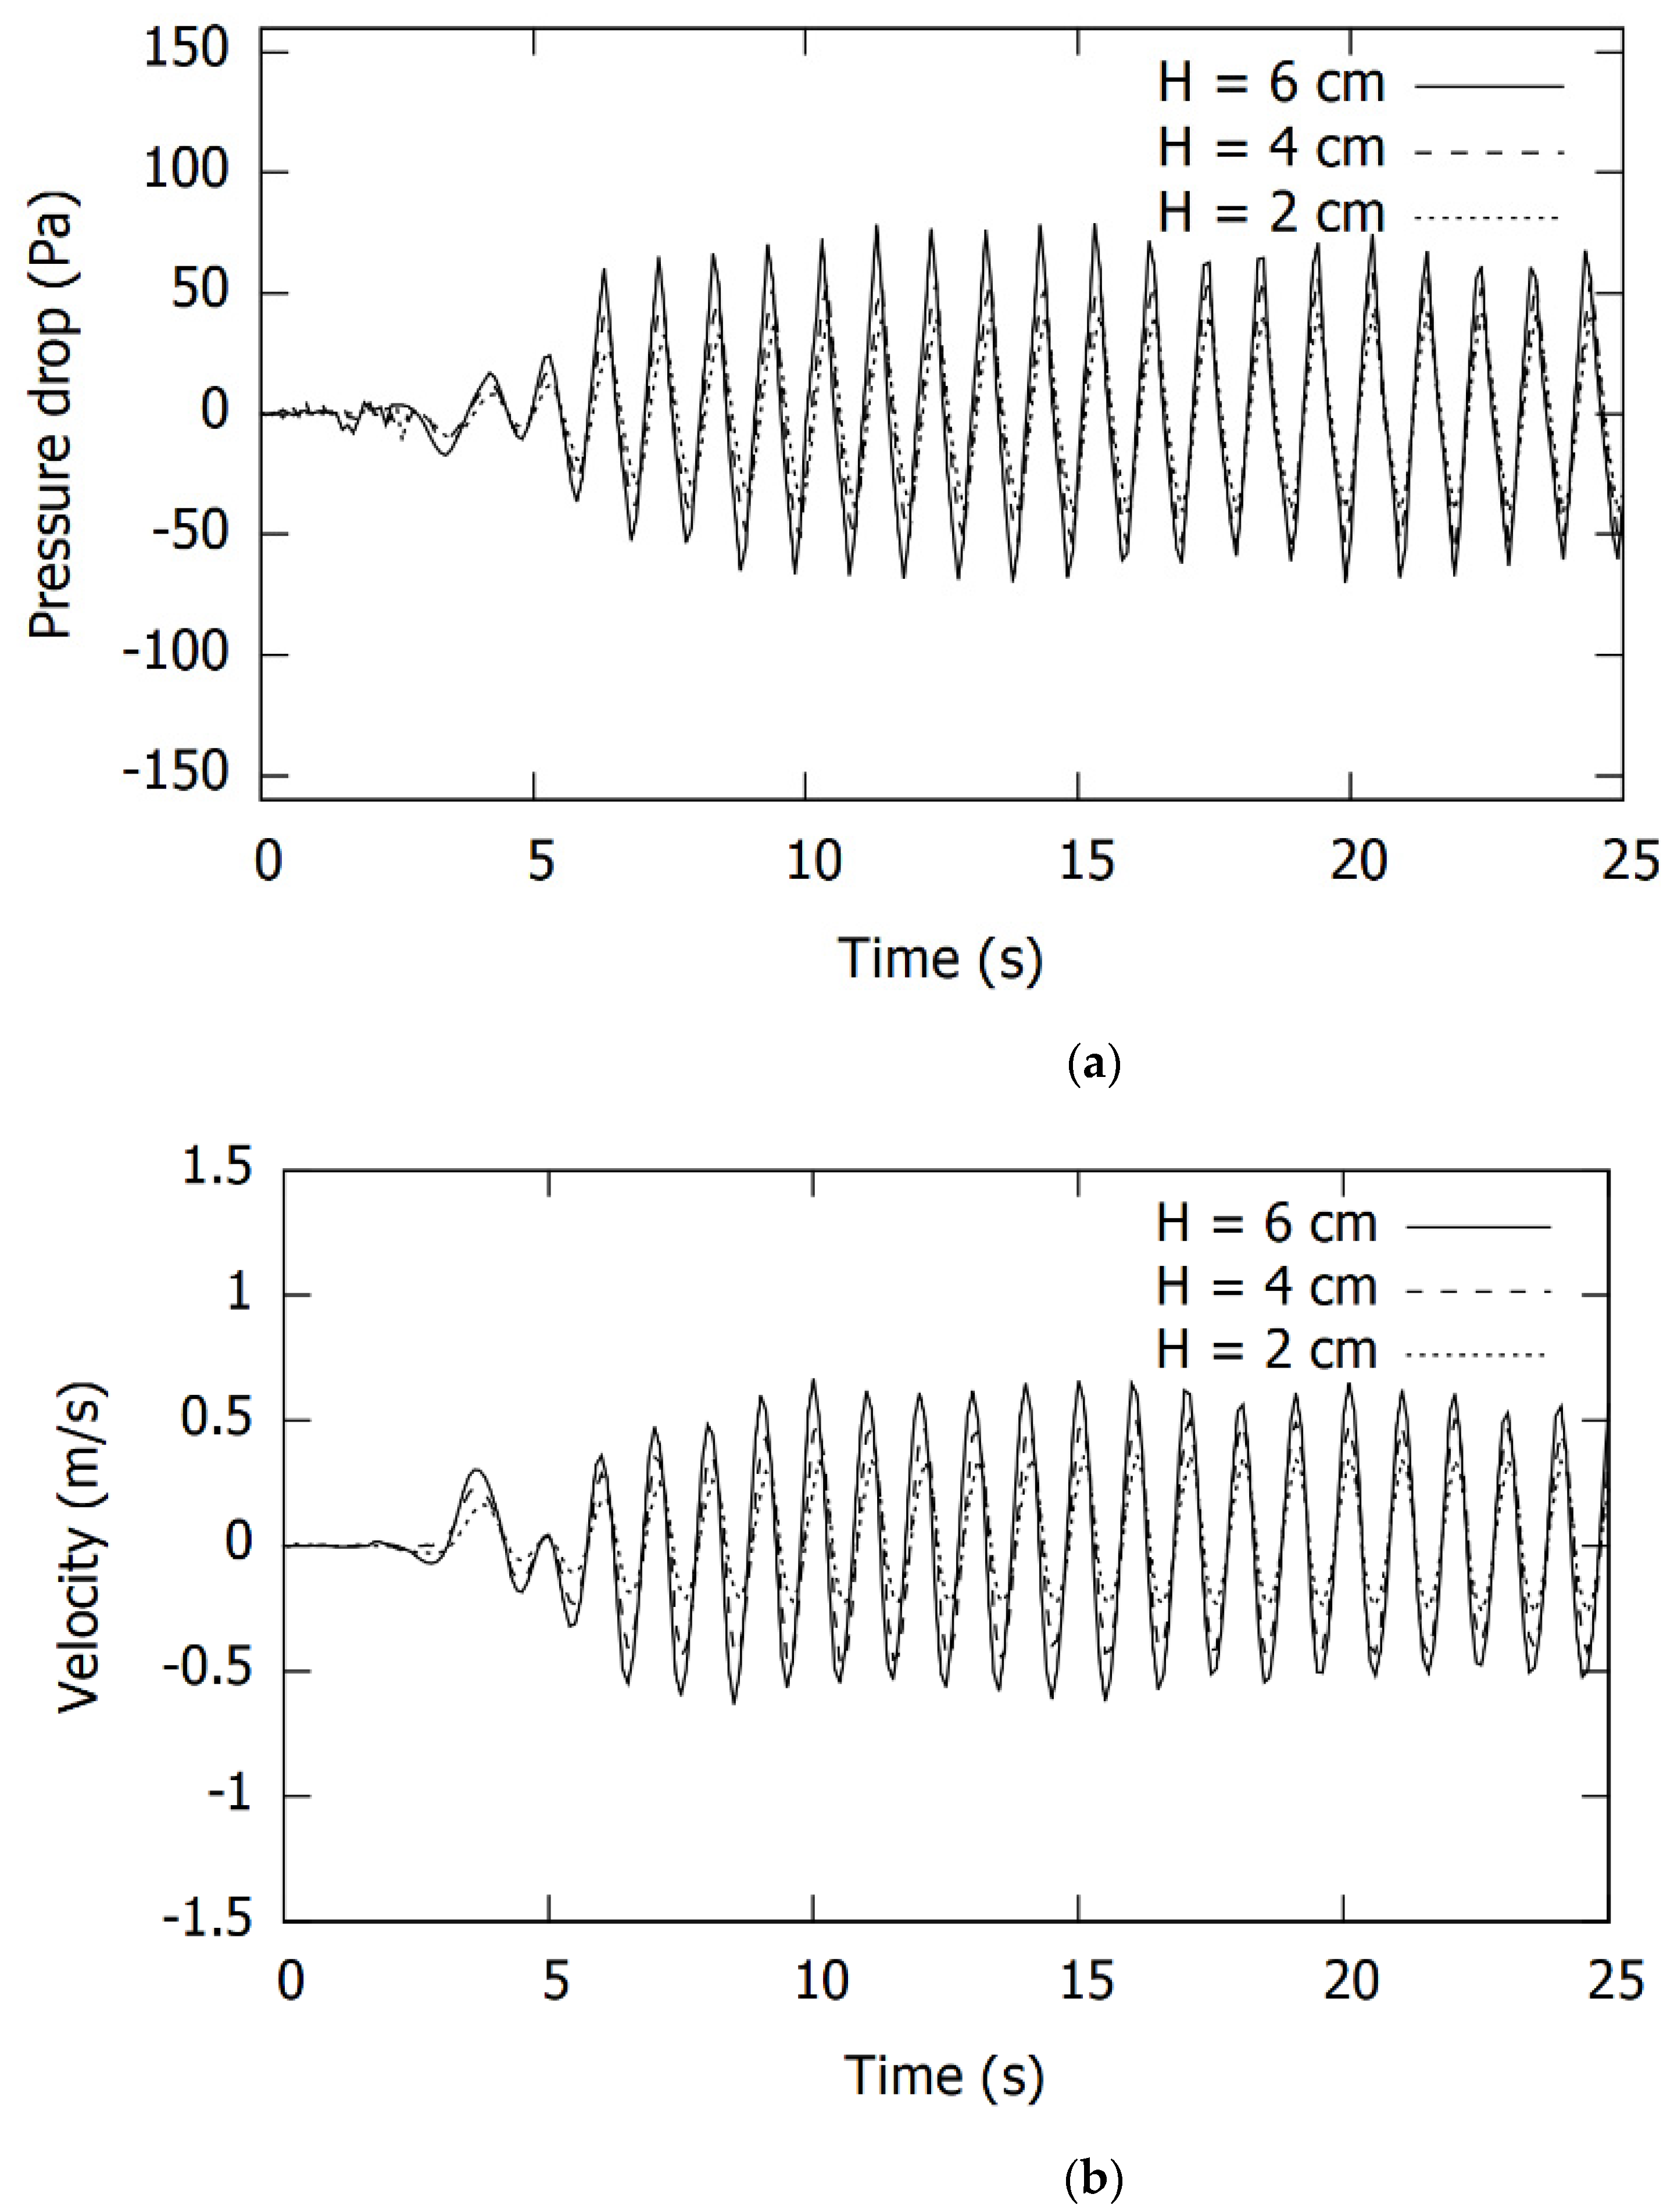
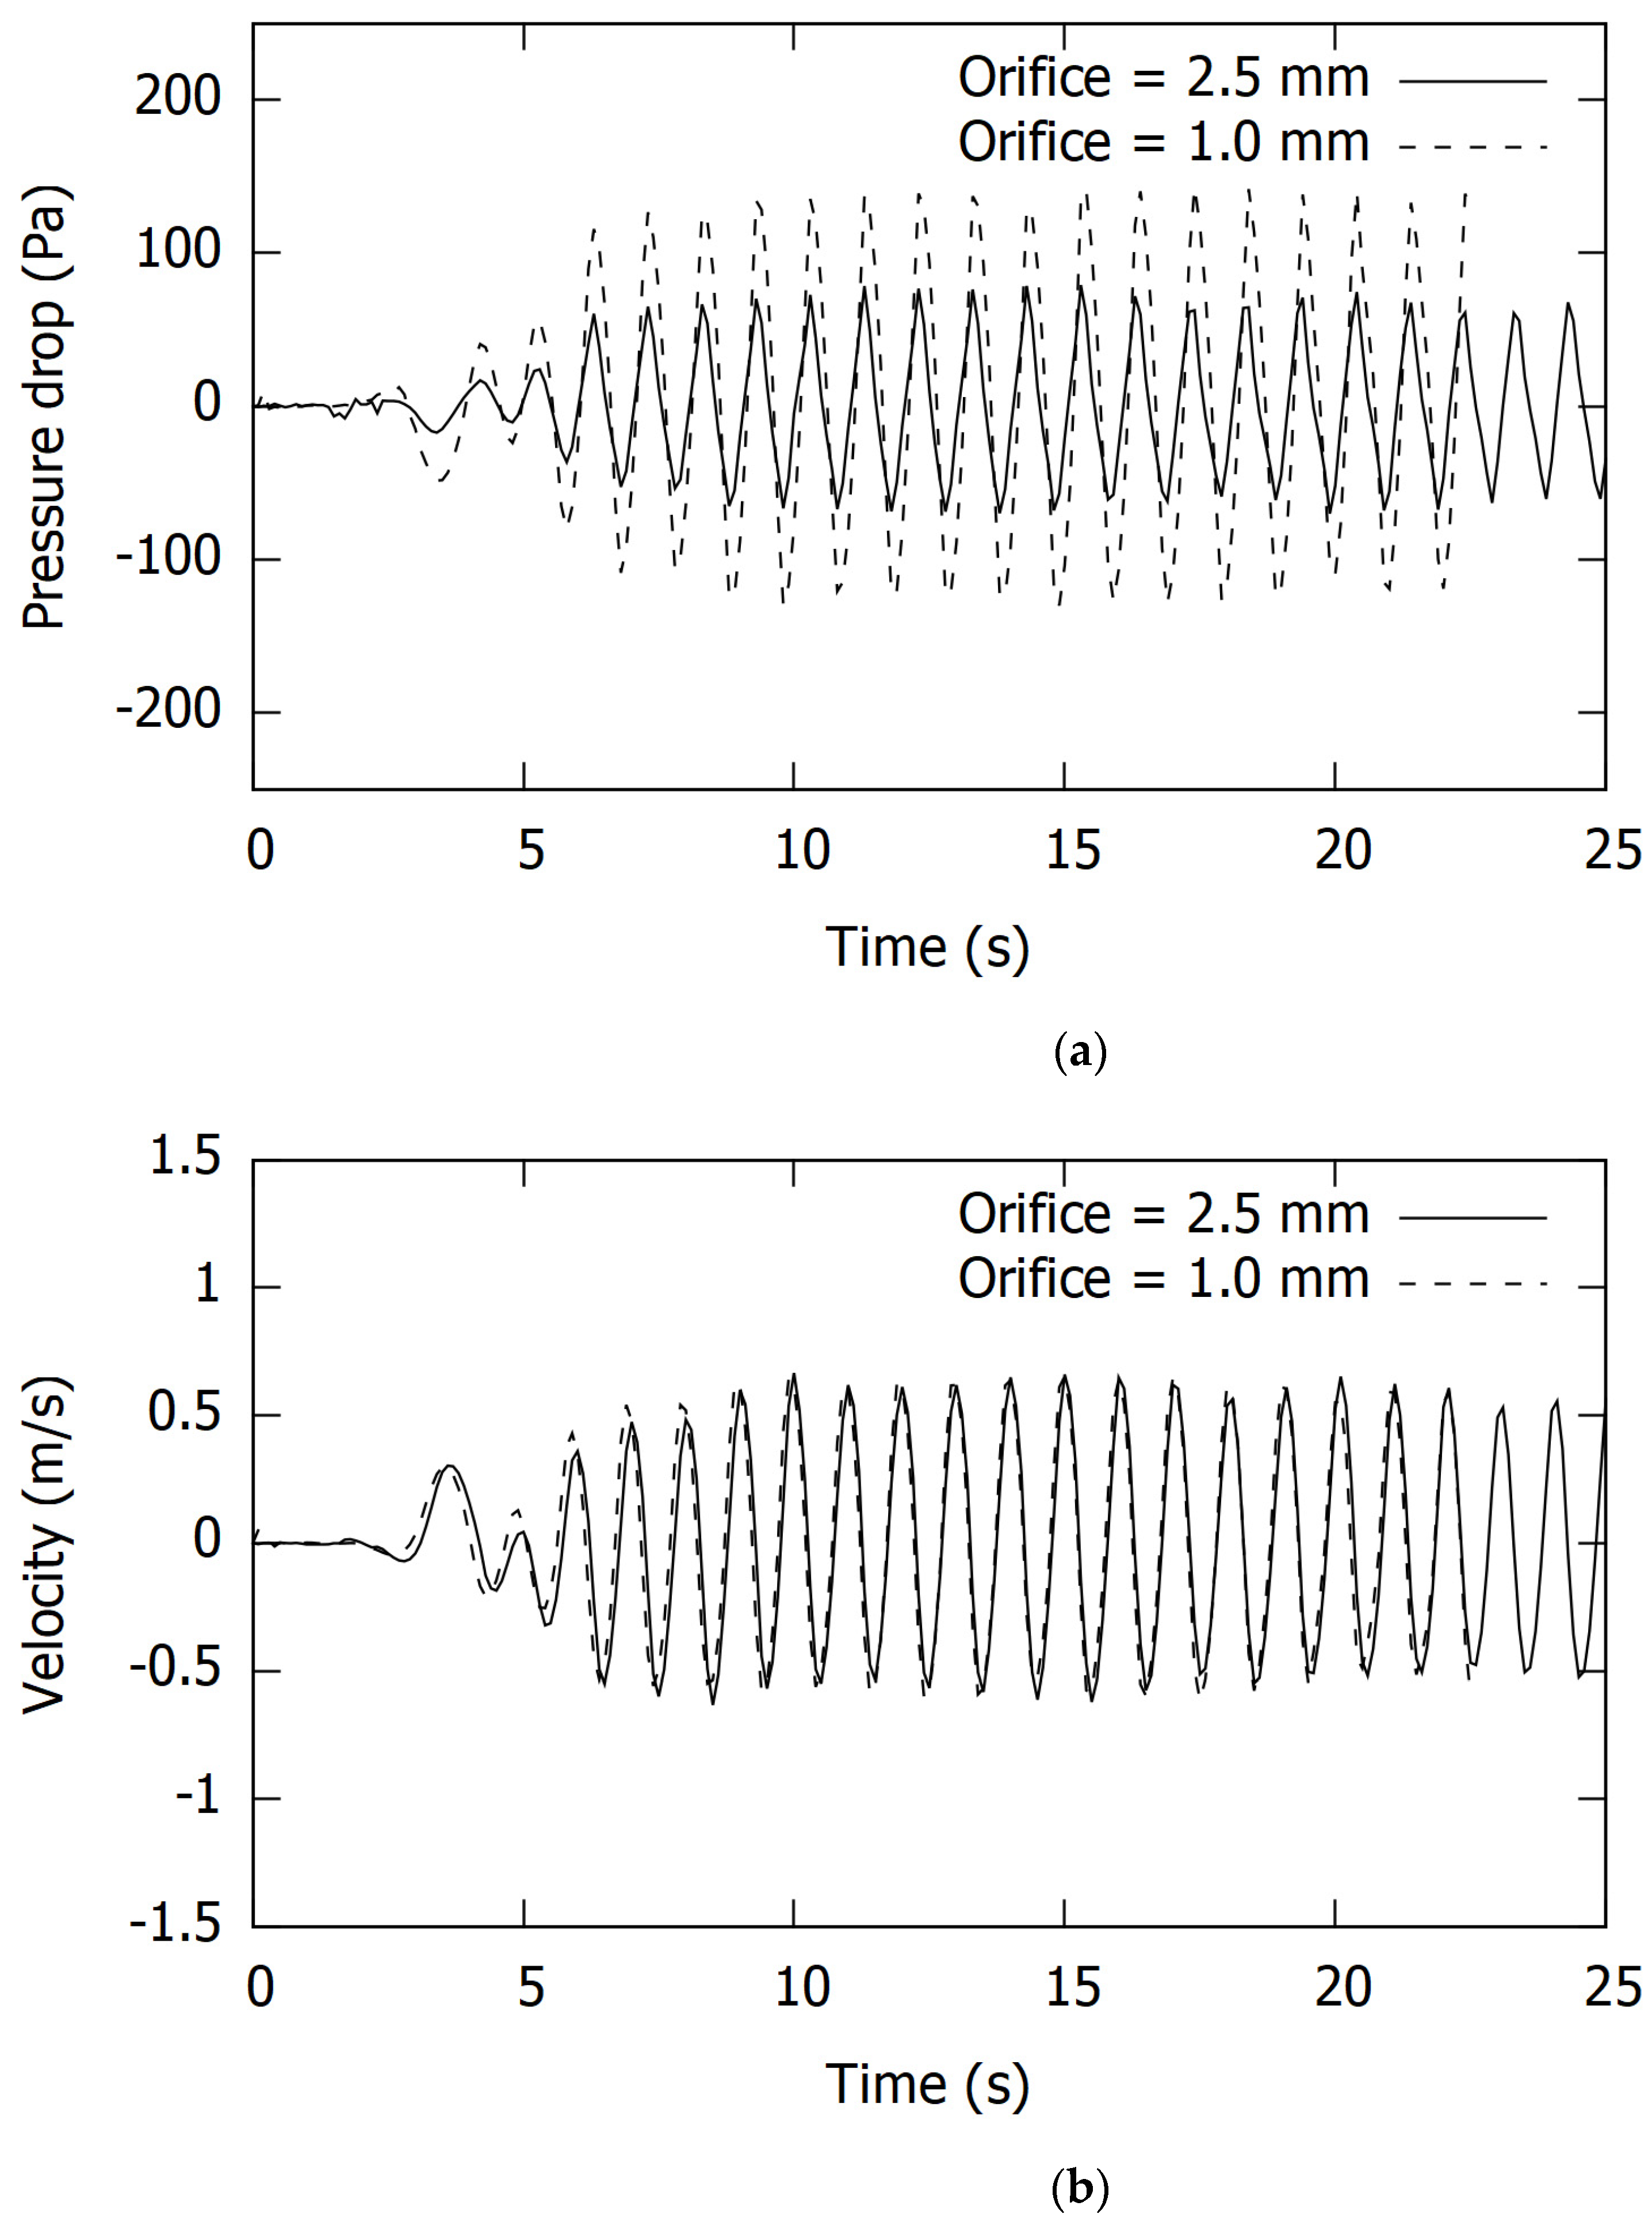
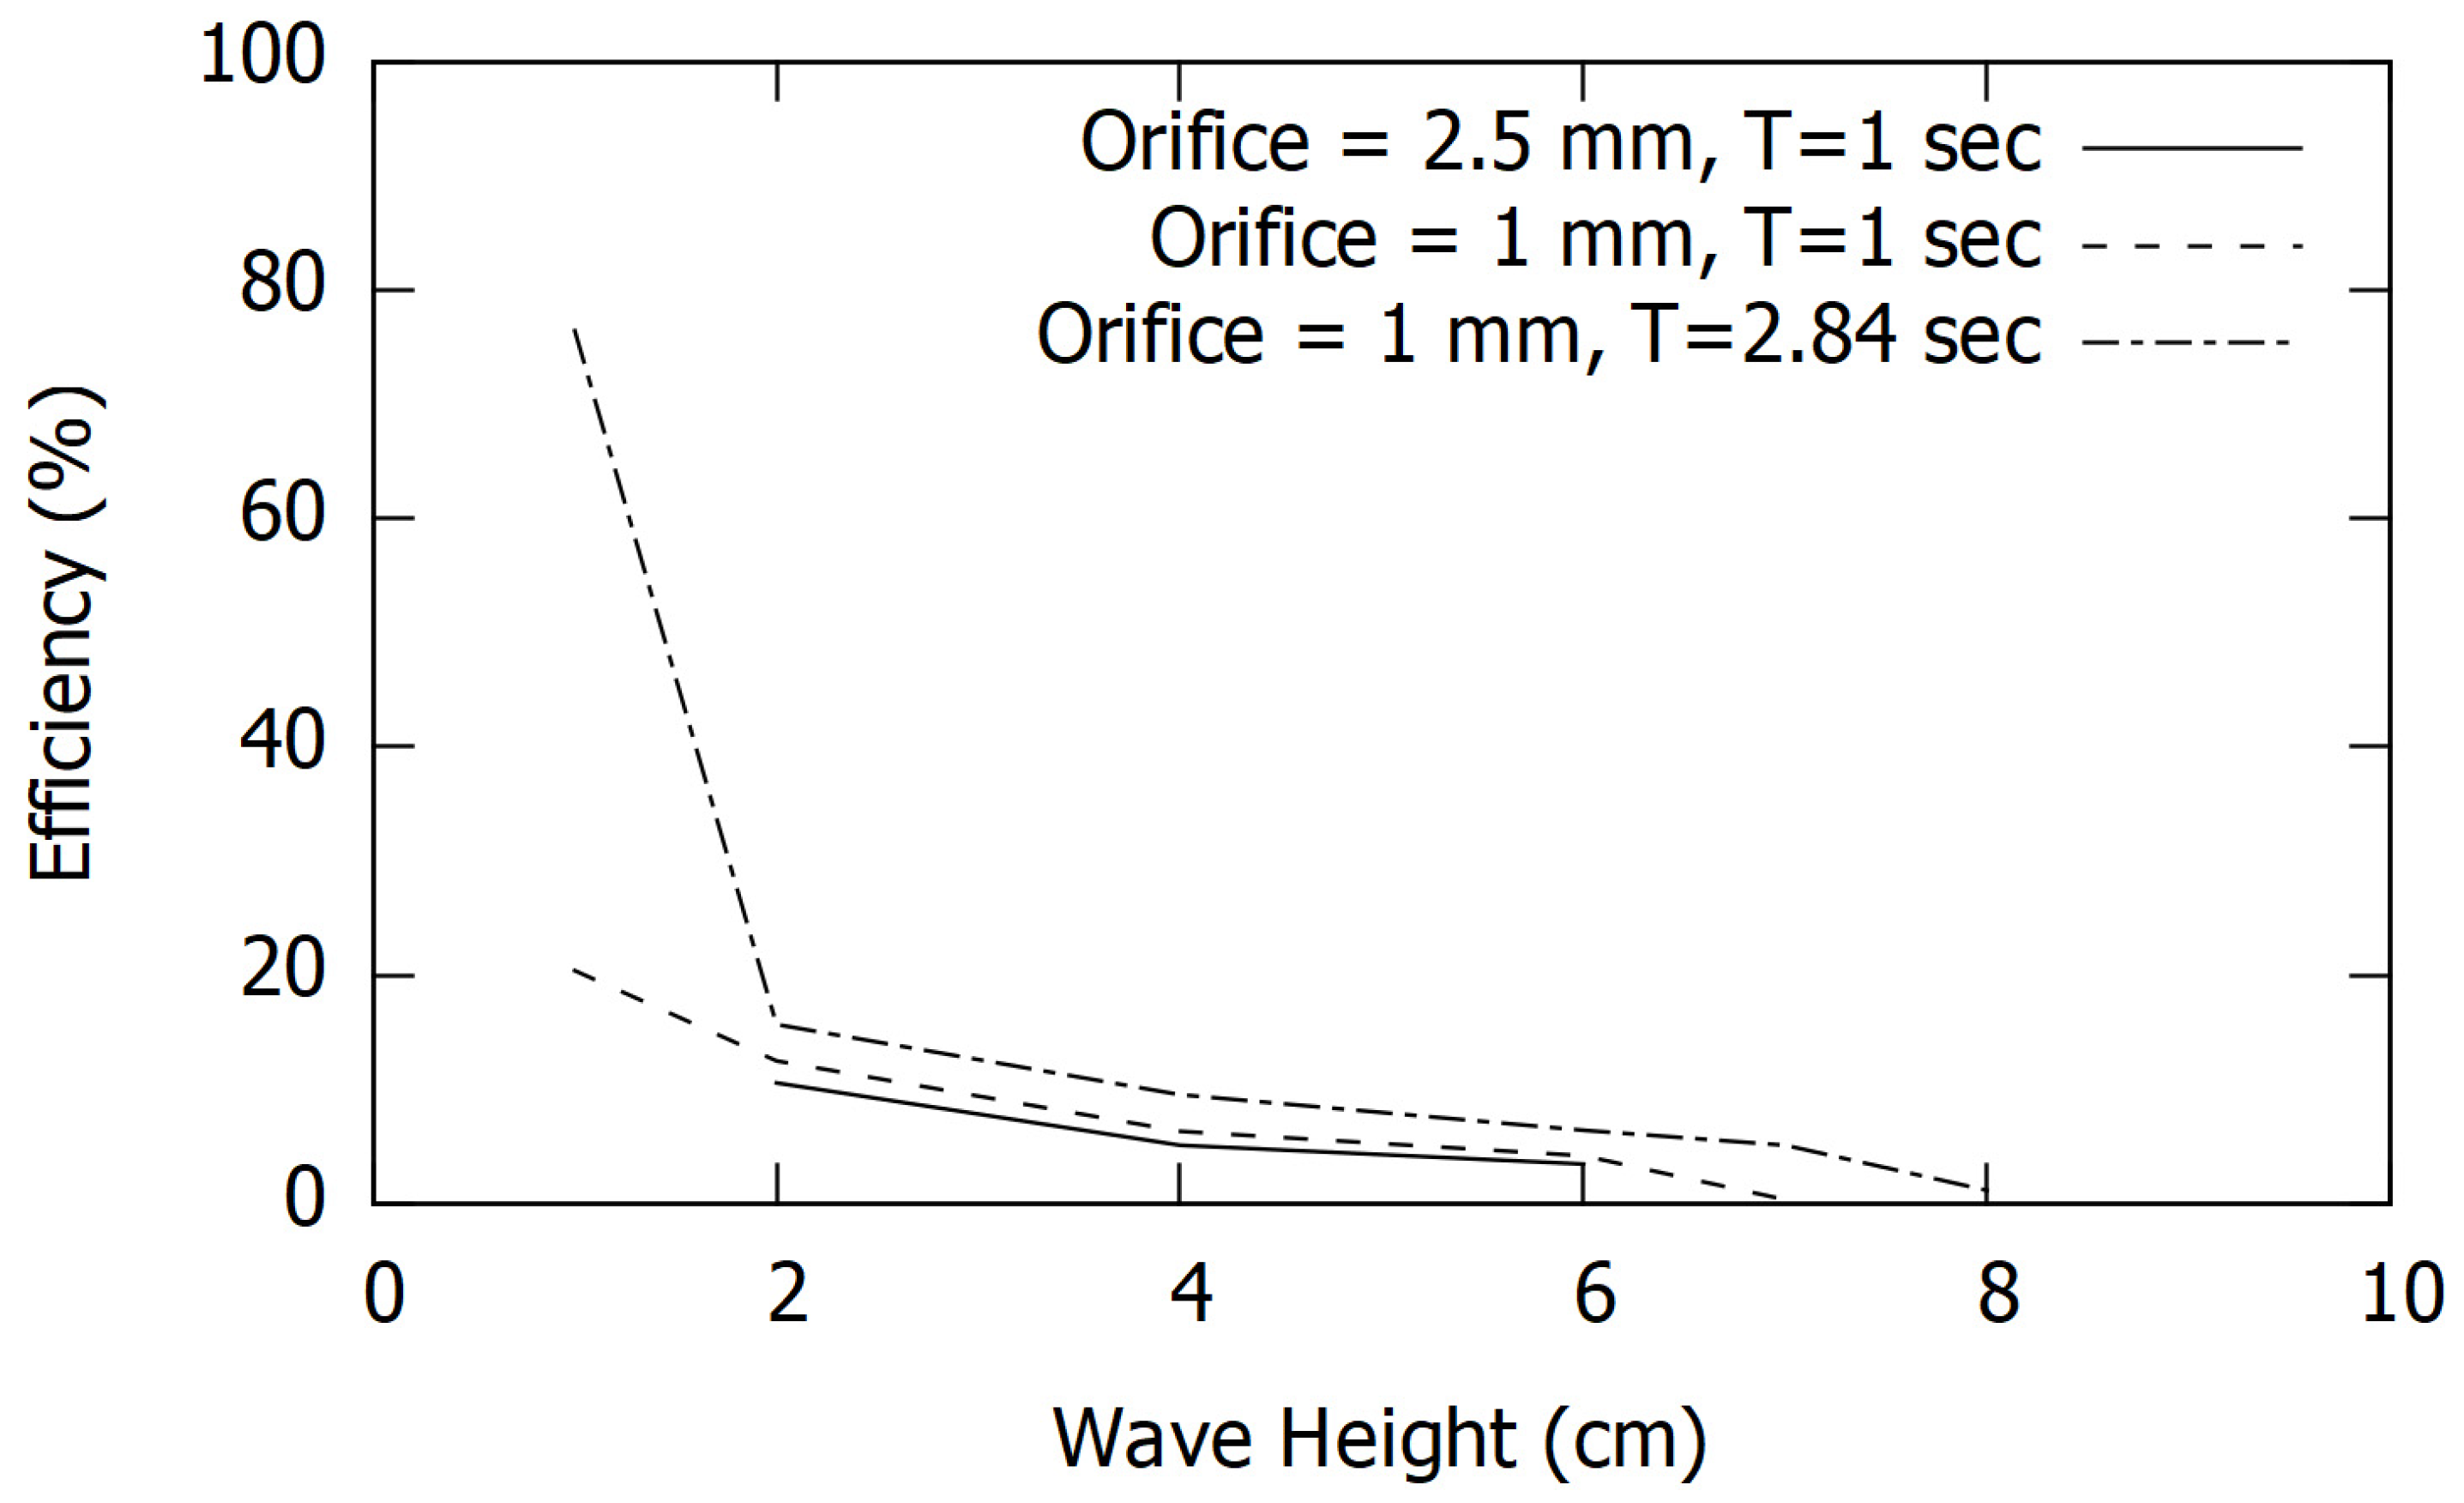
3.3. Performance Characteristics

The effects of wave height, orifice size, and wave period on the flow dynamics have been investigated with the base case of 6 cm wave height, 2.5 mm orifice size, and 1.0 s time period of the wave. Figure 5 shows the effects of wave height on the pressure drop across the pipe and the corresponding velocity through the orifice. The figure shows that the pressure drops and the velocity increases with the increase in wave height. This is consistent with the wave theory in which pressure and velocity are proportional to the wave height. Figure 6 shows the effects of orifice size on the pressure drop and the smaller orifice size of 1 mm produces a higher pressure drop compared to the 2.5 mm orifice size, whereas the velocity through the orifice remains similar. The simulated phenomenon is caused mainly by the complex interaction between the inertial damping of the body of water and the damping imposed by the orifice. Figure 7 shows the effects of the time period of the wave on the pressure drop and velocity through the orifice. This figure shows that with the increase in the time period, the pressure drop across the pipe increases significantly, indicating the availability of wave energy in higher time period waves or in lower frequency longer waves. The velocity through the orifice plate remains similar for all the time periods. The increased pressure availability does not result in increased velocity as the pressure is radiated back due to the movement of the water body as well as the damping imposed by the orifice.
The efficiency of the device in extracting wave energy is plotted in Figure 8. The efficiency decreases with the increase in wave height and the smaller orifice size (larger PTO damping) produces slightly higher efficiency. Longer time periods of waves (i.e., lower frequency) produce higher efficiency. Though the base case produces low efficiency, the device becomes more efficient as the time period of wave increases. This indicates that the device is more efficient in extracting wave energy from low frequency longer waves. The efficiency reached nearly 80% at a time period of 2.8 s, with a 1 cm wave height and a 1 mm orifice opening.
The pressure differential wave energy device is most efficient when the length of the device is half, one and a half, two and a half, and so on of the wave length. For the base case of a wave period of 1 sec and wave height of 6 cm, the wave length is 2.029 m, and so the optimum length of the pipe should be 1.0145 m, 1.521 m, and 2.53 m. In the absence of the body, the maximum pressure resource available at these lengths of the device is 2020 Pa. However, since the length of the device is 2 m and so at the base case, the 2 m length of the device is not optimum. This is also confirmed by Figure 5, which shows the maximum pressure drop is approximately 100 Pa in CFD simulations. It is important to note that the CFD simulations also account for the diffraction and radiation pressure effects, while the maximum available pressure resource is calculated based on the linear wave theory in an undisturbed wave field.
In oscillating water column devices, it has been shown that the absorption of energy is maximum when the time period of the incidence wave coincides with the natural frequency of the water column (Sheng et al. [21]). Similarly, Schonborn [13] derived the equation for the natural frequency of horizontal water body movement due to pressure differences under the crest and trough. According to Schonborn [13], if the water in the pipe can be assumed to be narrow and as a solid piston, then a simple hydrostatic balance analysis gives the natural frequency of vibration of the water body as T n = 2 π L g , where, L (m) is the length of the water body. With the 2 m length of the pipe in the present study, the natural frequency of the water body is calculated as T n = 2.84 s. Thus, as shown in Figure 8, with the increase in wave time period towards the natural frequency, the efficiency of the wave energy device increases. It is important to note that simple natural frequency calculation does not consider the added mass effects.
Furthermore, as evidenced from Figure 8, the effects of wave height and PTO damping are less pronounced than the wave period. In real sea states, the time period of wave changes over a wide range, and once a device is designed, the optimum energy extraction is not possible under all sea states. The simulation results show that the higher PTO damping provides a better efficiency. This is due to the fact that in principle higher PTO damping has lower reflective and dissipative energy, as explained in Rezanejad et al. [13]. The efficiency of the device decreases with the increase in wave height principally due to the increased energy dissipation as the viscosity effect becomes prominent at greater wave heights. Therefore, the energy extraction device needs to be designed carefully with proper damping in order to maximize energy extraction.

4. Conclusions

A CFD modeling study has been carried out to investigate the hydrodynamic efficiency of a differential pressure-driven flow through a submerged pipe wave energy device. Simulations have been carried out using an open-source CFD software OpenFoam with the PTO damping simulated using an orifice plate. The CFD modeling approach includes the volume of fluid (VOF) multiphase model with imposed inlet and outlet wave conditions. Based on the study, the following conclusions can be made:
  • The CFD model used for simulating the wave conditions has been successfully validated against free surface elevation data from the published literature.
  • The concept of a differential pressure-driven wave energy device has been proven by numerical simulation.
  • Simulation results show that the efficiency of the device decreases with the wave height but increases significantly with the wave time period.
  • A higher power take-off (PTO) damping also increases the efficiency of the device.

Author Contributions

Conceptualization, M.H.; Investigation, M.H. and M.R.; Methodology, M.R.; Software, M.R.; Visualization, M.H.; Writing—original draft, M.H.; Writing—review & editing, M.R. All authors have read and agreed to the published version of the manuscript.

Funding

This research received no external funding.

Acknowledgments

Authors would like to acknowledge a travel grant from Robert Gordon University under the Global Challenges Research Fund (GCRF) used to conduct this collaborative research study.

Conflicts of Interest

The authors declare no conflict of interest.

References

  1. Falcao, A.F.d. Wave Energy Utilization: A review of the technologies. Renw. Sustain. Energy Rev. 2010, 14, 899–918. [Google Scholar] [CrossRef]
  2. Guedes Soares, C.; Bhattacharjee, J.; Tello, M.; Pietra, L. Review and classification of wave energy converters. In Maritime Engineering and Technology; Soares, C.G., Sutulo, Y.G.S., Santos, T.A., Eds.; Taylor and Francis Group: London, UK, 2012; pp. 585–594. [Google Scholar]
  3. Falnes, J. A review of wave energy extraction. Mar. Struct. 2007, 20, 185–201. [Google Scholar] [CrossRef]
  4. Drew, B.; Plummer, A.R.; Sahinkaya, M.N. A review of wave energy converter technology. Proc. Inst. Mech. Eng. Part A J. Power Energy 2009, 223, 887–902. [Google Scholar] [CrossRef] [Green Version]
  5. Mustapa, M.A.; Yaakob, O.B.; Ahmed, Y.M.; Rheem, C.K.; Koh, K.K.; Adnan, F.A. Wave energy device and breakwater integration: A review. Renew. Sustain. Energy Rev. 2017, 77, 43–58. [Google Scholar] [CrossRef]
  6. McNatt, J.C.; Ozkan-Haller, H.T.; Morrow, M.; Delos-Reyes, M. Preliminary Modelling Analsys of a Horizontal Pressure Differential Wave Energy Converter. J. Offshore Mech. Arct. Eng. 2014, 136, 011901. [Google Scholar] [CrossRef]
  7. Simon, M.J. Wave-Energy Extraction by a Submerged Cylindrical Resonant Duct. J. Fluid Mech. 1981, 36, 159–187. [Google Scholar] [CrossRef]
  8. Graw, K. Shore Protection and Electricity by Submerged Plate Wave Energy Converter. In Proceedings of the European Wave Energy Symposium, Edinburgh, UK, 21–24 July 1993; pp. 379–384. [Google Scholar]
  9. Orer, G.; Ozdamar, A. An Experimental Study on the Efficiency of the Submerged Plate Wave Energy Converter. Renew. Energy 2007, 32, 1317–1327. [Google Scholar] [CrossRef]
  10. Babarit, F.; Wendt, Y.-H.; Yu, J.; Weber. Investigation on the energy absorption performance of a fixed-bottom pressure-differential wave energy converter. Appl. Ocean. Energy 2017, 65, 90–101. [Google Scholar] [CrossRef] [Green Version]
  11. Schonborn, A. A harmonic pressure differential wave energy converter. Int. J. Mar. Energy 2017, 19, 47–54. [Google Scholar] [CrossRef]
  12. Windt, J.; Davidson, P.; Schmitt, J.V.; Ringwood. On the assessment of numerical wave makers in CFD simulations. J. Mar. Sci. Eng. 2019, 7, 47. [Google Scholar] [CrossRef]
  13. Rezanejad, K.; Gadelho, J.F.M.; Soares, C.G. Hydrodynamic analysis of an oscillating water column wave energy converter in the stepped bottom condition using CFD. Renew. Energy 2019, 135, 1241–1259. [Google Scholar] [CrossRef]
  14. Dai, S.; Day, S.; Yuan, Z.; Wang, H. Investigation on the hydrodynamic scaling effect of an OWC type wave energy device using experiment and CFD simulation. Renew. Energy 2019, 142, 184–194. [Google Scholar] [CrossRef]
  15. Kamath, A.; Bihs, H.; Arntsen, Ø.A. Numerical modeling of power take-off damping in an oscillating water column device. Int. J. Mar. Energy 2015, 10, 1–16. [Google Scholar] [CrossRef] [Green Version]
  16. Monino, A.; Medina-Lopez, E.; Clavero, M.; Benslimane, S. Numerical Simulation of a simple OWC problem for turbine performance. Int. J. Mar. Energy 2017, 20, 17–32. [Google Scholar] [CrossRef]
  17. Shah, I.; Kim, S.W.; Kim, K.; Doh, Y.H.; Choi, K.H. Experimental and numerical analysis of Y-shaped split and recombination micro-mixer with different mixing units. Chem. Eng. J. 2019, 358, 691–706. [Google Scholar] [CrossRef]
  18. Hasan, N.; Tibba, I.G.S.; Mosisa, F.T.; Daniel, A. Ground tunnel as renewable energy utilization of ground energy as a source and sink for building heating and cooling. In AIP Conference Proceedings; AIP Publishing LLC: Melville, NY, USA, 2018; p. 020005. [Google Scholar] [CrossRef]
  19. Wang, D.X.; Sun, J.W.; Gui, J.S.; Ma, Z.; Ning, D.Z.; Fang, K.Z. A numerical piston-type wave-maker toolbox for the open-source library OpenFOAM. J. Hydrodyn. 2019, 31, 800–813. [Google Scholar] [CrossRef]
  20. Sheng, W.; Alcorn, R.; Lewis, A. Assessment of primary energy conversions of oscillating water columns, I. Hydrodynamics Analysis. J. Renew. Sustain. Energy 2014, 6, 053113. [Google Scholar] [CrossRef] [Green Version]
  21. Colling, J.K.; Jafari Kang, S.; Dehdashti, E.; Husain, S.; Masoud, H.; Parker, G. Free-Decay Heave Motion of a Spherical Buoy. Fluids 2022, 7, 188. [Google Scholar] [CrossRef]
Figure 1. The new concept of wave energy extraction by forcing water flow through a submerged pipe. An orifice plate is used to represent the effects of turbine damping.
Energies 15 07513 g001
Figure 2. (a) Mesh distribution in the computation domain (top). Meshes are concentrated inside the orifice (bottom). (b) Flow chart indicating the CFD methodology.
Energies 15 07513 g002
Figure 3. Water surface elevation at (a) WG3, (b) WG4, and (c) WG5 showing the comparison between the present CFD prediction and Rezanejad et al.’s [13] experiment for the case of the time period, T = 1 s and wave height, H = 0.02 m. WG3, WG4, and WG5 are located at 8.65 m, 8.95 m, and 9.35 m from the wave generator.
Energies 15 07513 g003aEnergies 15 07513 g003b
Figure 4. (a) Contour plots of volume fraction of water show the structure of the wave, (b) Contour plots of axial velocity showing reversing flow through the submerged pipe.
Energies 15 07513 g004aEnergies 15 07513 g004b
Figure 5. Effects of wave height on the (a) pressure drop across the pipe (b) velocity through the orifice.
Energies 15 07513 g005
Figure 6. Effects of orifice size on the (a) pressure drop across the pipe (b) velocity through the orifice.
Energies 15 07513 g006
Figure 7. Effects of time period on the (a) pressure drop across the pipe (b) velocity through the orifice.
Energies 15 07513 g007
Figure 8. The efficiency of the wave energy devices for different time periods and damping conditions against wave height.
Energies 15 07513 g008
Table 1. Wave energy device parameters.
Length (m)10 m
Diameter (m)0.1 m
Orifice opening (mm)1 mm, 2.5 mm
Table 2. Mesh independency test.
Mesh Elements(Normalized Surface Elevation)CFD/(Normalized Surface Elevation)Expt
31,5001.2
42,0001.15
112,5001.12
375,0001.08
450,0001.04
860,0001.02
1,120,0001.005
Publisher’s Note: MDPI stays neutral with regard to jurisdictional claims in published maps and institutional affiliations.

