1. Introduction
Renewable energy sources, including wind turbines, have been becoming increasingly popular. Indisputable advantages of “green energy” are often overshadowed by fears that wind farms may adversely affect the environment and people living in their vicinity.
The problem of wind turbine noise appeared in the 1980s [
1] and the issues can be divided into areas: minimizing the generated noise, propagation to the environment, and legal regulations allowing its assessment.
The main aim of the ongoing research is to develop a comprehensive methodology for assessing the annoyance impact of infrasound generated by wind turbines. This means defining indicators that are useful in assessing their annoyance, permissible values, and measurement and forecasting methods for Polish legislation. In Poland—as in many other countries—similar noise indicators and limit levels are used to monitor industrial and wind noise. As is evident from scientific reports, the noise emitted by wind turbines does not resemble typical industrial noise—it has different time-frequency characteristics. It is worth mentioning that the wind, which is the driving force behind wind turbines, also influences the measurement system as well as the perception of noise. Thus, standardized monitoring and control procedures for industrial noise are not suitable for the specific noise characteristics of wind turbines. In the absence of separate legal regulations for the noise assessment of wind turbines, procedures are applied as for industrial noise. Therefore, the results of such an assessment are not adequate to its actual annoyance, and residents living in the vicinity of wind turbines complain about their noise nuisance. Consequently, public dissatisfaction led to a change in Polish law regarding the possibility of locating new wind farms, the so-called “distance from the nearest buildings”, which is 10 times the height of the turbine including the blade. In practice, this change stopped the development of this market in Poland. The main objective of the research and project NOR/POLNOR/Hetman/0073/2019-00 [
2] is to develop foundations, methods, and tools for the reliable assessment, control, and management of wind turbine noise, including infrasound and low-frequency noise bands, taking into account the principle of sustainability. Wind turbines are a specific type of noise source that affects large areas—unlike ”typical” industrial sources, especially in the low-frequency range. Given that it is in the low-frequency range, including the infrasound band, that there is particularly a lot of disagreement about the assessment of the actual annoyance of this noise, it was felt that research into the propagation of infrasound and low-frequency noise from wind turbines was one of the more important tasks. The research in this thesis is directed towards the development of a measurement technique to reduce and evaluate the influence of wind noise on the measurement result in the low-frequency range. One of the most important problems of this research is the verification of the effectiveness of wind screening in this frequency range. This paper shows that windscreen used for measurements in the audio band can also be used in the infra- and low-frequency bands, which is essential for wind turbine noise assessment in this band. The use of a single shield can lead to misinterpretation of the results due to poor protection against wind noise in the low-frequency range. The studies covered all mentioned areas. However, there are issues where the works were particularly intensive–this is the metrological problem of separating the measured wind turbine noise from the interference, especially in the range of infrasound and low-frequency noise (ILFN) caused by the wind and search for indicators useful in the evaluation of annoyance of the wind turbine noise [
3].
Turbine noise can be divided into two main types: aerodynamic and mechanical. Gearboxes, yaw change drives, cooling fans, control systems, and the generator emit the mechanical noise, while the aerodynamic noise is generated by the interaction of turbine blades with atmospheric swirl, and the infrasound and low-frequency noise is caused by the blade passing by the tower in a disturbed airflow, often modulated by the blade-pass frequency. According to [
4,
5], infrasound noise is defined as noise within the spectrum from 1 to 20 Hz. The low-frequency noise does not have an unambiguous and accepted definition. Various upper limits for this noise can be found in the literature. In the E DIN 45680 standard [
6], the low-frequency noise band is specified from 8 Hz to 100 Hz. Most often, the low-frequency noise is defined according to Leventhall [
7] as noise in the 10–200 Hz band, and according to the threshold limits values ACGIH (2010) infrasound and low-frequency noise is the noise in the 1–80 Hz range, and according to other researchers up to 100 or 250 Hz, or even 500 Hz [
8,
9,
10,
11]. In Poland, in relation to low-frequency noise the Leventhall’s approach used. Despite the unambiguous definition of the infrasound band, there are no universally accepted indicators for assessing such noise. Indicators based on A-weighting, C-weighting, and C-A-weighting, as well as on hearing threshold curves are often used [
12]. The usefulness of the above indicators in infrasound noise assessment is still under review and new indicators are being sought [
13,
14]. The arduousness of wind turbine-generated noise depends mainly on the sound pressure level and is modified by the following factors: frequency character (spectrum with wideband, low-frequency components in the 20–200 Hz band, and infrasound components in the 1–20 Hz band), variability in time, character (larger arduousness of noise which is modulated [
15], pulsed and has tonal components) and exposure time. In the case of wind turbine noise, there is no direct risk of hearing damage because the hearing damage can be caused by the A-weighted equivalent sound pressure level (LAeq) above 80 dB, and there are no such high levels from wind turbines. At low A-weighted equivalent sound pressure levels (above 55 dB) the noise effects include: complaints about the noise arduousness during mental processes, difficulty in concentrating and focusing attention, increased nervous excitability, irritability, and intellectual problems evidencing themselves as deteriorated memory. The intensity of these sensations is strongly related to wind speed. The noise generated by wind turbines is considered more disruptive at low wind speeds, while at high wind speeds, it is considered less disruptive. This is a result of the noise generated by wind turbines being masked by the noise generated by gusts of wind, making wind turbine noise less perceptible to people living near wind farms [
16]. Hence, it can be claimed that living in the direct vicinity of wind turbines can significantly adversely impact humans [
17]. Similarly, in the case of infra and low-frequency noise generated by wind turbines whose levels are below the perception threshold (and are about 50–70 dB [
18], and even 90–100 dB for frequency 1–2 Hz [
19,
20], it is believed that they do not have a direct adverse effect on human health [
18]. This was clearly stated in many papers which negate the occurrence of any undesirable effects related to infrasound [
18,
21]. It is believed, however, that low-frequency noise generally can be more annoying than higher-frequency noise of similar loudness [
22,
23], although the reasons for it are still unknown. One of the reasons can be a larger dispersion of hearing threshold in the low-frequency range in people past 60 years old compared to those who are 18 [
24].
The conclusion is that methodical and detailed studies should be conducted for a better understanding of all mechanisms and effects caused by low-frequency noise generated by wind turbines. In parallel, a metrological problem appears as the measurement of infrasound and low-frequency sound of relatively low loudness level requires a special methodology related to the influence of wind on the microphone membrane. The acoustic background level is closely associated with wind speed which was indicated in 1999 by Fegeant [
25] and confirmed experimentally in 2002 by Rogers and Manwell [
26]. The sound level received by a human is proportional to the wind speed and is expressed by the relationship [
26]:
where: U—wind speed in m/s.
Although this equation relates to the A-weighted sound pressure level whose frequency characteristics are strongly attenuated below 20 Hz, it still illustrates the phenomenon’s scale.
In order to better characterize the noise measured in the vicinity of wind turbines, the microphones should be protected from the wind. The essence of the use of windscreens in acoustic measurements is presented both in Brüel and Kjær’s technical documents [
27,
28] and from the fluid mechanics side in publications [
29,
30,
31]. The purpose of their use is to eliminate the velocity of airborne particles (dynamic phenomenon such as wind) in the context of the static phenomenon like particle velocity—the air molecules transmitting acoustic energy. A standard 90 mm diameter windshield is suitable for measurement at low wind, but as the wind speed increases the pressure fluctuations caused by the wind affect the measured sound pressure, particularly in the low frequency range. One of the methods for reducing the wind impact on the measurement result was described in [
32]. This method was developed to minimize the wind impact on the microphone by measuring the noise of frequencies higher than infrasound. This is achieved by mounting the microphone on the ground level on a reflective surface and by protecting the microphone with two windshields made of foam with open cells [
33].
The main objective of this paper was to verify the experience of the solutions used to reduce interference from the wind, as well as to propose our own modifications that are more suitable for measuring infrasound and low-frequency noise.
Some methodologies for measuring the wind turbine noise in the low frequency and infrasonic range were proposed by several researchers and are presented in the next chapter.
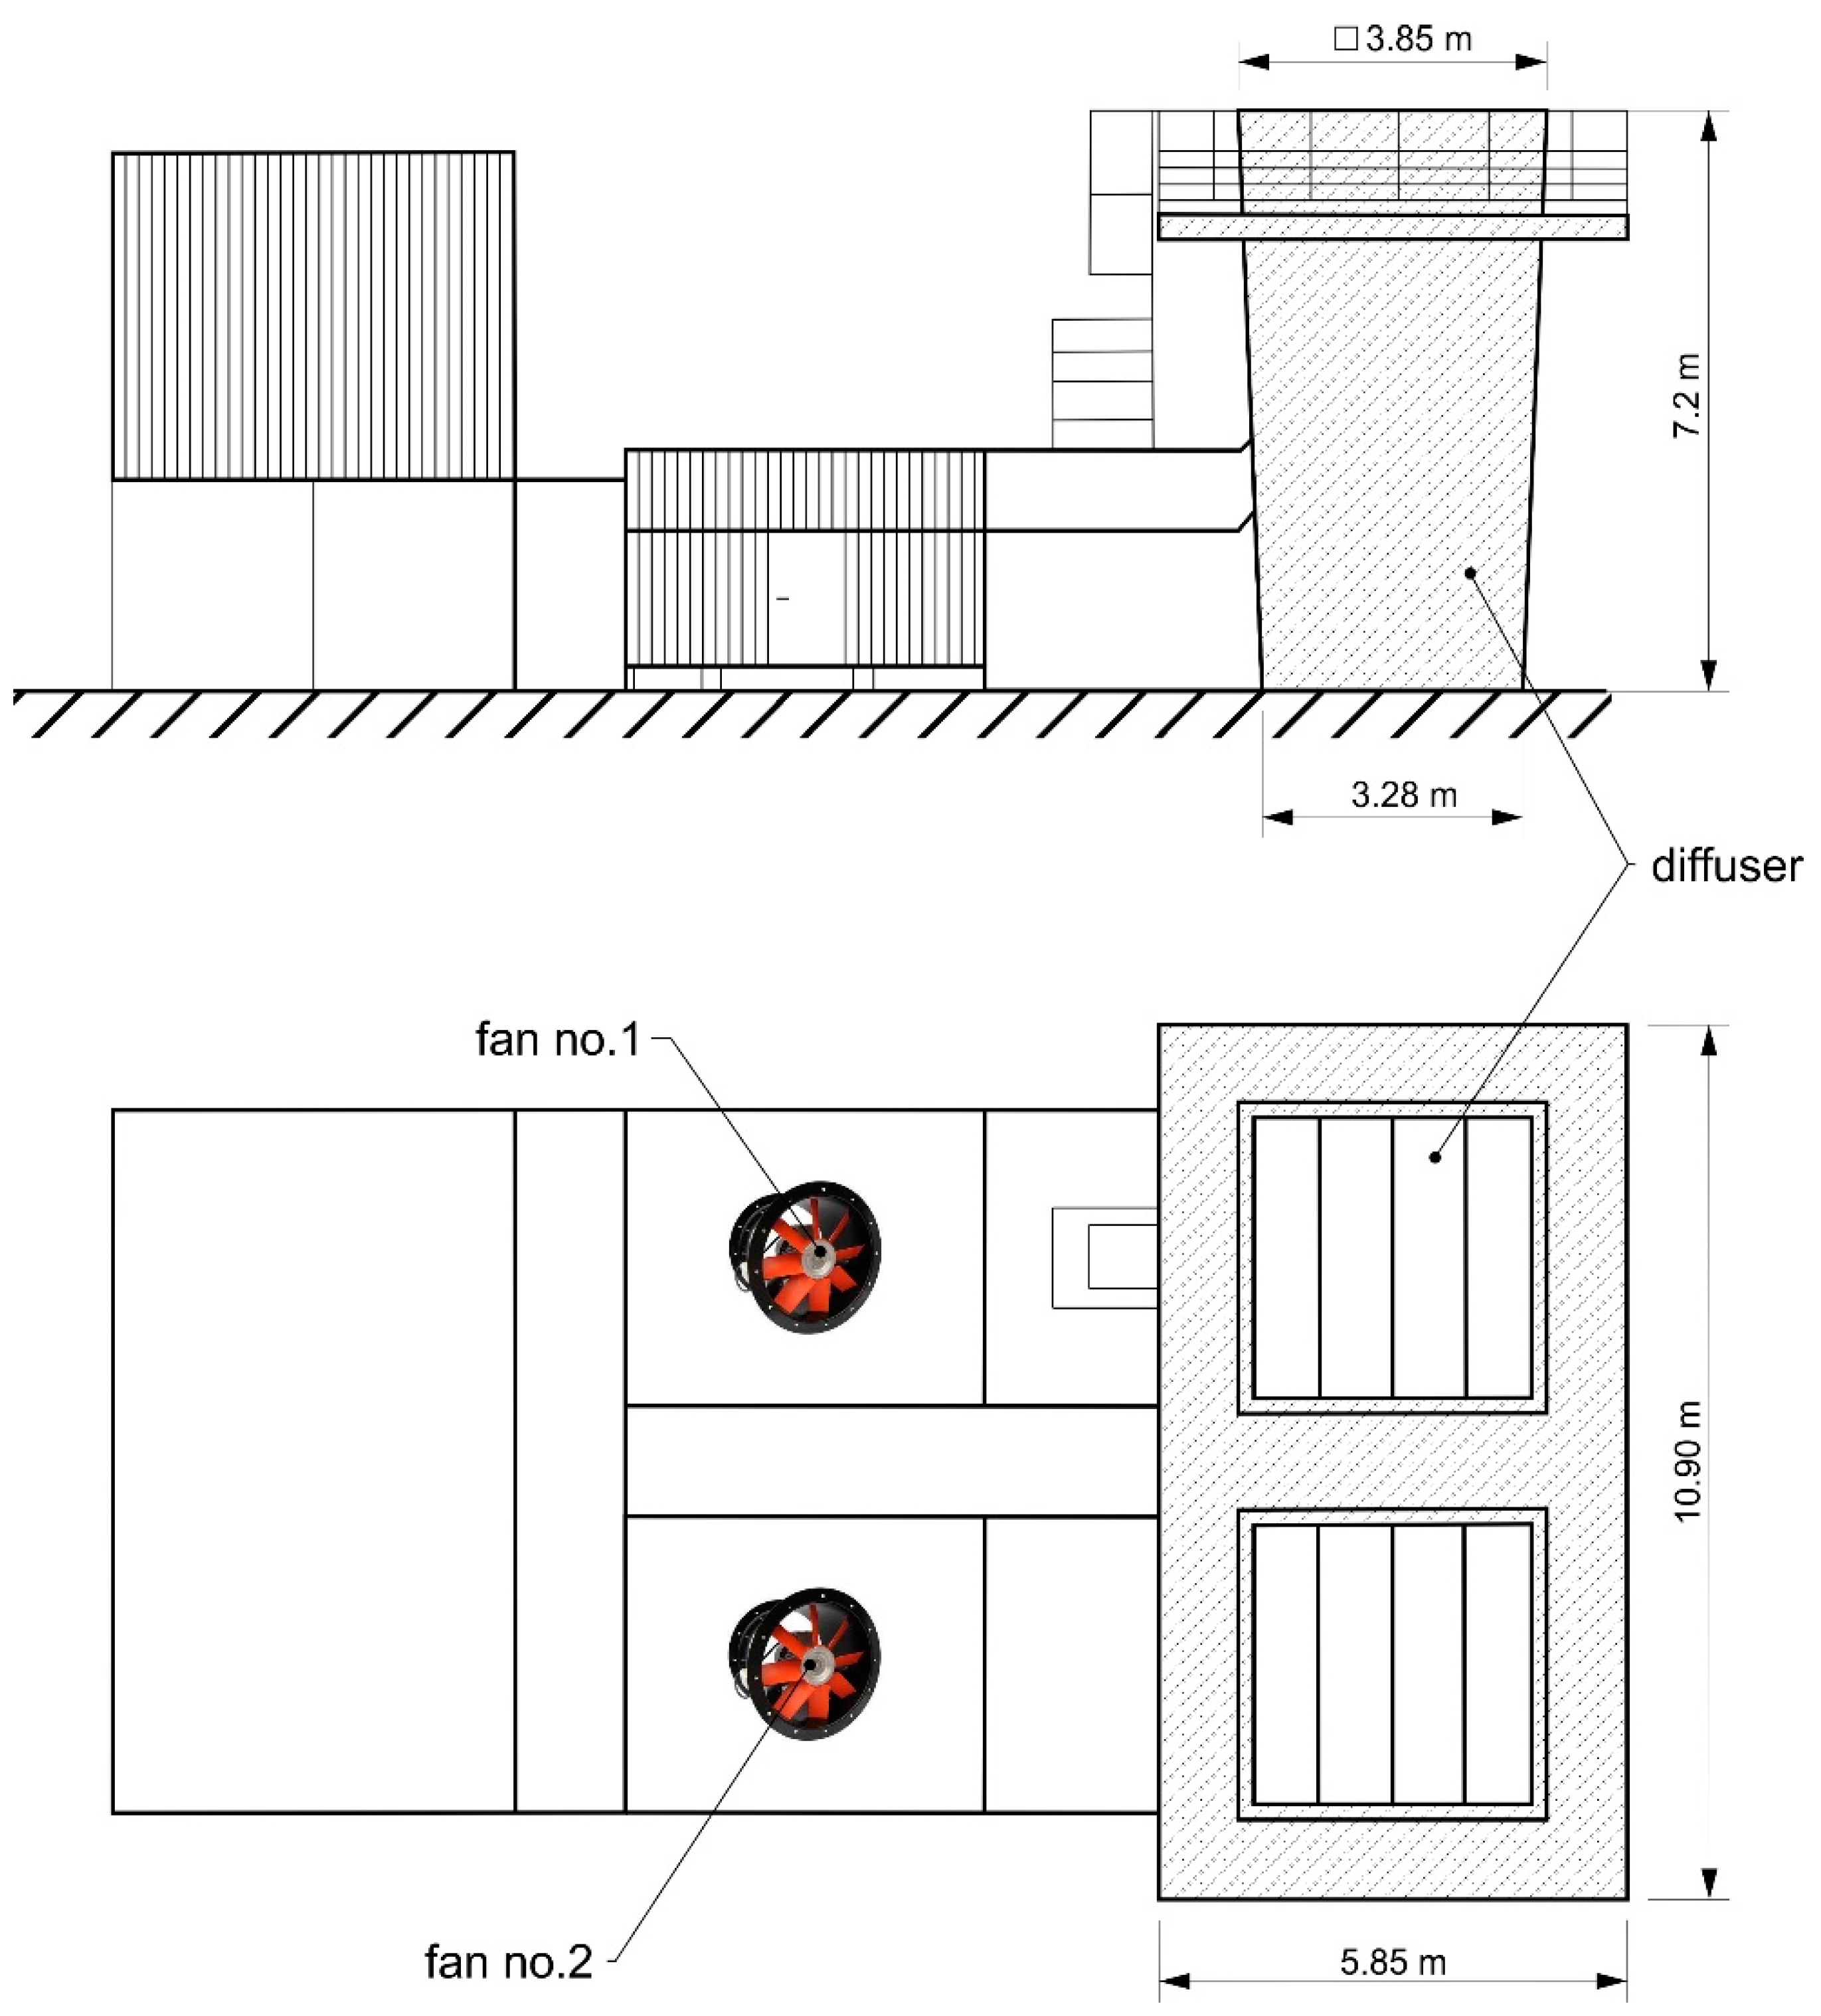
Section 3 describes an experiment with a ventilation shaft as a source of low-frequency noise. This source was chosen because it generates sound covering the low-frequency band regardless of wind conditions.
Section 4 analyzes the experimental results for five measurement methods using different microphone positions and different types of wind shielding. This was followed by verification of the proposed measurement methods under real conditions on a wind farm. The results of this verification are presented in
Section 5. A discussion of the obtained experimental results is presented in
Section 6.
2. Review of Windshields Used in Measurements of Low-Frequency Noise
As mentioned in the introduction, an important contentious issue is the impact of low-frequency components, including infrasound, so the paper [
34] proposed and used prototype sound level meters in the 1–20 kHz range with the function of recording the sound pressure signal. The prototype windshield kit was developed to prevent the swoosh near the microphone caused by the wind, particularly at low frequencies. The double-skin kit consists of a spherical 20-cm diameter windshield made of polyurethane foam and the second, newly designed, dodecahedral shield covered by thin fabric (90% nylon and 10% polyurethane; opening factor: 60%) of high flexibility. During measurements in an anechoic chamber, the insertion loss of this windshield kit is below 1 dB with a frequency of up to 4 kHz. The windshield effectiveness was tested during the field measurements on a very quiet plain.
The Australian team [
35] developed and tested three alternative windshields in outdoor conditions, which were evaluated for their usefulness for measurements of low-frequency noise and infrasound in the presence of wind. In addition, the team studied the impact of microphone position relative to the ground for frequencies up to 1000 Hz. The measured sound pressure levels were compared by analyzing the high-resolution frequency spectra and coherence for various wind conditions. The results indicate the presence of wind turbine blade-pass frequency and its harmonics in the infrasonic range. The low-frequency range has wideband peaks with superimposed secondary peaks which are blade-pass frequencies apart. These spectral features were additionally emphasized by stable weather conditions. Results at low wind speeds are also analyzed to investigate the effect of pressure doubling, in the context of low-frequency noise, for all microphone mounting configurations. The comparative measurements were made for three different configurations: microphone on ground level, 1.5 m above the ground level, and underground in a plywood box each. Each microphone had a basic 90-mm diameter windshield and three different outer windshields. The results presented in the paper confirm that there is no constant difference between the measurements below 100 Hz. The first microphone used in [
35] was placed on the ground level and was glued horizontally in the center of an aluminum sheet, 1 m in diameter and 3 mm thick, covered by the front and rear shield, following [
32]. The outer windshield comprised a 16-mm layer of acoustic foam covered by a layer of SoundMaster acoustic felt. The second microphone [
35] was equipped with a classic windshield and was installed in a plywood box and dug into the ground, and the third microphone was installed 1.5 m above the ground on a tripod. This microphone had an additional spherical shield which was fixed to a 450-mm dia steel frame. The windshield materials were identical to those in the hemispherical secondary shield described above.
The team [
36] designed and thoroughly tested a hemispherical windshield dome used to improve the signal-to-noise ratio (SNR) during outdoor infrasound measurements. The hemispherical shape was intended to maximize the averaging of the pressure of large turbulent atmospheric vortexes while maintaining a rather compact design. The dome insertion loss was measured in a semi-anechoic chamber (without airflow). The measurements’ absence of the shield impacts the sound measurement results in the low-frequency range. The sound pressure levels were measured simultaneously using an unshielded and shielded microphone in the low-frequency range at different wind speeds and turbulence intensities. The best improvement of the SNR was obtained at high and medium wind speeds for frequencies up to 0.5 Hz. The dome allowed a clear identification of infrasound tonal components of wind turbines, which otherwise were totally covered by the microphone noise caused by the wind, even at low and medium wind speeds. Thus, the use of the dome opens possibilities of a more accurate measurement of emission of infrasound from, for example, wind turbines. The shape and porosity of the windshielding material were based on the literature studies and theoretical considerations concerning the wind fences. It was proved that the dome is almost transparent acoustically in the tested low-frequency range and within the range of possibilities of the experimental system indoors. An extensive outdoor experiment proved that the dome reduces the wind-induced noise in the infrasound spectrum maximum to 0.2 Hz. The windshielding dome clearly identified infrasound tonal components from close wind turbines. In the case of a microphone without the dome, these tones are mostly masked by wind-induced noise. Even at low and medium wind speeds, the infrasound noise caused by the wind without the dome shield (but still with the standard 90-mm diameter spherical foam shield) shows a strong impact of turbulence intensity in the wind stream [
36].
The team led by Turnbull [
37] developed an alternative method to reduce the impact of wind on the microphone. Based on the method from [
32], a new method of underground measurement has been developed. The method was adapted and includes a double shield, with a layer of open-cell foam installed over the test chamber and the main 90-mm diameter shield around the microphone. The methodology is based on underground measurement in the test chamber with an area of approximately 500 mm
2 and a depth of 500 mm to limit the impact of even light gusts on the surface on the infrasound measurement results. The underground measurement methodology was tested, and it was confirmed that the infrasound levels above the ground and in the chamber are the same in the absence of surface wind during the measurement of the known and constant infrasound source [
37].
An additional check of the proposed microphone windshield was made during the infrasound measurement using the underground method at two Australian wind farms. The measured infrasound levels from wind farms were compared with other natural and artificial noise sources, and all measurements were compared with recognized hearing thresholds.
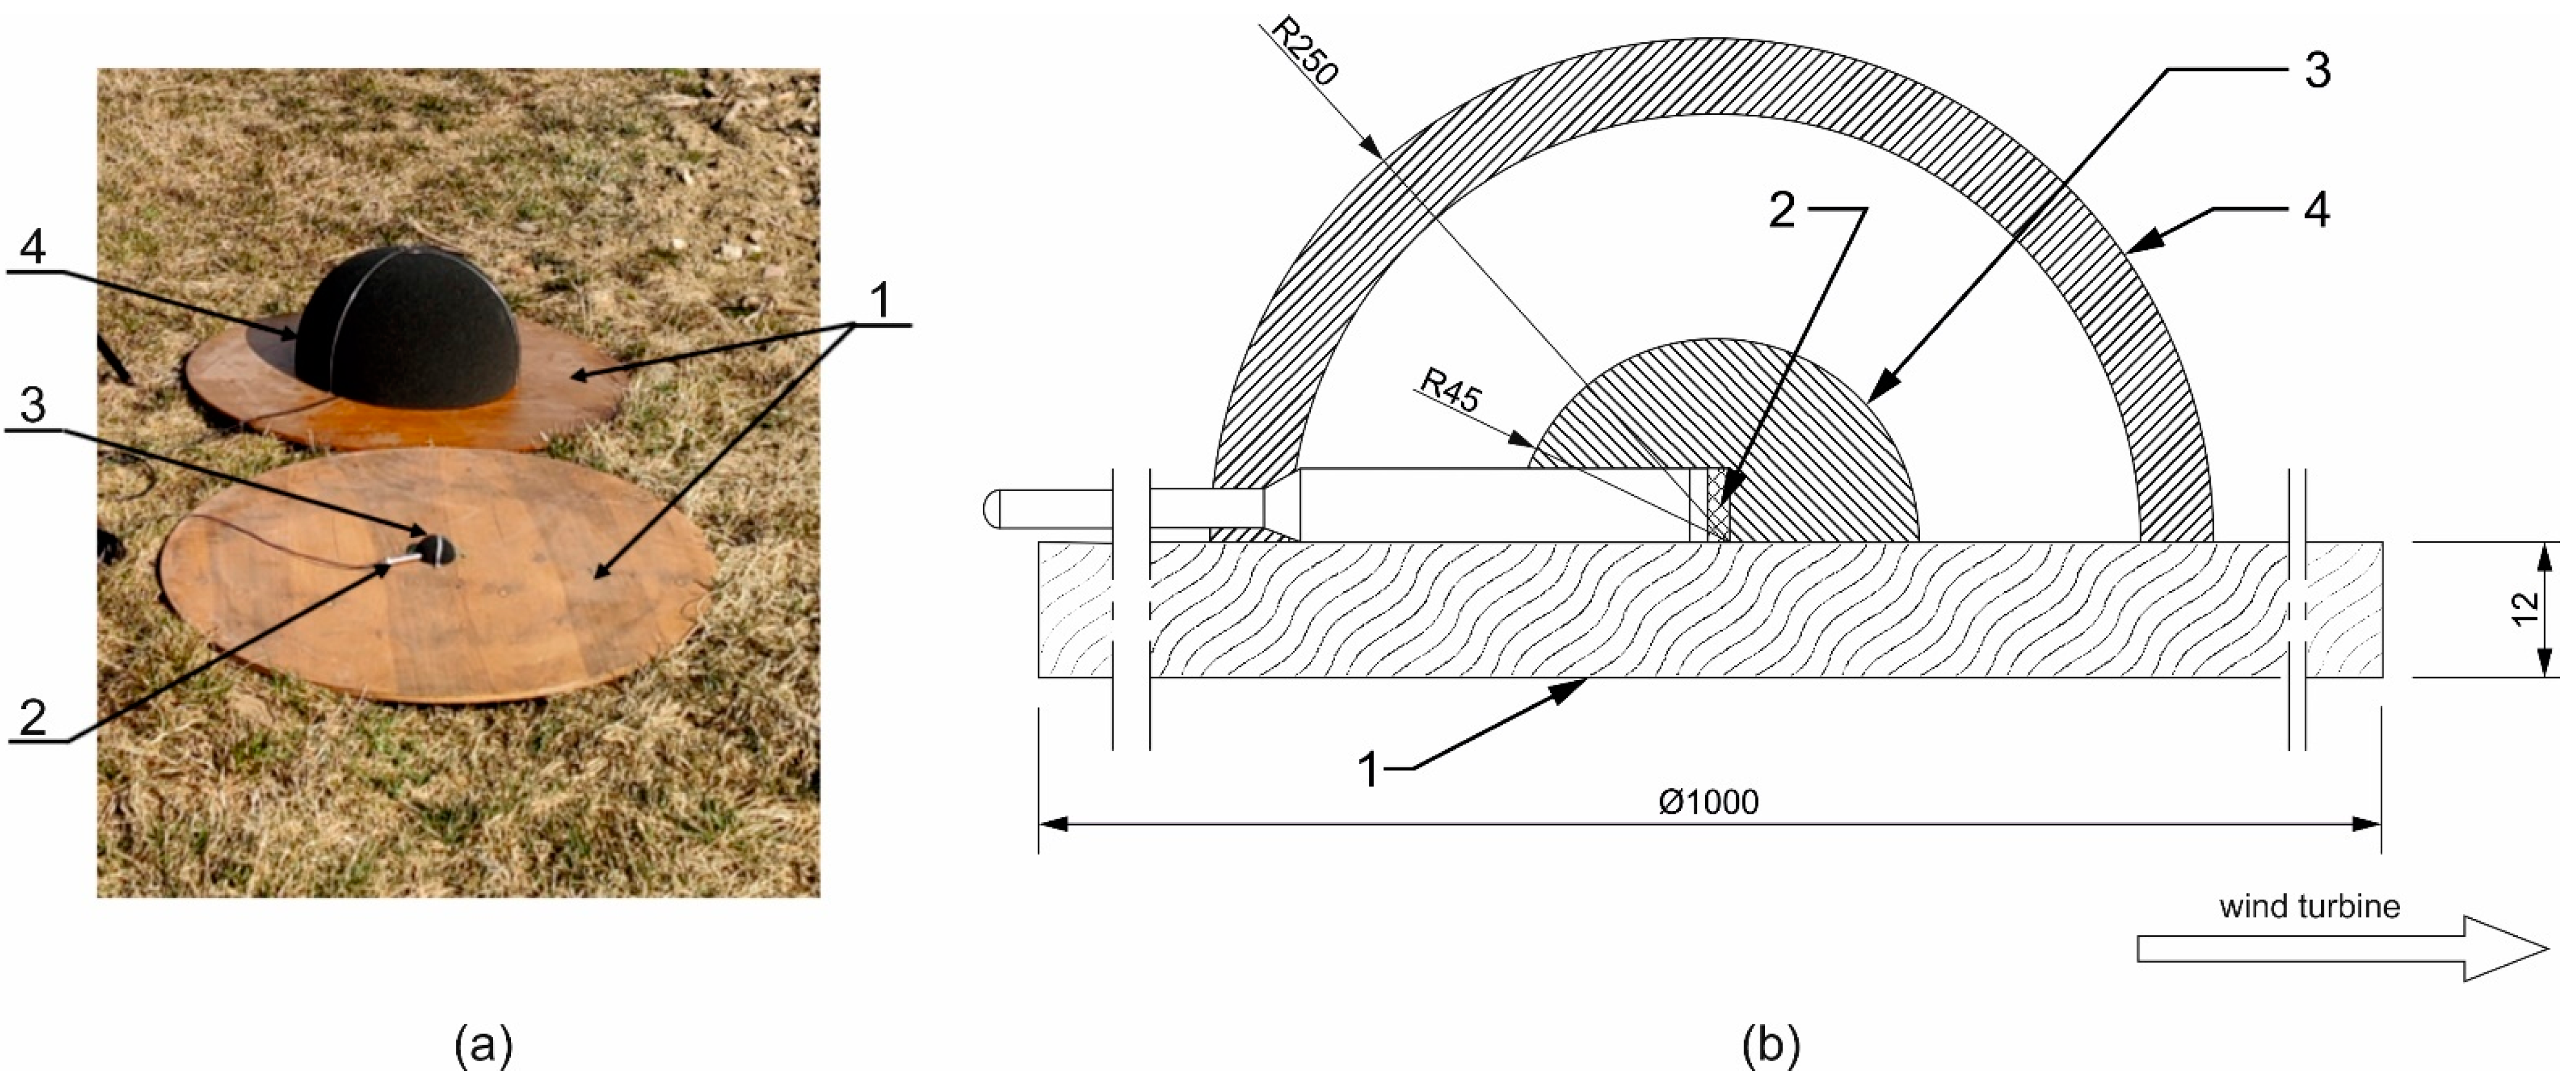
Another, most commonly used method to reduce the effect of wind on the acoustic signal in wind turbine noise measurements is the double shielding recommended in IEC 61400-11 [
32]. An example of such a shield made by SONOPAN Sp. z o.o. is presented in
Figure 1.
The ZTW-1 wind turbine noise measurement kit consists of a measuring board made of wood 12 mm thick with a diameter of 1000 mm and two windshields: an inner OP90/2 with a radius of 45 mm and an outer OP500 with a radius of 250 mm. Both windshields are made of foam.
According to the manufacturer’s declaration, the total impact of windshields shown in
Figure 1 in the range 250 Hz–12.5 kHz should not exceed 0.5 dB [
33]. The attenuation of sound propagation in the lower frequency range is not determined due to measurement limitations in anechoic chambers (chamber cut-off frequency). Therefore, tests in real conditions in the low-frequency range are justified.
Within the project, NOR/POLNOR/Hetman/0073/2019-00 [
2] concerning the development of guidelines and measurement methodology of the wind turbine low-frequency noise, tests, and acoustic measurements were made in the environment for various microphone placement methods and for different windshields. Based on the literature review and expert knowledge, two low-frequency sources were measured—a ventilation shaft and a wind turbine.
4. Analysis of Results
The first measurement session recorded acoustic signals during the windless weather in point P1 on 23 June 2021.
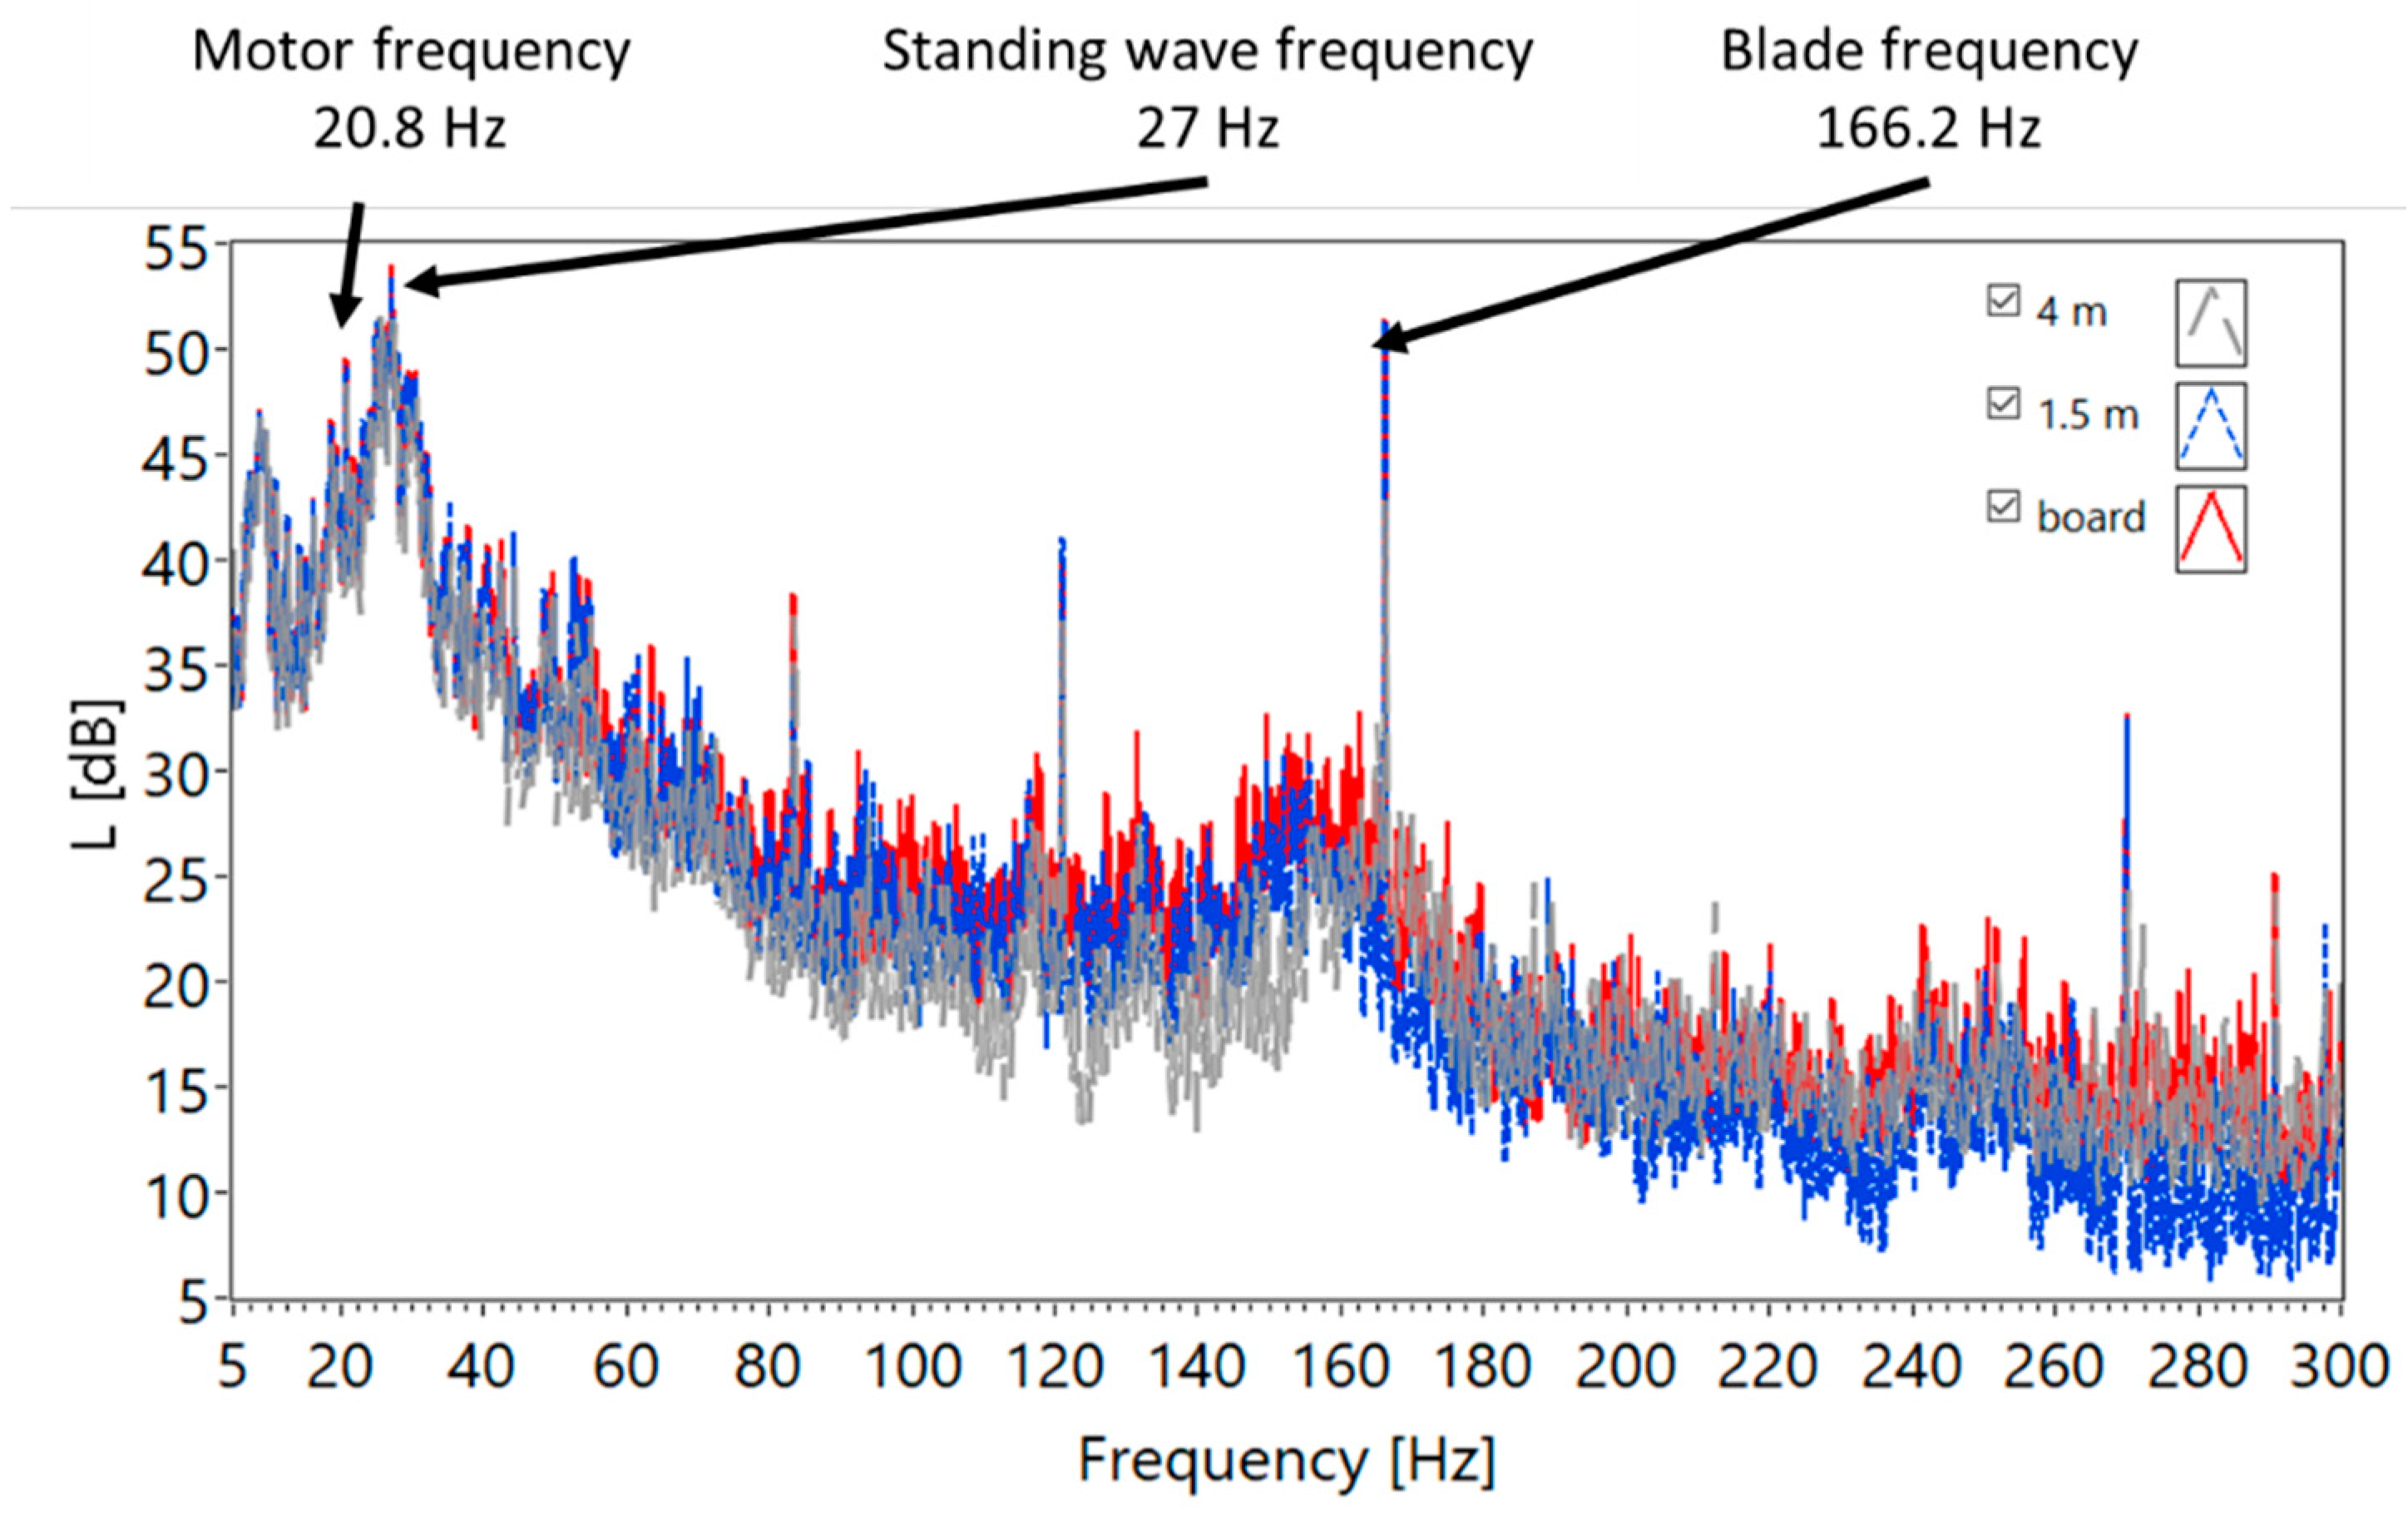
Figure 5 presents the amplitude-frequency spectrum in 5–300 Hz range. The spectrum has the local maximum at 20.8 Hz generated by the revolutions of the fan motor shaft. The motor speed during the measurement was 1251 rpm. The frequency component associated with fan blades operation is also visible. There are 8 blades in the fan analyzed, which at the shaft revolution frequency of 20.85 Hz results the blade frequency equal to 166.8 Hz. Frequency 24 Hz has the largest amplitude which is related to the air column standing wave frequency.
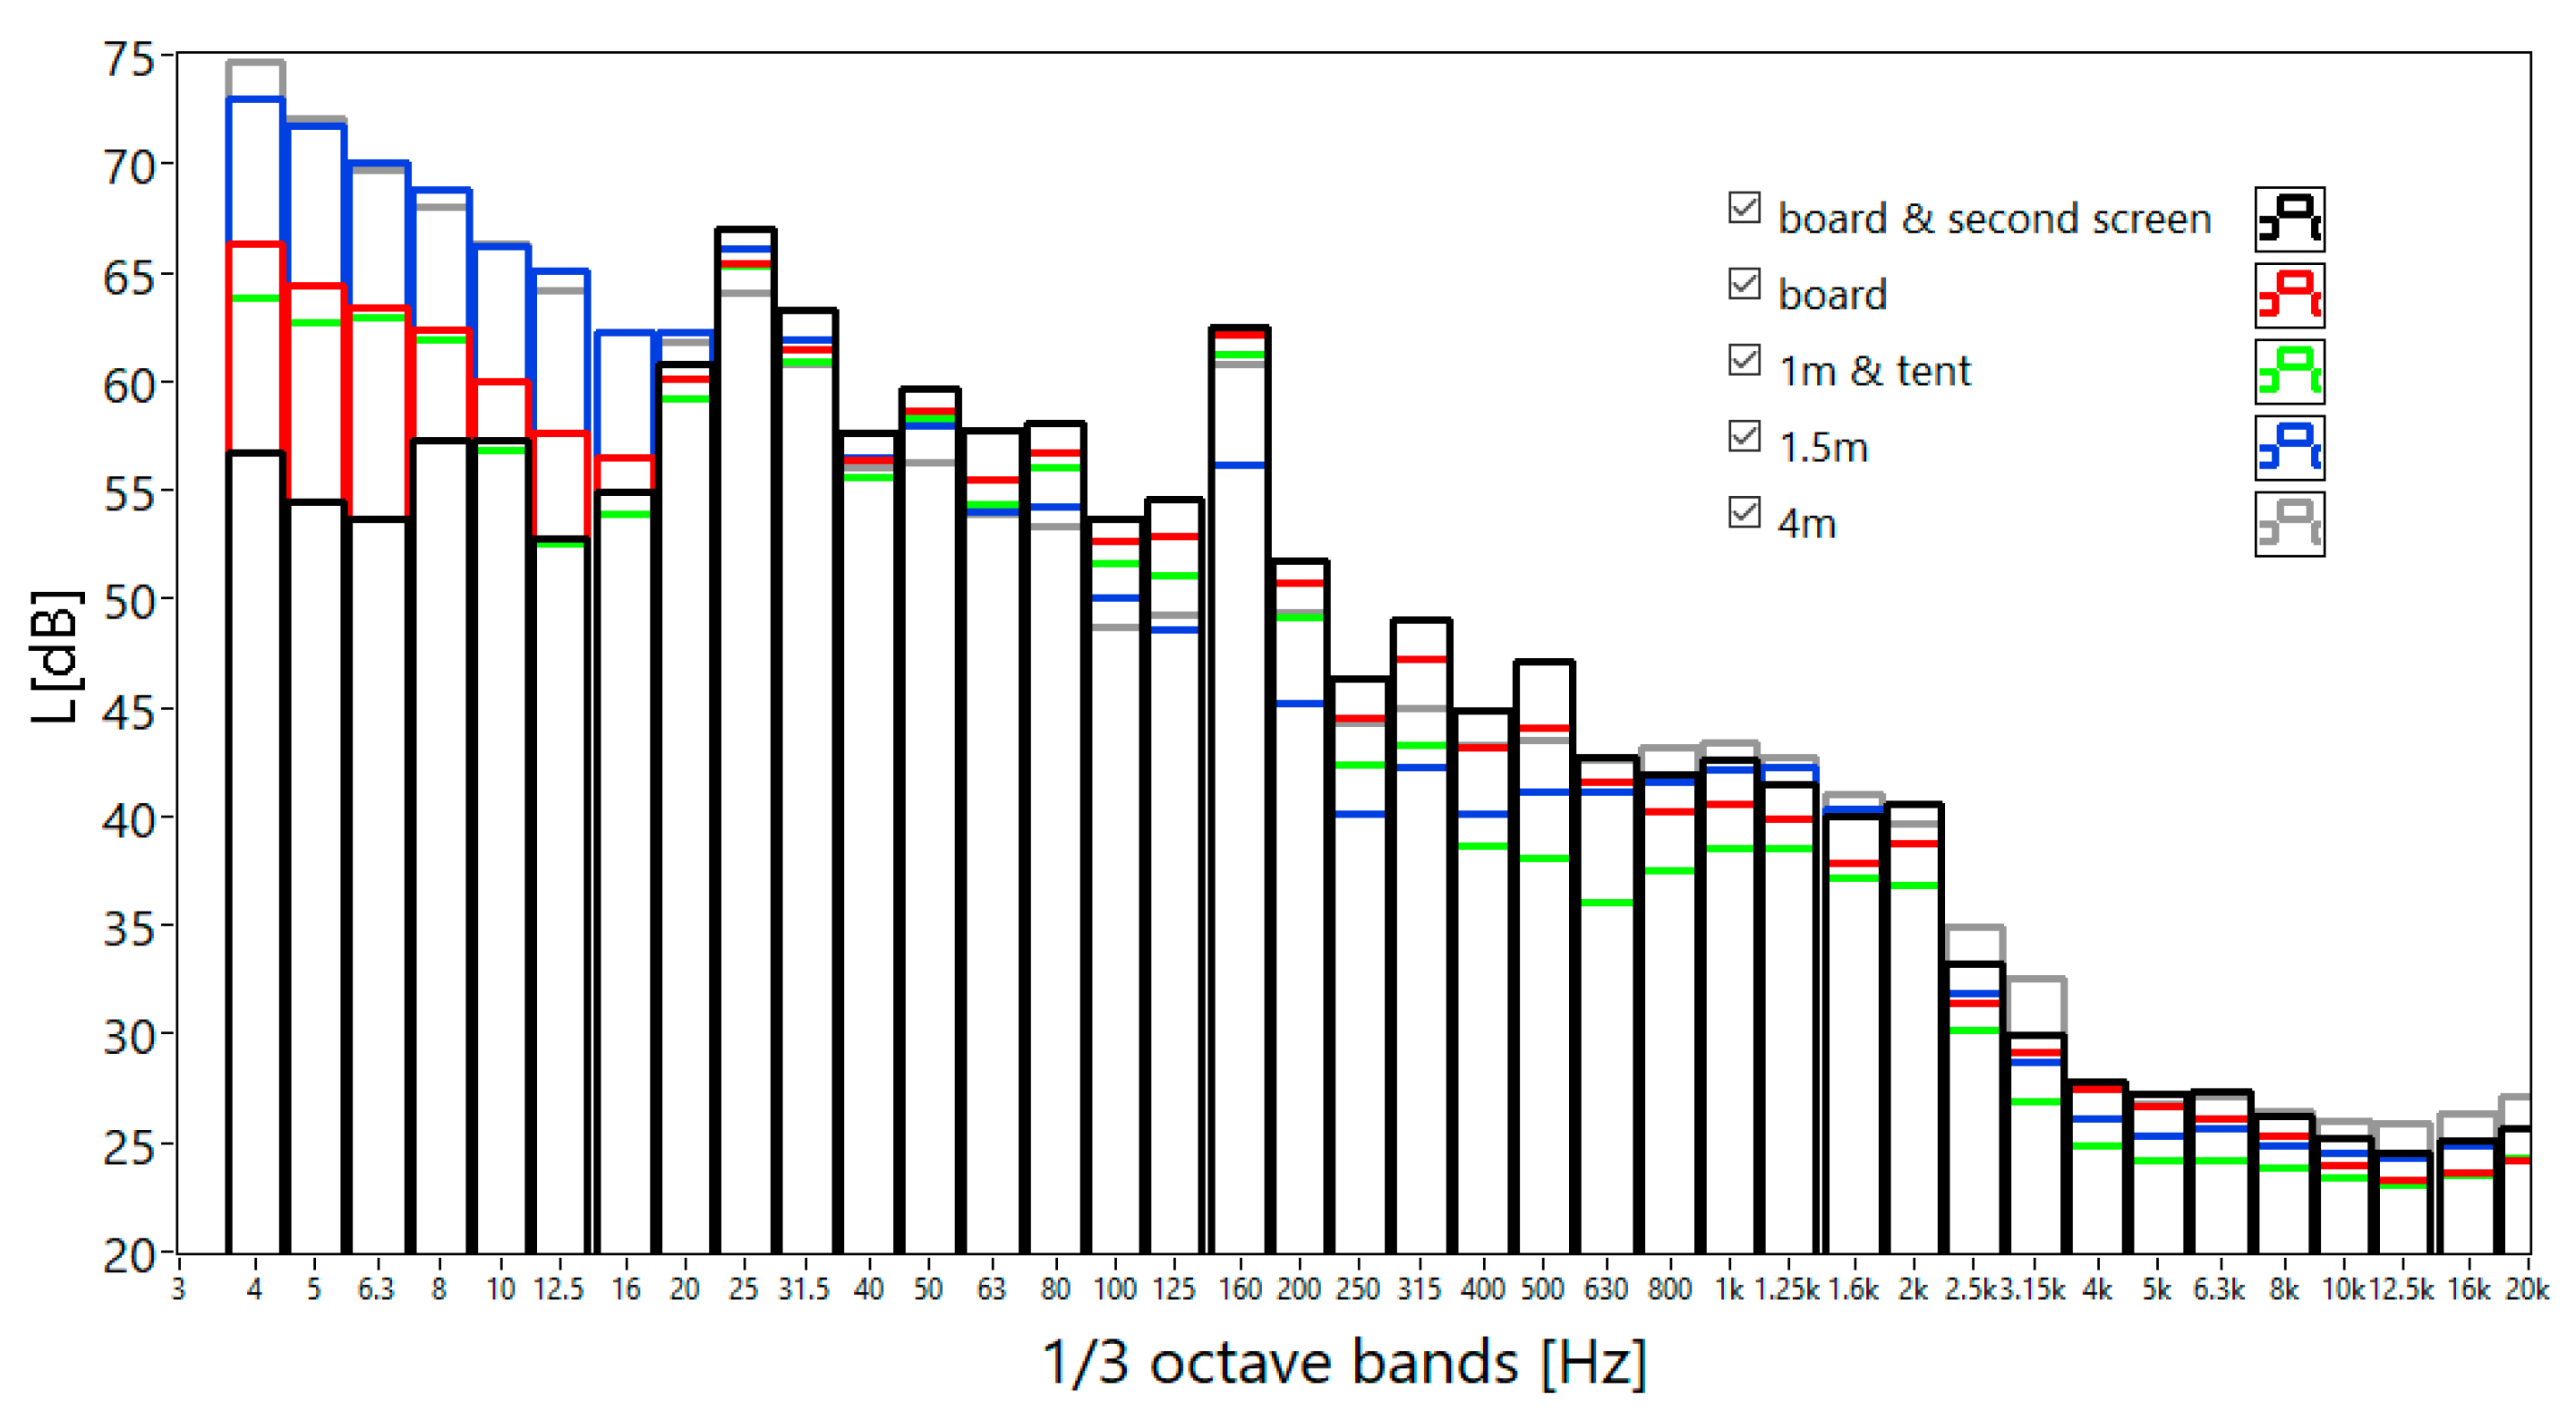
Figure 6 shows the one-third octave spectra for all measurement variants during windless weather. In frequencies below 50 Hz, there are no significant differences between the measurements at the height of 4 m, 1.5 m, and on the board with a double shield. The most significant difference between the tested windshields was obtained for the 40 Hz band, which was approximately 5 dB, while on average the difference was less than 1.5 dB. Significant discrepancies are visible for the 160 Hz band. The largest amplitudes for these components were obtained on the board, the smallest at the height of 4 m. The difference was approximately 7 dB.
In bands from 400 Hz to 4 kHz, significantly higher values were obtained for measurements on tripods. In most bands, the differences between the windshields tested are close to 10 dB. Higher amplitudes in these bands may be caused by the presence of other sources, such as traffic, bird vocalization, and trucks operated in the mine at a farther distance.
Then, measurement signals were recorded on 18 February 2022 at an average wind speed of 5 m/s. The spectra of signals determined for the 10-min timeframe are presented in
Figure 7 and
Figure 8. The time window was that long due to numerous gusts of wind which significantly affected the values of one-third octave amplitudes at low frequencies.
Depending on the shield used (and the microphone height) the most significant differences can be observed in bands below 20 Hz (
Figure 7). In comparison with the measurements made during windless weather, most similar levels (
Figure 6) were measured on the board with a double windshield. Only in 4 Hz and 5 Hz bands, the differences in results are larger–slightly higher values during the presence of wind were recorded on the board. However, it should be noticed that the noise generated by the forced-draught cooling tower includes mainly low frequencies (up to 160 Hz), and their spectral structure and level in both measurement session was similar. The higher frequencies come from the “environment” which could differ in both sessions. As expected, the most significant disturbance in the low-frequency range was recorded at microphones located on tripods with a single standard shield. For these microphones, the difference between the signal recorded at 0 m/s and 5 m/s wind speed reaches up to 30 dB. A significant disturbance was also measured on the board, but with a single shield, similar to the case of the microphone in the tent (
Figure 8). For a microphone placed on the board with a single windshield, the effect of wind speed on the measurements can be seen. These results confirm the recommendations of many environmental noise measurement standards, which indicate that noise measurements should be carried out at a wind speed of up to 5 m/s. Above this speed, the commonly used windshields do not serve their purpose. However, in the case of the microphone placed in the tent, the measurement results were influenced by the noise generated by the tent skin, which, excited by the wind, generated sounds in the low frequency range.
Figure 9 presents one-third octave spectra for the measurement on the board with a double shield during windless weather and at an average wind speed of 5 m/s. The correction was used due to the different distances of measurement points P1 and P2 from the sound source, according to Formula (3) [
41]:
where:
—distance of point P1 from the source, m;
—distance of point P2 from the source, m;
—level measured at point P1, dB.
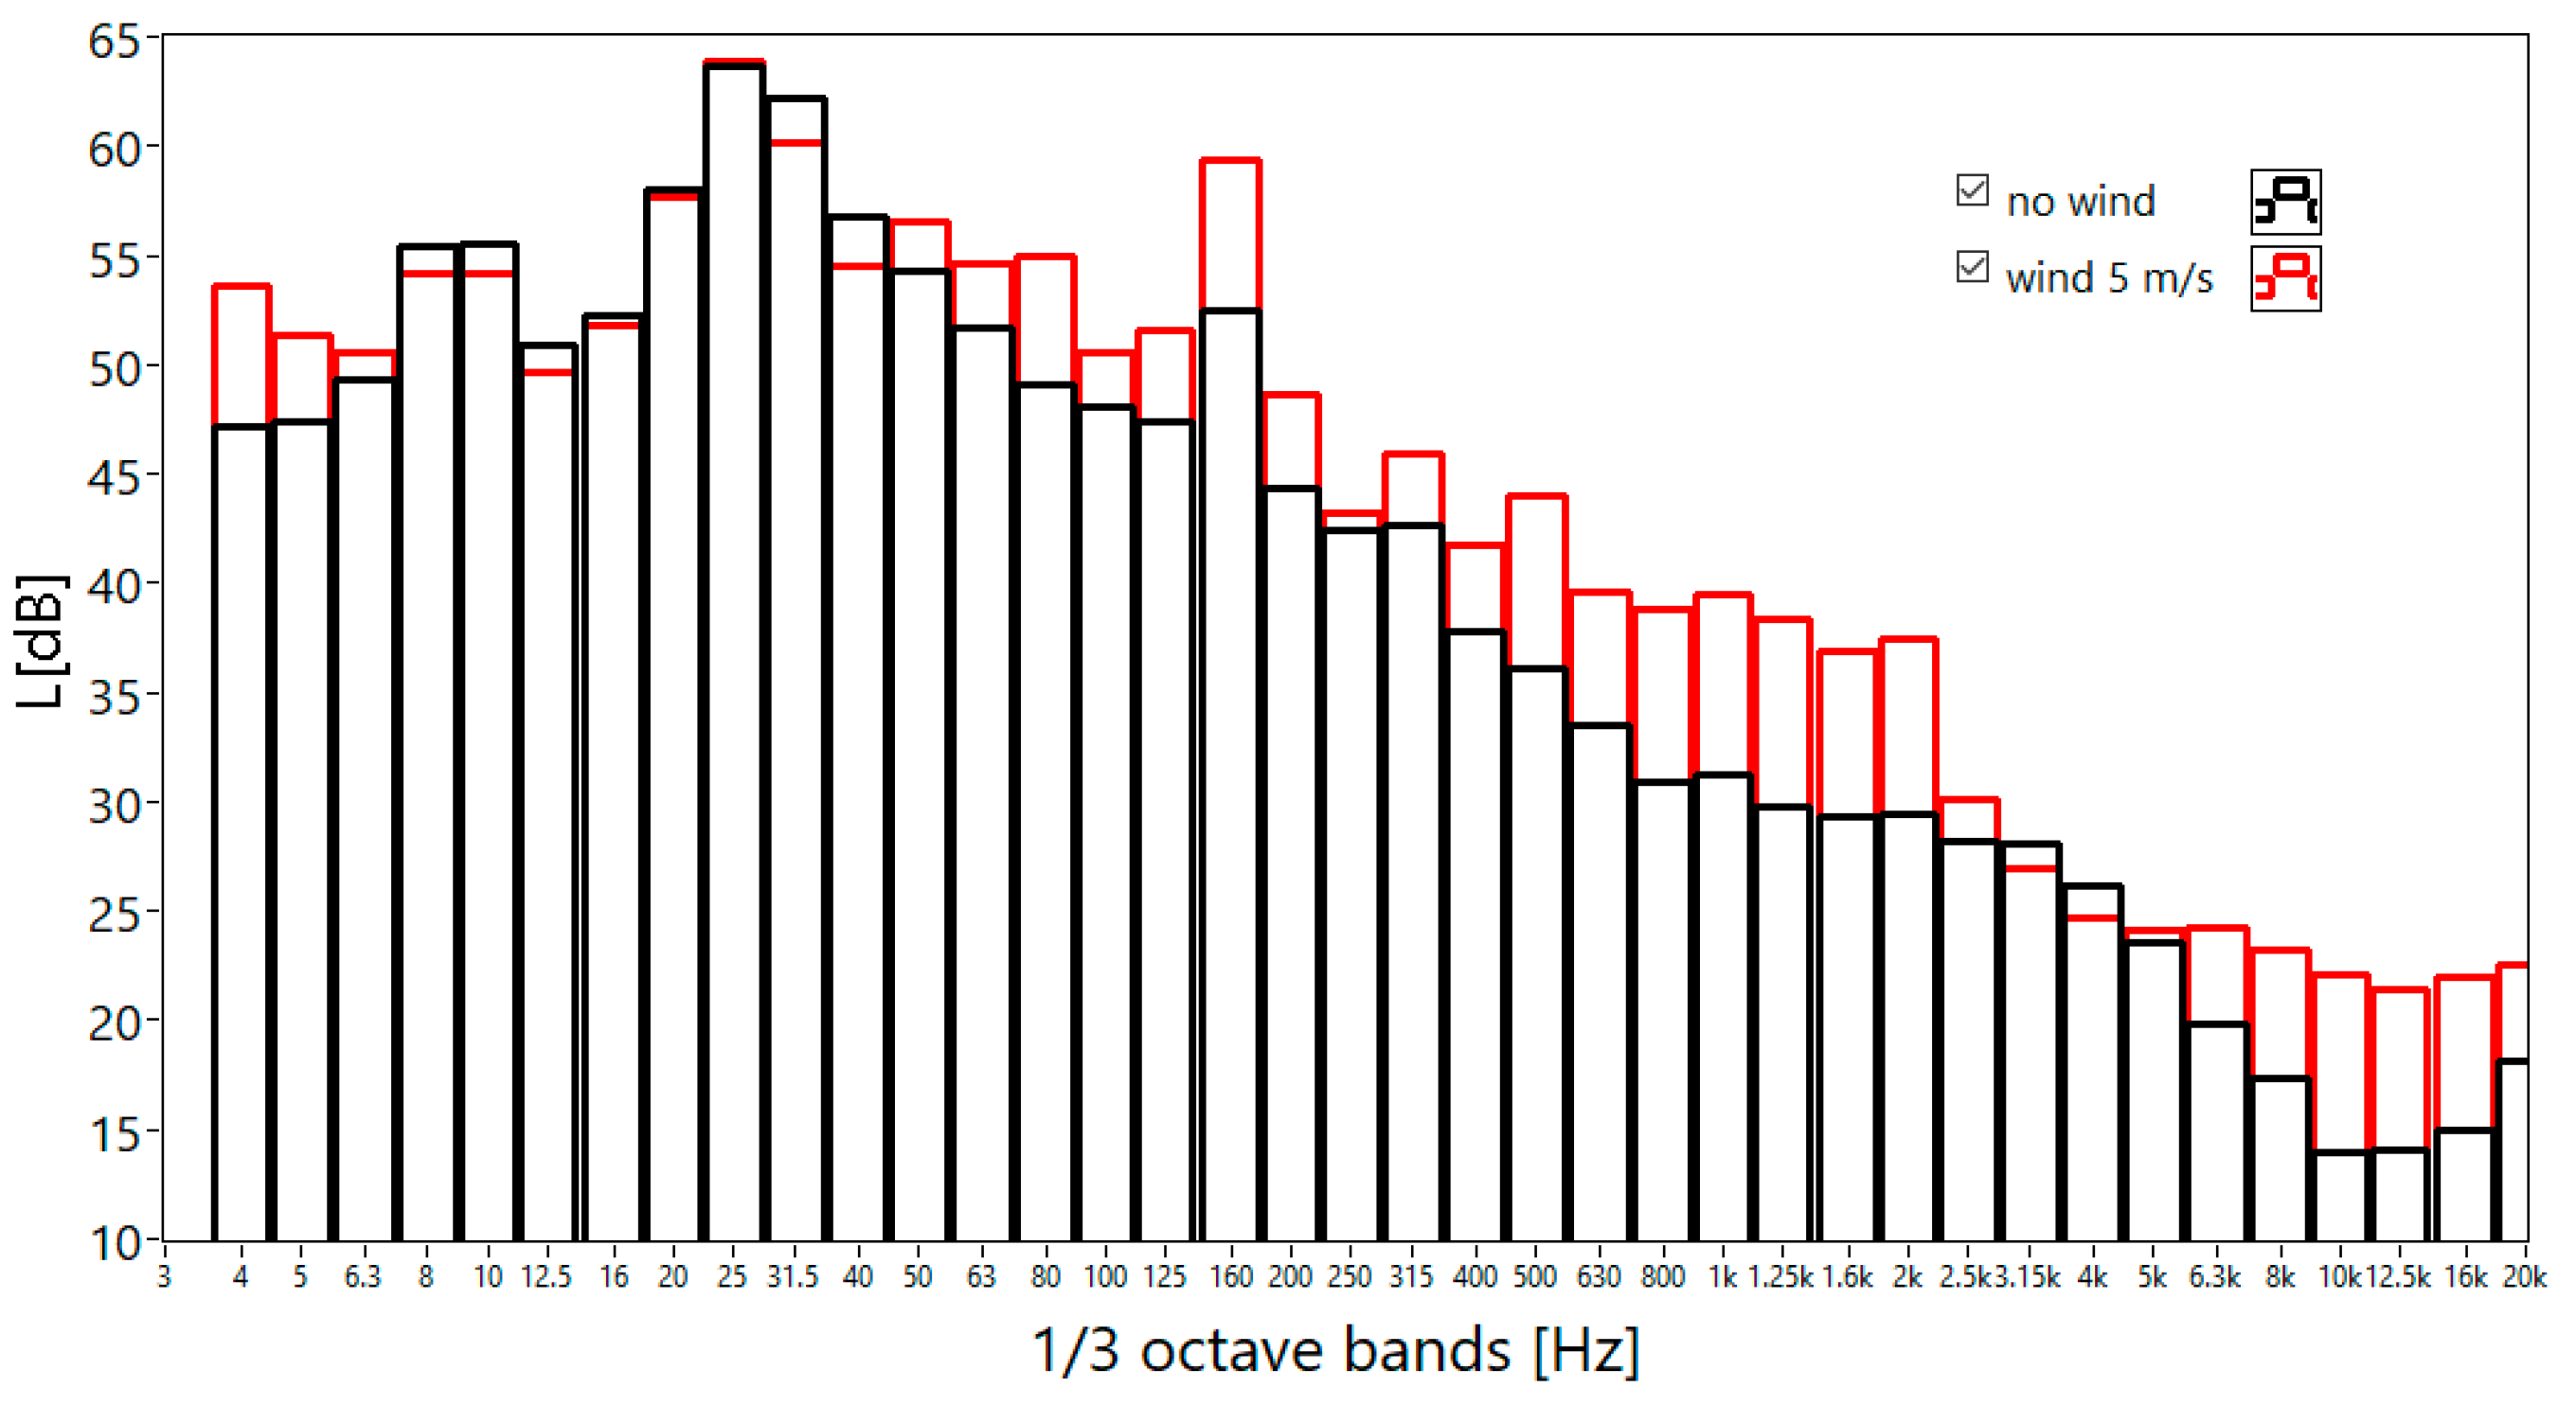
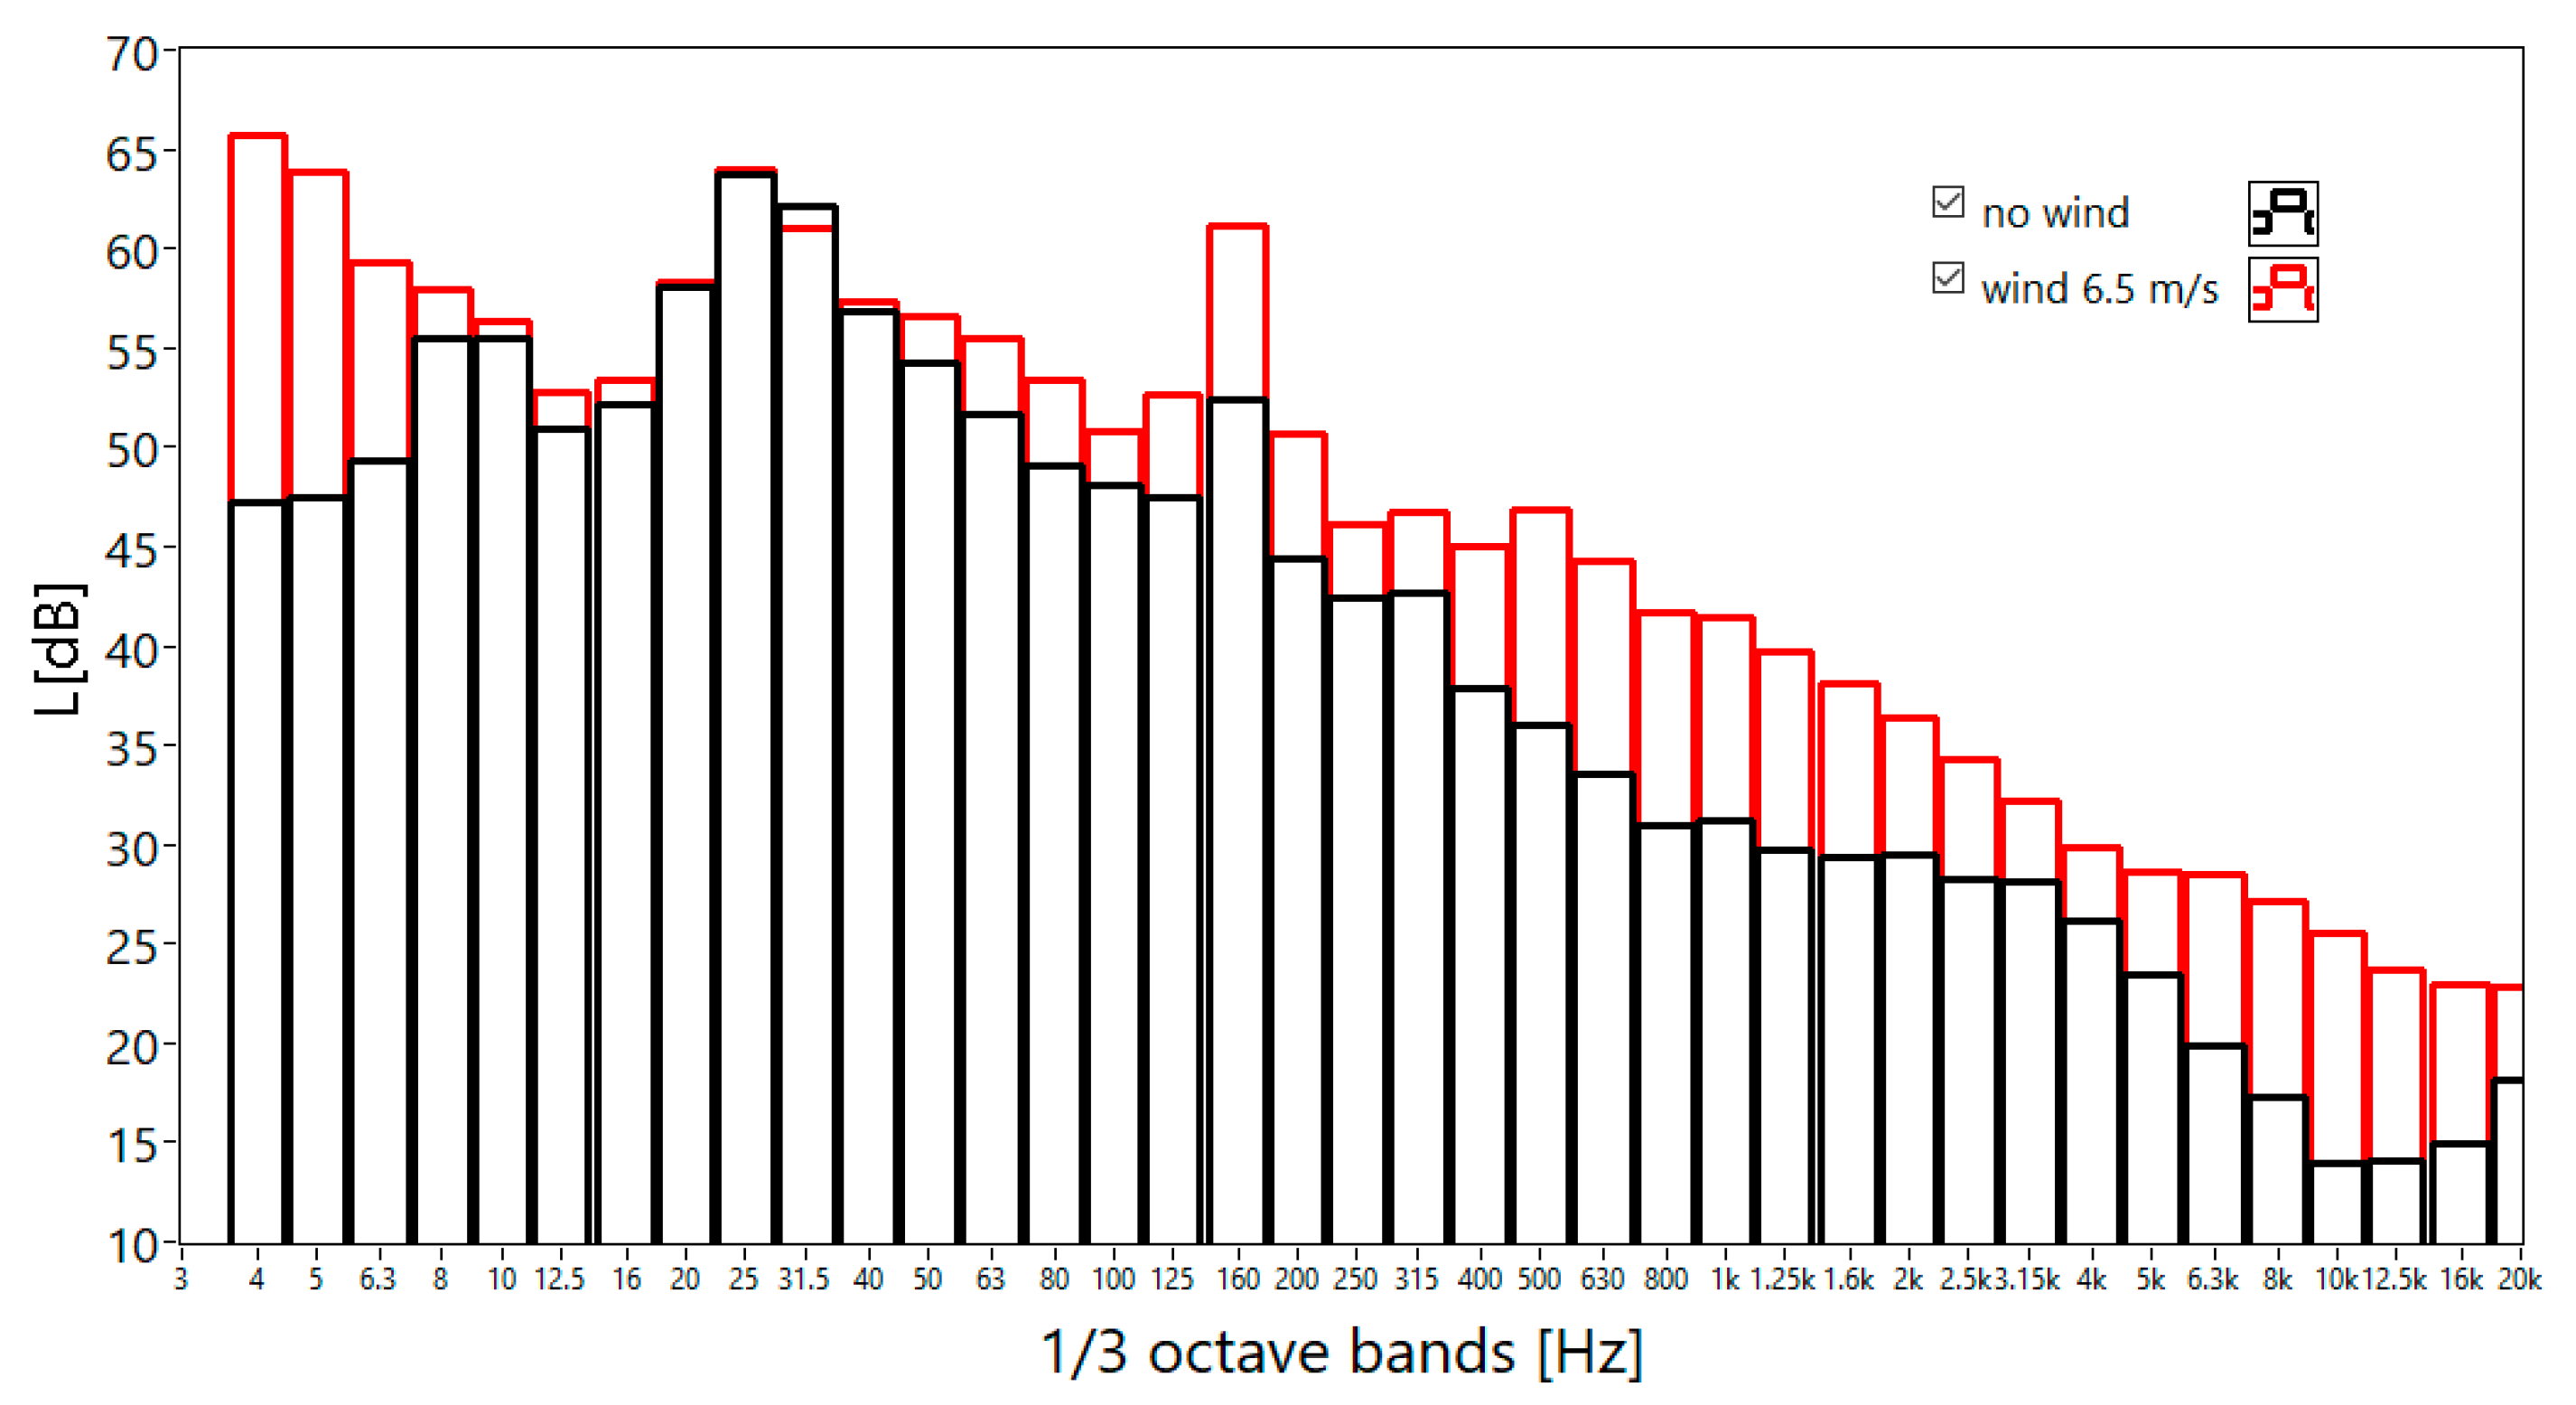
Figure 9.
Ventilation shaft noise. One-third octave spectrum for the measurement on the board with a double shield—wind speed 0 m/s (black), wind speed 5 m/s (red).
Figure 9.
Ventilation shaft noise. One-third octave spectrum for the measurement on the board with a double shield—wind speed 0 m/s (black), wind speed 5 m/s (red).
The correction in the analyzed case is 3.1 dB and has been applied to the diagram presented in
Figure 9. Due to the small difference in distance, other possible factors affecting sound attenuation were not considered.
There are noticeable differences in the recorded signals in the 4 Hz, 5 Hz, and 160 Hz bands. In the case of the 160 Hz band, the reason for this is that the fan was operating at different efficiency in the two measurement sessions (
Table 2). On the other hand, the differences registered in the bands above 250 Hz are due to the variability of external factors, not related to the source, affecting the acoustic climate of the place where the measurements were made.
The spectrum obtained for the signals recorded at the average wind speed of 6.5 m/s is presented in
Figure 10. In bands below 25 Hz, also the most reliable (closest to the results obtained during windless weather) were obtained for the measurement on the board with a double windshield.
The comparison of signals spectra recorded on the board with a double windshield during windless weather and during the wind speed of 6.5 m/s is shown in
Figure 11. The correction for a distance determined according to Formula (3) was also used in this case. A significant increase of differences in comparison to the signals during the windles weather was observed up to 6.3 Hz frequency bands. However, in the bands from 8 to 40 Hz, the results are almost identical to the windless weather. The higher level in the 160 Hz band is a result of higher fan efficiency (
Table 2). The obtained measurement results indicate that although the double shield isolates the microphone membrane from the wind with the highest efficiency in the low-frequency range, at the higher wind speeds (6.5 m/s) this protection is decisively reduced in the lowest frequency range (below 6.3 Hz).
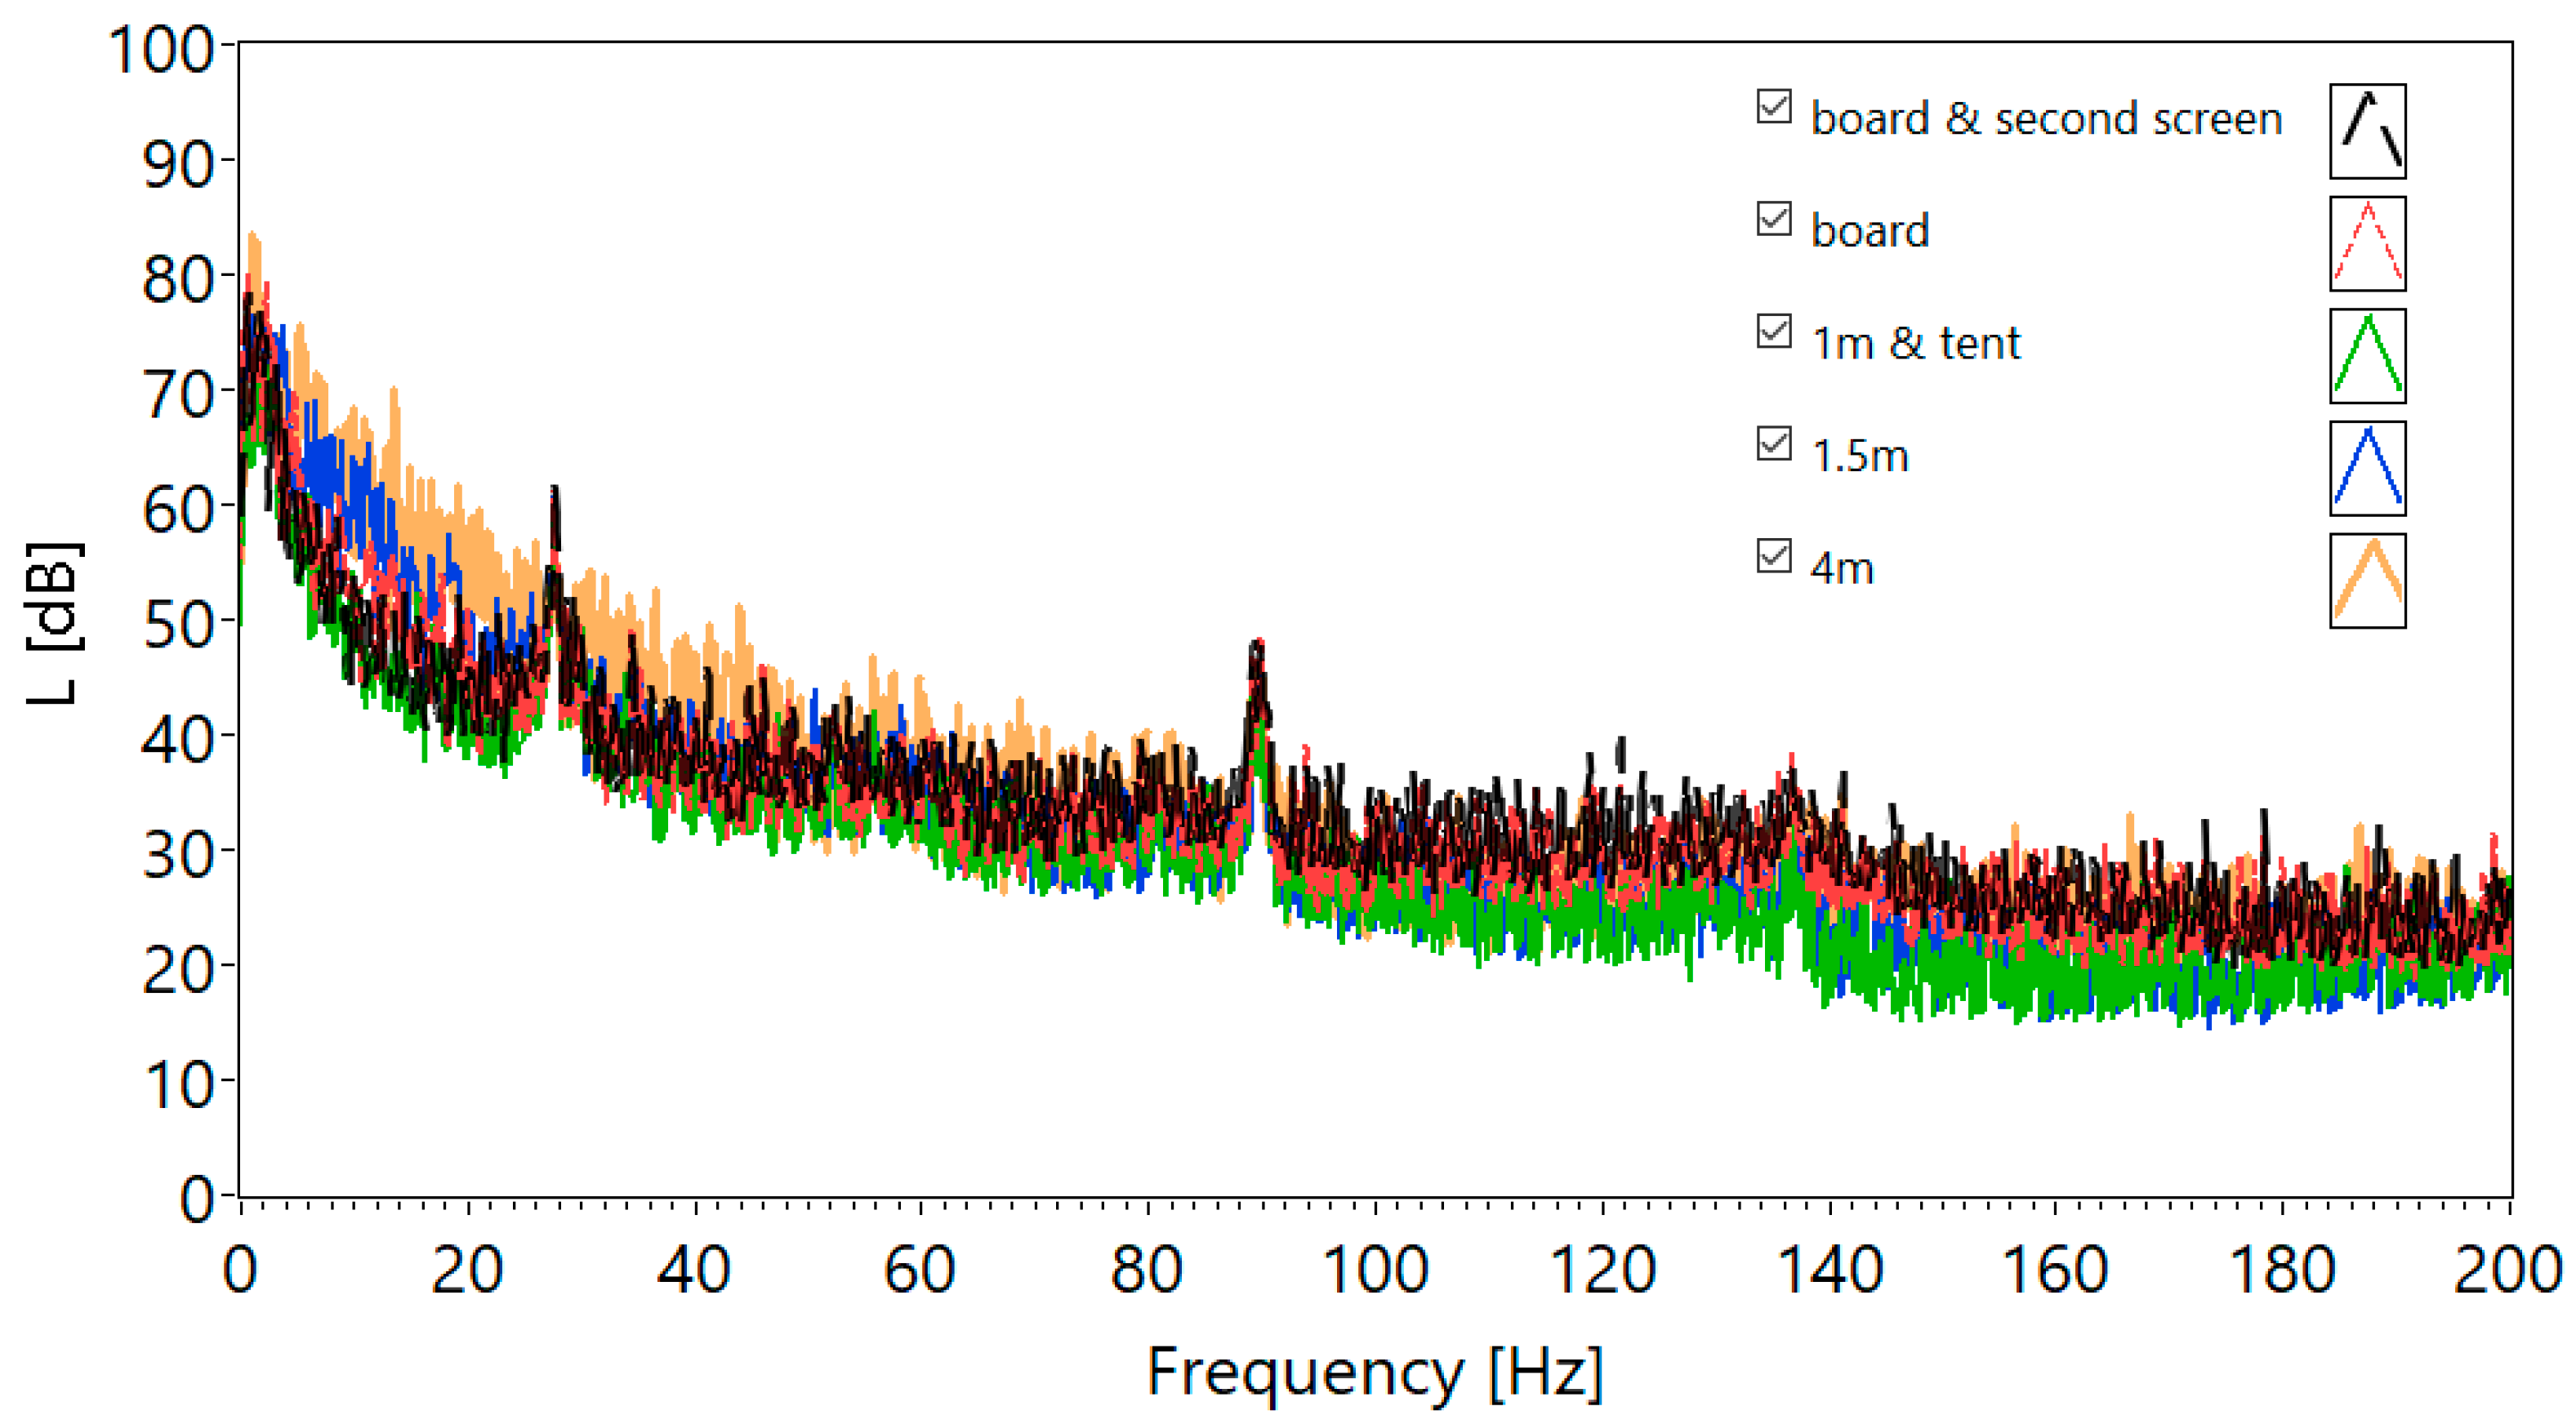
The analysis of the Fast Fourier Transform spectrum (FFT) (
Figure 12) indicates signal masking caused by the wind for measurements at the height of 4 m and 1.5 m. However, in the case of measurements on the board with a double shield, the component related to the standing wave frequency (about 24 Hz) is clearly visible.
5. Verification of the Wind Farm (Real Conditions)
The measurement kit described in the previous section (
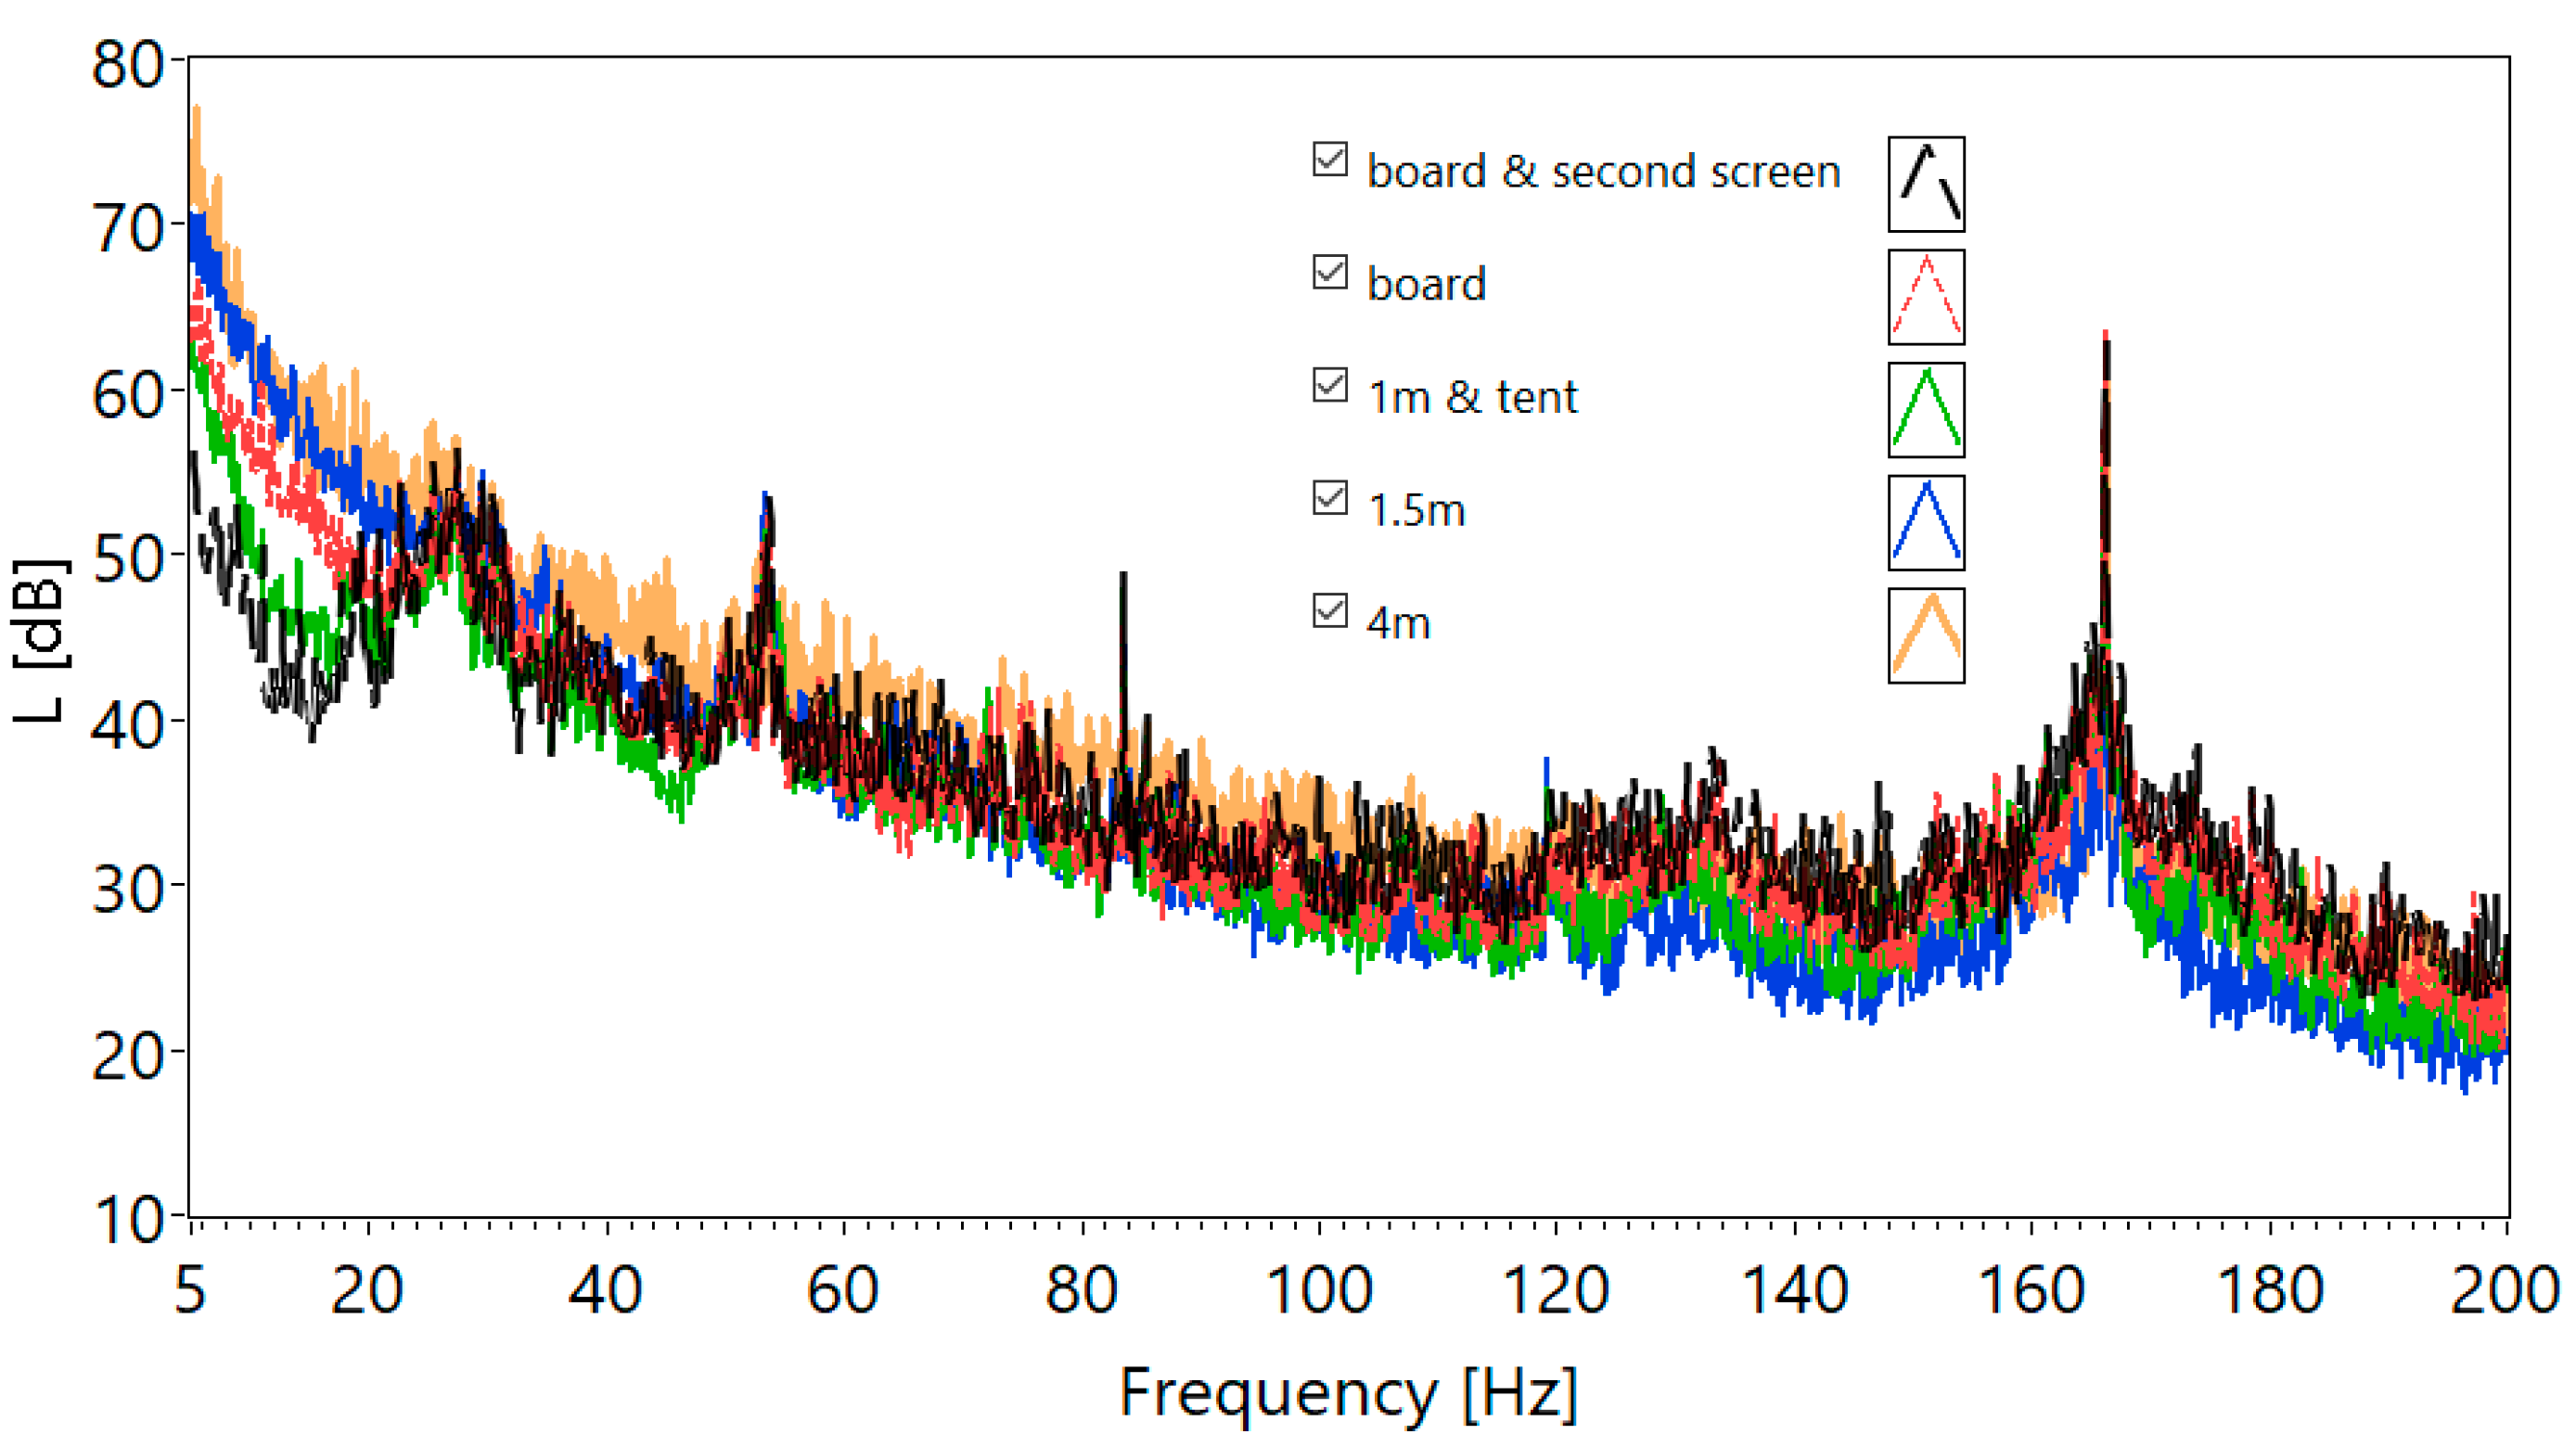
Table 3) was also tested on the wind farm in Łęki Dukielskie in the areal conditions for the work purpose. The measurement was made at a distance of 130 m from the turbine on 9 July 2021 (
Figure 13).
Ten-min timeframes were chosen for the analysis due to significant gusts of wind presented in
Figure 14.
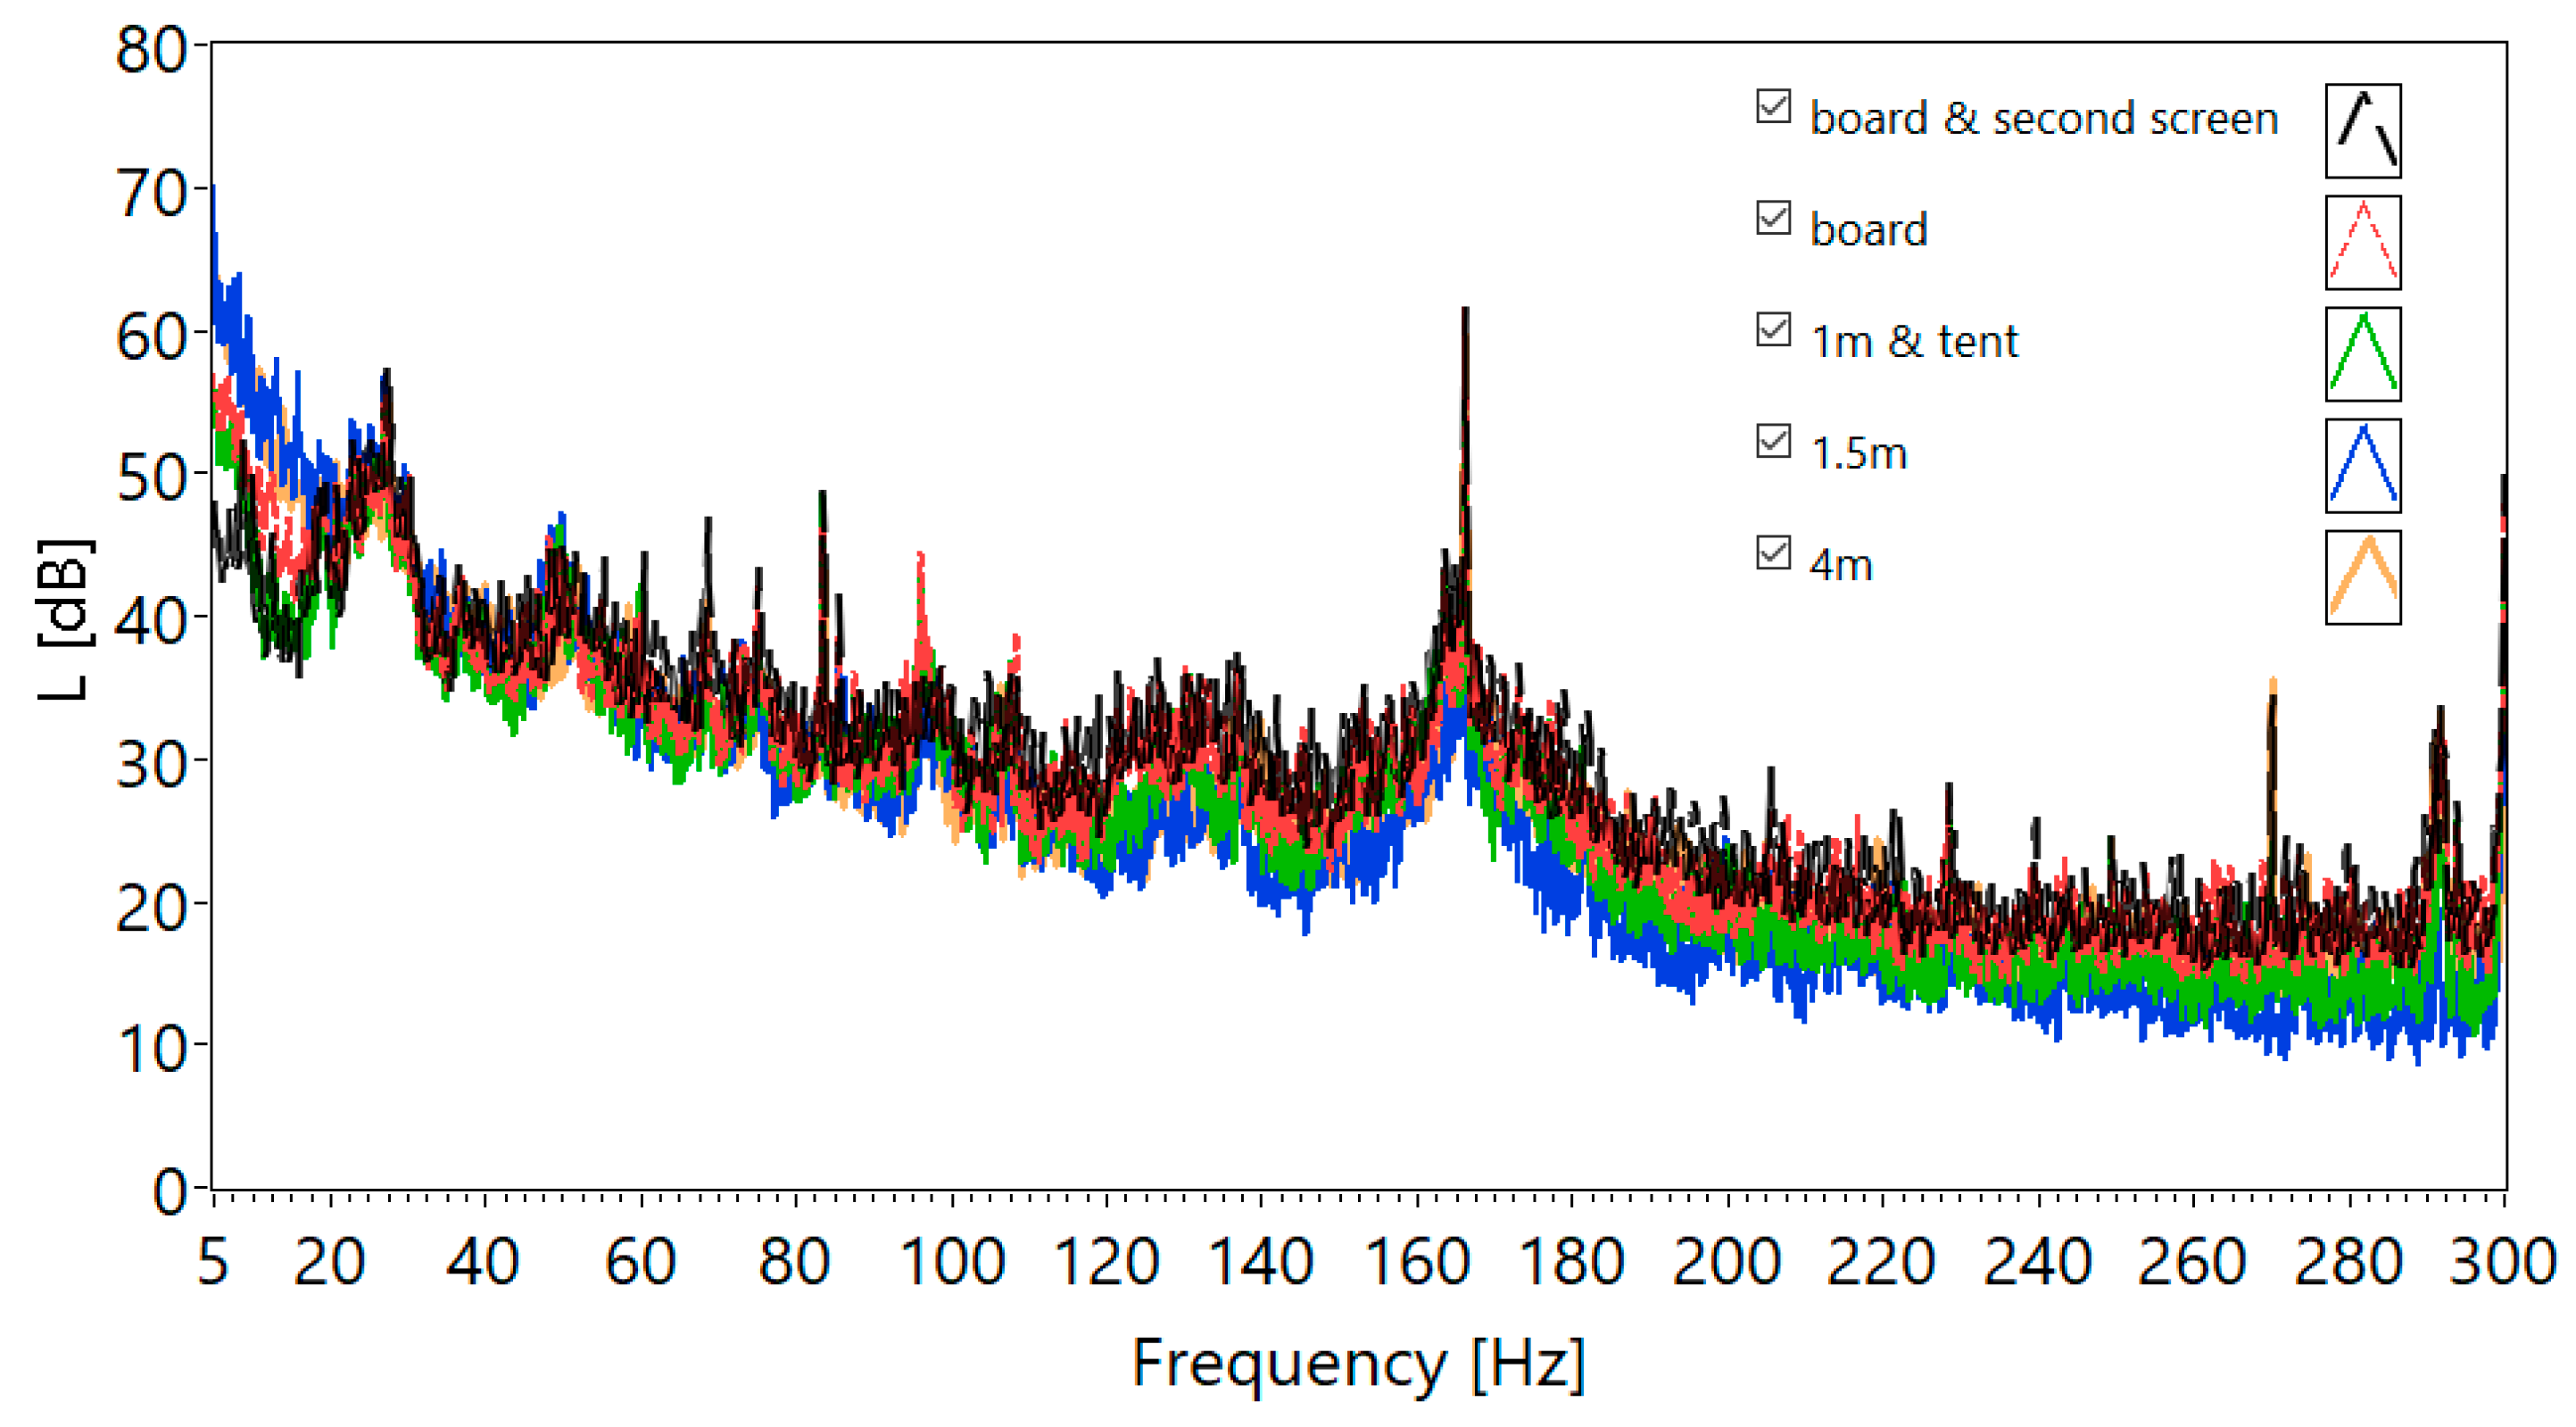
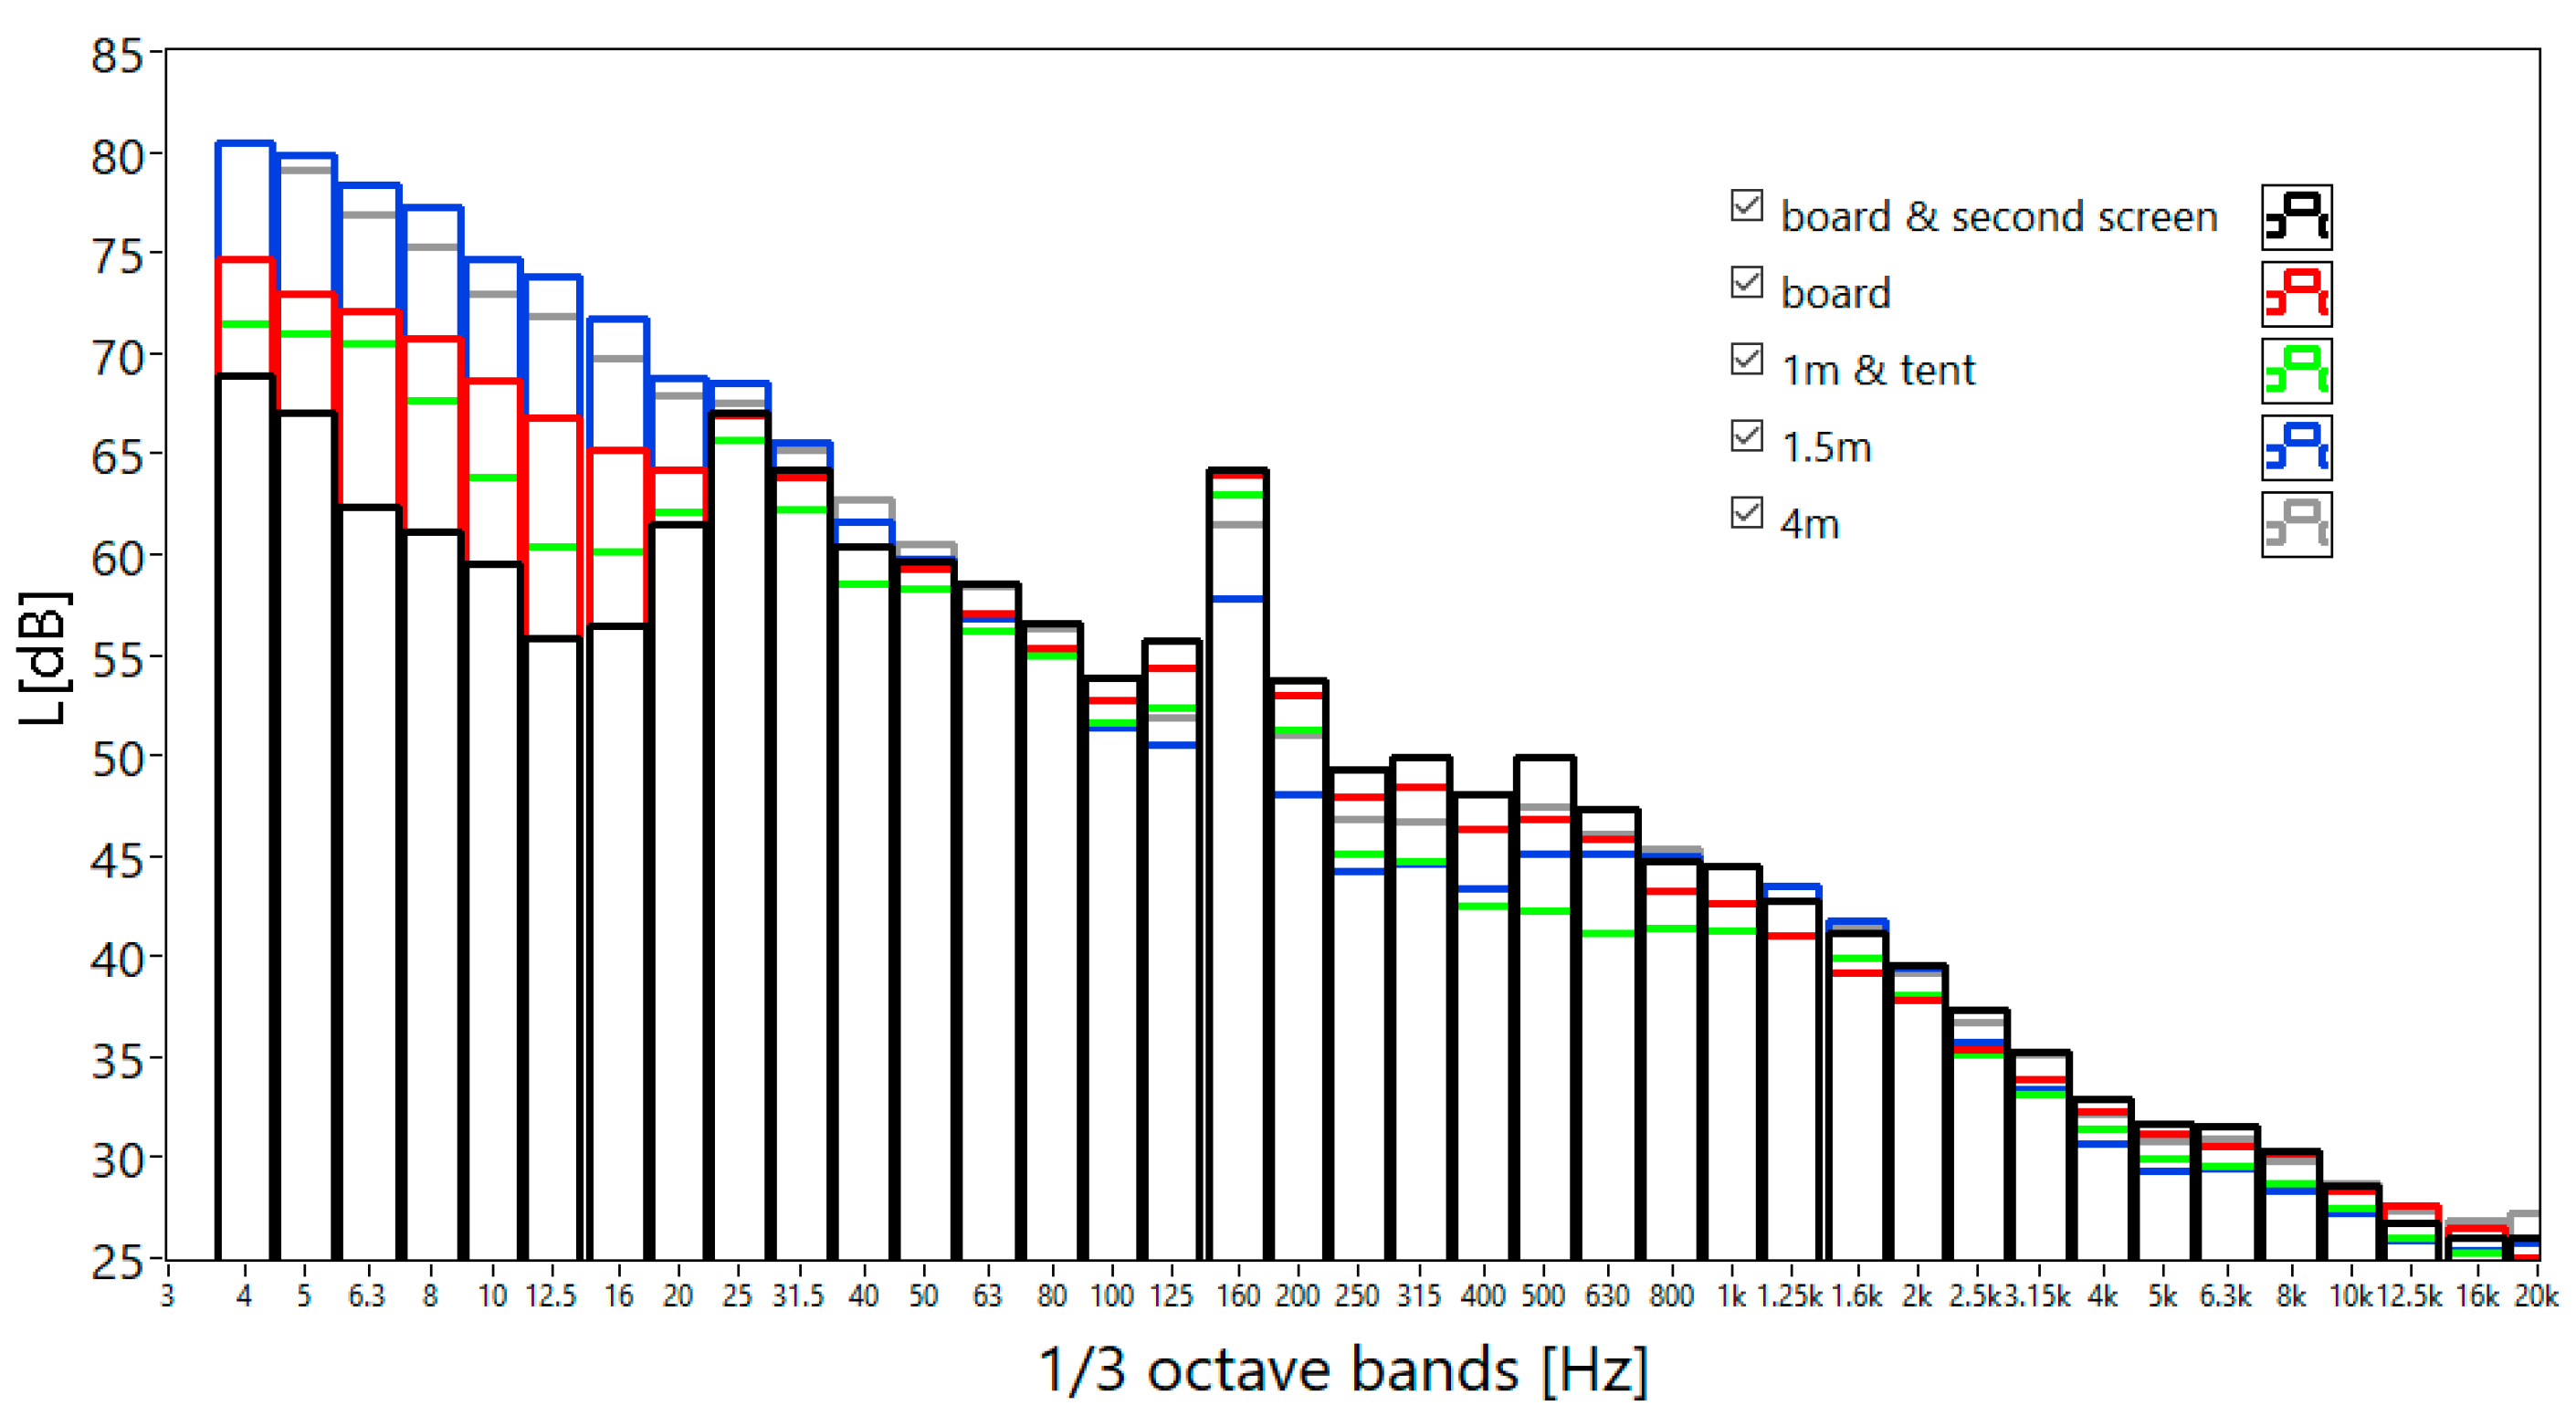
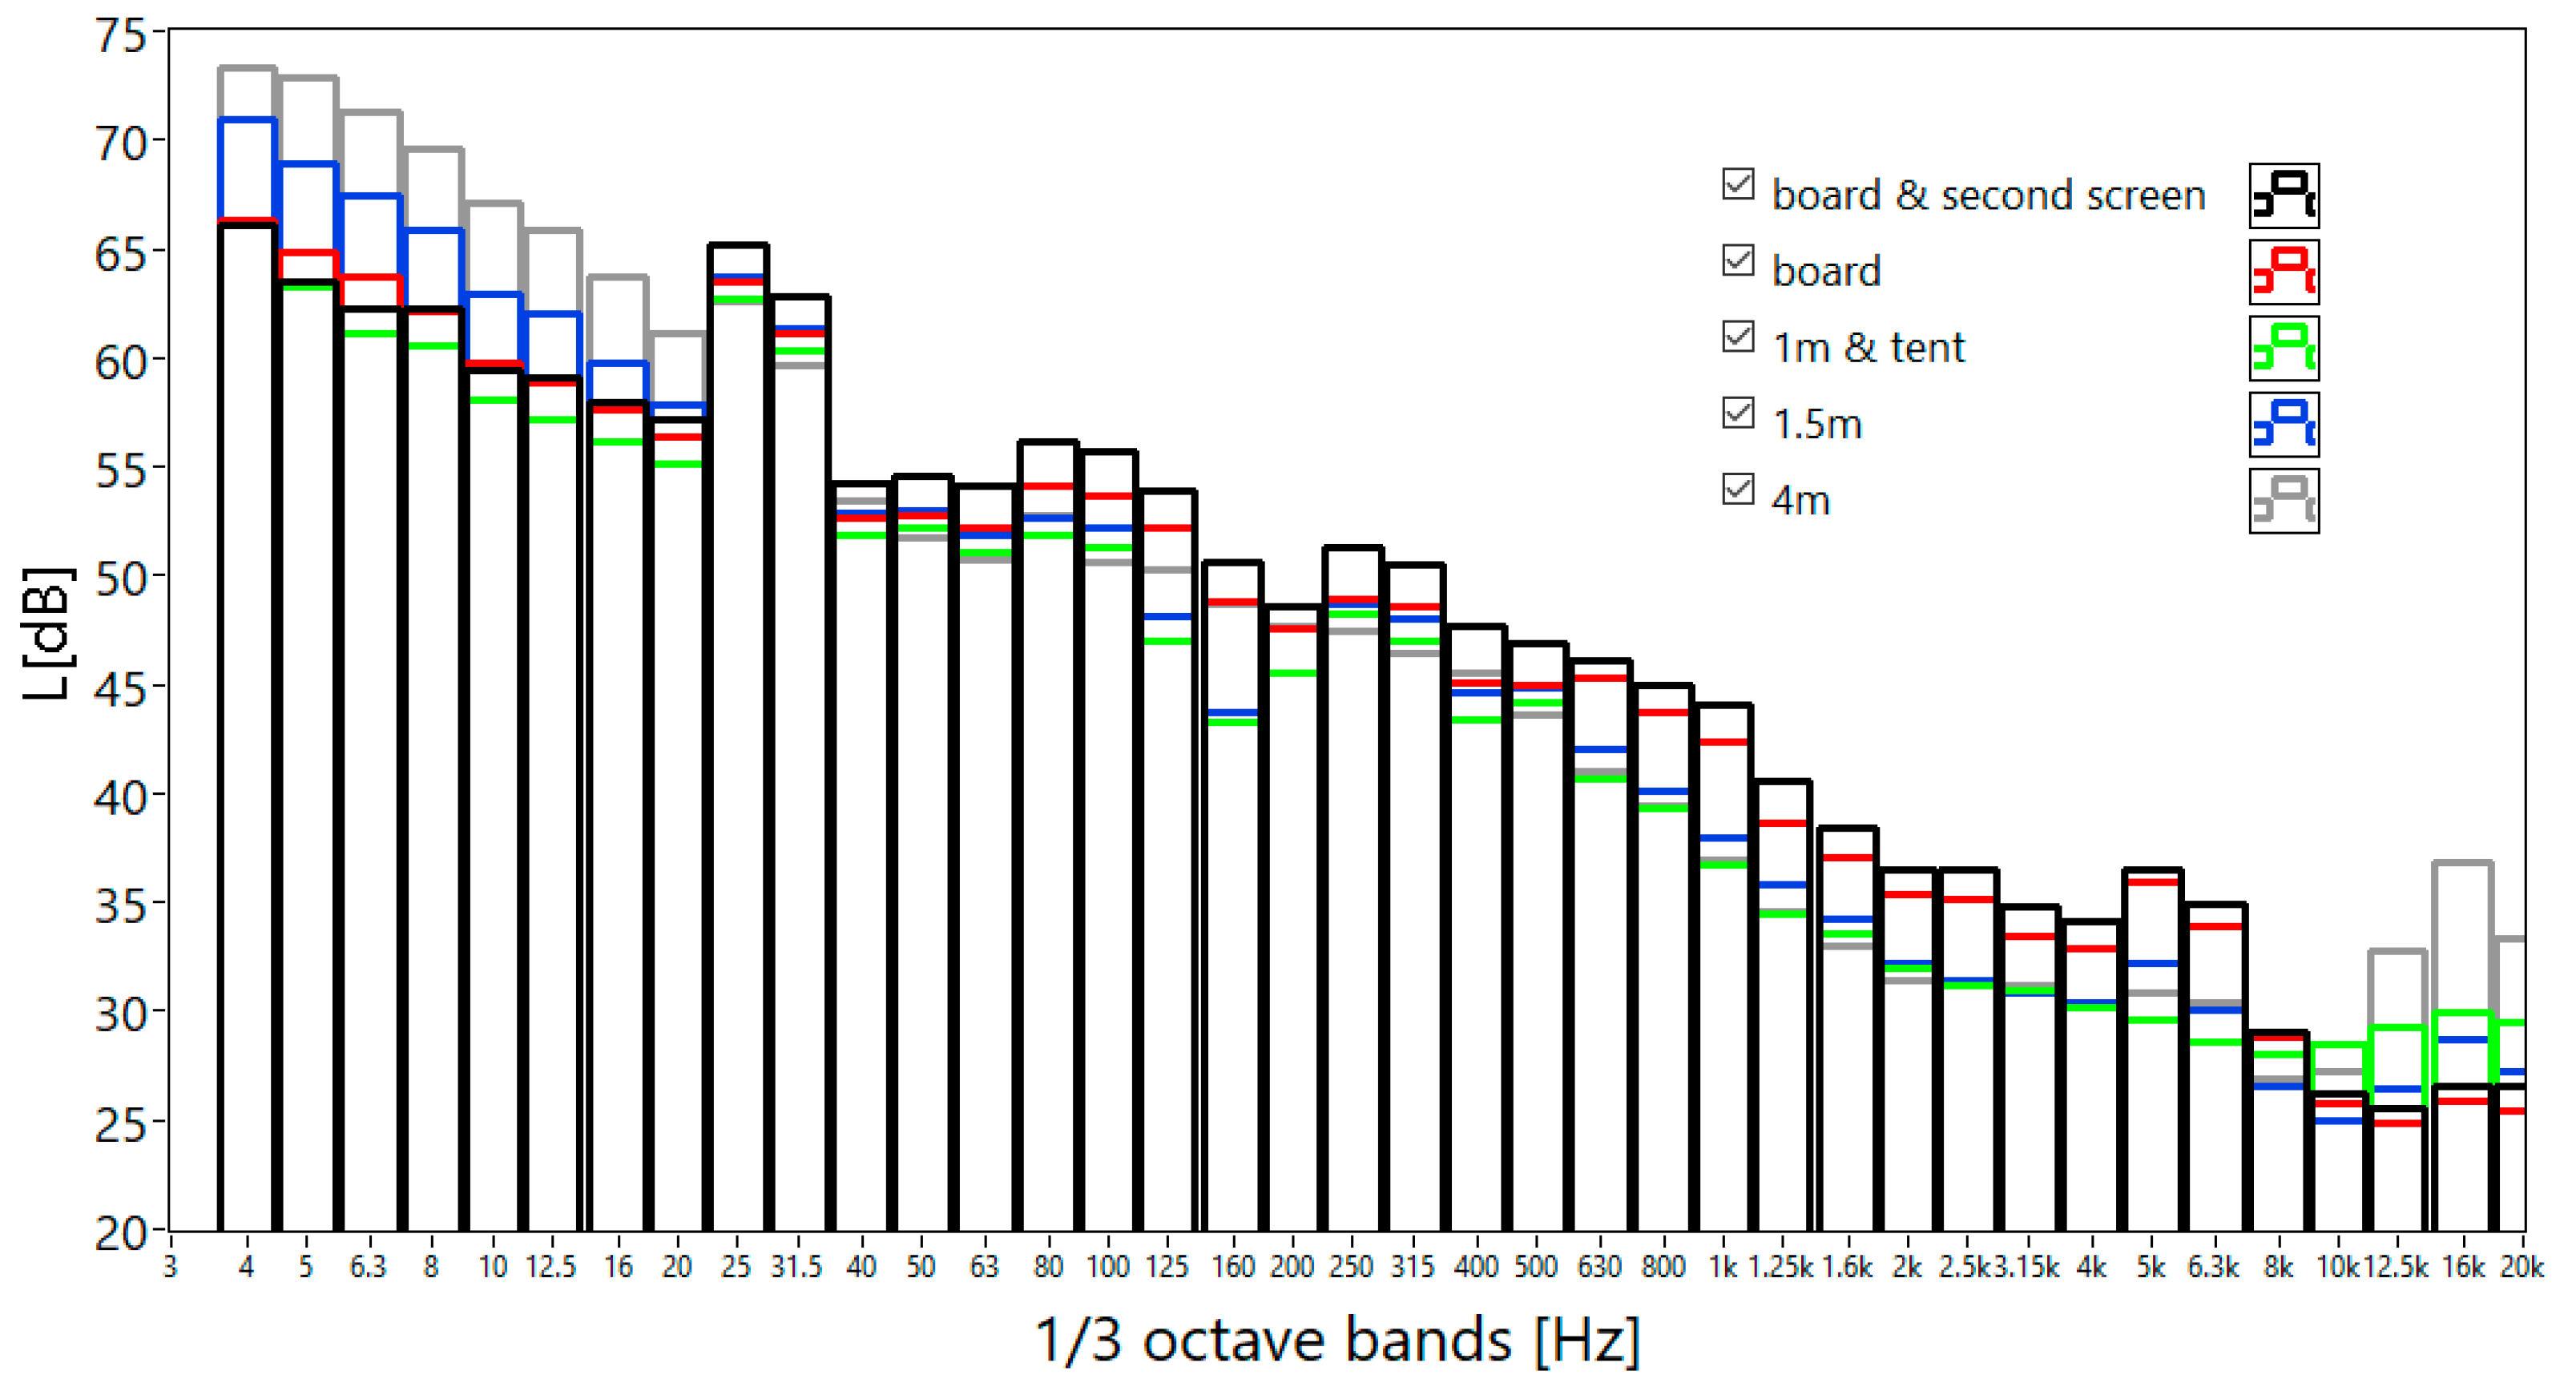
One-third octave spectrum and amplitude-frequency spectrum of signals recorded at an average wind speed of 2.1 m/s, determined for the 10-min timeframe, are presented in
Figure 15 and
Figure 16. In
Figure 16, clearly visible is the 27 Hz component from the generator shaft according to [
1,
42]. As with the measurements taken around the ventilation shaft, there are differences in the signal recorded using different windshields. These differences occur in the same frequency bands at very similar levels.
The measured values and the calculated 95% confidence interval limits are shown in
Table 4. Due to the asymmetric distributions of the sound pressure level values, the confidence intervals were determined using the percentiles method [
43]. In
Table 4, large uncertainty values (up to 11.3 dB) can be observed for measurements at 4 m. Significant widths of the confidence intervals are due to the large influence of wind gusts shown in
Figure 14. It should be noted that uncertainty values above 10 dB occur in the 6 bands shown. Similar uncertainty values were obtained for the measurement at 1.5m (maximum 10.4 dB). The best values were obtained for the measurement on the board with a double windshield. The maximum value of the expanded uncertainty is 7.3 dB. The results are similar for measurement with a tent.
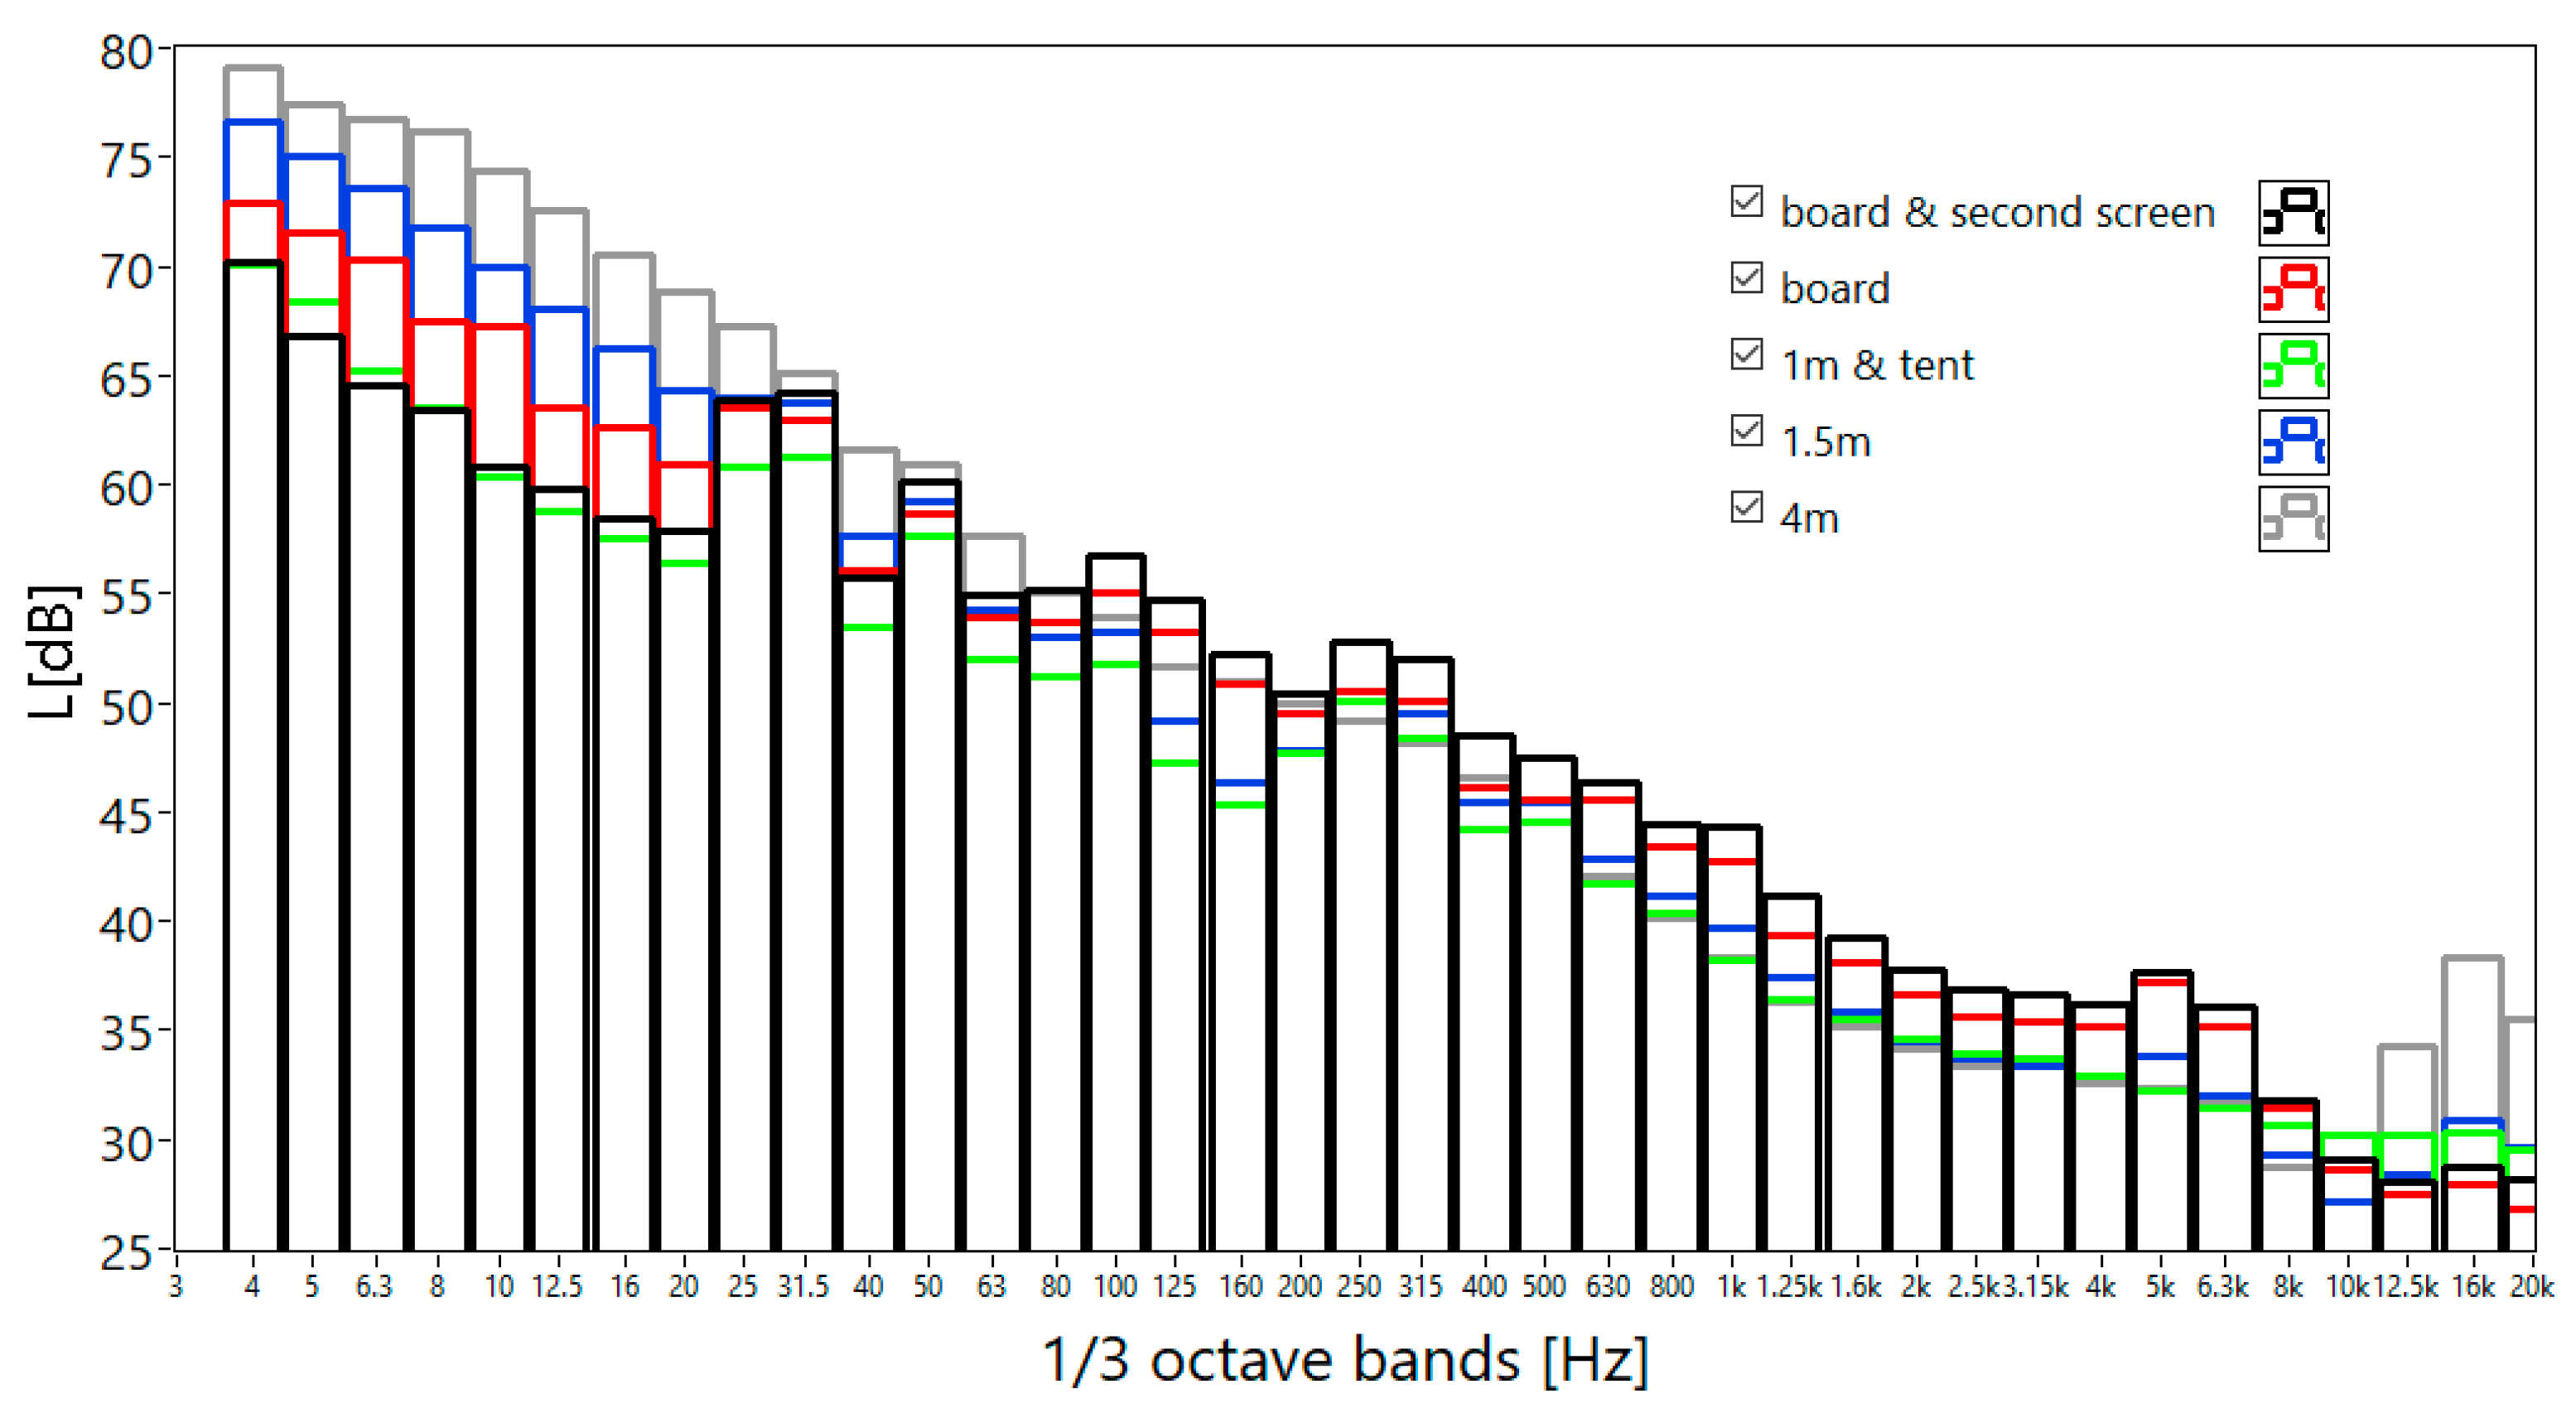
Figure 17 presents the one-third octave spectrum of signals recorded at the average wind speed of 3.5 m/s, determined for the 10-min timeframe. The comparison of these results with the results recorded at a wind speed of 2.1 m/s (
Figure 15) indicates a significant increase of the measured sound pressure level in the band with mid-frequency of 25 Hz, indicating the increase of disturbance caused by the wind gust of 4.5 m/s speed.
Table 5 shows the values of the sound pressure levels with confidence intervals. It is noteworthy that the lowest level values are found for the measurement on the board with a secondary screen and for the measurement in the tent. However, the measurement on the board with a secondary screen has a much smaller variance, which indicates smaller sensitivity to wind gusts.
Analysis of the FFT spectrum for frequencies below 10 Hz (
Figure 18) indicates masking of characteristic wind turbine frequencies for all signal recording methods, except the board with a double shield and the microphone in the tent. The results shown in
Figure 17 and
Figure 18 confirm the best effectiveness of the double shield (on the board) in reduction of the wind-induced disturbance in the lowest frequency bands.
In summary, for the measurements carried out for an average wind speed of 2.1 m/s with gusts up to 4.5 m/s, the best results were obtained for the measurement on the board with a double shield and the measurement with a tent. However, for higher wind speeds (mean wind speed of 3.5 m/s with gusts up to 6.7 m/s), the measurement on the board with a double windshield proved to be the best, as indicated by the lowest scatter of results.
6. Conclusions and Summary
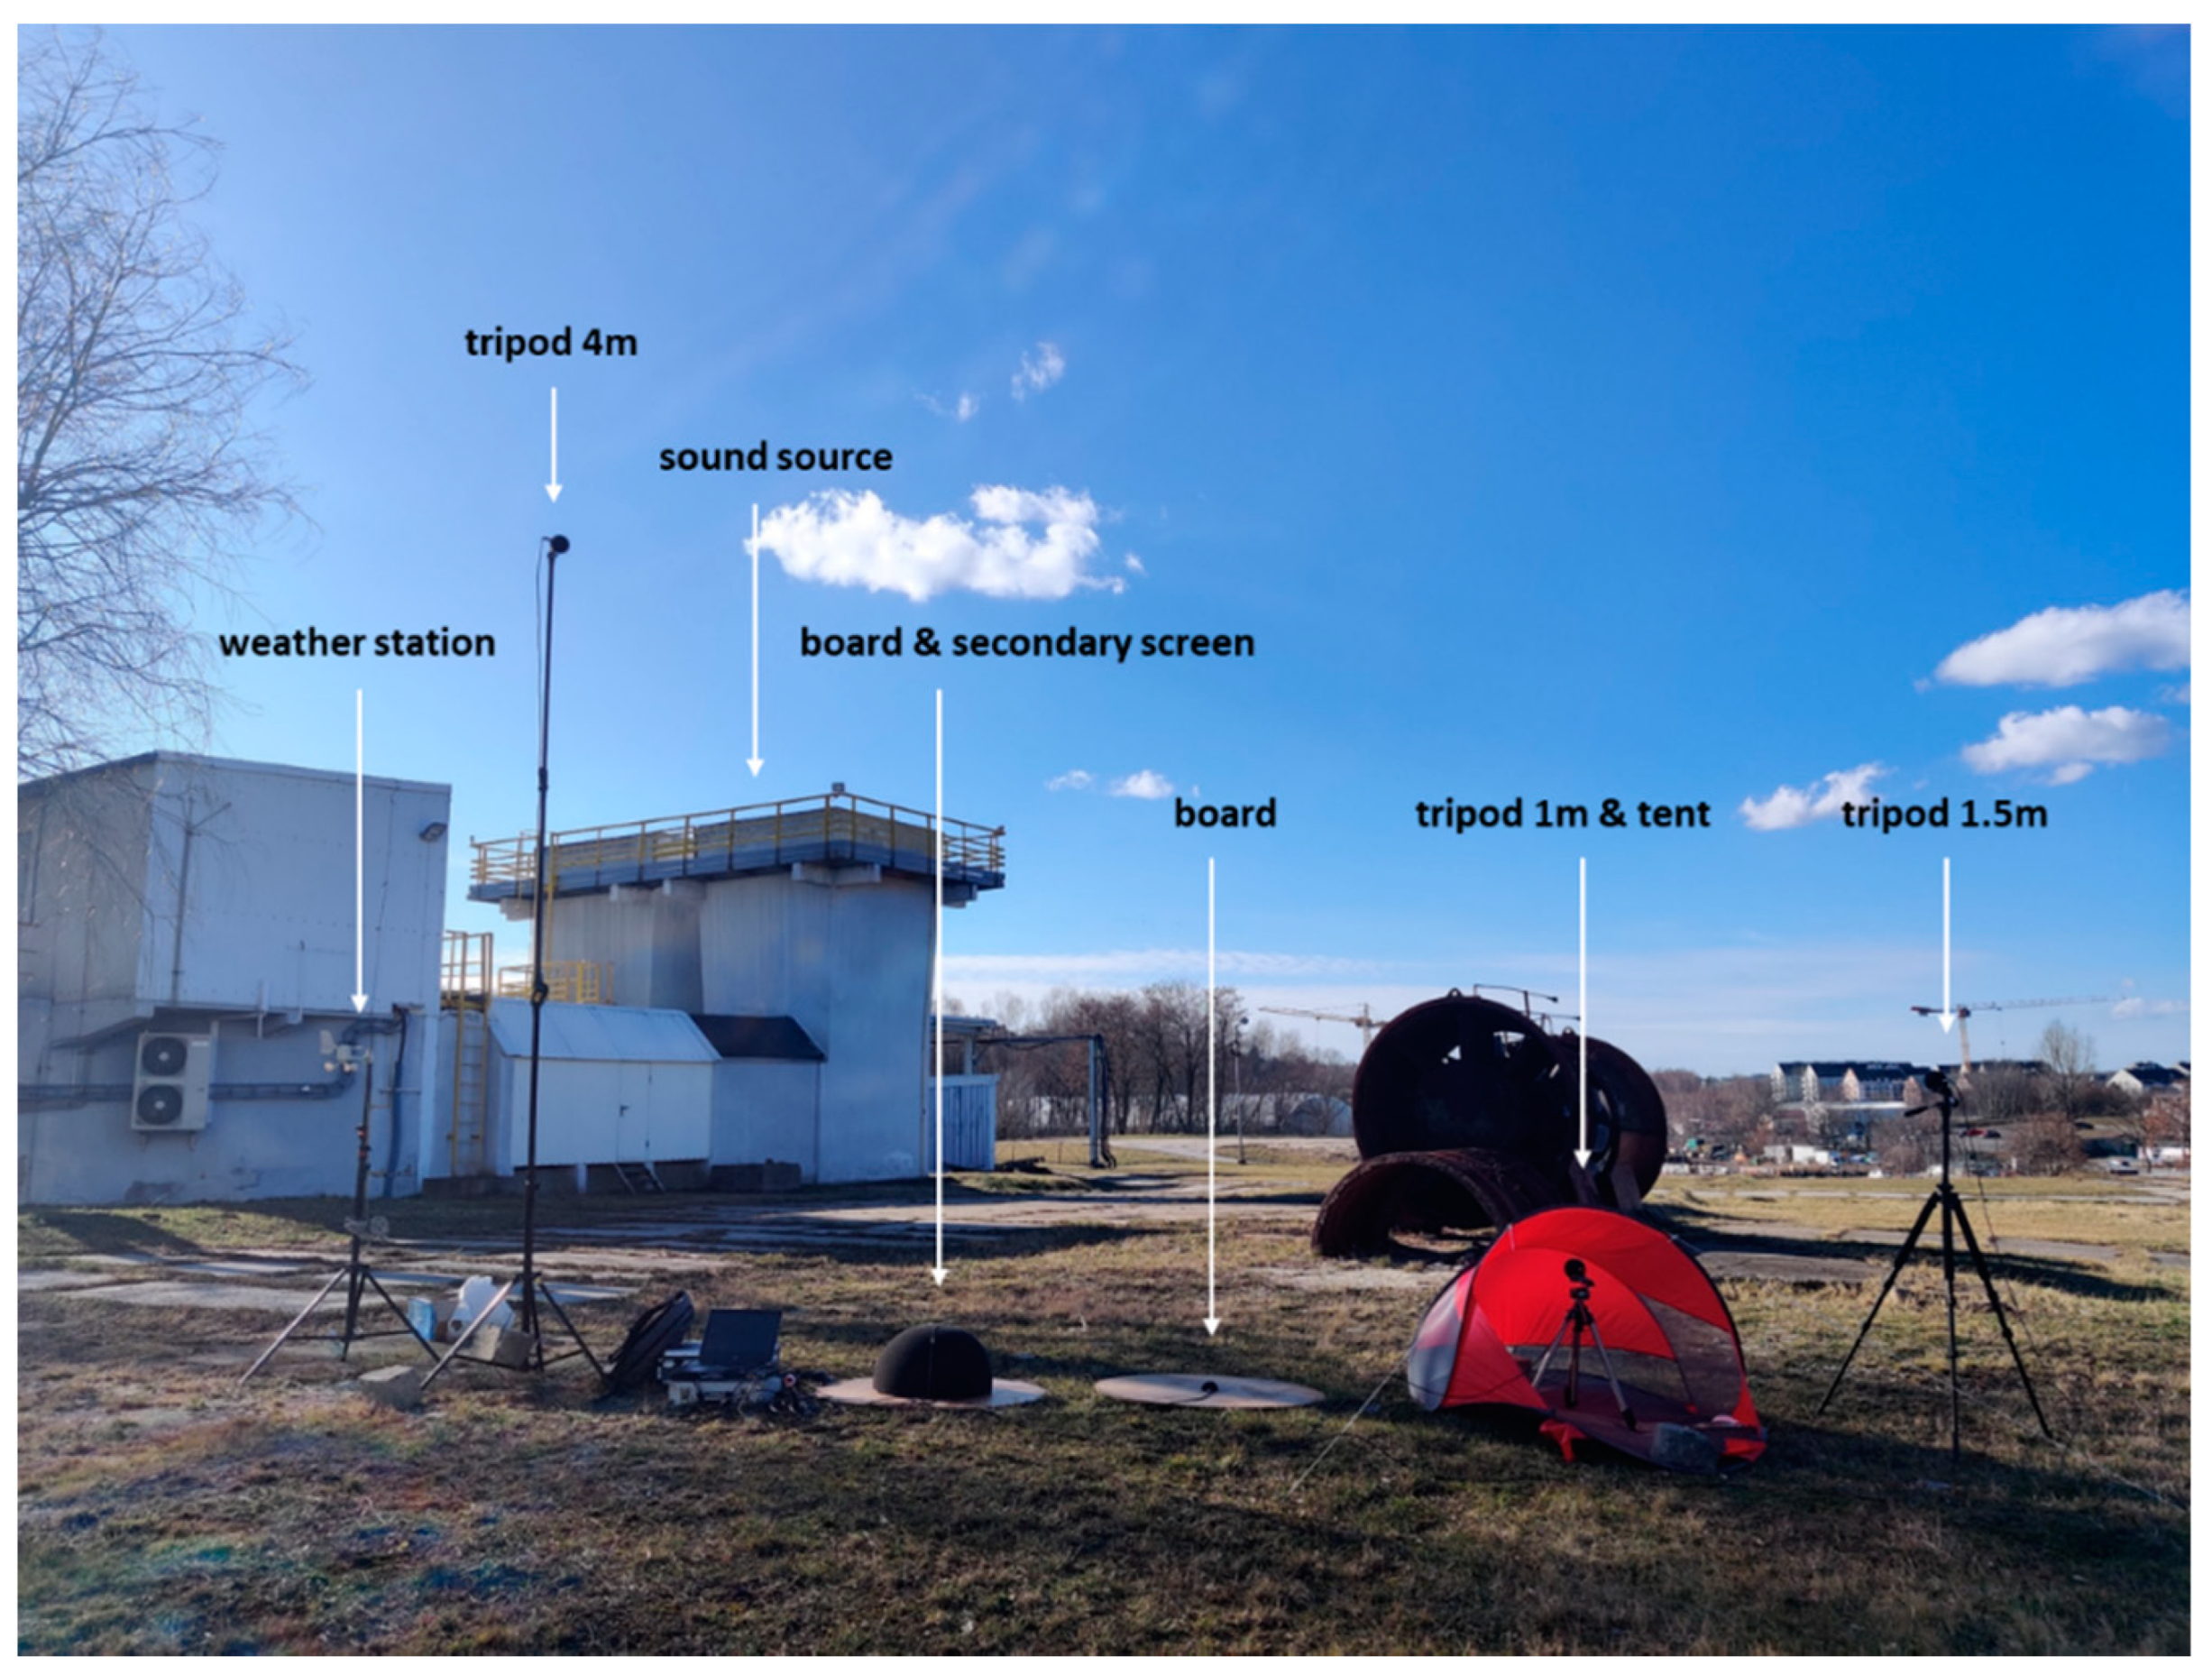
The paper’s primary purpose was the experimental verification of selected windshields in their capability to reduce the disturbance caused by wind in low frequencies. The shields were preselected based on the literature review and expert experience, using commercially available standard shields and a proprietary proposal of the shield with the tent used as the second (additional) windshield. In individual variants, the microphone was placed on the board (acc. to (IEC 61400-11, 2018)) with a single and double shield, at the height of 1.5 m with a single standard shield, and as the second solution with an additional tent used as the second shield, and at the height of 4 m with a single shield.
The verification measurements were made at the source of low-frequency noise–ventilation shaft in windless conditions and at the wind speed of 5 to 7 m/s at the height of 1.5 m. The paper also includes the measurement results, using the same windshields and microphone placement, for the wind turbine noise on the wind farm in Łęki Dukielskie, at varying wind speeds.
The obtained results of the ventilation shaft noise indicate that during windless weather, the spectrum level and shape in the range of over 300 Hz are very similar for all variants of shields and microphone placement. At the 5 m/s wind speed, spectra similarity can be seen only in the band above 20 Hz. Below 20 Hz, the sound pressure levels are increased (in comparison to the windless conditions) for all variants, except the microphone on the board with a double shield (
Figure 7). The comparison of the results on the board with a double shield in windless conditions and at the 5 m/s wind speed indicates a large similarity in the band up to 50 Hz (
Figure 9), that is the frequency range with dominating impact of the fan noise, similar in both measurement sessions. Slight differences of levels at the 5 m/s wind speed (in comparison with the windless weather) in 4 and 5 Hz bands (
Figure 9) significantly grow when the wind speed increases to 6.5 m/s (
Figure 11), indicating the deterioration of the attenuating properties of double shield at higher wind speeds.
The results of wind turbine noise measurements indicate similar tendencies–the least wind-induced disturbance in the band up to 25 Hz was measured on the board with a double shield (
Figure 15, average wind speed 2.1 m/s, gusts up to 4.5 m/s), and this tendency strengthens as the wind speed increases to 3.5 m/s with gusts up to 6.7 m/s (
Figure 17).
Similar conclusions can be formulated based on the comparison of the FFT spectra with clearly visible blade-pass frequencies (blade passing by the tower) along with the higher harmonics (
Figure 18). These frequencies are visible only on the spectrum calculated from the results measured on the board. The signals on the remaining spectra (results of the other variants) are strongly masked by the wind disturbance.
The presented results indicate that in all cases the board with a double windshield has the best effectiveness in the reduction of disturbance, however, at higher wind speeds above 5 m/s increased disturbance in the lowest frequency bands can be expected.
It is worthwhile to emphasize that at the height of up to 4 m, the wind above 5 m/s is relatively rare; usually, even at the strong wind at the nacelle height, the wind slightly above the ground level is much weaker. On the other hand, the stronger wind above the ground is the dominating source of noise, masking the turbine noise.
To summarize, it can be said that, in terms of the measurements of the low-frequency wind turbine noise, the best among the tested variants is the placement of the microphone on the board with a secondary windscreen according to IEC 61400-11 standard [
32]. Hence, it is not necessary to use various windshields for the audio band and the infrasound band in acoustic tests of wind turbines. It is worth noting that using only a single windshield can lead to misinterpretation of the results due to poor protection against wind interference in the low-frequency range.
