Article

Numerical Study on Infrared Radiation Characteristics of Stealth Coating for Turbofan Engine Tail Nozzle

1
School of Aeronautical Engineering, Air Force Engineering University, Xi’an 710038, China
2
School of Energy and Power Engineering, Xi’an Jiaotong University, Xi’an 710048, China
3
Department of Thermal Engineering, Hebei Petroleum University of Technology, Chengde 067000, China
*
Author to whom correspondence should be addressed.
Energies 2022, 15(20), 7486; https://doi.org/10.3390/en15207486
Submission received: 28 August 2022 / Revised: 27 September 2022 / Accepted: 29 September 2022 / Published: 11 October 2022
(This article belongs to the Section B: Energy and Environment)

Abstract

:
Infrared stealth technology plays a vital role in improving the survivability of future aircraft. The exhaust system is the main source of infrared radiation on the rear side of the aircraft, and stealth coating is an effective measure to reduce the infrared radiation on the solid wall of the nozzle. Mature commercial computational fluid dynamics software was used to obtain and analyze accurate data of the flow field to study the infrared radiation characteristics of the stealth coating on the turbofan engine nozzle. Furthermore, infrared simulation software based on the reverse Monte Carlo method, line-by-line calculation technique, and database technology for high-temperature gas parameters of a narrowband model were used to numerically simulate the exhaust system of a turbofan engine with infrared suppression coating. Assuming that the damage percentage of the external adjusting plate is constant, the findings reveal that the overall infrared radiation intensity exhibits a steadily increasing trend with the increase in the number of damaged adjusting plates. The maximum change in the infrared radiation intensity between eight damaged adjusting plates and one damaged adjusting plate was 11.67%. Thus, regular inspection and maintenance are required for the stealth coating on the external adjusting plate of the aero-engine tail nozzle to maintain stealth integrity.

1. Introduction

Stealth characteristics are an important feature of new-generation aircraft [1]. The continuous development of infrared detection, tracking, and guidance technologies is creating increasingly stringent requirements for the infrared stealth characteristics of modern aircraft [2]. Considering the infrared radiation intensity of an aircraft, the high-temperature exhaust system and airflow are much higher than the skin radiation, and the radiation energy of the engine is an order of magnitude higher than that of the skin [3]. Thus, the tail nozzle of the aircraft engine is the main source of aircraft infrared radiation and the main target captured by an infrared detector [4].
Several experiments and simulation studies have been conducted in China and worldwide on the infrared radiation states of aircraft, engines, and their wakes, with a focus primarily on the distribution characteristics of their infrared radiation intensity [5,6,7,8,9,10,11,12,13]. Several numerical calculation software for infrared radiation states of air target have been developed abroad [14,15,16], and more detailed mathematical modeling and numerical calculation studies on infrared radiation states of engine exhaust systems have been conducted, with relevant experimental validation also carried out. Chinese domestic research on the numerical calculation of the infrared radiation of engine exhaust systems started late, Jin Jie [17] et al., Zhang Xiaoying [18] et al. and Liu Youhong [19] developed a numerical calculation method to calculate the infrared radiation states of exhaust systems based on closed cavity theory algorithm, and this method is now more widely used in China. Luo Mingdong, Ji Honghu and Huang Wei [20,21,22] have undertaken in-depth research in numerical simulation and experiments on the infrared radiation characteristics of the exhaust system of an aero-engine and have achieved certain results. The infrared radiation of the engine exhaust system can be divided into solid and gas radiation; the former is caused by high-temperature components, such as the tail nozzle, and the latter is caused by high-temperature fuel gas injected at high speed. Scholars have adopted different calculation methods to solve the infrared radiation transfer equation and developed multiple methods to calculate infrared radiation characteristics [23], these include the Monte Carlo method, the reverse Monte Carlo method (RMCM), and the discrete coordinate method. However, little research has been conducted on stealth coating and its post-damage characteristics, and the application of infrared low-emissivity coatings means that this research gap direction urgently needs to be filled.
Based on the infrared radiation characteristics of the engine exhaust system of the low-emissivity coating [24], a simplified model of the engine exhaust system was constructed in this study and the damage location and degree were set based on the derived actual exhaust temperature and emissivity. In addition, based on the actual working conditions, an infrared simulation software, based on the RMCM and line-by-line calculation technology, was used to study the effects of different types of coating damage on the infrared radiation characteristics of the engine exhaust system. Furthermore, a database of high-temperature gas parameters of a narrowband model was employed.

2. Physical Models and Calculation Methods

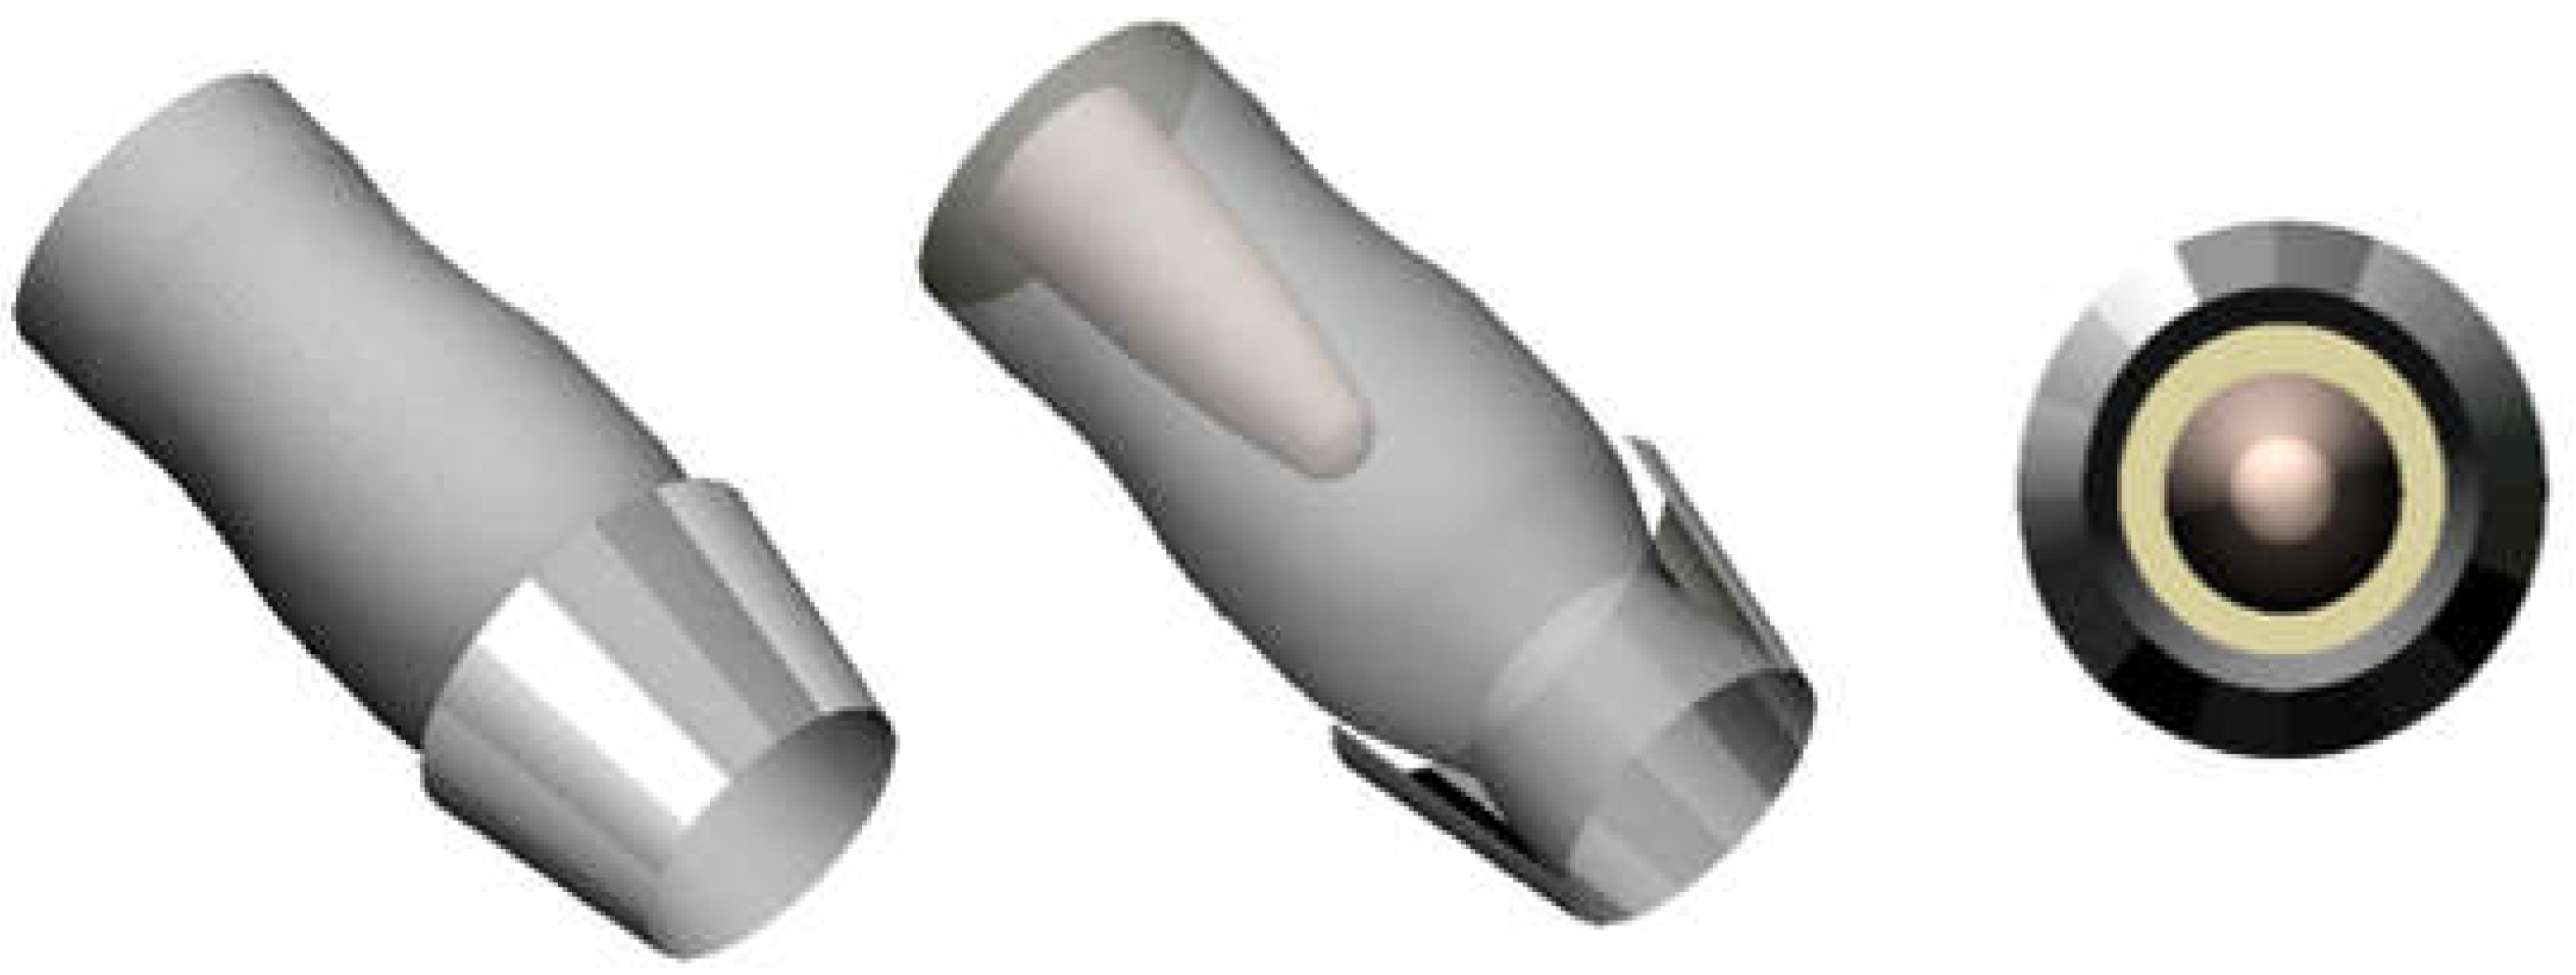
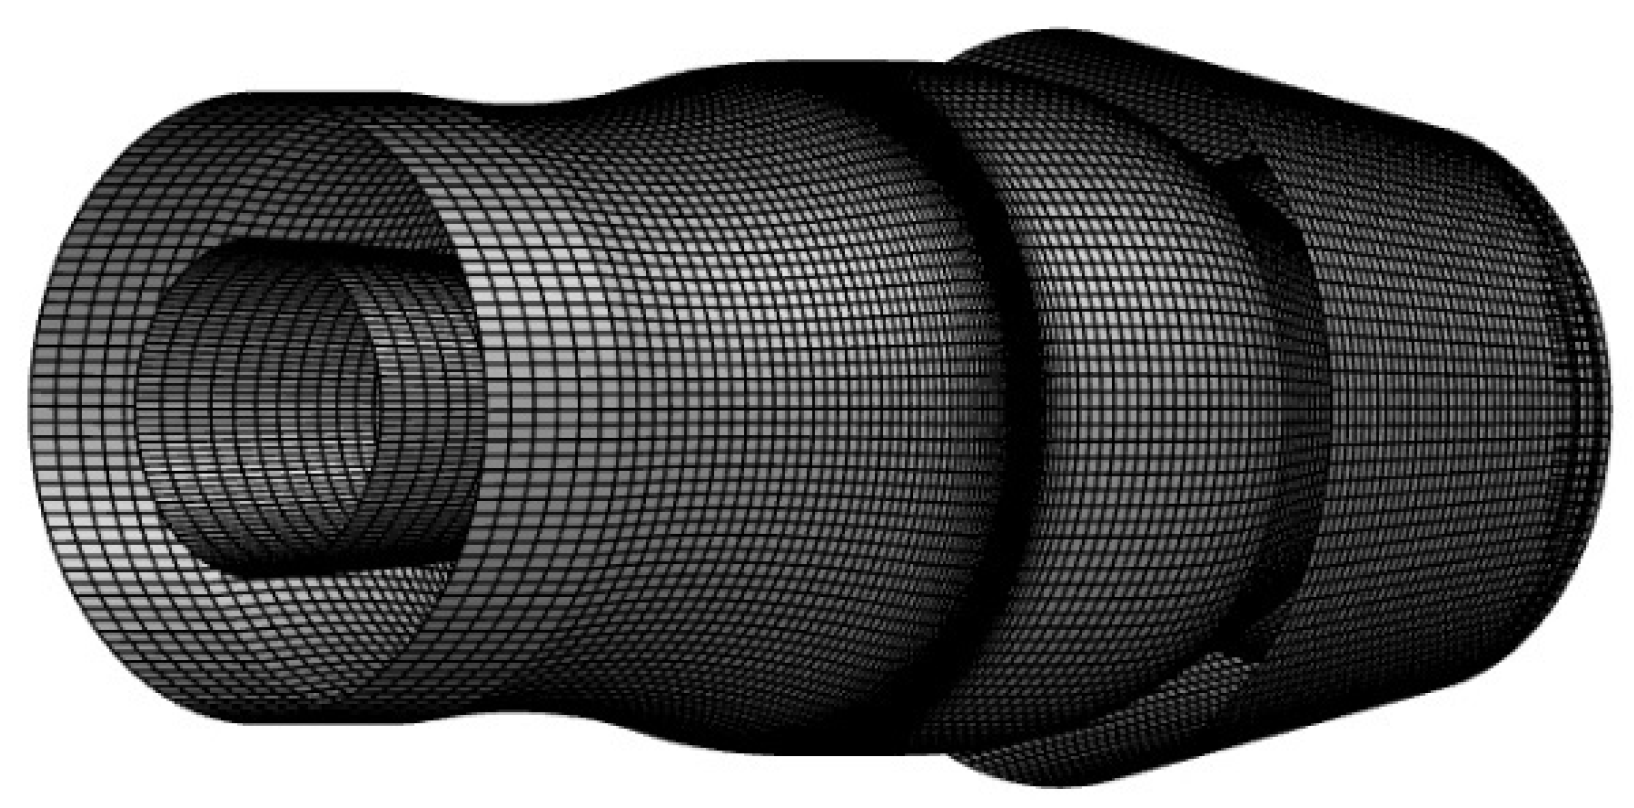
2.1. Physical Models

Each engine has 16 external adjusting plates. A symmetrical simplified exhaust system model was established (as shown in Figure 1) with reference to the actual engine to reduce the calculation workload. The model consists of a central cone, an afterburner, a contraction section, an expansion section, and internal and external adjusting plates. The complex internal structure of the components significantly affects the flow field distribution in the nozzle, thereby changing the distribution of temperature, pressure, and component concentration, thus affecting the radiation characteristics of the wall and gas flow. The geometrically simplified model of the nozzle is presented in Figure 1.

2.2. Flow Field Calculation Method and Boundary Condition Setting

The solid wall of the exhaust nozzle of the turbofan engine and the temperature field of the gas ejected from the tail nozzle were derived by performing numerical simulation using the Fluent module of the ANSYS system, which is an important basis for calculating the radiation characteristics. The calculated tail spray pipe model has a diameter of D, a flow field length of 40 D, and a radius of 7 D. The structural meshing was performed, the maximum mesh size for the wall was set to no more than 1/10 of the wall size, and the flame stabilizer was encrypted. To reduce the computational time, a larger grid size with symmetric grid was used for other areas. The final grid size was 4.7 million, as shown in Figure 2. The specific boundary conditions were set as follows. After the nozzle inlet was set as the mixer, the inlet was set as the pressure inlet, where the inlet pressure was 162,008 Pa, and the total temperature was 1051 K. The external field boundary was set as the pressure far-field boundary, the total temperature was 295 K, and the pressure was set as 96,008 Pa. The wall thickness of the nozzle was 1 mm. Steel was used as the raw material, and the body color was gray. Considering the heat transfer effect, each solid wall was installed as a fluid–solid coupling surface to obtain the surface temperature distribution of the nozzle inner wall accurately.
The density-based implicit solution was chosen, the turbulence model was the RNG k-ε model, and the wall function was the standard wall. The boundary conditions for the pressure far field require the gas type to be a compressible ideal gas. The solution was calculated in first-order windward format. The calculation was considered converged when the residuals were less than 0.001 and the mass flow rate of each component reached conservation.
Owing to the absorption, emission, and scattering characteristics of fuel gas, infrared radiation intensity primarily hinges on such parameters as temperature, pressure, carbon dioxide concentrations, water vapor, and other components. Thus, the concentration distributions of various gas compositions were predicted and calculated using a gas transport equation based on CFD software. Assuming that the inlet gas of the nozzle is completely combusted gas, the volume percentages of carbon dioxide, carbon monoxide, and water vapor were 0.0718, 0.0001, and 0.0294, respectively. The ambient composition was air, i.e., the nitrogen and oxygen amounts were 0.79 and 0.21.

2.3. Infrared Radiation Calculation Method

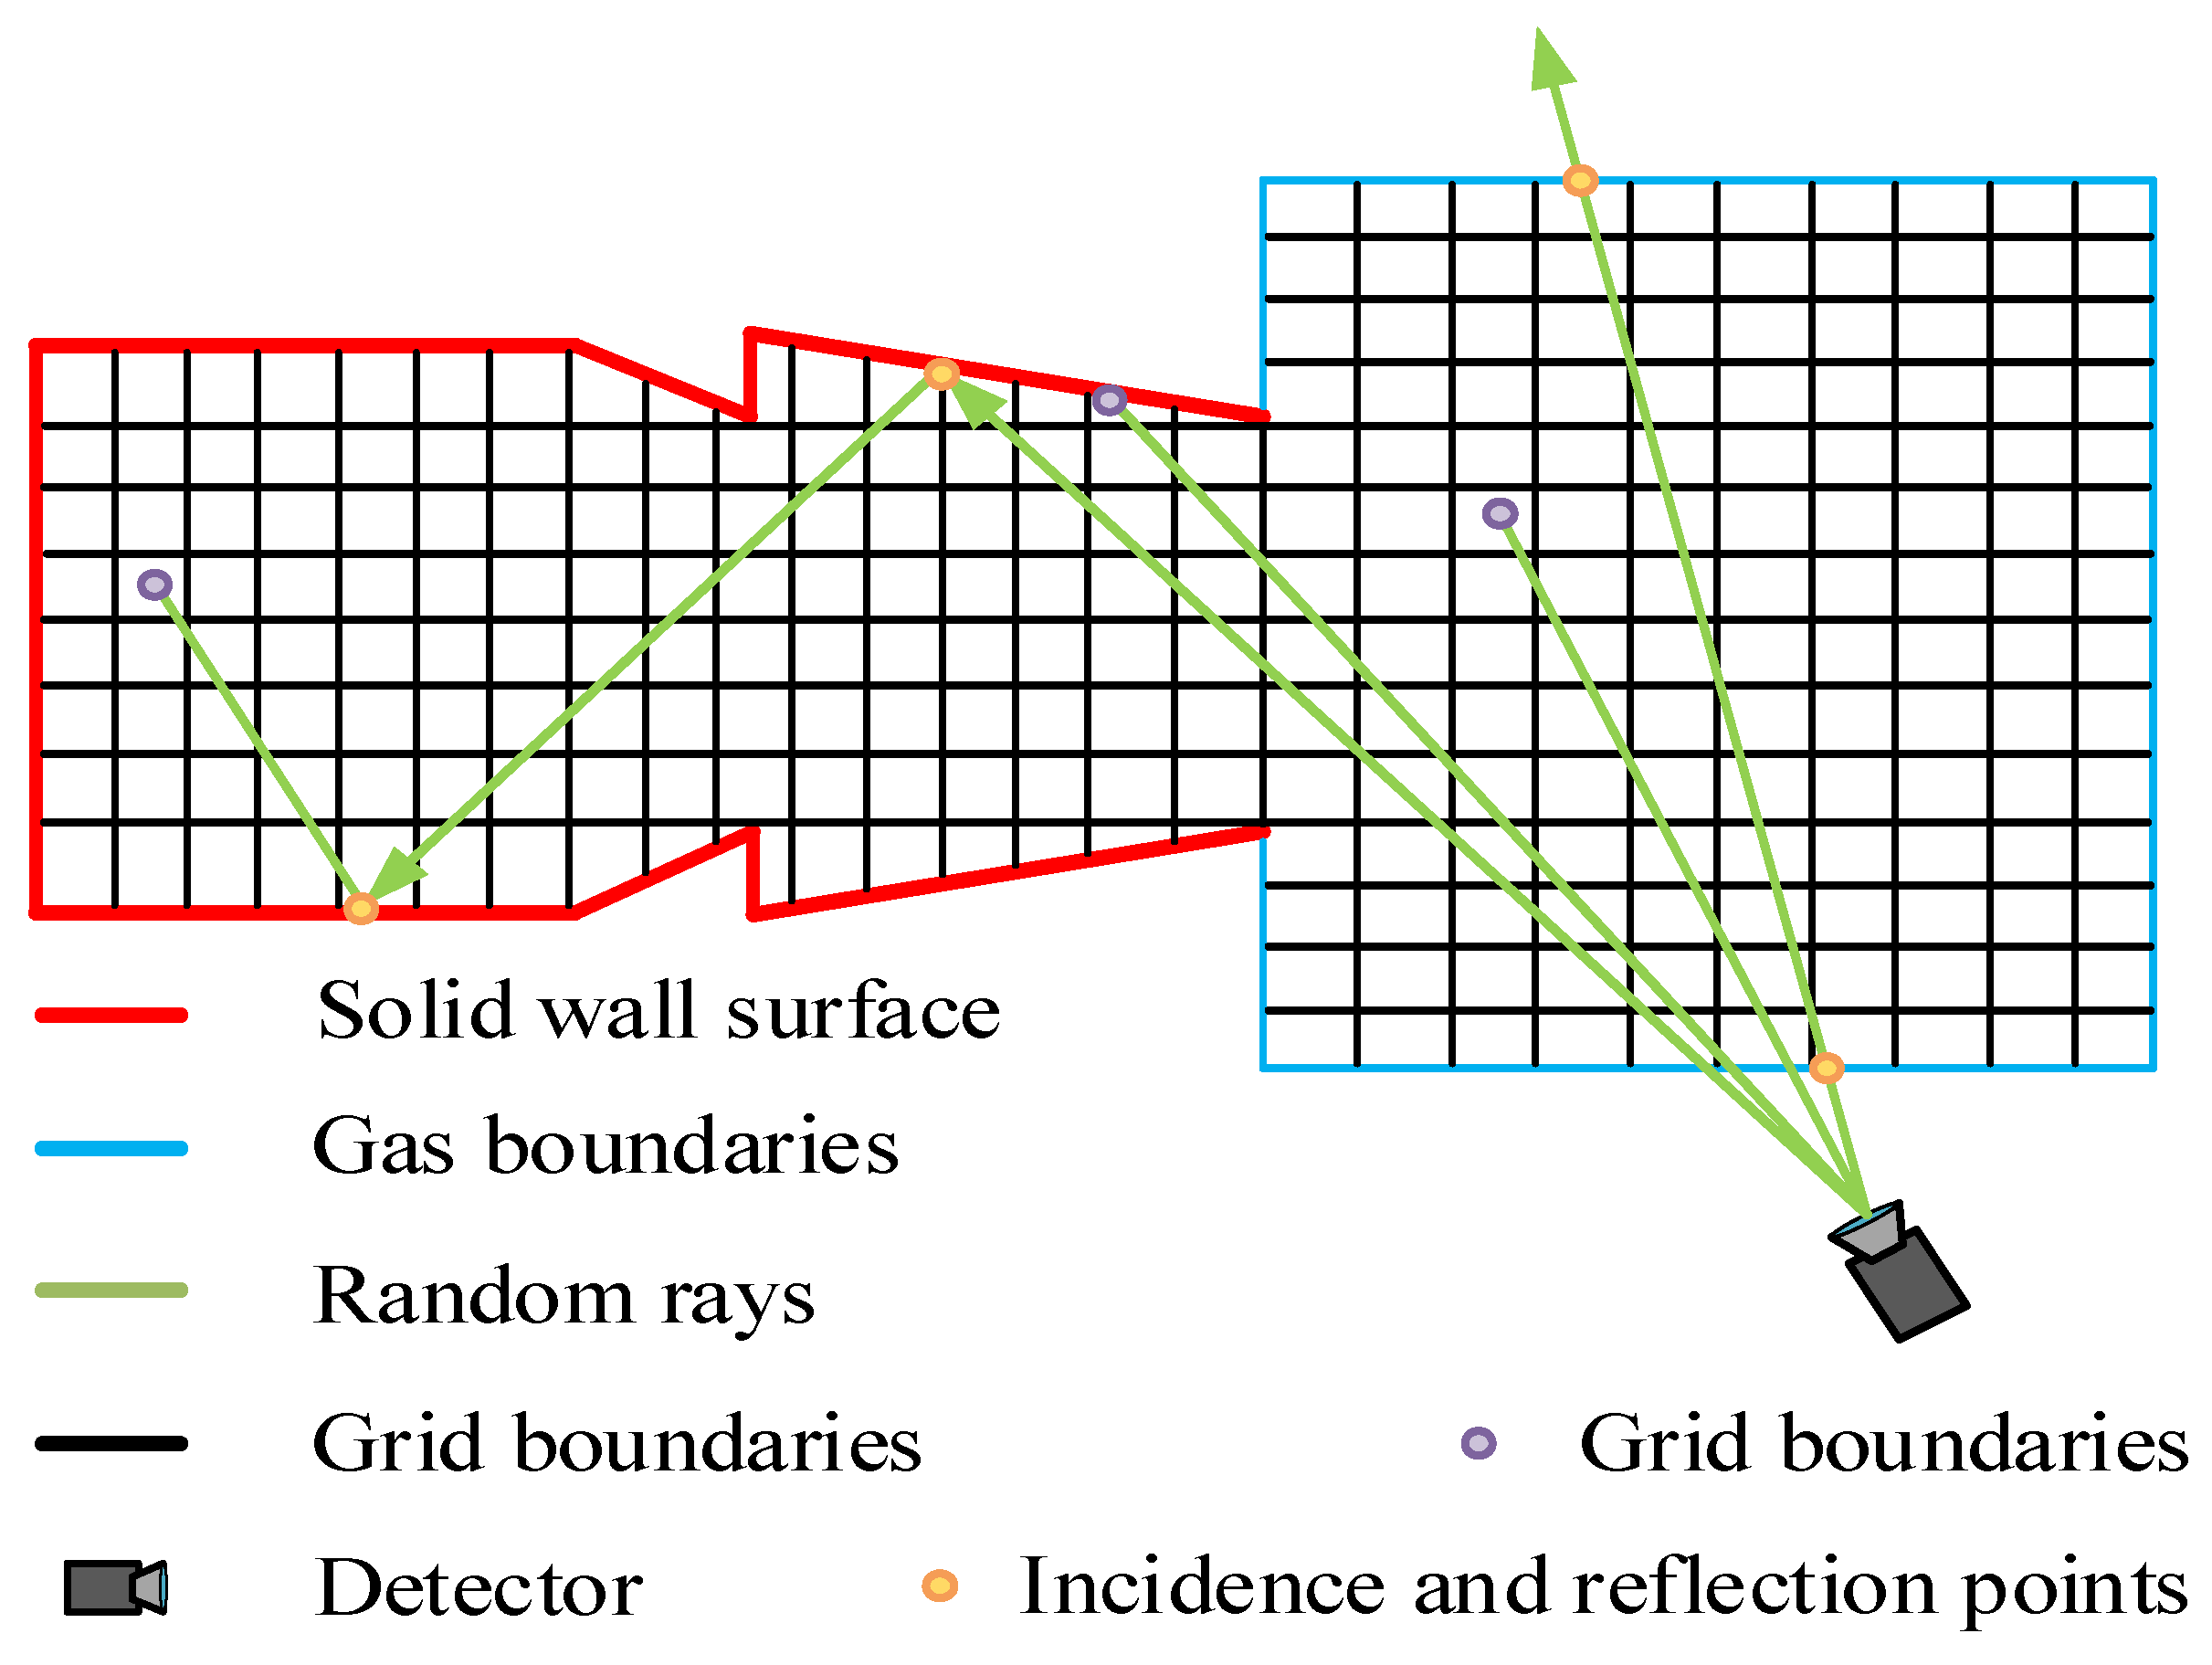
  • Reverse Monte Carlo Method.
This study adopted the RMCM for infrared calculation. When addressing radiation transmission problems, radiation is considered to comprise independent rays and a series of radiation transmission problems decomposed into a series of sub-processes, such as emission, reflection, absorption, and scattering [25]. The emission and transmission process of each ray in the system is determined by a series of random numbers and probability density functions. After tracking a large number of rays, stable statistical results can be obtained.
(1)
Calculation formula of target radiation intensity.
The RMCM does not entail the discretization of the incident solid angle. Corresponding to the emitted ray in the solid angle space and using the probability density function to determine the absorption point of the ray [26], this method can identify the actual radiation source, thereby replacing the realistic radiation source. The radiation intensity calculation equation is
H λ = i = 1 N ( L b λ ( i ) cos θ i / N ) Ω d
In the aforementioned equation, the spectral radiation intensity of the black body is described at the random ray absorption point to describe the angle between it and the method line of the detection surface. When the detection point is far from the target, Equation (1) can be written as
H λ = Ω d i = 1 N L b λ ( i ) / N
Bringing Equation (2) into the radiation intensity calculation equation, the expression of spectral radiation intensity at the measurement point can be obtained:
L λ = A d i = 1 N L b λ ( i ) / N
After using the narrowband model, the above equation can be rewritten into a numerical form:
I = A d Δ λ / N i = 1 N j = 1 M L b λ ( i , λ j )
(2)
Backtracking of random rays.
When Equation (4) is used to calculate the target radiation intensity, it is necessary to emit N rays from any machine at the solid angle of the field of view. Normally, the direction of the random rays can be determined according to the probability density function, and it is not necessary to discretize the solid angle of the field of view. However, to adapt to the infrared imaging simulation, the method shown in Figure 3 was adopted to determine the direction of random rays. The coordinates in the local coordinate system of the pixel plane can be detected using the following calculation:
X r = R x L + X c ,   Y r = R y L + Y c ,   Z = 0
When the direction of the random ray is determined, it can be traced backward, such as the random ray shown in Figure 3.
Ray tracing in the specific control body can start once the ray enters the computational domain grid. The average transmittance of the spectral band in a specific control body can be calculated by interpolation according to the travel length of the ray in the control body, as well as the local temperature, pressure, and infrared active components of the control body. Using the gas composition database, the spectral absorption rate of the control body is obtained. The equation is
α k ( λ ) = 1 τ k ( λ )
First, the entry point of the ray entering the calculation area should be determined in the calculation area. Simultaneously, in the CFD grid system, the surface unit that intersects with the ray can be subjected to a full-disk search [27]. If no surface element intersects with the ray, the ray has no intersection with the calculation area, indicating that the random ray does not contribute to the radiation of the detection point. If such a surface element is searched, the surface element becomes the position where the random ray enters the calculation area.
According to the spectroscopic theory, the absorption coefficient κ η for a single spectral line with a central wave number η 0 is calculated as
κ η = S F ( η η 0 )
where η is the wave number, η 0 is the central wave number of the spectral line, S is the spectral line intensity, and F ( η η 0 ) is the normalized spectral line shape function.
For a real gas, the absorption lines are not isolated from each other in its absorption band, but always partially overlap, and theoretically each spectral line has an effect on the emission and absorption at any wave number position. Therefore, according to the principle of the line-by-line method, the spectral absorption coefficient κ η of the actual gas at wave number η is equal to the sum of the absorption coefficients of all spectral lines at that wave number.
κ η = i κ η i = i S i F ( η η 0 i )
where κ η i is the absorption coefficient of the spectral line i at wave number η , F ( η η 0 ) is the normalized line function of the spectral line i ; η 0 i is the wave number at the center of the first i spectral line, S i is the absorption coefficient of the spectral line, and i is the line intensity of the spectral line.
From the description of the line-by-line calculation above, it can be seen that to obtain the exact spectral absorption coefficient of a gas at wave number η , it is necessary to consider all the spectral lines that have an influence here, i.e., to calculate the contribution of all the spectral lines to the spectral absorption coefficient κ η at that point line-by-line.
Gas molecules often include thousands of spectral lines, and the calculation is quite large if all of them are taken into account. From the line profile of the spectral lines, it can be seen that the absorption capacity decays rapidly as the spectral line wings extend to the sides, and when extended far enough, the effect is already relatively small and negligible. In addition, a variety of spectral line functions of the description of the far-wing spectrum may contain some kind of error, so it is important to take time to calculate the far-wing contribution. In practice, line wing truncation is often used to improve the efficiency of the calculation, i.e., only the contribution of spectral lines located within a certain range of the calculated wave number are considered. In this paper, equal wave number truncation was used, i.e., only the influence of spectral lines within a range of 10–30 wave numbers on both sides of the center of the spectral line were considered. For convenience, the specific value of the wave number range in the calculation was used as the input parameter of the program. The detailed spectral characteristics of each spectral line of a gas molecule, including the spectral line position, spectral line intensity, spectral line half-width, spectral line jump low state energy and a series of other parameters, were required for the line-by-line calculation study. The molecular spectral line library used for the line-by-line calculation study in this paper was HITEMP version 2010.
2.
Narrowband Model Parameter Library.
Generally, this method can reflect the radiation characteristics of the gas in a wide spectrum more quickly and accurately and can effectively describe the spectral band model [28]. Using the narrow spectral band model to obtain the average transmittance of the spectral band, it is necessary to establish the spectral band model parameter data of the spectral parameters that change with temperature and wavenumber. The infrared calculation in this study was based on the HITEMP2010 high-resolution molecular spectrum database, and the parameter library of the narrowband model was constructed by theoretical calculation. The band average transmittance for the central wavenumber is
τ η ¯ X = exp 2 γ ¯ d ¯ 1 + X k ¯ d ¯ γ ¯ 1 / 2 1
When analyzing different infrared active components, such as H2O, CO2, and other components in the high-temperature gas of the aircraft engine exhaust system, it is necessary to fully consider the impact of the broadening effect on the radiation performance of the infrared activity [29]. The empirical equations for the average half-width of the spectral line of infrared reactive gases are
γ C O 2 ¯ = P P 0 T 0 T 0.7 0.07 C C O 2 + 0.058 0.058 C C O 2 + C H 2 O + 0.1 C H 2 O
γ H 2 O ¯ = P P 0 0.462 C H 2 O T 0 T + T 0 0.5 0.079 1 C H 2 O T 0.5 T 0 0.5 0.027 C C O 2 + 0.036 C O 2 T 0.5
γ C O ¯ = P P 0 0.075 C C O 2 T 0 T 0.6 + 0.12 C H 2 O T 0 T 0.82 + 0..06 T 0 T 0.7 1 C C O 2 C O 2
In the HITEMP database, the optical spectral parameters were given, and the average absorption coefficient of the spectral band was solved using the numerical averaging method of spectral line parameters.
k ¯ = 1 Δ η i = 1 N S i
where N denotes the number of spectrum lines in the spectrum interval, Δ η denotes the wavenumber interval of the band interval, and S i denotes the intensity of the ith spectral line in the band. The band model approach divides the spectral interval to be calculated into many spectral bands. In each spectral band interval, the Planck function can be approximated as a constant because its variation is much smoother compared with the variation of the absorption coefficient. Therefore, the average transmittance of the spectral bands can be used to calculate the average radiation brightness of the spectral bands, and then solve for the total radiation intensity.

3. Calculation Results and Analysis

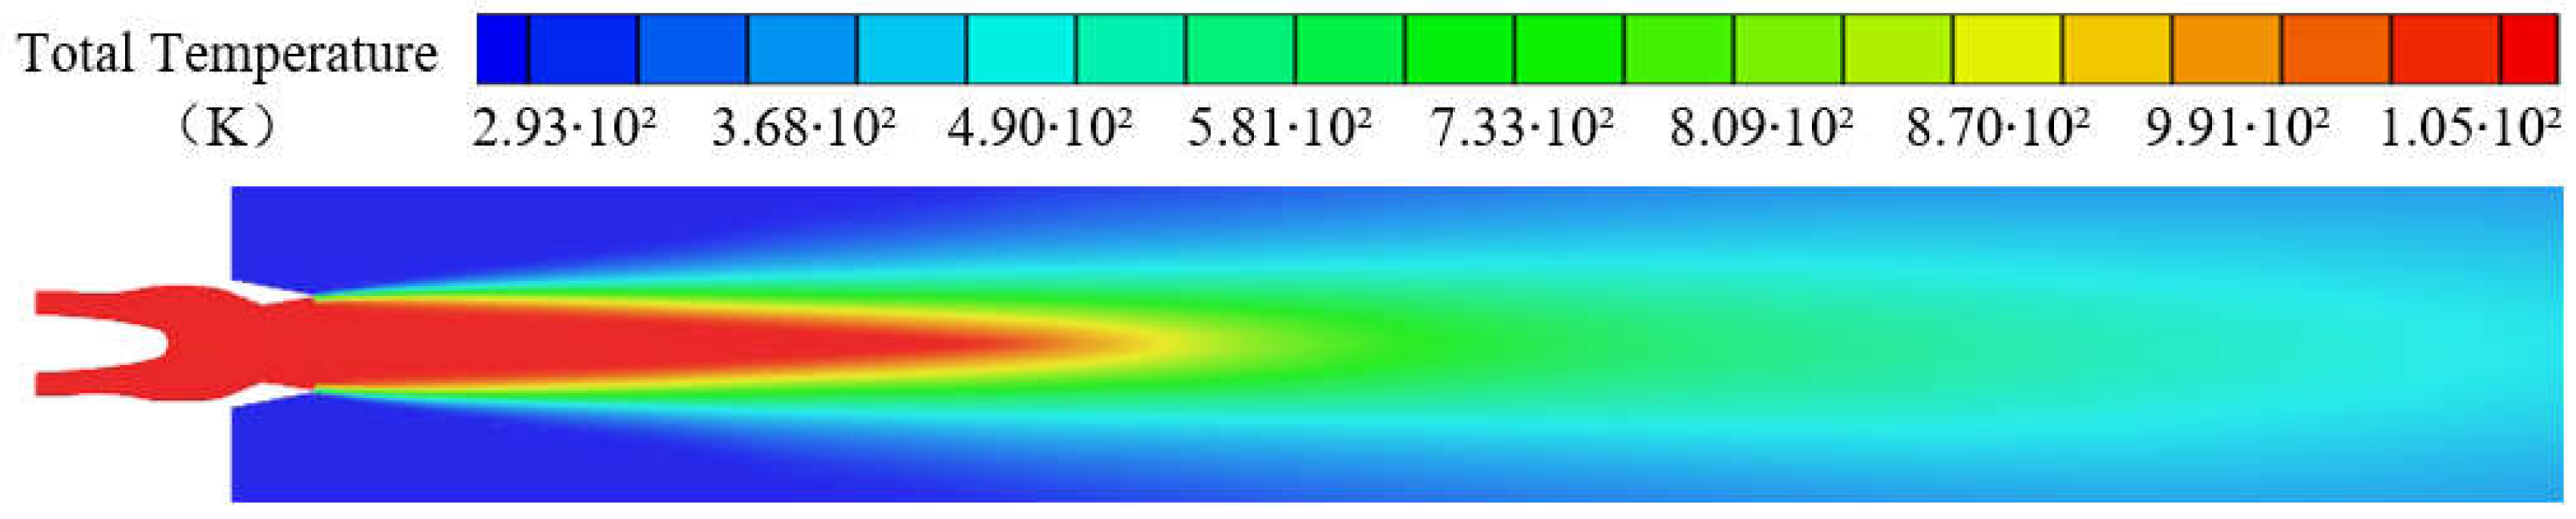
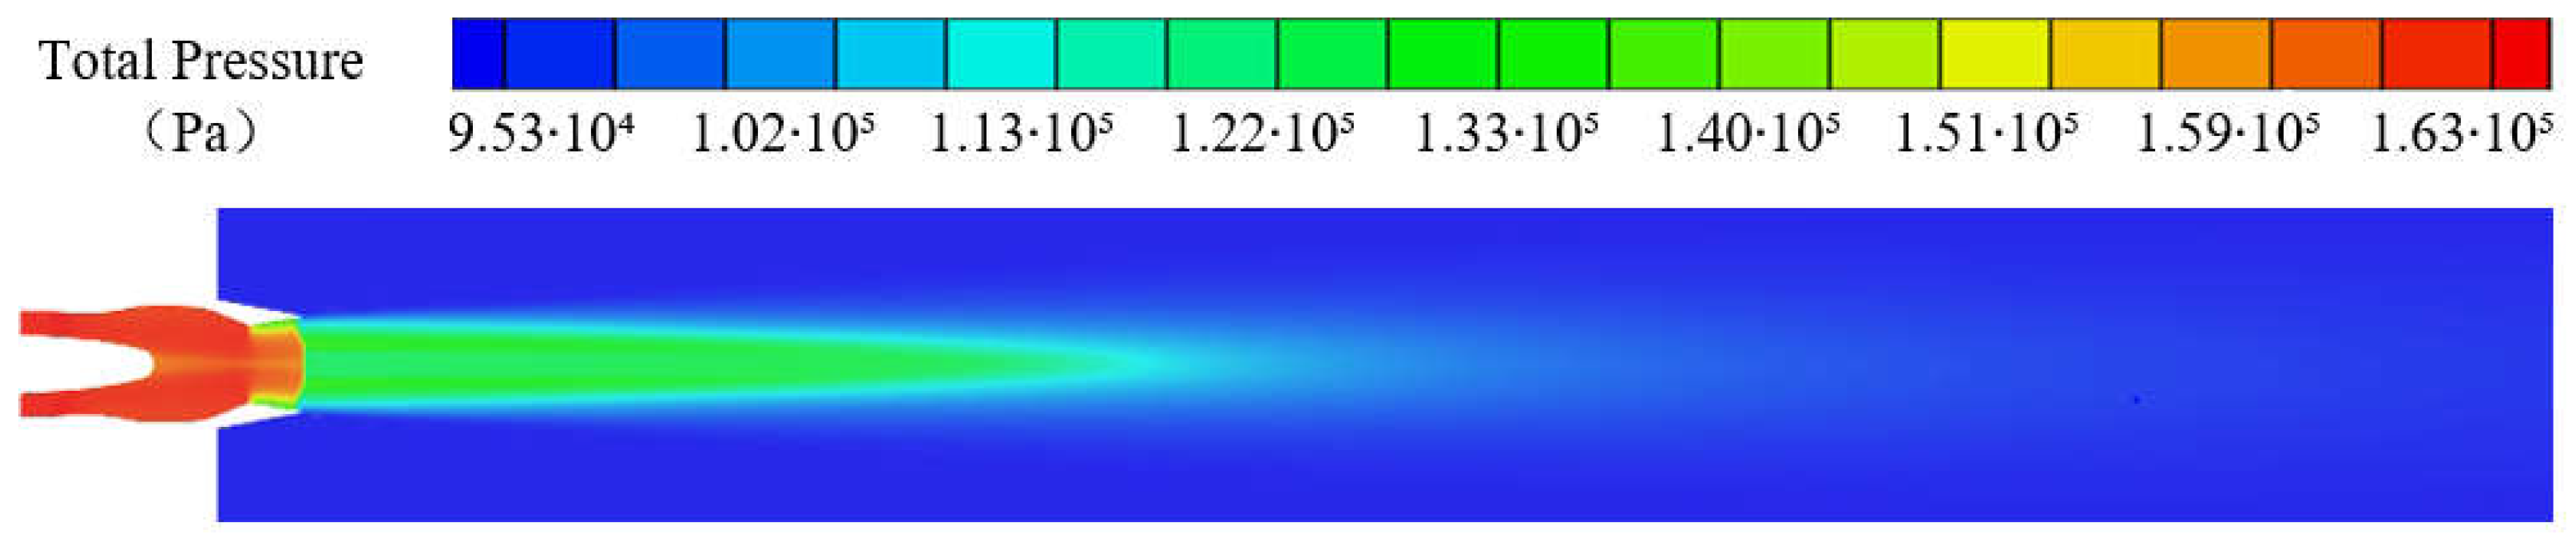
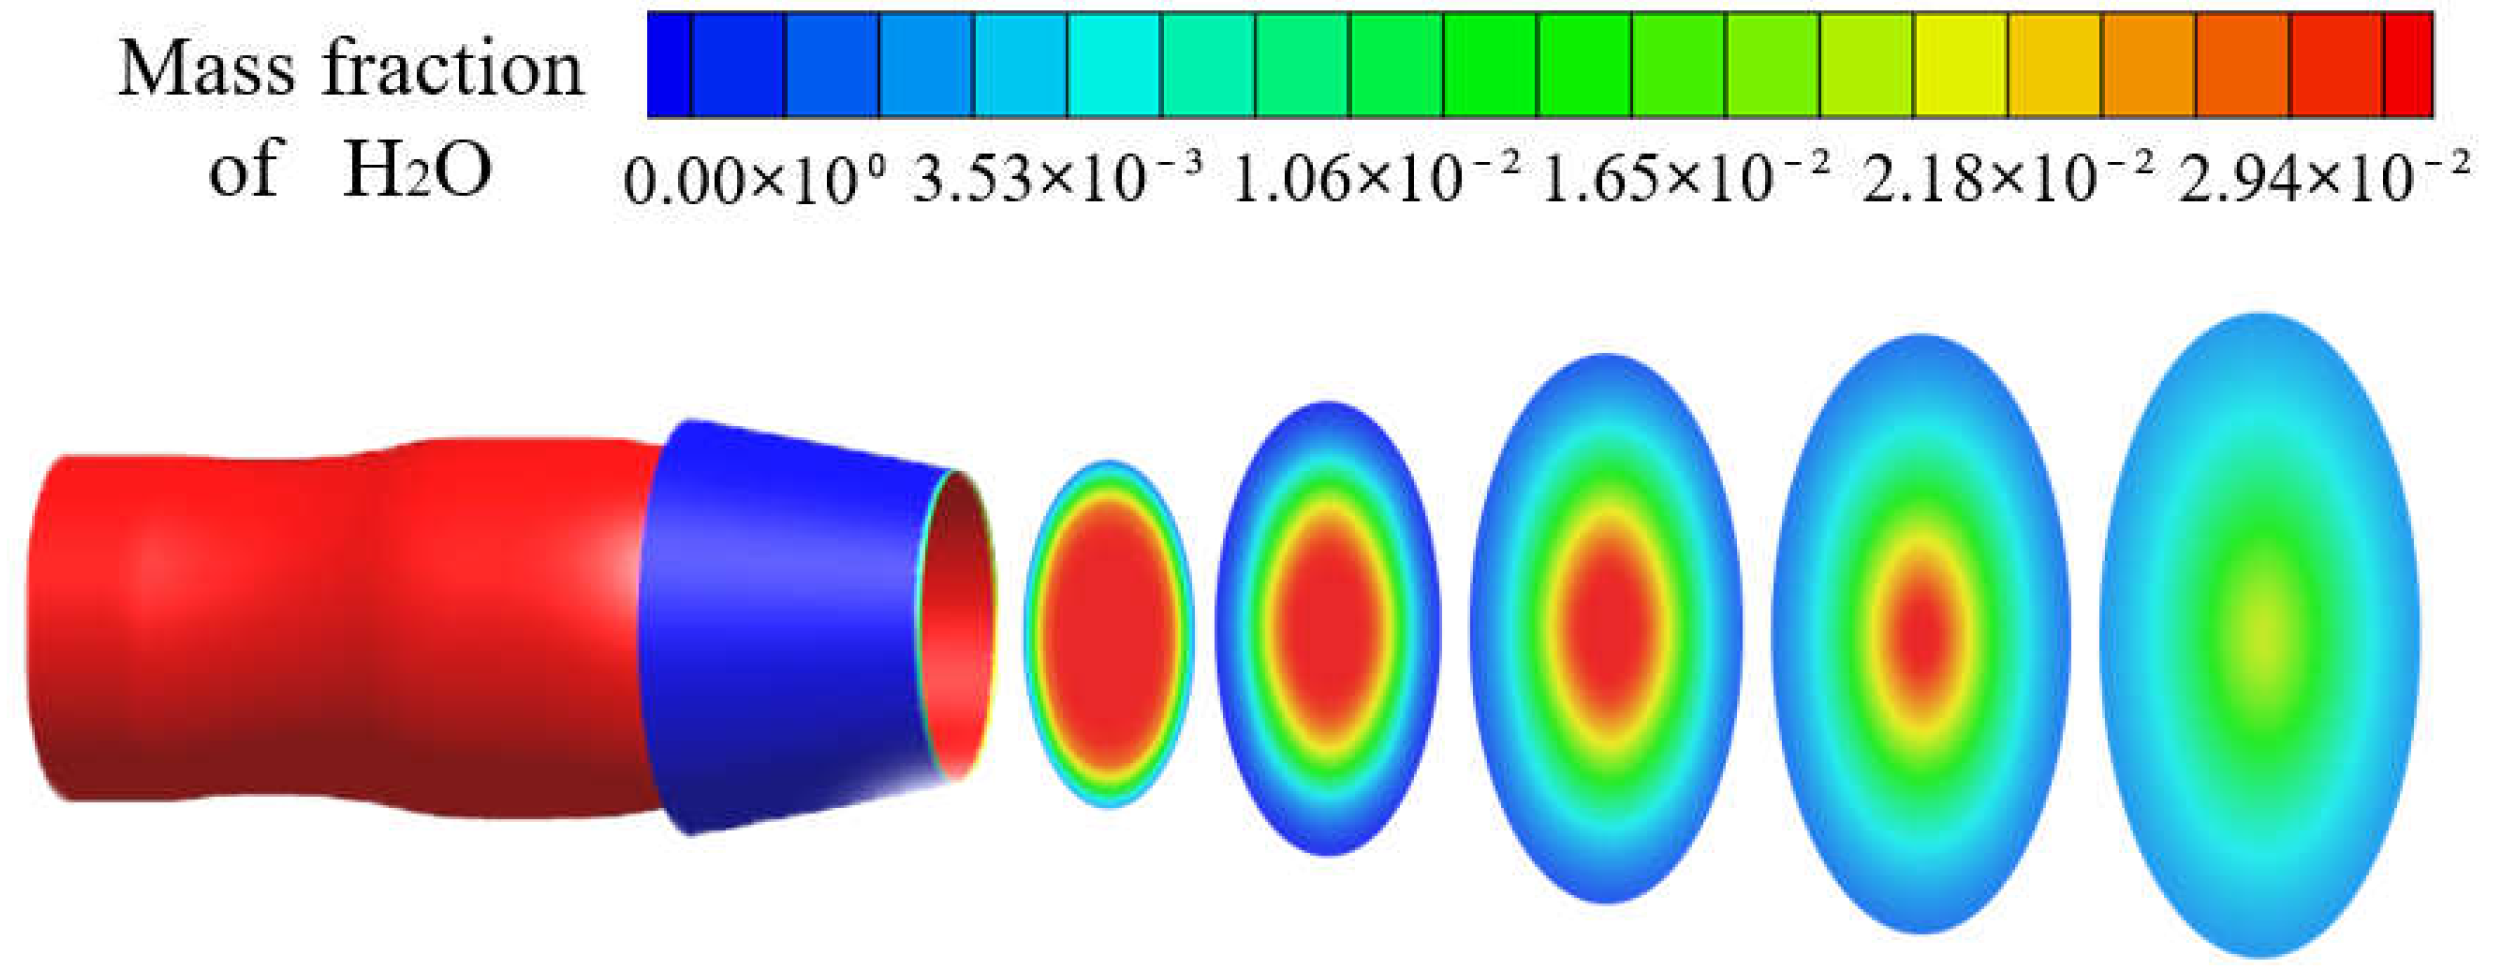
3.1. Flow Field Calculation Results

In Figure 4, Figure 5 and Figure 6, the cloud charts of the total temperature, Mach number, and total pressure on the symmetry plane of the calculation area are derived.
Considering the cloud charts obtained by the calculation, the main heat source of the aero-engine tail nozzle is the high-temperature tail flame ejected from the tail nozzle. Concurrently, according to the Mach number and the total pressure cloud chart, the gas flow gradually accelerates in the convergent section and reaches the speed of sound at the throat position. Owing to the three-dimensional flow pipeline effect, the sonic surface is a circular arc surface that protrudes in the rearward direction. Then, the gas flow continues to accelerate to supersonic speed in the expansion section, inducing the expansion wave system, and the expansion waves continue to reflect and intersect in the tube. When the gas flow reaches the nozzle position, it is in a state of slight overexpansion, which induces a compression wave system and forms a local high-Mach-number area. The maximum Mach reaches approximately 1.77.
The local high-Mach-number area also significantly impacts the intensity of infrared radiation. The mass fraction field distribution of CO2 and H2O was considered for analysis, and the concentration field distribution of components was intercepted at multiple distance interfaces behind the nozzle. The distribution trend of the mass fraction field of the remaining infrared active components is similar, and thus the trend was not analyzed. The distribution of CO2 components is consistent with that of temperature as shown in Figure 7. Mixed by the mixer, the inner and outer air mixers are basically the same. Their concentration is the largest near the center of the nozzle, and the concentration gradually decreases farther from the center. With continuous mixing of the tail jet and outside atmosphere, the high-concentration core area continues to decrease. The distribution of the H2O mass fraction field is similar as shown in Figure 8.

3.2. Infrared Simulation Calculation Results

The flow field data calculated with the nozzle model were imported into the infrared simulation calculation software for infrared radiation calculation. The nozzle wall was coated with a low-emissivity coating. The emissivity of the intact part of the coating was 0.3, and that of the damaged part was 0.8. The calculation condition was set to the ground, and the detection distance from the target was 5 km. As the infrared radiation of the external adjusting plates of the nozzle was studied primarily, the wavebands to be considered during the calculation were 3–5 and 8–14 μm.
When the aircraft flight Ma number is low (such as Ma < 1.2), the engine thermal components and high-temperature tail jet radiation plays a dominant role, and its contribution to aircraft infrared radiation reaches more than 90% in the 3~5 μm radiation band, which is the main object of infrared heat-seeking weapons detection. In the case of Ma > 1.2, the peak radiation of the aircraft envelope is just in the 8~14 μm band and because the envelope area is very large, its infrared radiation magnitude cannot be ignored [30,31,32,33,34].
In the calculation example, there were 16 external adjusting plates of the engine nozzle, which were placed and numbered according to the calculation coordinate system. This was convenient for the setting of working conditions for simulation calculations in the later stage, as shown in Figure 9.
The xz-plane and xy-plane were defined as the horizontal and vertical detection planes, respectively. The calculated angle was located in the horizontal detection plane, where the direct backward direction of the nozzle outlet was defined as 0°, and 19 measuring points were selected.
Considering every 5° as an azimuth angle from 0° to 90°, the infrared radiation intensity of the nozzle was detected as shown in Figure 10. In this setup, 16 adjusting plates outside the nozzle were evenly distributed in an annular shape in four quadrants. Thus, the corresponding law can be derived by calculating the data of only one quadrant.
To evaluate the impact of the damaged area, number, and position of the adjusting plate on the infrared radiation intensity of the exhaust system, the damage was set as follows. The damage location of a single adjusting plate was randomly distributed in the areas of 20%, 40%, 60%, and 80%. The number of damaged adjusting plates was set to be 1, 2, 3, 4, 5, 6, 7, and 8. The positions of the damaged adjusting plates were arranged and combined according to possible situations, and the left half area was set considering occlusion.
To simulate the actual situation, the skin damage form was set as random in the calculations, as shown in Figure 11. In order to more realistically simulate the real conditions, envelope damage form in the calculation was set to random damage. Using the Monte Carlo method to increase the randomness of the calculation, and according to the damage percentage, the brighter colors indicate that the damage percentage is higher. The color intensity indicates the damage percentage, the closer the color is to red, the higher the percentage of damage.
Previous research conclusions indicate that the infrared radiation in the 3–5 μm band primarily comes from the high-temperature wall inside the exhaust system, while the temperature of the external adjusting plate of the tail nozzle is far lower than that of the inner wall. Thus, the infrared radiation is primarily concentrated in the 8–14 μm band, while the infrared radiation of the high-temperature tail jet covers two bands, generating a more complicated impact on the infrared radiation in the two bands. Hence, it is necessary to compare the simulation results in the two bands. The infrared imaging simulation results in the 3–5-μm band of the four detection points were selected for analysis. Figure 12 presents the damage of adjusting plates 1 and 4 at a damage degree of 80%, and the rest of the parts are intact.
In the infrared radiation intensity map obtained by simulation calculation, the tail flame part and the inside of the nozzle are highlighted, while the external adjusting plate is less bright owing to its lower temperature. Moreover, the contrast in brightness between the damaged area and areas with intact coating is not significant. Concurrently, because the radiation of the external adjusting plate is not concentrated in the 3–5 μm band, some noise is inevitably present in the external adjusting plate, considering the results obtained by random calculations.
It is necessary to study the calculated data after image analysis. Figure 13 presents a comparison chart of the infrared radiation intensities of adjusting plates 1 and 4 with damage degrees of 20%, 40%, 60%, and 80%. Figure 14 shows a comparison of adjusting plates 4 and 5, 3–6, 2–7, and 1–8—all damaged by 80%.
According to the comparison of the curves, in the 3–5 μm band, the infrared radiation intensity did not change significantly when the adjusting plates were damaged at the same position with varying degrees of damage or damaged to the same degree at the same position but in different numbers because the infrared radiation of the external adjusting plates was primarily concentrated in the 8–14-μm band. Hence, numerical research on the infrared radiation characteristics of stealth coatings of turbofan engine tail nozzles has mainly been conducted in this band. The infrared imaging comparison chart of different damage degrees of the fixed adjusting plate was calculated and obtained, with adjusting plates 1 and 4 set to be damaged, while the rest were left intact. The given detector angles are 0°, 30°, 60°, and 90°. The infrared thermal images at various angles are presented in Figure 15, Figure 16, Figure 17 and Figure 18. The color scale in the figure is adaptive to the maximum and minimum values of each image. The unit of radiation brightness is W/(sr·m2).
The comparison indicates that the contrast among varying coating damage degrees is not significant under the working condition of uniform upper and lower thresholds of brightness, while the brightness peak mainly gathers in the core area of the tail jet. As the radiance contrast is not evident, further analysis is required by studying and comparing the radiation intensity curves.
First, a comparison of the radiation intensity curves of different detection points under the condition that adjusting plates 1 and 4 are damaged reveals that the integrated radiation intensity reaches a peak at the 25° detection point and then gradually declines with the increase in the detection angle. With the rise of the damage degree, the infrared radiation intensity exhibits an increasing trend, albeit small, with increments of less than 1%, as shown by the data. Thus, the difference in damage degree has no apparent effect on the overall radiation intensity, as shown in Figure 19.
Second, a comparison was conducted to determine whether the positions of the damaged adjusting plates affect the radiation intensity when two adjusting plates are damaged. The settings of each scheme are as follows. Schemes A, B, C and D entail the damage of adjusting plates 1 and 3, 1 and 5, 1 and 7, and 1 and 8, respectively, considering a damage degree of 80%. The calculation results reveal that, considering the same number of damaged adjusting plates and the same damage percentage, the variation trend of the infrared radiation intensity is not closely related to the position of the adjusting plate if the two damaged external adjusting plates are on the same side. The infrared radiation intensity curve is presented in Figure 20.
Finally, the influence of the number of damaged adjusting plates on the overall infrared radiation intensity of the coating was studied. The calculation results are presented in Figure 21.
Based on previous research, it was learned that the damage of a single adjusting plate has little effect on the overall radiation intensity. Thus, the damage degree of all the adjusting plates was set at 80%. As the number of damaged adjusting plates increases, the overall radiation intensifies and the integral radiation intensity reaches the peak value at the detection point of 25°, then gradually recedes with the increase in the detection angle.
The infrared radiation diagram of the exhaust system reveals that the radiation intensities of the detection points in the direct rear direction and in the direct lateral direction are relatively small because infrared radiation of the engine tail jet is related to the total temperature and the composition of the tail flame gas. Some gas components, such as water and carbon dioxide, absorb infrared radiation from, and emit it to, each other, exerting a complicated influence on the infrared radiation. Nozzle radiation and tail jet radiation, inseparable as a whole, must be considered comprehensively. Nozzle radiation cannot be directly captured by the detector but must be detected after being attenuated in the tail jet. The water and carbon dioxide content is high in gas, while the tail jet radiation is primarily affected by the total temperature, total pressure, and gas composition field distribution.
The calculation and analysis of the flow-field cloud map demonstrated that the central region of the tail jet is relatively long under the working condition in this study. Moreover, the radiation of the tail jet occupies a large proportion of the overall radiation. Both the nozzle and the adjusting plate have a high temperature, yet the effective radiation area is smaller than that of the tail flame gas. Moreover, because of the attenuation of the plume gas, the radiation of the solid wall inside the nozzle is dominant when detected in the direct rear direction. According to the curve, the radiation intensity in the direct rear direction is similar to the direct lateral radiation. The high-temperature wall surface inside the nozzle can be seen near the 25° detection position. Meanwhile, the area of the external adjusting plates in the imaging is larger owing to the azimuth angle. As it is less affected by the mainstream in this direction, the radiation intensity of the tail nozzle system reaches its peak in the angle range of 25–30°.
In the calculations, the damage was set to the same state symmetrically along the xy-plane, and omnidirectional calculation was performed in the horizontal plane (xz-plane), with the results drawn into the angular distribution of infrared radiation, as shown in Figure 22. The curve shape conforms to the characteristics of the “pear-shaped” distribution of turbofan engine nozzles proposed by many scholars, which indicates that the calculation results are overall highly credible.

4. Conclusions

An aircraft tail nozzle model was established, and simulation calculations were conducted using commercial CFD software to obtain relatively accurate flow field data, particularly the infrared active gas component. The accurate flow field data were imported into infrared simulation software—based on the RMCM, line-by-line calculation technique, and database technology for high-temperature gas parameters of the narrowband model—to conduct infrared radiation intensity calculation. The analysis reveals that the simulation results are highly reliable, and the simulation model of the aircraft’s infrared radiation is credible. The main conclusions are as follows.
(1)
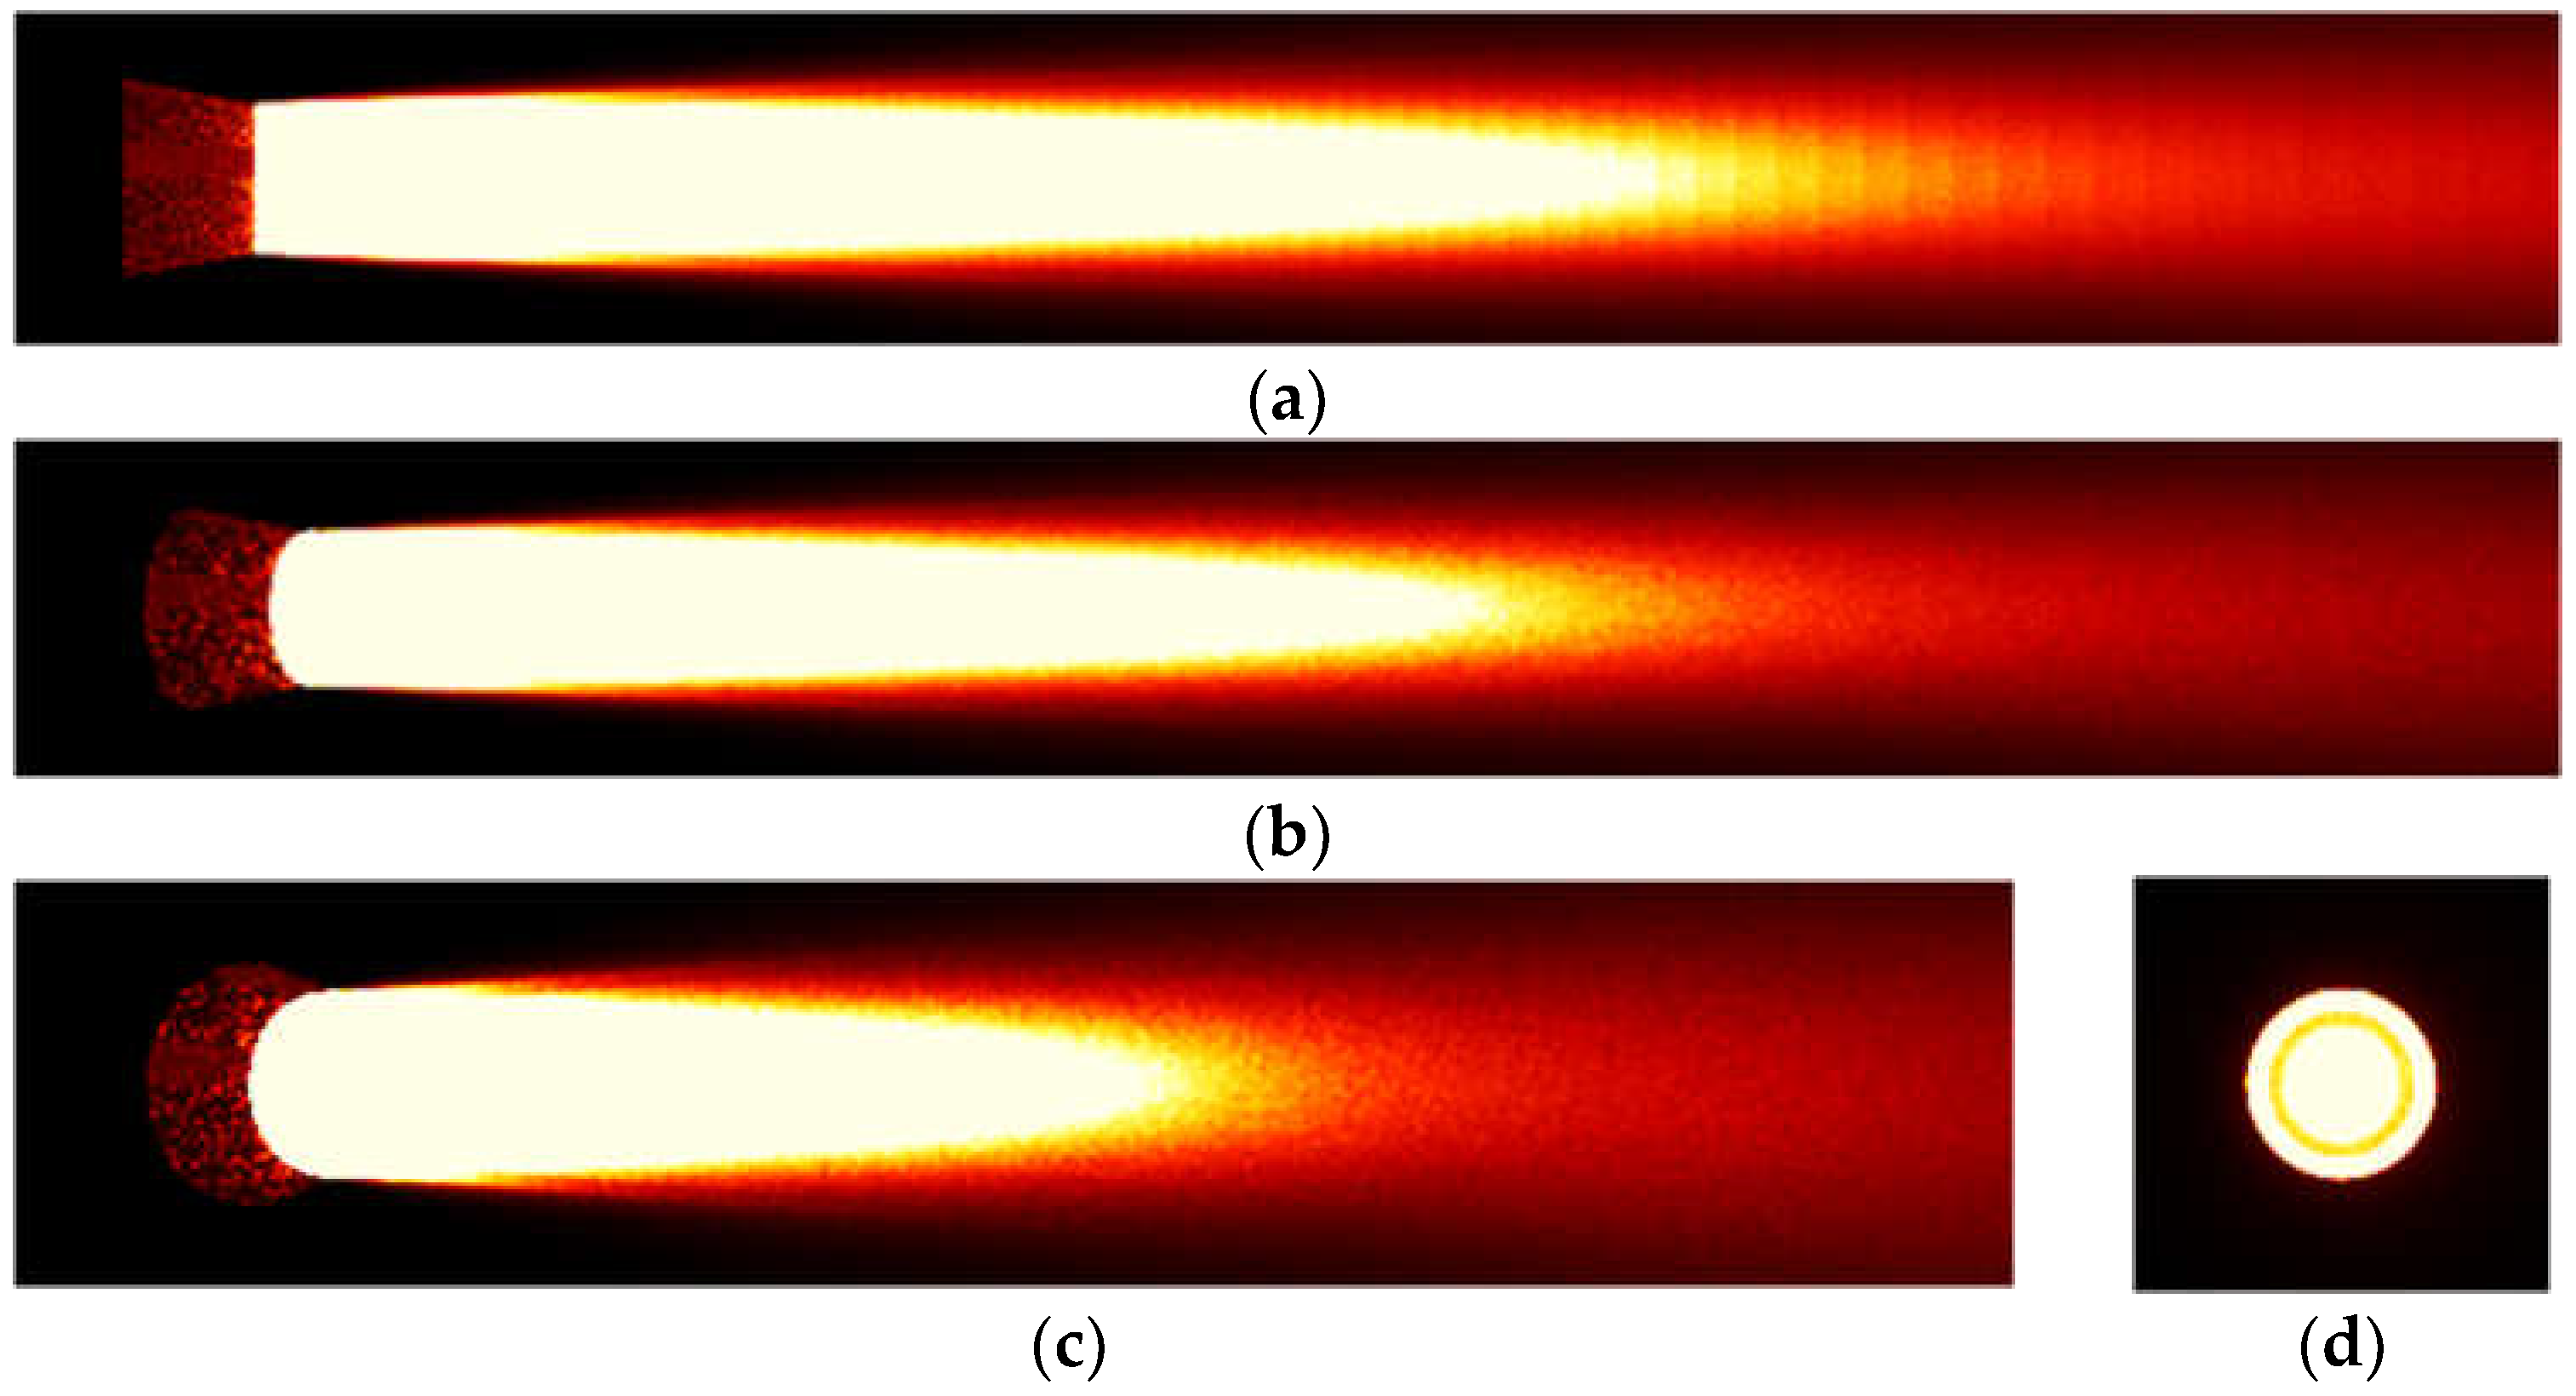
As the radiation of the aircraft exhaust system primarily stems from the impact of the tail jet, the radiation of the tail jet is mainly distributed in the 3–5-µm wave band. However, in the 8–14-µm band, the radiation from the solid walls, such as that from the adjusting plates outside the tail nozzle, has a certain impact on the overall radiation intensity.
(2)
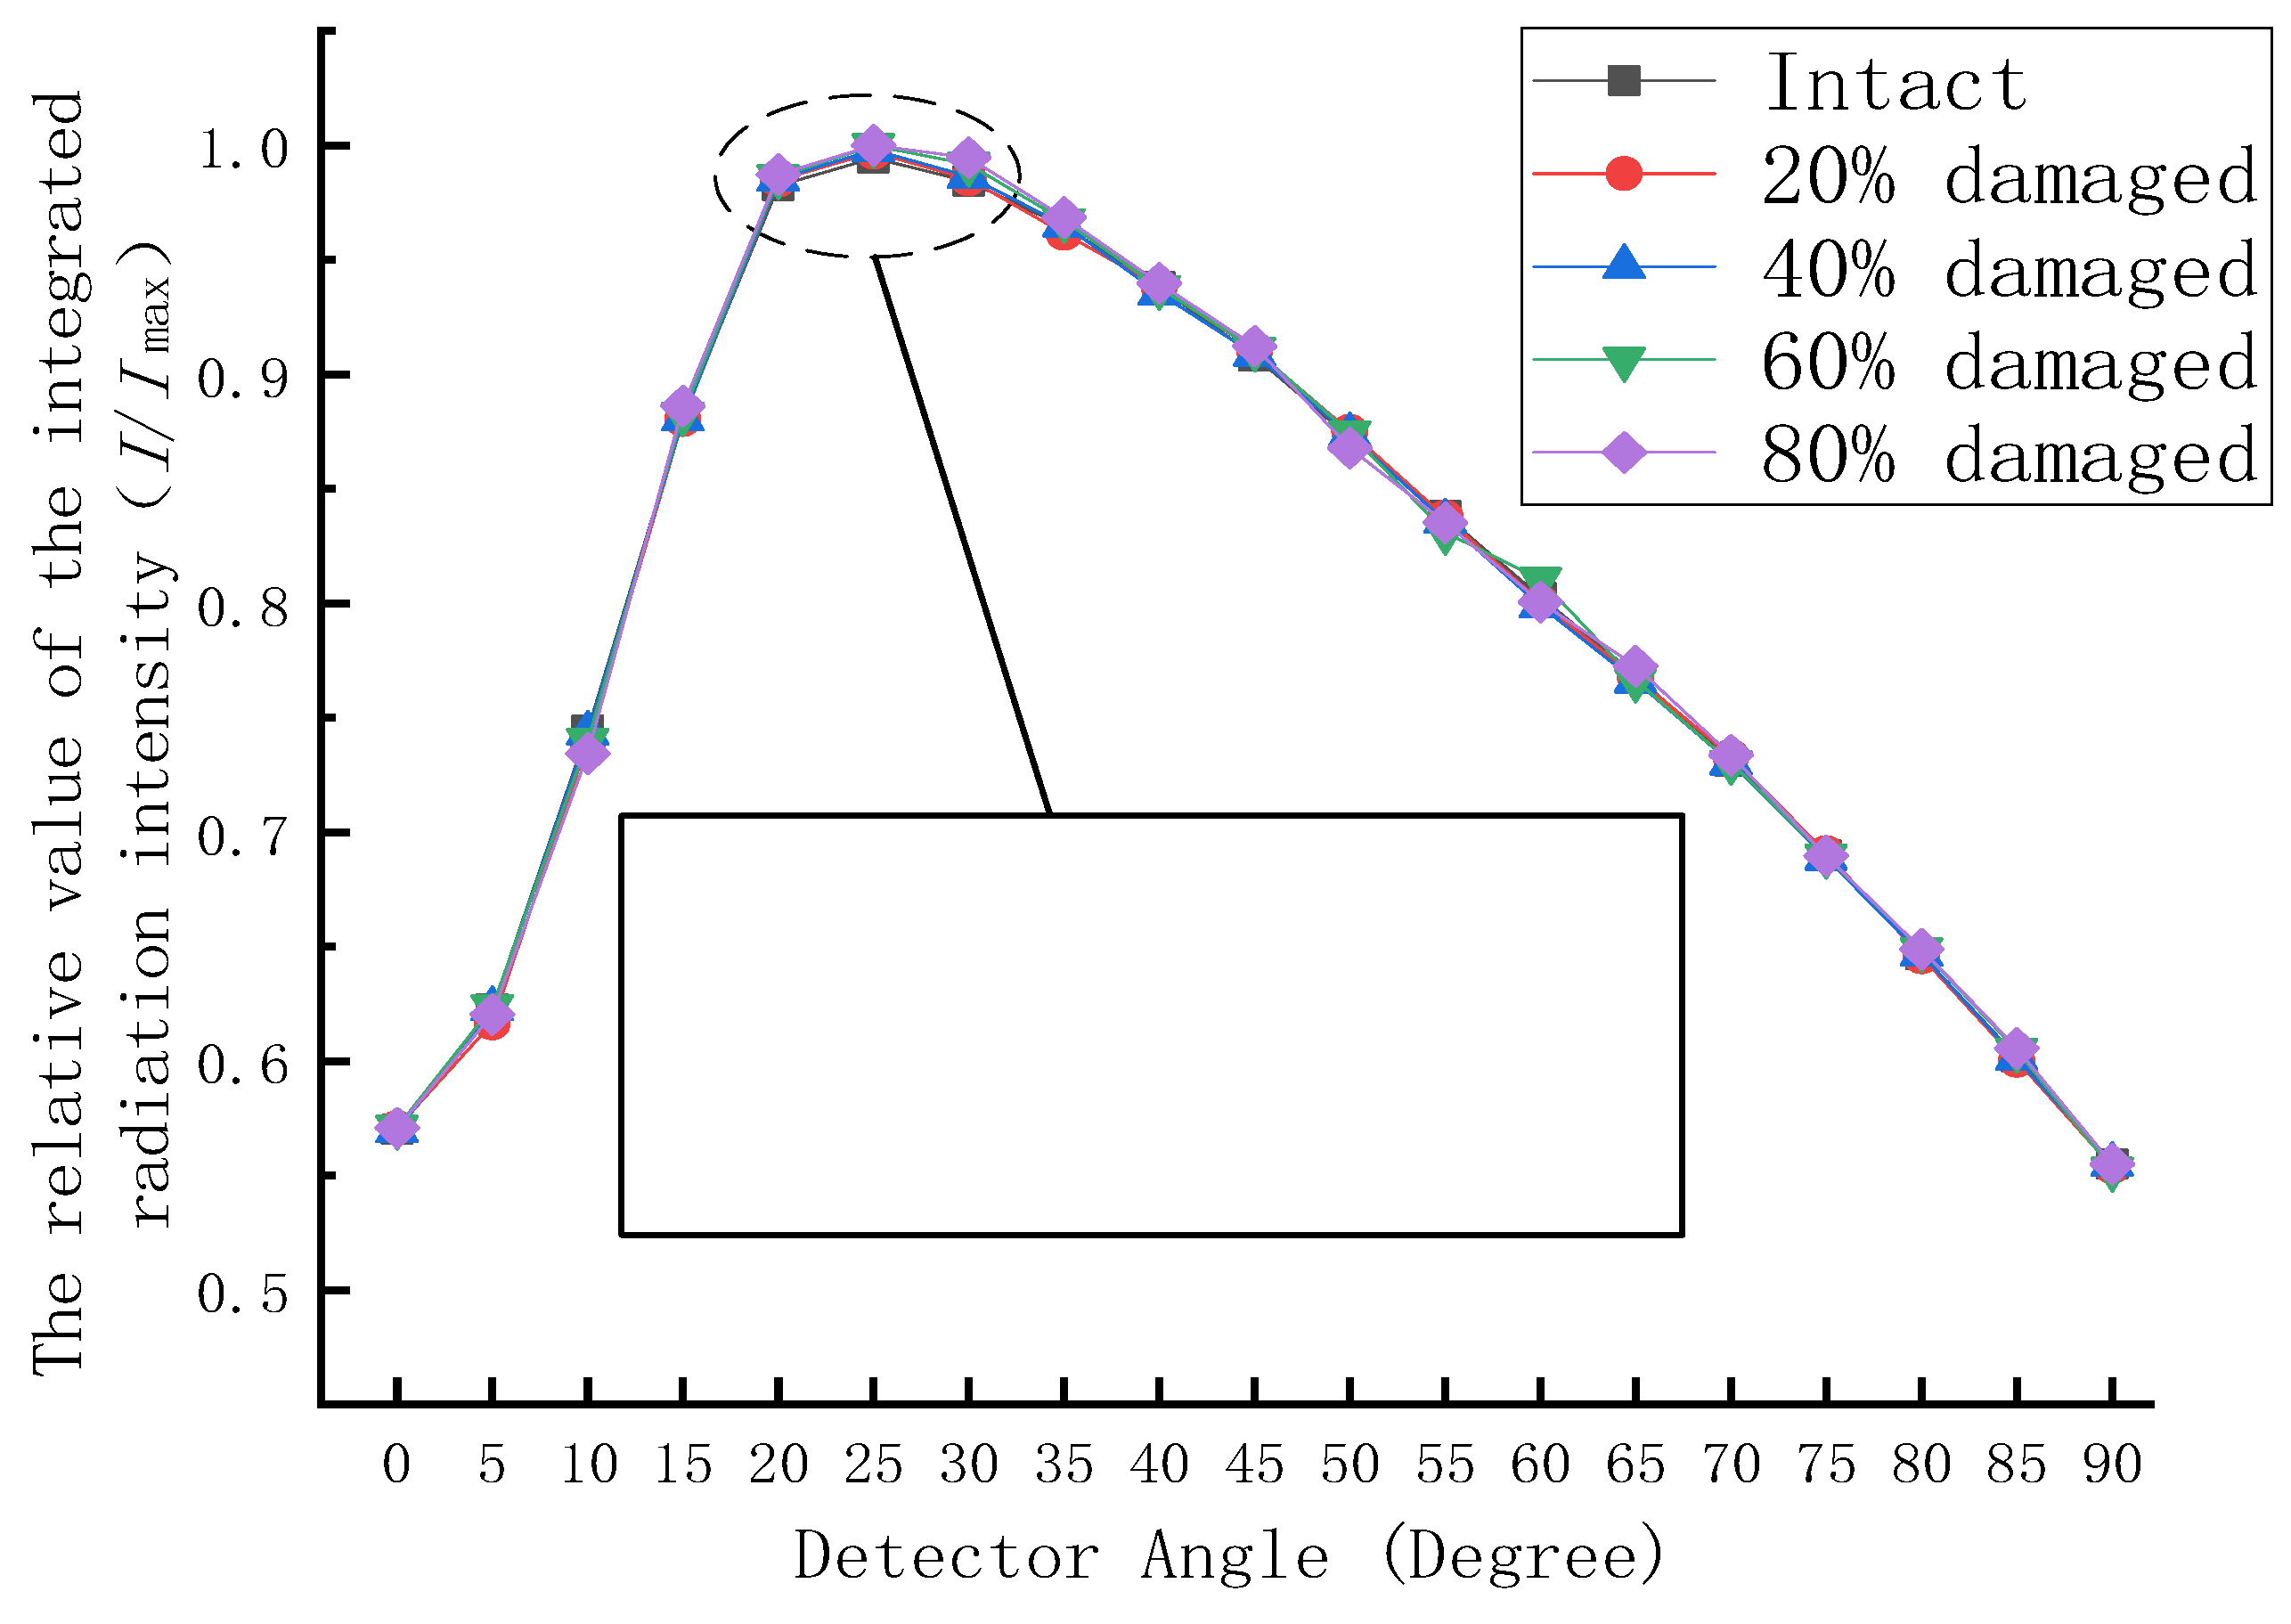
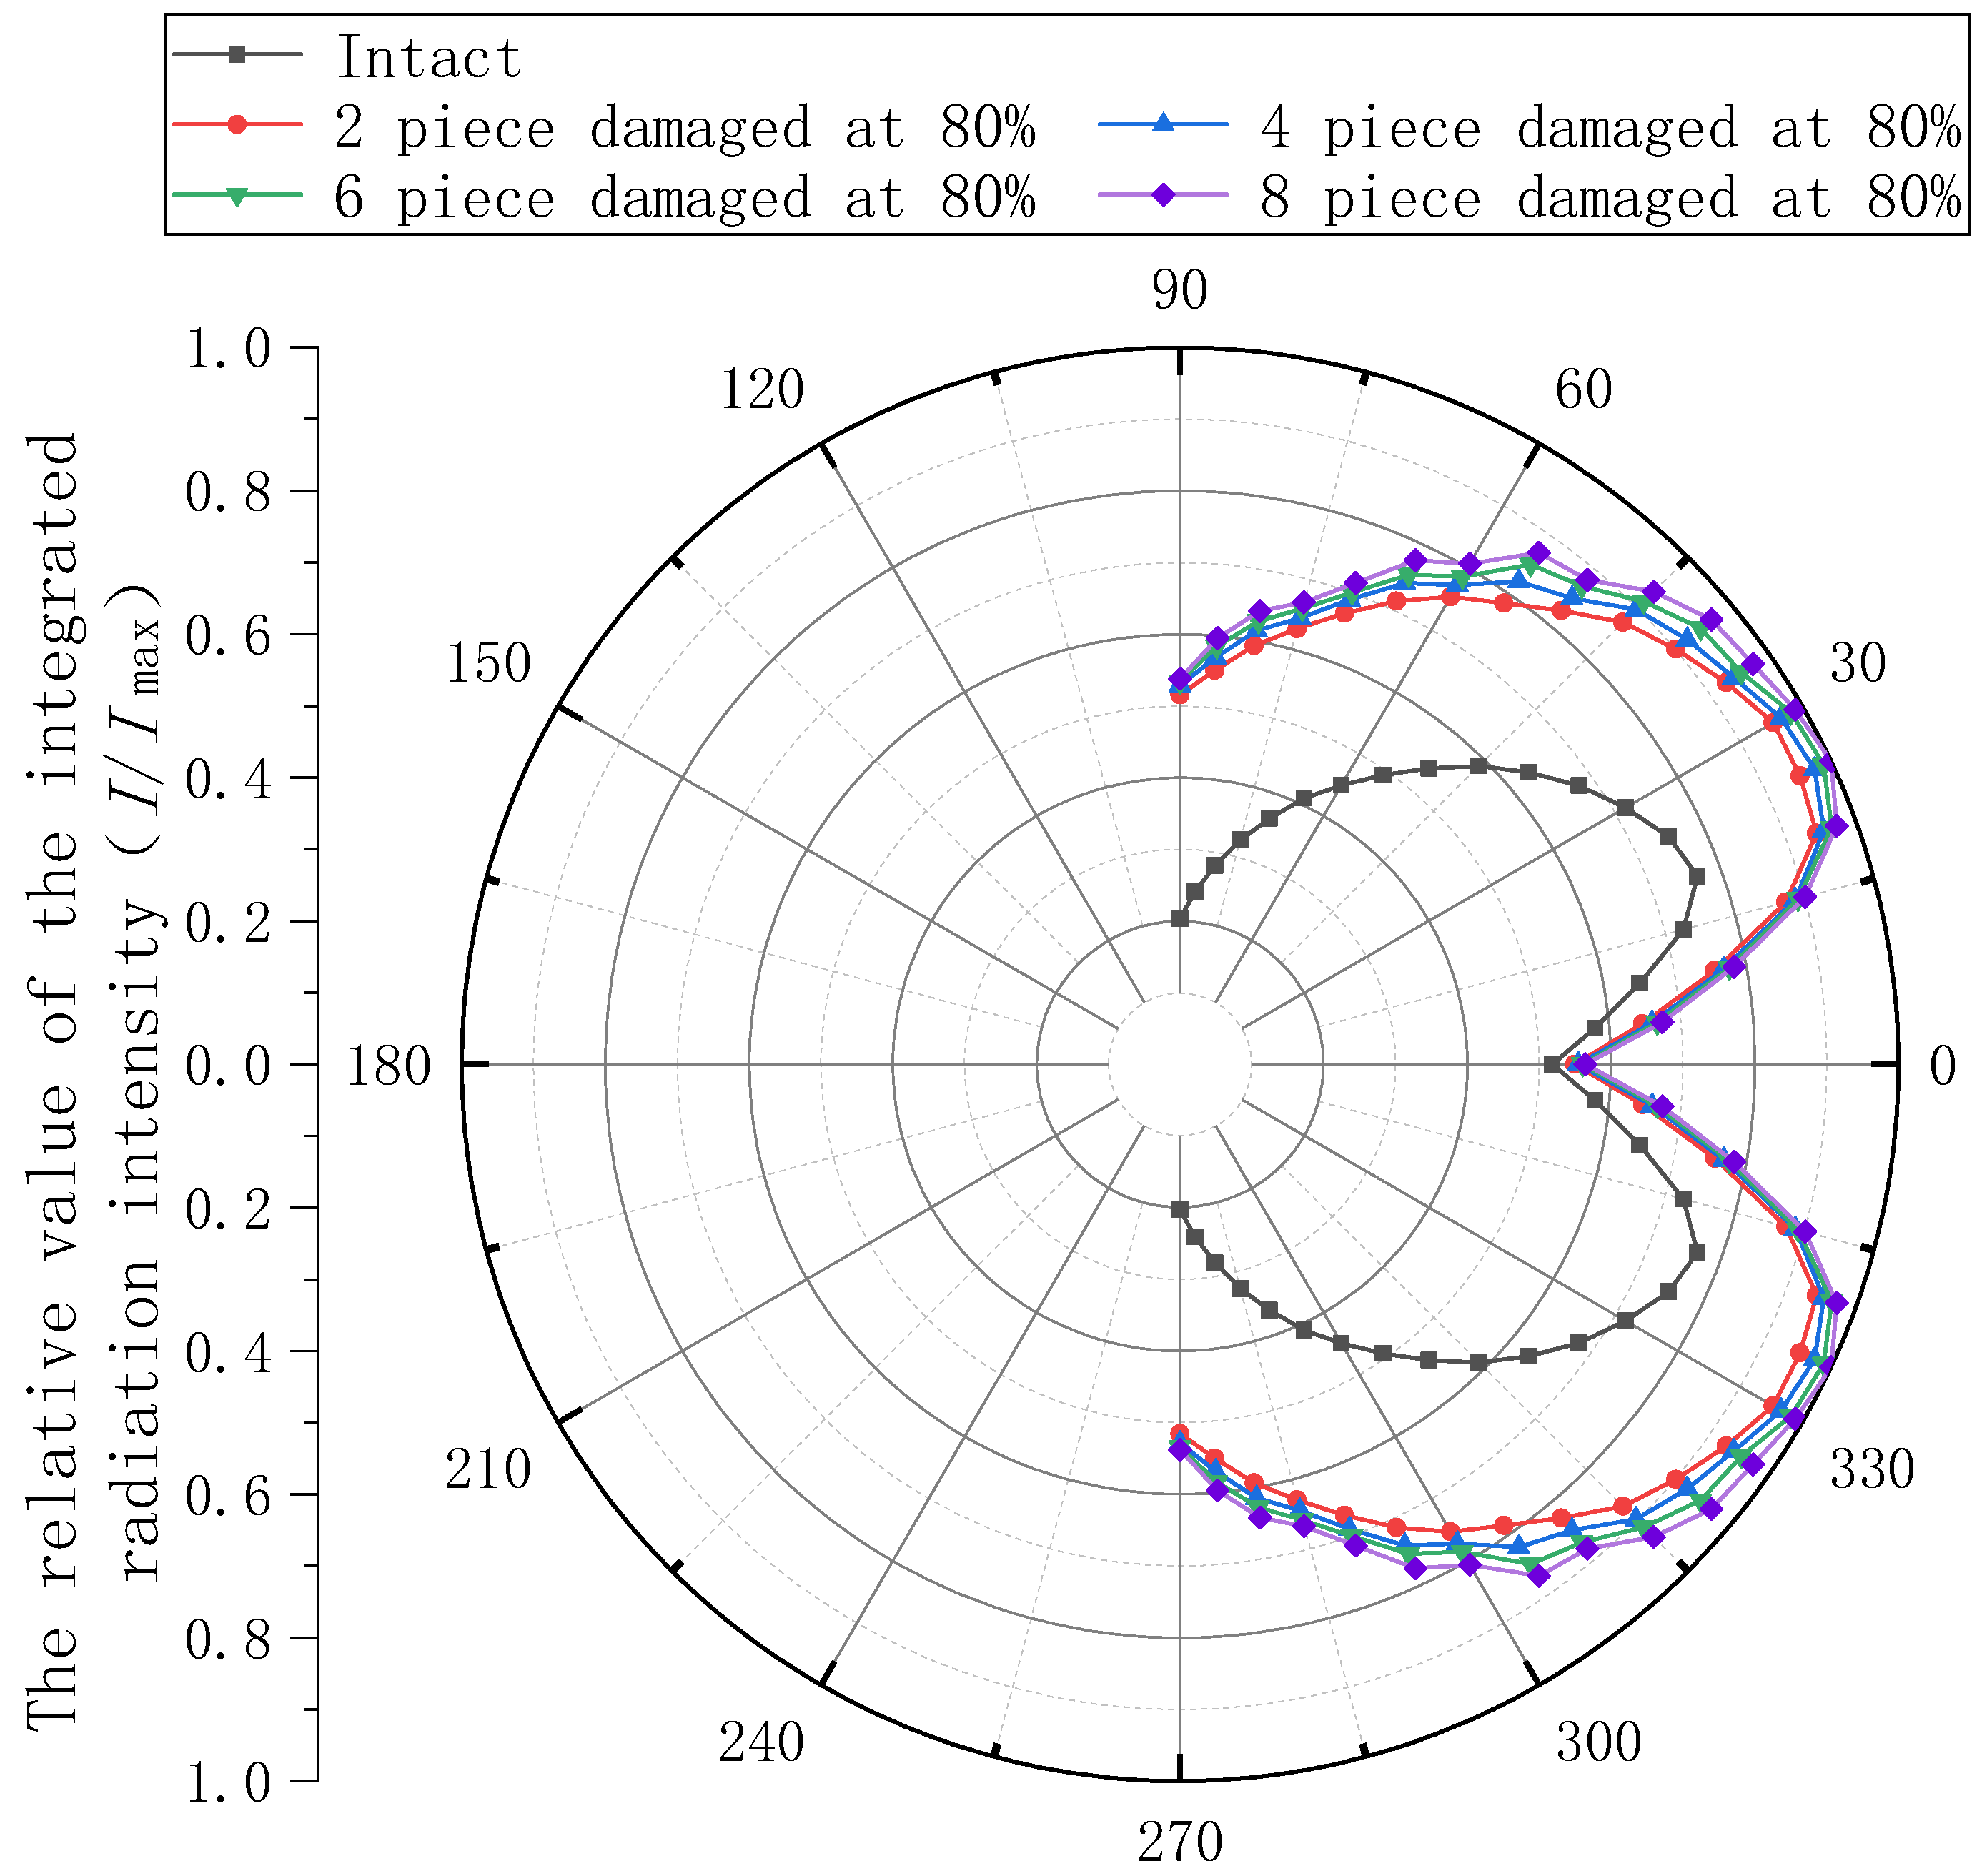
Within the 8–14-µm wavelength band, the radiation intensity of the exhaust system increases first and then decreases from 0° to 90°, with the peak appearing near the azimuth angle of 25°. The angular distribution of the infrared radiation of the nozzle presents a “pear shape”, which conforms to the general pattern, proving that the calculation of the results is reasonable and reliable.
(3)
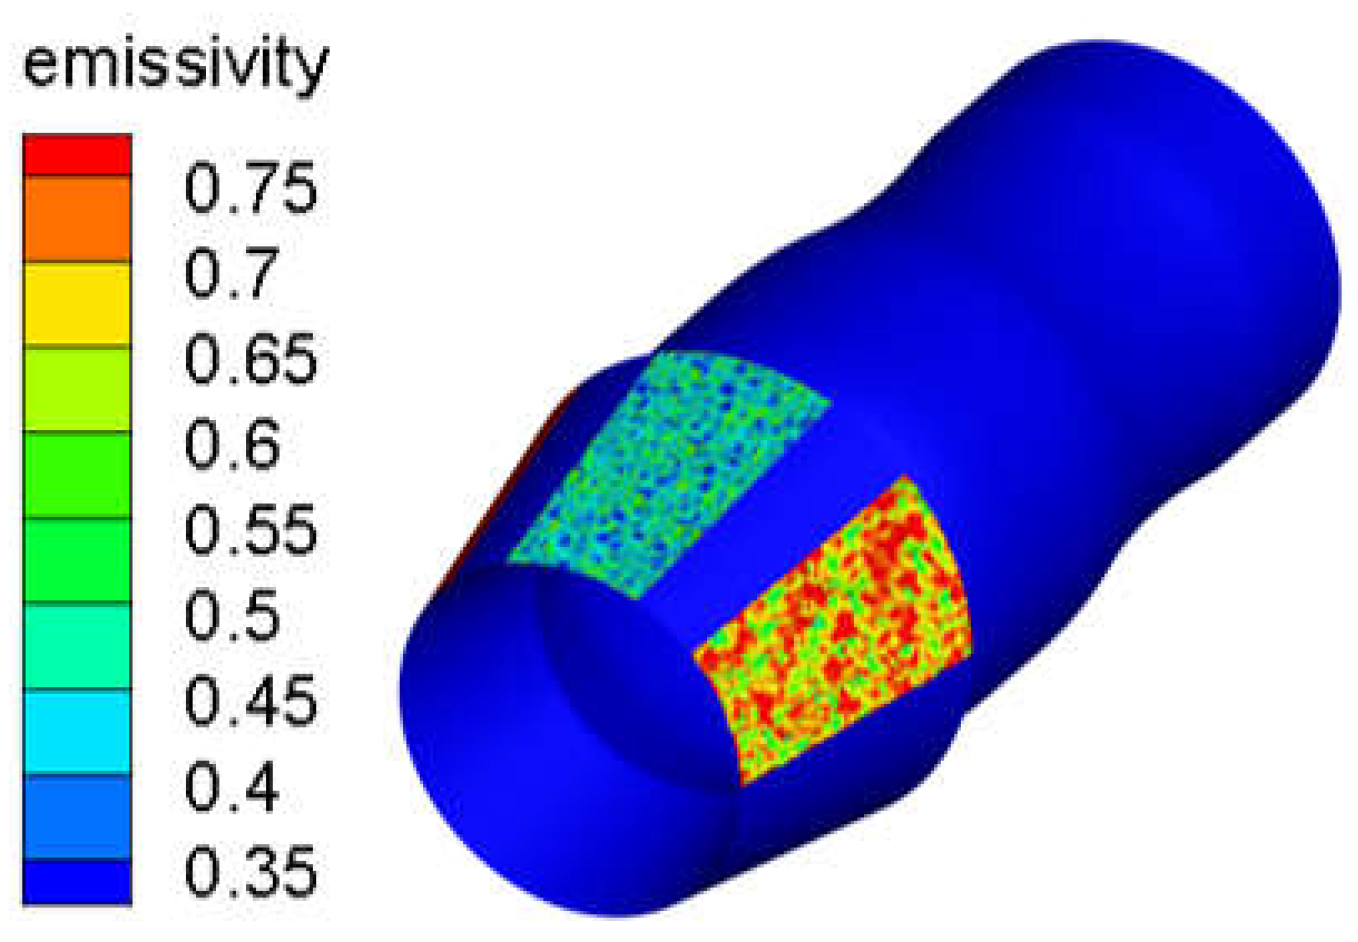
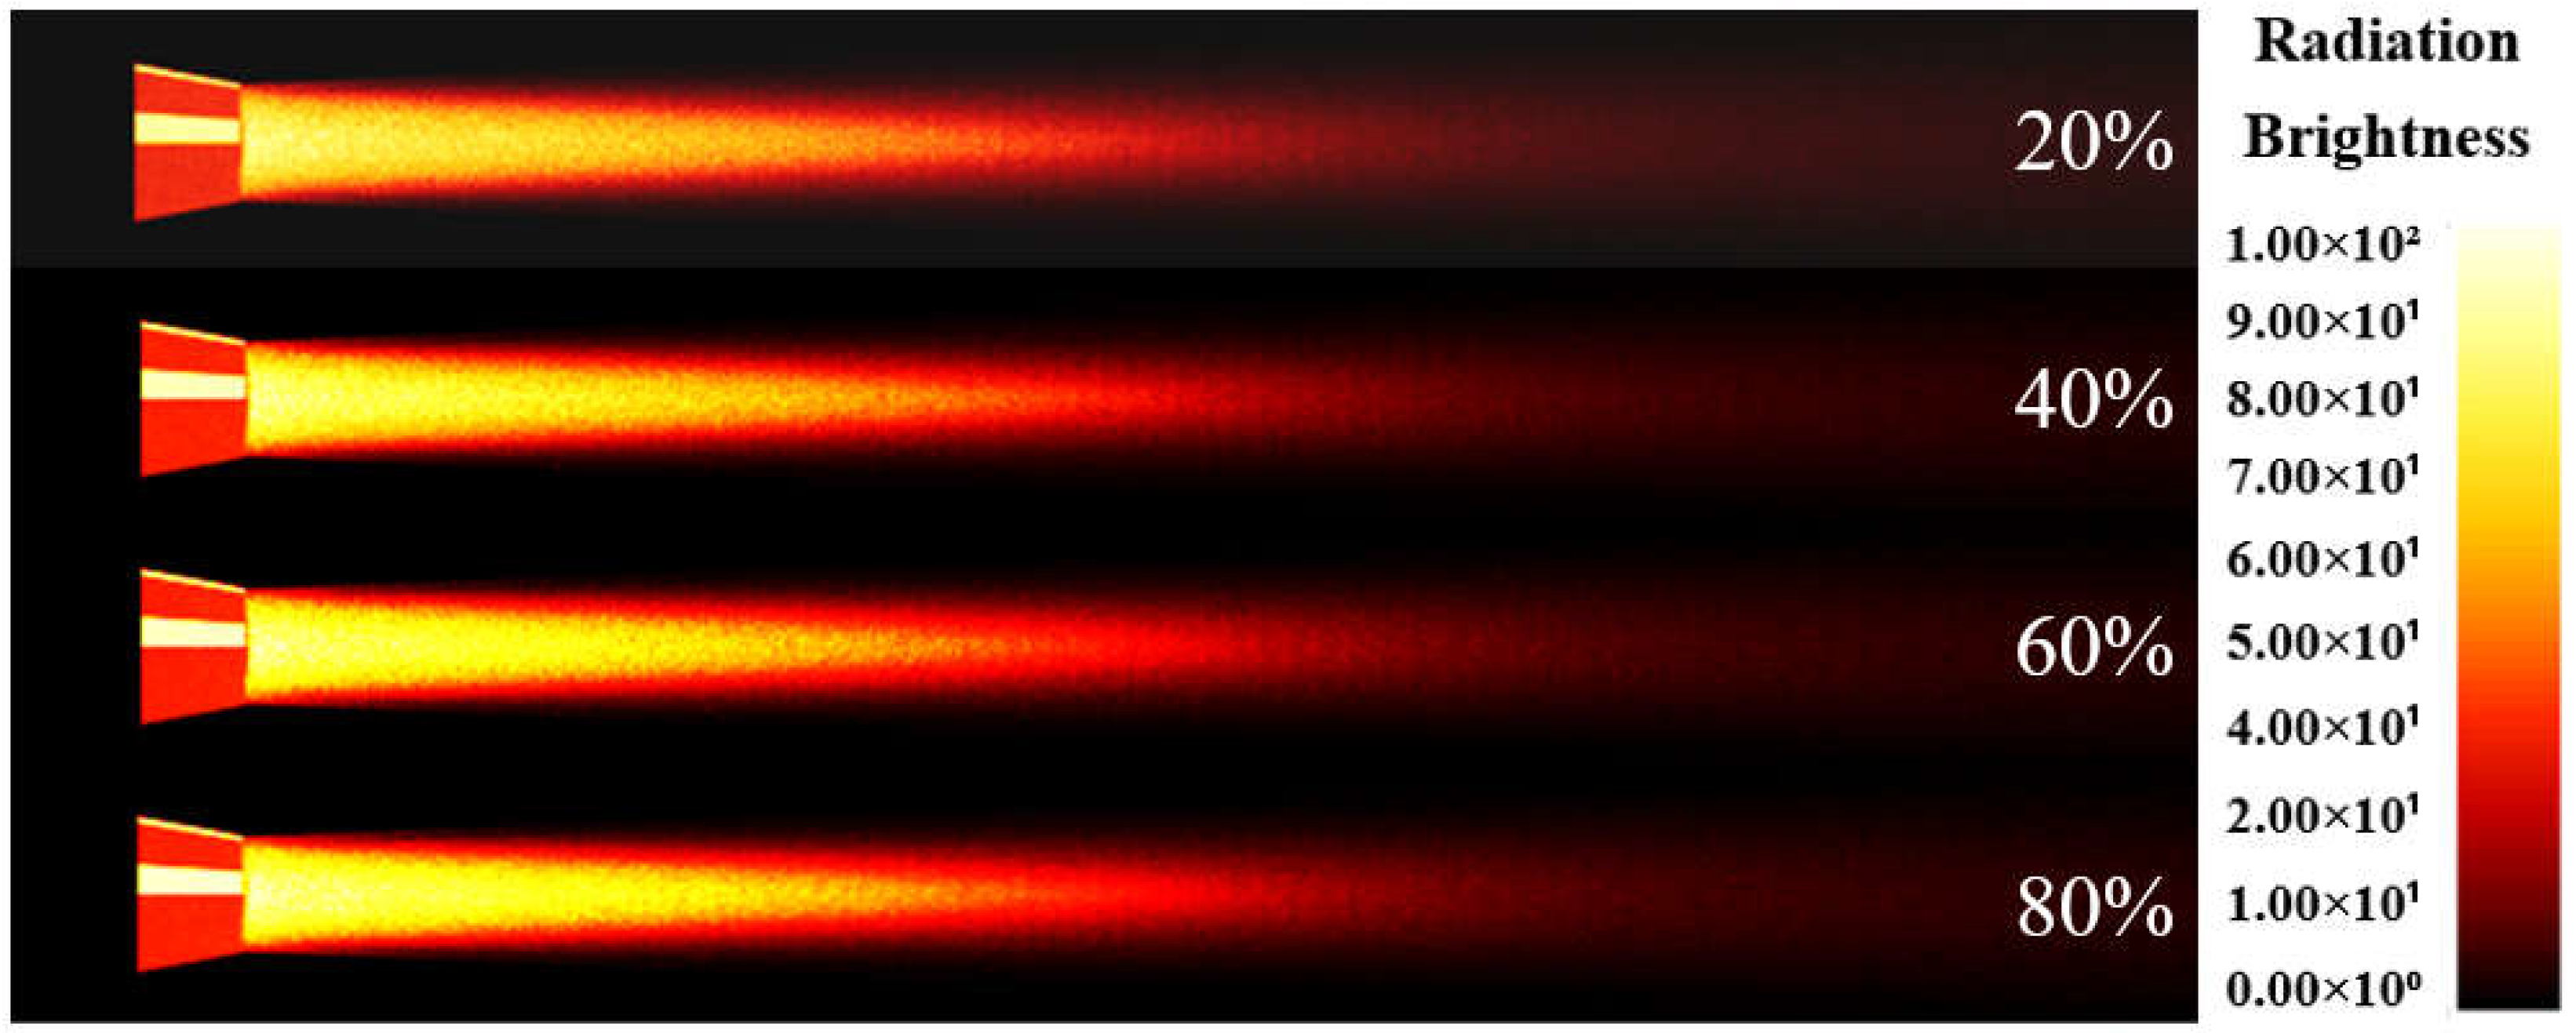
When the numbers of damages and damaged positions of the external adjusting plates are the same, the change in the overall infrared radiation intensity is limited when the damage percentage increases from 20% to 80%. Furthermore, the change of the positions of the damaged adjusting plates on one side has little effect on the overall radiation intensity.
(4)
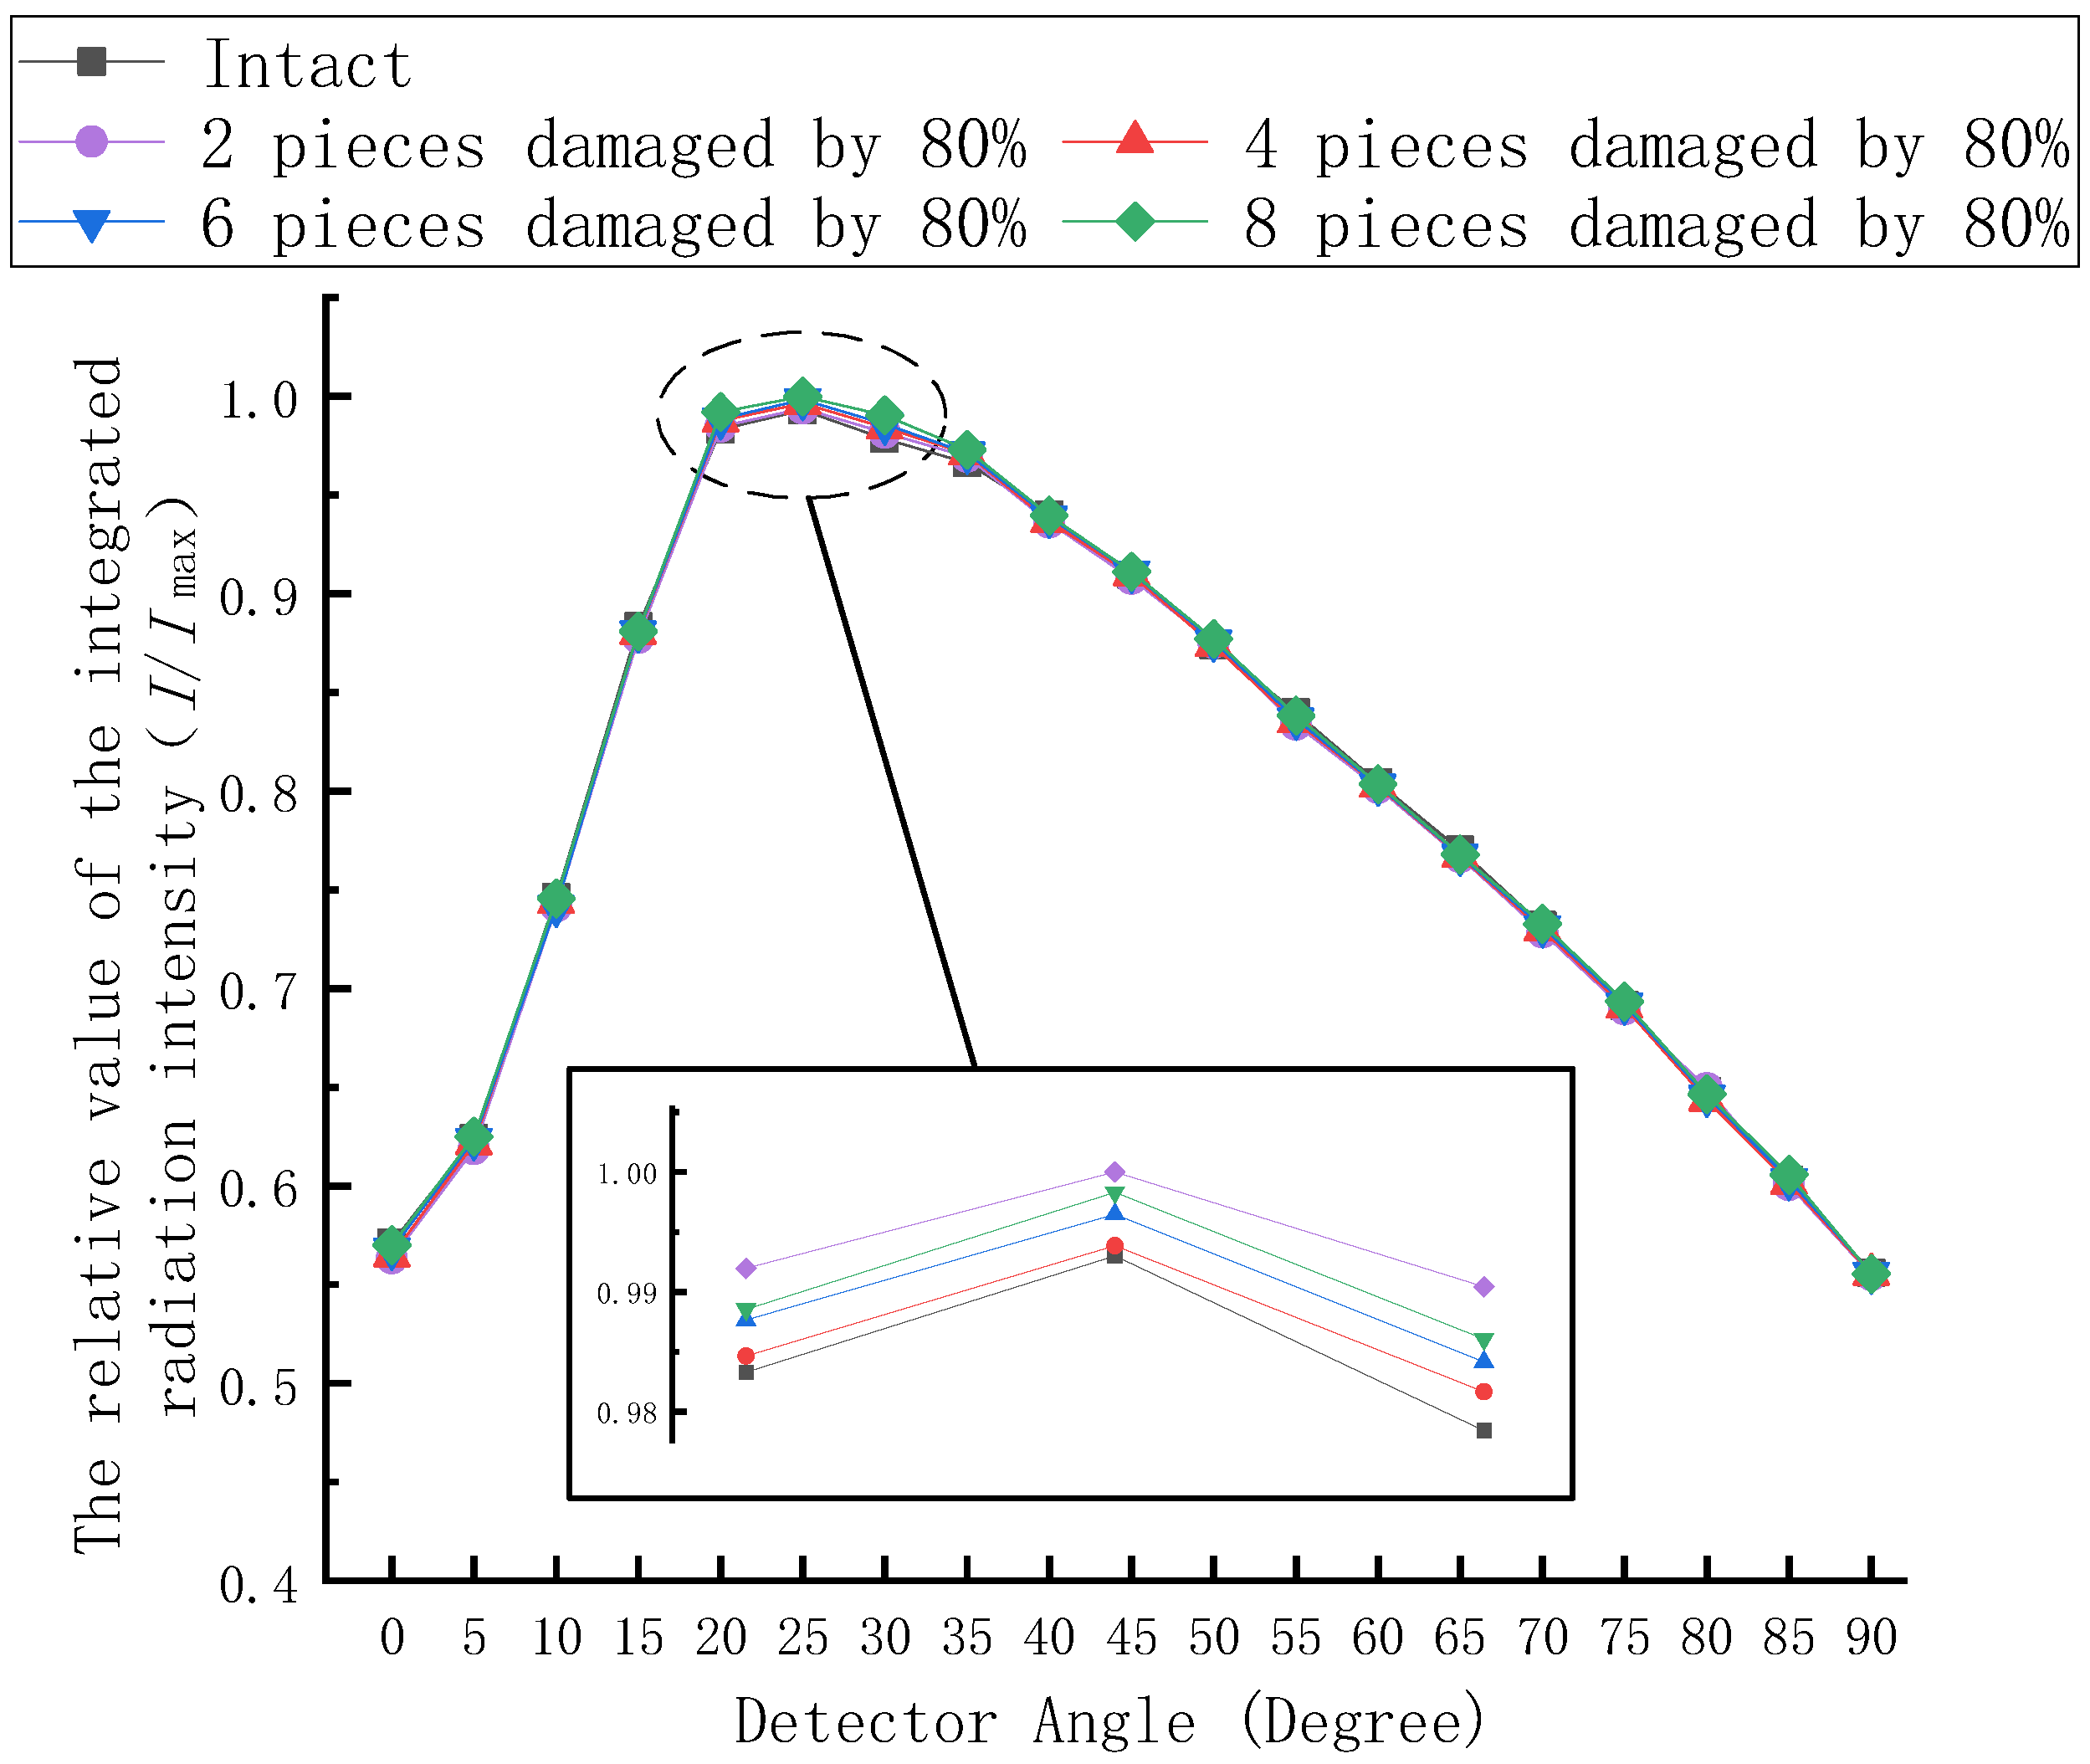
When the damage percentage of the external adjusting plates is constant, the overall infrared radiation intensity shows a trend of steady growth with the increase in the number of damaged adjusting plates. With a detection angle of 45°, the maximum change in the overall infrared radiation intensity contrast value I/Imac of one and eight damaged adjusting plates is 8.31%, and that under a detection angle of 55° is 11.67%. Thus, the stealth coating of the external adjusting plate of the tail nozzle of the outer aero-engine must be inspected and maintained regularly to ensure the integrity of the stealth performance.

Author Contributions

Investigation, H.Z., L.H. and Y.L.; data curation, L.C.; validation, H.Z. and Y.L.; writing—original draft preparation and writing—review and editing, Y.Y. All authors have read and agreed to the published version of the manuscript.

Funding

This work was supported by the Natural Science Fund of Shaanxi Province (2020JM-349). (Corresponding author: Zeng Hao).

Data Availability Statement

Not applicable.

Conflicts of Interest

The authors declare no conflict of interest.

References

  1. Li, W.J. Aircraft Overall Design; Northwestern Polytechnical University Press: Xi’an, China, 2005. [Google Scholar]
  2. Bin, Y. Investigation on aerodynamic design and infrared radiation characteristics of s-shaped nozzle with complicated variable cross-section. Trainer 2014, 3, 29–37. [Google Scholar]
  3. Li, X.; Yang, Q.Z.; Chen, L.H.; Gao, X.; Huan, X. Numerical simulation of infrared characteristics of aero-engine exhaust nozzle. Adv. Aeronaut. Sci. Eng. 2013, 4, 126–133. [Google Scholar] [CrossRef]
  4. Sun, Z.Q.; Yang, Q.Z.; Chen, L.H.; Liu, Y. Numerical simulation on the infrared radiation characteristics of turbofan engine’s ejector nozzle. Adv. Aeronaut. Sci. Eng. 2012, 3, 92–97. [Google Scholar] [CrossRef]
  5. Li, R.T.; Tong, Z.X.; Huang, H.S.; Wang, C.Z.; Li, S.B. Study on infrared radiation characteristics of aircraft. Laser Infrared 2017, 47, 189–194. [Google Scholar] [CrossRef]
  6. Jin, J.; Zhu, G.J.; Xu, N.R.; Zhang, X.Y. Numerical simulation of infrared radiation characteristics for aeroengine high-speed exhaust system. J. Aerosp. Power 2002, 17, 582–585. [Google Scholar] [CrossRef]
  7. Decher, R. Infrared Emissions from Turbofans with High Aspect Ratio Nozzles. J. Aircr. 1981, 18, 1025–1031. [Google Scholar] [CrossRef]
  8. Nelson, E.L.; Mahan, J.R.; Birckelbaw, L.D.; Turk, J.A.; Wardwell, D.A.; Hange, C.E. Temperature, Pressure and Infrared Image Survey of an Axisymmetric Heated Exhaust Plume; NASA-TM-110382; US Government: Washington, DC, USA, 1996.
  9. Liu, Y.H.; Shao, W.R.; Zhang, J.X. Numerical simulation of flowfield and infrared characteristics of an aeroengine exhaust system and its plume. J. Aerosp. Power 2008, 23, 591–597. [Google Scholar] [CrossRef]
  10. Zhai, Q.H.; Wang, Q.; E Ri, Q.T. Numerical simulation of ir image of high-speed aircraft. Laser Infrared 2002, 32, 146–148. [Google Scholar] [CrossRef]
  11. Reardon, J.E.; Lee, Y.C. A Computer Program for Thermal Radiation from Gaseous Rocket Exhuast Plumes; GASRAD. RTR014-9; US Government: Washington, DC, USA, 1979.
  12. Luo, M.D.; Ji, H.H.; Huang, W. Numerical evaluation on infrared radiant intensity of exhaust system of turbine engine without afterburning. J. Aerosp. Power 2007, 22, 1609–1616. [Google Scholar] [CrossRef]
  13. Li, J.L.; Wang, W.H. Review of Infrared Radiation Characteristics Numerical Simulation Study on Unmanned Aerial Vehicle. Ship Electron. Eng. 2010, 30, 22–26. [Google Scholar] [CrossRef]
  14. Irwin, S.; Semerjian, H. Turbine Engine Infrared Signature Program. In Turbine Engine Infrared Signat. Program; Defense Technical Information Center: Alexandria, VA, USA, 1976. [Google Scholar] [CrossRef]
  15. Noah, M.A.; Kristl, J.; Schroeder, J.W.; Sandford, B.P. NIRATAM-NATO infrared air target model. Surveill. Technol. Int. Soc. Opt. Photonics 1991, 1479, 275–282. [Google Scholar]
  16. Cline, J.; Behm, D.; Kidd, K.; Young, K. F-22 IR Signature Flight Test Model Validation. Int. Aviat. Fall. 2003, 3, 9–11. [Google Scholar]
  17. Jin, J.; Zhu, G.J.; Xu, N.R.; Zhang, X.Y. Numerical calculation and analysis of infrared radiation characteristics of engine high-speed exhaust systems. J. Aerodyn. 2002, 17, 5. [Google Scholar]
  18. Zhang, S.Y.; Wang, S.W. Numerical computational study of infrared characteristics of axisymmetric vector nozzle. J. Aerodyn. 2004, 19, 3. [Google Scholar]
  19. Liu, Y.; Shao, W.; Zhang, J. Numerical simulation of flow field and infrared characteristics of engine exhaust system and wake jet. J. Aerodyn. 2008, 23, 4. [Google Scholar]
  20. Luo, M.D.; Ji, H.H.; Huang, W. Numerical computation of infrared radiation intensity of non-boosted turbine engine exhaust system. J. Aerodyn. 2007, 22, 10. [Google Scholar]
  21. Xu, D.; Sang, J.; Luo, M. Research on the application of infrared stealth technology to unmanned aircraft. Infrared Laser Eng. 2012, 41, 12. [Google Scholar]
  22. Huang, W. Research on Infrared Feature Calculation and Suppression Techniques for Turbofan Engine Exhaust System. Ph.D. Thesis, Nanjing University of Aeronautics and Astronautics, Nanjing, China, 2010. [Google Scholar] [CrossRef]
  23. Huang, W. Research on Infrared Characteristic Calculation and Suppression Technology of Vorfan Engine Exhaust System. Ph.D. Thesis, Nanjing University of Aeronautics and Astronautics, Nanjing, China, 2010. [Google Scholar]
  24. Yang, D.H. Apparent Radiative Properties Studies of High-Temperature Semitransparent Coatings. Master’s Thesis, University of Science and Technology of China, Hefei, China, 2011. [Google Scholar]
  25. Yu, B.; Deng, X.J.; Yang, Q.Z.; Xie, X.H.; Sun, Y.W. Investigation on Aerodynamics and Infrared Radiation Characteristics of Duplex-throat Aerodynamic Vector Nozzle. Trainer 2015, 1, 16–23. [Google Scholar]
  26. Ji, X.J.; Chen, S.G.; Jiang, B.K. Numerical simulation of infrared radiation for cruise missile exhaust system. Laser Infrared 2017, 47, 828–832. [Google Scholar]
  27. Wang, B.; Tong, Z.X.; Wang, C.Z.; Ma, B. Infrared image simulation of aircraft. Laser Infrared 2015, 8, 911–917. [Google Scholar] [CrossRef]
  28. Chen, S.G.; Chen, L.H.; Mo, D.L.; Shi, J.C.; Mei, F. Construction of Malkmus statistical narrow spectral band model parameters database based on HITEMP2010. Infrared Laser Eng. 2015, 44, 2327–2333. [Google Scholar] [CrossRef]
  29. Shi, J.W. Investigation on Flow Mechanism and Performance Estimation of Fixed-Geometric Thrust Vectoring Nozzle. Ph.D. Thesis, Northwestern Polytechnical University, Xi’an, China, 2011. [Google Scholar]
  30. Xu, N. Infrared Radiation and Guidance; National Defense Industry Press: Beijing, China, 1997. [Google Scholar]
  31. Xu, N.; Qu, R. Infrared properties of flying vehicles. Infrared Laser Eng. 1999, 28, 8–14. [Google Scholar]
  32. Zhang, J.; Fang, X. Infrared Physics; Xi’an University of Electronic Science and Technology Press: Xi’an, China, 2004. [Google Scholar]
  33. Rao, G.A.; Mahulikar, S.P. Aircraft Powerplant and Plume Infrared Signature Modelling and Analysis. AIAA 2005, 6, 221. [Google Scholar] [CrossRef]
  34. Mahulikar, S.P.; Sonawane, H.R.; Rao, G.A. Infrared Signature Studies of Aerospace Vehicles. Prog. Aerosp. Sci. 2007, 43, 218–245. [Google Scholar] [CrossRef]
Figure 1. Schematic diagram of nozzle model.
Energies 15 07486 g001
Figure 2. Nozzle structure grid.
Energies 15 07486 g002
Figure 3. Schematic diagram of backtracking of random rays.
Energies 15 07486 g003
Figure 4. Cloud chart of total temperature.
Energies 15 07486 g004
Figure 5. Cloud chart of Mach.
Energies 15 07486 g005
Figure 6. Cloud chart of total pressure.
Energies 15 07486 g006
Figure 7. CO2 mass fraction field distribution.
Energies 15 07486 g007
Figure 8. H2O mass fraction field distribution.
Energies 15 07486 g008
Figure 9. Number of adjusting plates outside the nozzle.
Energies 15 07486 g009
Figure 10. Number of adjusting plates outside the nozzle.
Energies 15 07486 g010
Figure 11. Random damage of skin coating.
Energies 15 07486 g011
Figure 12. Infrared image of 3–5-μm band. (a) 90°; (b) 60°; (c) 30°; (d) 30°.
Energies 15 07486 g012
Figure 13. Radiation intensity curves of adjusting plates 1 and 4 of the 3–5 μm band with different damage degrees.
Energies 15 07486 g013
Figure 14. Radiation intensity curves of adjusting plates 1 and 4 of the 3–5 μm band with different damage degrees.
Energies 15 07486 g014
Figure 15. Imaging comparison of different damage degrees at 90°.
Energies 15 07486 g015
Figure 16. Imaging comparison of different damage degrees at 60°.
Energies 15 07486 g016
Figure 17. Imaging comparison of different damage degrees at 30°.
Energies 15 07486 g017
Figure 18. Imaging comparison of different damage degrees at 0°.
Energies 15 07486 g018
Figure 19. Radiation intensity curves of adjusting plates 1 and 4 with different damage degrees.
Energies 15 07486 g019
Figure 20. Radiation intensity curves of 80% damaged adjusting plates at different positions.
Energies 15 07486 g020
Figure 21. Comparison of radiation intensity with different numbers of damaged regulating plates.
Energies 15 07486 g021
Figure 22. Angular distribution of infrared radiation intensity.
Energies 15 07486 g022
Publisher’s Note: MDPI stays neutral with regard to jurisdictional claims in published maps and institutional affiliations.

