Article

Integration of PV Distributed Generators into Electrical Networks for Investment and Energy Purchase Costs Reduction by Using a Discrete–Continuous Parallel PSO

by
Luis Fernando Grisales-Noreña
1,2,*,
Oscar Danilo Montoya
3,4,
Edward-J. Marín-García
5,
Carlos Andres Ramos-Paja
6 and
Alberto-Jesus Perea-Moreno
7,*
1
Facultad de Ingenierías, Campus Robledo, Instituto Tecnológico Metropolitano de Medellín, Medellín 050036, Colombia
2
Estudiante de Doctorado, Departamento de Ingeniería Eléctrica, Campus Lagunillas s/n, University of Jaén, Edificio A3, 23071 Jaén, Spain
3
Grupo de Compatibilidad e Interferencia Electromagnética, Facultad de Ingeniería, Universidad Distrital Francisco José de Caldas, Bogotá 110231, Colombia
4
Laboratorio Inteligente de Energía, Facultad de Ingeniería, Universidad Tecnológica de Bolívar, Cartagena 131001, Colombia
5
Grupo de Investigación en Innovación y Desarrollo en Electrónica Aplicada—GiiDEA, Universidad del Valle, Cartago 762021, Colombia
6
Facultad de Minas, Universidad Nacional de Colombia, Medellin 050041, Colombia
7
Departamento de Física Aplicada, Radiología y Medicina Física, Universidad de Córdoba, Campus de Rabanales, 14071 Córdoba, Spain
*
Authors to whom correspondence should be addressed.
Energies 2022, 15(20), 7465; https://doi.org/10.3390/en15207465
Submission received: 7 September 2022 / Revised: 30 September 2022 / Accepted: 6 October 2022 / Published: 11 October 2022

Abstract

:
The problem of optimally integrating PV DGs into electrical networks to reduce annual costs (which include energy purchase and investment costs) was addressed in this research by presenting a new solution methodology. For such purpose, we used a Discrete–Continuous Parallel Particle Swarm Optimization method (DCPPSO), which considers both the discrete and continuous variables associated with the location and sizing of DGs in an electrical network and employs a parallel processing tool to reduce processing times. The optimization parameters of the proposed solution methodology were tuned using an external optimization algorithm. To validate the performance of DCPPSO, we employed the 33- and 69-bus test systems and compared it with five other solution methods: the BONMIN solver of the General Algebraic Modeling System (GAMS) and other four discrete–continuous methodologies that have been recently proposed. According to the findings, the DCPPSO produced the best results in terms of quality of the solution, processing time, and repeatability in electrical networks of any size, since it showed a better performance as the size of the electrical system increased.

1. Introduction

1.1. General Context

Due to the accelerated population growth, the current energy crisis, and the pressing need to use renewable energy resources, numerous industries and researchers worldwide are working on proposing methodologies for the optimal integration of clean energy technologies into electrical systems [1]. Particularly, Photovoltaic (PV) systems have emerged as one of the most widely used distributed generation technologies in the past decade thanks to their low operation and maintenance costs and the abundant energy produced by the sun [2].
The integration of PV Distributed Generators (DGs) into electrical networks has been extensively studied in the specialized literature and the electric power industry. In such studies, different technical, financial, and environmental aspects have been considered, including power losses, voltage profile stability, network loadability, energy purchase and investment costs, and reduction in CO2 emissions from fossil fuel use [3]. Selecting an objective function in real life often depends on the needs of the electrical network’s users, owner, or operator [4]. However, financial aspects such as investment and operation costs are currently the main focus around the world. Thus, the primary goals of integrating PV DGs into electrical networks by using economic indices include minimizing energy purchase or production costs and, with these savings, paying for the investment and maintenance costs associated with such integration [5]. With the aim to obtain the aforementioned financial improvements and meet all technical and operating requirements for electrical grids under a distributed generation scenario, the literature proposes mathematical models that consider all of the previously mentioned information [3,5]. These mathematical models allow identifying the impact of different configurations for siting and sizing PV DGs in electrical systems on the objective function and its constraints. However, due to the fact that this problem is non-convex and non-linear, it is necessary to use high-level optimization algorithms and tools to find its solution with the best possible performance.
According to various studies published in recent years, the positive or negative impact generated by the integration of PV DGs into electrical networks on the economic conditions of the grid depend on the methodologies employed for such integration, which is why adequately selecting the solution methodology is vital [6]. Furthermore, the location and sizing (nominal power installed) of the PV DGs in the electrical grids affect the effectiveness of the energy management strategies implemented after the integration [7,8]. Thereupon, researchers have set out to develop new methodologies for solving the aforementioned problem, with the aim to obtain the best economic impact for the owner or operator of the electrical network, ensuring that the algorithm provides the best possible solution with short processing times every time it is executed and that it can consider real scenarios to meet the needs of both public and private contracts.

1.2. State-of-the-Art

The problem of optimally integrating PV DGs into electrical networks has traditionally been divided into two sub-problems: (i) the optimal location of the PV DGs and (ii) their optimal sizing. In the specialized literature, the first sub-problem has been traditionally solved using a codification composed of discrete variables that assign a particular node in the electrical system for locating a DGs, as shown in Figure 1a. In the example illustrated in such figure, a vector of size 1 × 3 is used to locate three PV DGs in an electrical system composed of 33 buses. According to this vector, the three PV DGs should be located at buses 4, 19, and 29. As observed in this example, the variables that represent the problem under analysis are discrete numbers between 1 and the maximum number of buses in the electrical system.
The second sub-problem, related to the sizing of PV DGs located in the first sub-problem, has traditionally been solved using a continuous codification that establishes the nominal power for each DG to be installed in the electrical grid, as presented in Figure 1b. In the example shown in such figure, a vector of size 1 × 3 is used to define the size of three PV DGs installed in a network. According to this vector, the power of the PV DGs located at buses 4, 19, and 29 should be 0.11 kW, 1.18 kW, and 2 kW, respectively. Importantly, the power limits employed in a continuous codification are chosen between the maximum and minimum power allowed for the electrical network. These bounds are related to the energetic potential of the Sun in the area where the electrical system is located [9].
To solve the problem of optimally integrating PV DGs into electrical networks using the codification illustrated in Figure 1a,b, multiple master–slave methodologies that combine optimization algorithms have been proposed in the specialized literature. In such methodologies, the master stage solves the location problem, while the slave stage solves the sizing problem. For instance, in [10], the authors also used a master–slave methodology. Their proposed methodology combines the Chu and Beasly GA and the PSO algorithm to solve the problem of optimally integrating DGs into electrical networks. The main problem with their proposed solution methodology is that the authors did not analyze the impact of the solution in terms of processing time and standard deviation. Currently, it is essential to analyze these two parameters in order to offer high-quality solution methodologies that require short processing times and guarantee a good performance each time they are executed. Furthermore, in the mathematical model used, the authors did not consider the branch currents and voltage profile limits of the electrical systems, which is why the solution obtained is not representative of real life. In [11], the authors presented a Mixed-Integer Nonlinear Programming (MINLP) model to solve the problem of optimally locating and sizing DGs in radial distribution networks using the BONMIN solver of the General Algebraic Modeling System (GAMS). They used the 27, 33, and 69-bus test systems to locate PV DGs and considered the power capacity in Colombia during a normal day, employing seven comparison methods reported in the literature in order to demonstrate the effectiveness and robustness of the proposed methodology: particle swarm optimization and genetic algorithms [10], an optimization technique based on teaching–learning [12], the harmony search algorithm [13], the symbiotic organism search algorithm [14], and a heuristic methodology based on a loss-sensitive factor [15]. The results showed that the proposed methodology achieved the best results in all test scenarios. However, this technique requires specialized software, which increases its complexity, as it implies special requirements for installation and implementation and costs associated to the acquisition of specialized tools. Furthermore, the authors did not analyze the repeatibility and the processing times required by the proposed methodology. In [6], the authors proposed a master–slave methodology, in which the master stage employs the Genetic Algorithm (GA), the Monte Carlo method (MC), and a Loss Sensitive Factor (LSF), and the slave stage uses the Particle Swarm Optimization (PSO) algorithm; by generating in this way three different master–slave methodologies. Further, they employed a parallel processing tool to reduce the processing time required by the proposed methodology. In said study, the authors compared the results obtained by all the methods under analysis in terms of the quality of the solution, standard deviation, and processing times by using two test systems with 33 and 69 buses. They were able to demonstrate the excellent performance of the GA/Parallel PSO and found that all methodologies require longer processing times, whereas the hybrid methodologies between the LSF/PSO and MC/SO sometimes become stuck in local optima. The main limitation of this paper is that it did not analyze the standard deviation in order to evaluate the repeatability of the solutions offered by the studied methodologies.
Aside from the papers mentioned above, there are numerous studies in the specialized literature that employed master–slave methodologies to solve the problem of optimally integrating DGs into electrical networks [16,17,18]. Such methodologies share the same characteristics: (i) they are methodologies based on sequential programming that avoid the need for specialized software, (ii) they consider technical and financial aspects as their objective function and evaluate performance in terms of processing time and repeatability, and (iii) they require longer processing times to solve the problem under study. Identifying in this way the current needs of the master–slave methodologies proposed for solving the problem of optimal integration of PV DGs in AC grids.
In recent years, several authors have used a discrete–continuous codification to solve the problem under analysis jointly, as shown in Figure 1c. This single codification combines the discrete and continuous variables associated with the location and sizing problems and allows to modify continuous optimization methods to solve the problem under study by using a unique optimization method. To perform this modification, a vector with a size 1 X 2 N g is used, where N g corresponds to the number of PV distributed generators located on electric grid. The adaptation made to the codification used for the continuous algorithms consists of forcing the first half of the vector to turn the continuous variables into discrete variables between 1 and the maximum number of buses in the electrical system, thus proposing a possible solution for the location problem. The remaining positions of the vector are associated with the sizing of the PV distributed generators located in the first half of the vector. As an example, in Figure 1c, it can be observed that, as in the master–slave codification, albeit using a unique vector, the PV DGs were located at buses 4, 19, and 29, with nominal powers of 0.11 kW, 1.18 kW, and 2 kW, respectively.
There are different works in the literature that take advantage of the discrete–continuous codifications explained herein. An example of this was reported in [19], where the authors employed the BONMIM solver of GAMS and a discrete–continuous version of the Chu and Beasley Genetic Algorithm (DCCBGA) to solve the problem of optimally integrating PV units into electrical networks, identifying that a commercial solver such as BONMIN becomes stuck in local optima as the nonlinearities and complexities of the problem increase, particularly regarding variations in power demand and PV generation for an average day in Colombia. The authors considered a financial objective function, whose aim was to reduce the energy purchase costs and those related to the installation of the PV DGs. The results they obtained demonstrated effectiveness and robustness of their proposed methodology. The authors, however, did not evaluate the repeatability of the obtained solution and the currents through the branches, which prevents the solution from being implemented. Despite these drawbacks, the mathematical model developed by the authors has served as the foundation to design new discrete–continuous methodologies for solving the problem of optimally integrating PV DGs into electrical networks.
Another work that takes advantage of discrete–continuous codification is presented in [20], where the authors propose a Modified Arithmetic Optimization Algorithm (MAOA) for reducing the annual costs related to energy purchasing and PV DG investment costs. Furthermore, their mathematical model included all constraints associated to the operation of AC grids within a distributed generation environment, considering the constraint associated to the maximum current allowed through the branches, which is often neglected in research and of great importance for electrical analysis. This research employed four methods for comparison: three methodologies based on metaheuristics, i.e., the DCCBGA [19], a discrete–continuous version of the Newton–Metaheuristic Algorithm (NMA) [21], and the Arithmetic Optimization Algorithm (AOA) [22]; as well as the aforementioned BONMIN solver of the GAMS software. After evaluating all solution methodologies in the 34-bus test system, the proposed methodology obtained excellent results in terms of quality of the solution but failed to evaluate the standard deviation of the solution and processing times. Using the same mathematical model, the authors of [3] proposed a discrete–continuous version of the vortex search algorithm to solve the problem of optimally integrating PV DGs into Alternating Current (AC) networks. The authors of such study reported excellent results in terms of quality of the solution and standard deviation, with an important improvement in processing times.
Finally, using the same mathematical model, in [5], the authors developed a generalized normal distribution optimization method, which outperforms the other discrete–continuous methods mentioned above in terms of the quality of the solution. However, these authors reported a considerable increase in processing times and failed to evaluate the standard deviation of the obtained solution. By comparing the results of the works that use discrete–continuous codification to those that employ master–slave methodologies, it is possible to observe a notable reduction in processing times for discrete–continuous methodologies, as well as in the standard deviation values. Additionally, these new methodologies showed the best impact on the economic indices used; they showed a tendency towards effectiveness regarding the solution, repeatability, and processing times.

1.3. Motivations, Contributions, and Scope

From the information presented in the State-of-the-Art section, we identified the importance of considering a financial objective function when addressing the issue of integrating PV DGs into electrical networks. Such an objective function should guarantee the minimization of operating costs and allow the investment costs associated with these technologies to be covered. It should also satisfy the entire set of constraints that represent the behavior of electrical networks in a distributed generation environment. Furthermore, it is crucial to propose an efficient solution technique that improves the quality of the solution and reduces processing times and the standard deviation every time they are executed. it is important to observe the growing trend in the use of discrete–continuous methodologies for achieving the aforementioned goals.
In light of this, this paper presents the discrete–continuous optimization methodology for solving the problem of optimal integration of PV DGs in electrical networks; by implementing a Discrete–Continuous Parallel version of the Particle Swarm Optimization (DCPPSO) method with the aim to reduce the annual costs and the processing times required for solving the problem under study.This solution strategy has, as the objective function, the reduction in the annual costs of electrical systems, which include the energy purchase or production costs and the investment costs associated with the installation of the PV DGs.
The selection of the DCPPSO for solving the problem of optimal integration of PV DGs in AC electrical networks was based on the excellent results reported in the literature for the PSO algorithm in solving electrical problems such as the optimal power flow, the optimal sizing of distributed generators, and the optimal operation of energy storage systems, among others [23,24,25]. Another important reason to use this optimization algorithm is related to the fact that this optimization algorithm works with a population within its iterative process, making it possible to apply parallel processing tools in order to improve its effectiveness in terms of processing times [26]. Furthermore, the literature review demonstrated that the implementation of a discrete–continuous codification allows solving problems with discrete and continuous variables such as the optimal PV DG integration problem addressed in this work, thus improving the solution along with its repeatability and processing times. Therefore, the authors of this work decided to use a discrete version of the PSO in order to solve the problem regarding the optimal integration of PV DGs in AC grids, including parallel processing techniques with the aim to reduce the processing times. This resulted in the the DCPPSO, which, to the best of the authors’ knowledge, has not been used to solve the problem studied on our work.
The academic contributions made by this research are as follows:
i.
A detailed description of the mathematical model that represents the problem of optimally integrating PV DGs into electrical systems. This model establishes, as its objective function, the minimization of the annual costs of the network, and it considers the entire set of constraints that represent the behavior of electrical networks in a distributed generation environment.
ii.
A new application for the discrete–continuous parallel PSO method that allows solving problems related to PV DG integration and combines discrete (location) and continuous variables (sizing).
iii.
An efficient methodology (DCPPSO) in terms of the quality of the solution, processing times, and standard deviation to solve the problem of optimally integrating PV DGs into electrical networks while considering variations in power generation and demand.
Finally, the industrial contributions of this paper are presented below:
i.
A new methodology for the optimal integration of DGs in AC networks that pays for the investment costs associated with the use of these technologies by making use of the energy saving costs, thus obtaining an annual costs reduction of about 27%.
ii.
A method for siting and sizing PV DGs that considers all operating and technical constraints posed by AC grids within an environment of distributed generation.
iii.
A new methodology that allows evaluating multiple PV power technologies, electrical systems, and power demand and generation scenarios with short processing times and guarantees standard deviation values lower than 0.26%. This methodology will allow electrical companies to provide multiple electrical designs in the periods of time set by both public and private contracts.

1.4. Structure of the Paper

This paper consists of six sections. Section 1 provides an introduction to the subject matter. Section 2 introduces the set of equations that compose the mathematical model that represents the problem under study. Section 3 describes the discrete–continuous optimization methodology proposed here to solve the problem of optimally integrating PV DGs into electrical networks. Section 4 presents the test systems, methods used for comparison, and aspects considered to evaluate the effectiveness, repeatability, and robustness of the proposed methodology. Section 5 analyzes and discusses the simulation results. Finally, Section 6 draws the conclusions and outlines future lines of work.

2. Mathematical Formulation

This section presents the mathematical model of the problem of optimally locating and sizing PV DGs into AC networks, whose aim is to reduce the associated investment, maintenance, and energy purchase costs. This mathematical model only considers the active power injected by the PV DGs installed in the electrical network, as is customary in the literature [5].
PV units were chosen as the distributed generation technology for this mathematical formulation because they are the most widely used distributed generation technology around the world. This is because it has demonstrated the best growth in terms of performance and integration complexity in recent decades and has led to reductions in investment and maintenance costs over time [27]. Additionally, we selected an objective function based on financial aspects: the need to minimize the operating costs of electrical networks and to cover the investment costs associated with PV technologies [28]. The next sub-section describes the mathematical formulation employed in order to address the problem of optimal placement and sizing of renewable energy sources based on PV generators for distribution system applications.

2.1. Objective Function

The mathematical structure of the objective function that represents the problem of the optimal integration of PV generation sources in distribution grids is presented in Equation (1).
O F = min f 1 + f 2
Note that the proposed objective function in (1) is composed of two components, i.e., the annual investment ( f 1 ) and the operating costs of the electrical network ( f 2 ). The components of the objective function and the multiplying factors are presented from (2) to (5).
f 1 = C k W h T F a F c i Ω H i Ω N p i , h c g Δ h
Equation (2) presents the function that can be used to calculate the costs of the energy purchased or produced by the conventional generators installed in the electrical network during the useful life of the PV DGs. In this equation, C k W h represents the costs (per kWh) of the energy purchased or produced by the conventional generators. Since the model works with annual values, and the aim is to estimate the total energy purchase or production costs over a year of operation, parameter T in this equation denotes the number of days in an ordinary year (i.e., 365 days). Moreover, p i , h c g is the active power supplied by each conventional generator installed at bus i during time period h, and Δ h is the time during which power is supplied by the generator located at bus i.
F a = t a 1 ( 1 + t a ) N t
F c = t T 1 + t e 1 + t a t
To annualize the costs of the energy purchased during the useful life of the PV DGs, we used two annuity factors. The first factor ( F a ), which is described in Equation (3), integrates the energy purchase costs per year during the useful life of the PV DGs. In this equation, t a denotes the fixed return rate on the investments made by the owner or operator of the network over the planning horizon, and N t is the number of years that the project lasts. The second factor ( F c ), which is presented in Equation (4), represents the annual increase in power demand during the planning horizon. In (4), t e denotes the percentage rise in energy purchase costs during the planning horizon. Finally, Ω N , Ω H , and Ω T are the set of buses in the electrical system, the time periods analyzed in a one-day operation, and the number of years in the useful life of the PV DGs, respectively.
f 2 = C p v F a i Ω p v p i p v + T i Ω H i Ω p v C O a n d M p v p i , h p v Δ h
Equation (5) can be employed to calculate the annual investment costs associated with the installation of the PV DGs in the electrical network, as well as their maintenance costs. In this equation, C p v denotes the cost per kW for the PV DGs; p i p v , the total PV power integrated into the electrical network; C O a n d M p v , the maintenance costs per kW produced by the PV DGs. In addition, Ω p v is the set that contains all the buses where the DGs were installed.

2.2. Set of Constraints

The proposed mathematical model considers all the constraints associated with the operation of an electrical network in a PV distributed generation environment. The equations that represent the technical and operating conditions of a network are presented from (6) to (13) and are described below.
p i , h c g + p i p v C h p v P i , h d = v i , h j Ω N Y i j v j , h cos θ i , h θ j , h φ i j
q i , h c g Q i , h d = v i , h j Ω N Y i j v i , h sin θ i , h θ j , h φ i j
P i c g , min p i , h c g P i c g , max
Q i c g , min q i , h c g Q i c g , max
x i p i p v , min p i p v x i p i p v , max
i Ω p v x i N p v a v a i l
v i min v i , h v i max
I i j , h I i j max
Equation (6) represents the overall active power balance. In this equation, P i , h d denotes the active power demanded at bus i in time period h. v i , h and v j , h are the voltage profiles at buses i and j in time period h, while θ i , h and θ j , h are the angles of such voltage profiles in the same time period. Y i j and φ i j denote the magnitude and angle, respectively, of the admittance of the line that connects buses i and j.
Equation (7) represents the overall reactive power balance. In this equation, Q i , h d is the reactive power demanded by the load connected at bus i in time period h; q i , h c g , the reactive power injected by the conventional generator at bus i in time period h.
Equation (8) presents the minimum and maximum active power to be supplied by the conventional generators to the electrical network. In this equation, p i c g , min and p i c g , max are the minimum and maximum active power that can be delivered by the conventional generator located at bus i, respectively. Meanwhile, Equation (9) represents the minimum and maximum reactive power to be supplied by the conventional generator located at bus i. In this equation, q i c g , min and q i c g , max denote the minimum and maximum reactive power that can be delivered by this generator.
Equation (10) defines the minimum ( p i p v , min ) and maximum ( p i p v , max ) power to be supplied by the PV DG located at bus i. In this equation, x i is the binary variable associated with the installation ( x i = 1 ) or not ( x i = 0 ) of a PV DG at bus i. v i min and v i max denote the voltage regulation bounds allowed at bus i.
Equation (11) establishes the maximum number of PV DGs ( N p v a v a i l ) available to be integrated into the electrical network. Finally, Equations (12) and (13), which represent the voltage and current limits allowed for the electrical network, can be used to evaluate the impact of distributed generation on the operating conditions of the network. In these equations, v i min and v i max are the minimum and maximum voltage profiles allowed at bus i, while I i j , h and I i j max denote the estimated and maximum current, respectively, allowed at the line that connects buses i and j.
The parameters used in the proposed mathematical formulation to calculate the annual investment and operating costs are presented in Table 1 and were taken from [3]. The parametrization of the test feeders used for numerical validations in this research are described in Section 4.

3. Proposed Methodology

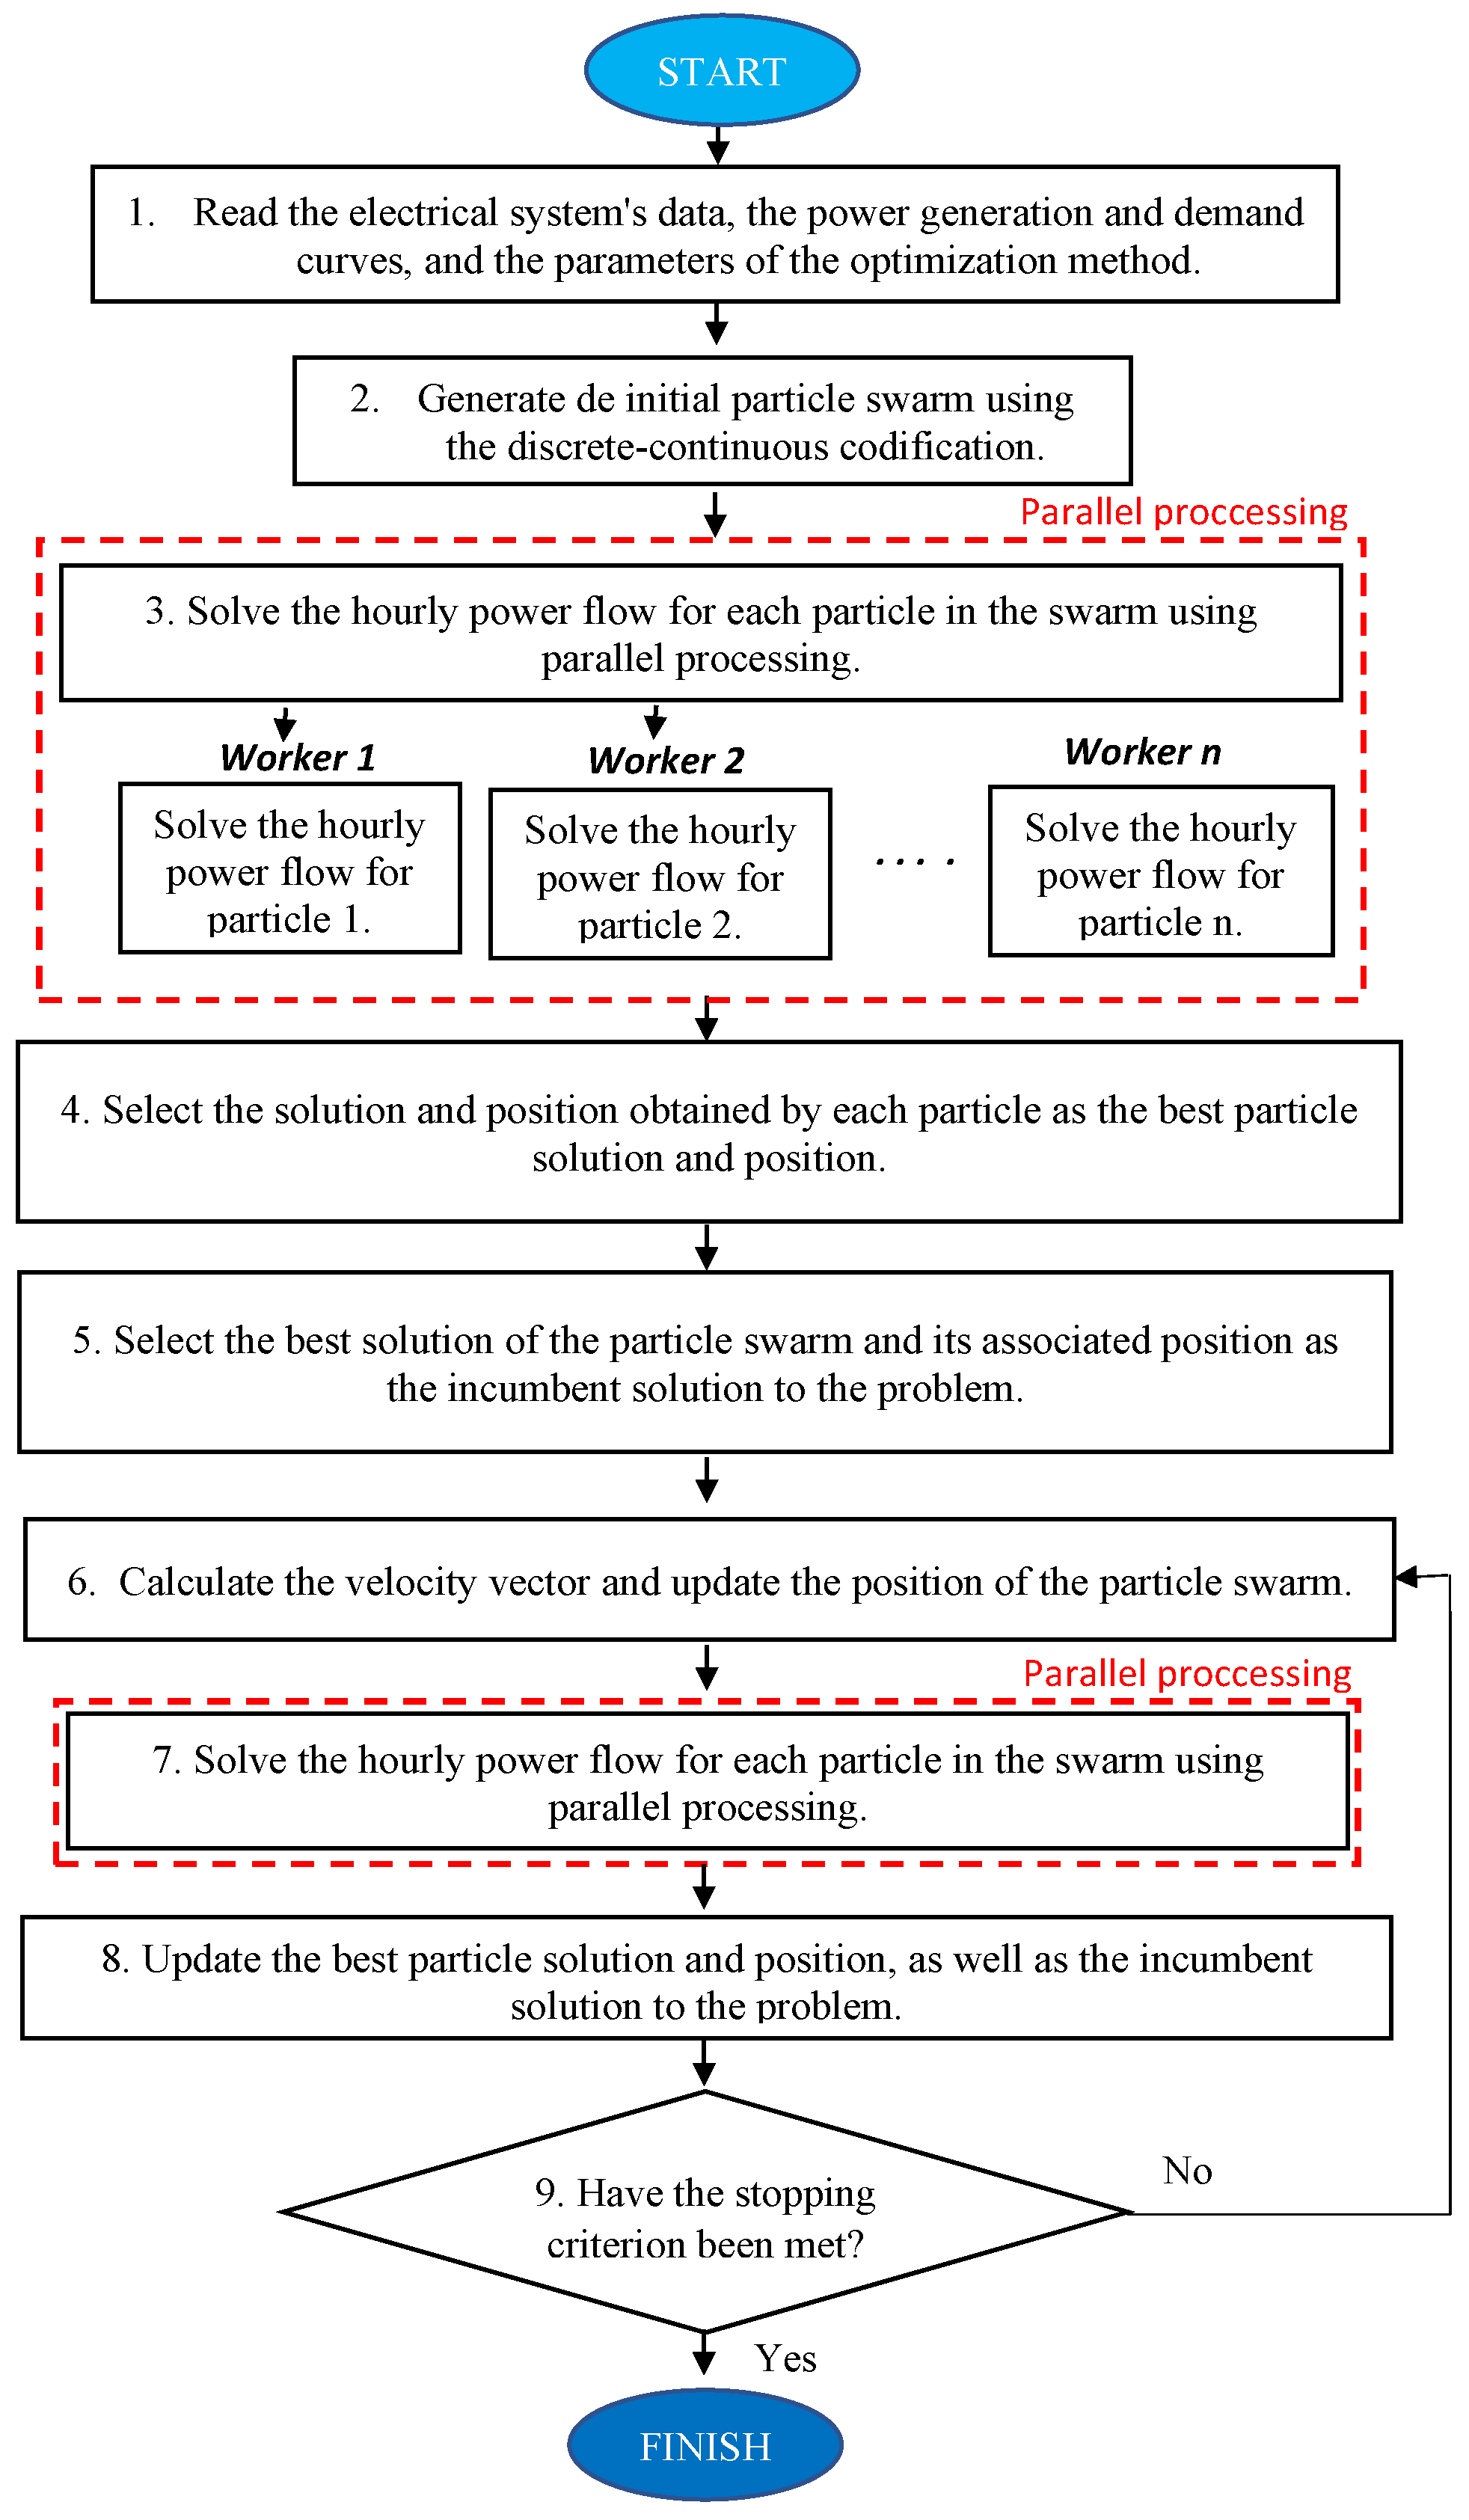
This manuscript presents a new methodology for solving the problem of optimally locating and sizing PV DGs in AC and DC networks. This methodology uses a discrete–continuous codification and parallel processing to improve the trade-off between quality of the solution, processing time, and repeatability of the obtained solution every time it is executed. The proposed methodology, which corresponds to a new discrete–continuous parallel version of the PSO algorithm, is presented in Figure 2 and described below.
The proposed methodology consists of ten steps, which can be used to find a solution to the problem of optimally locating and sizing PV DGs in AC and DC current networks to reduce annual investment and operating costs. In step 1, the electrical system’s data, the power generation and demand curves, and the parameters of the optimization methods are loaded.
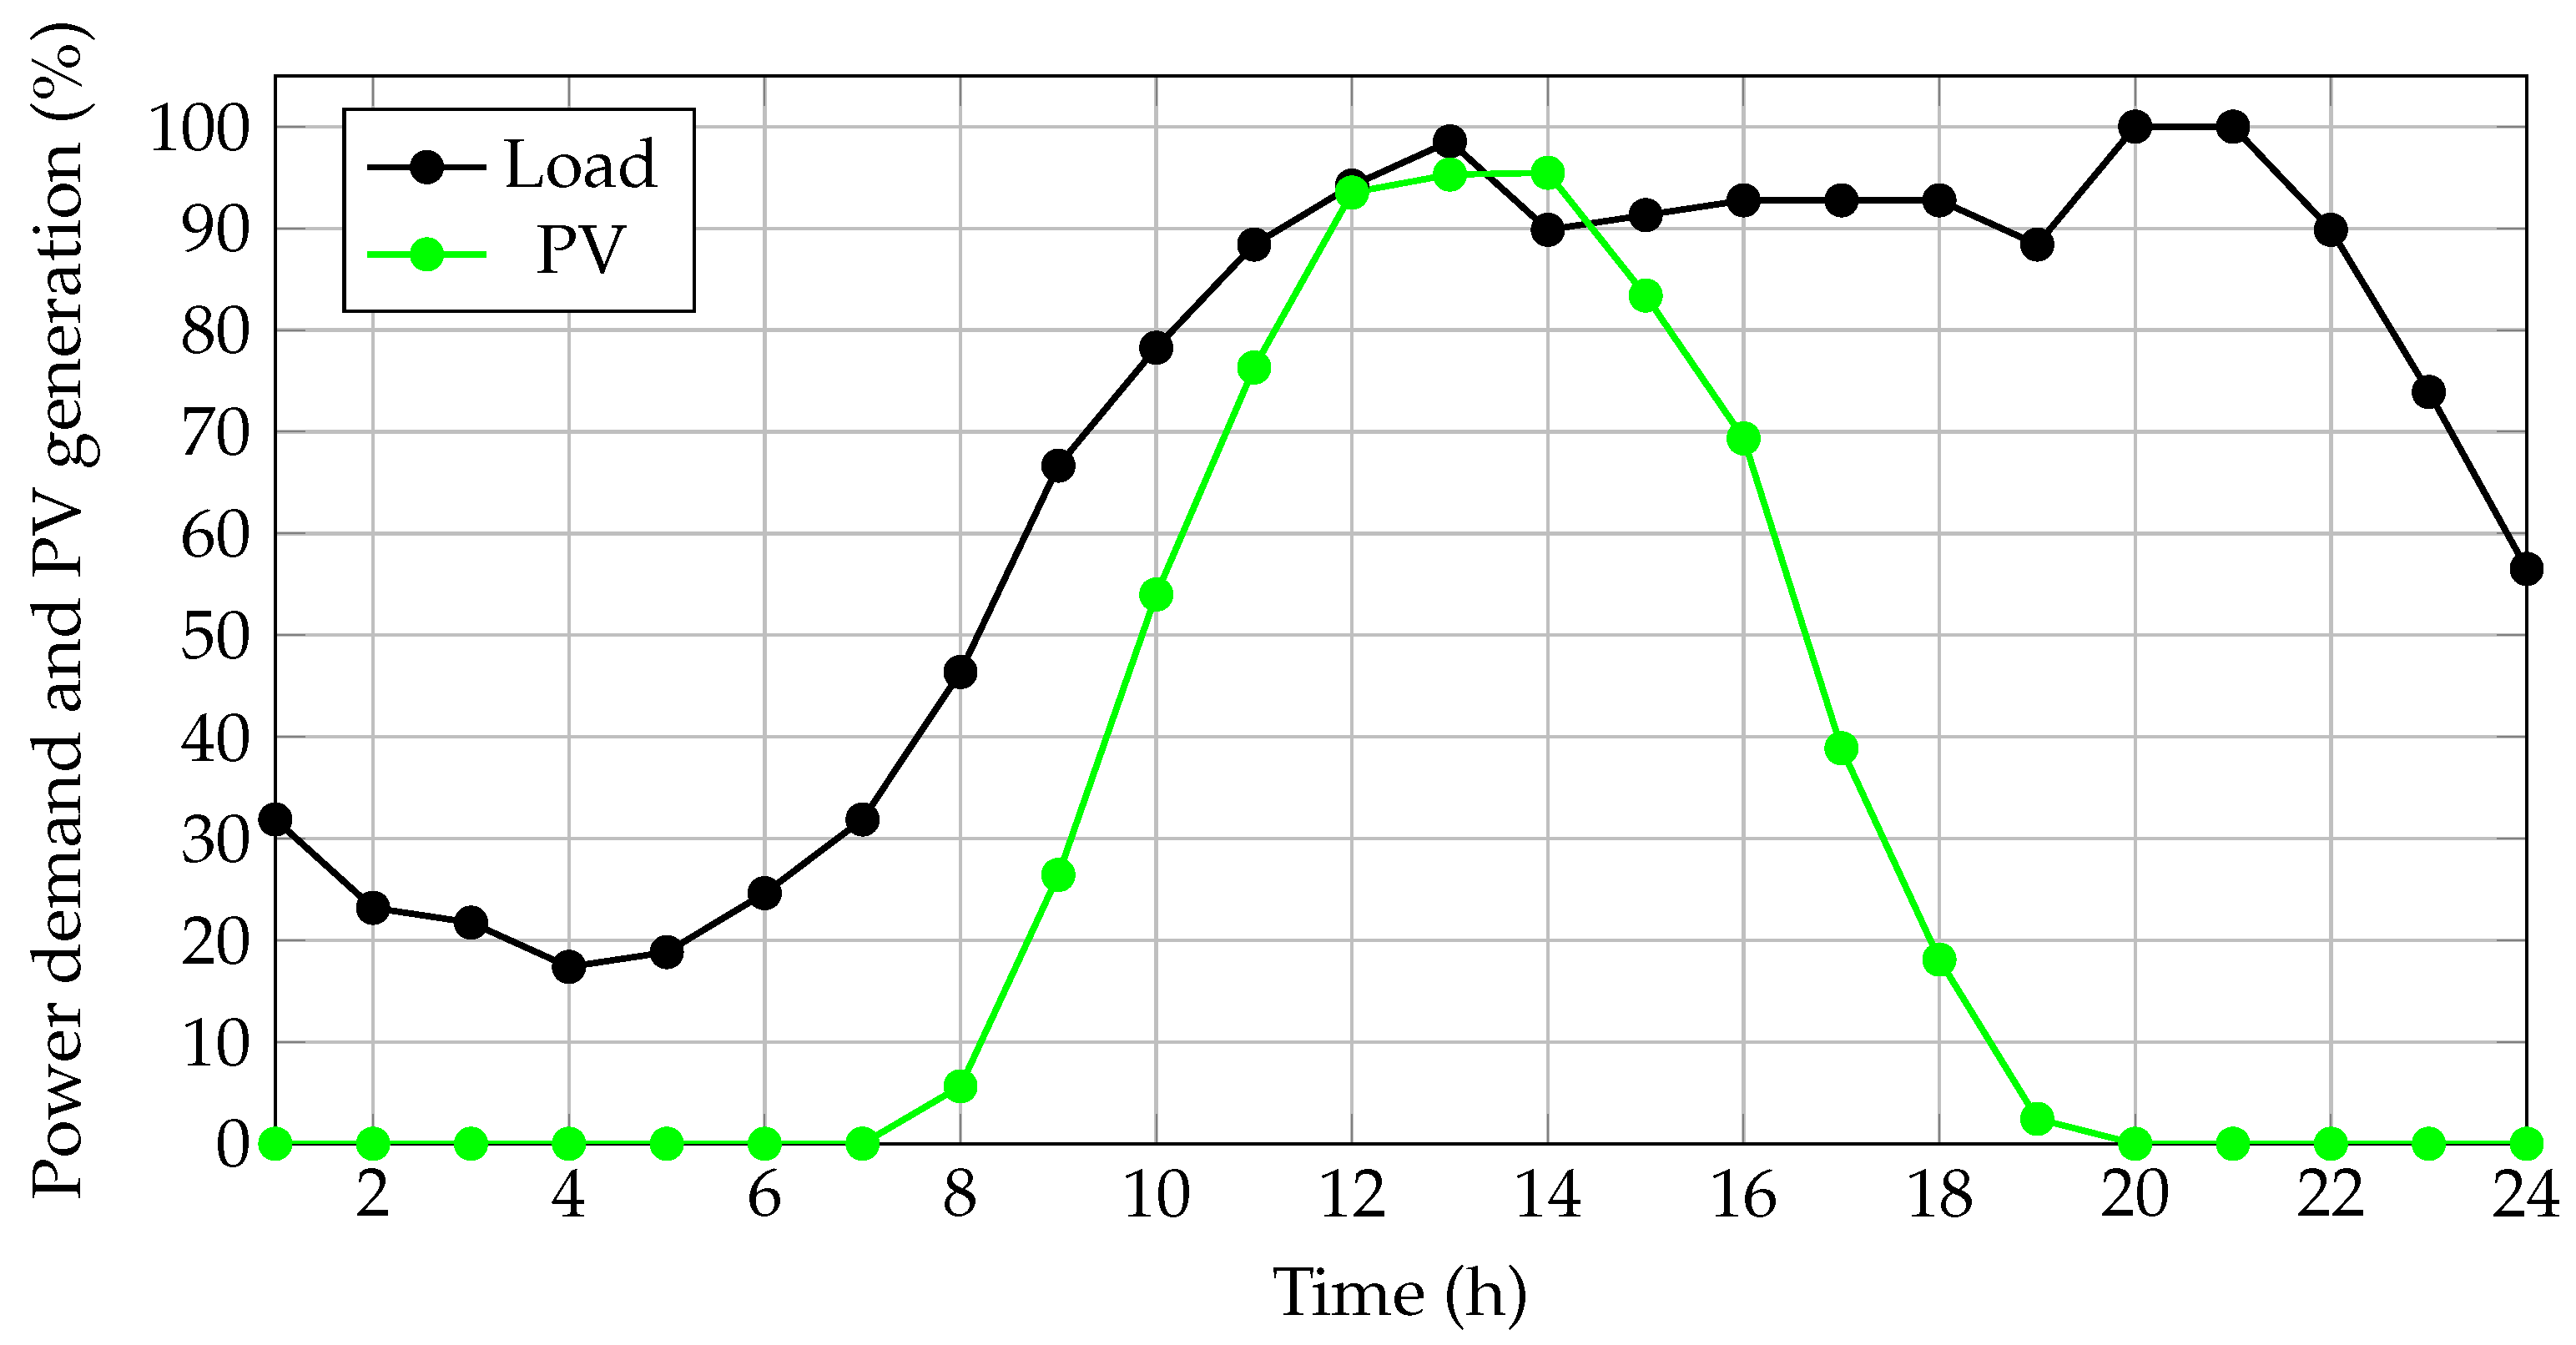
In this work, we employed two curves that depict the typical behavior of PV generation and power demand in a region of Colombia during a normal day (see Figure 3) [19]. Such curves were selected with the intention of including, in the operating costs, the variations in PV generation and power demand, which allows the problem under analysis to be represented in a more realistic manner. It is important to highlight that, when these average curves were obtained by the referenced authors, with the aim to represent the energetic behavior in a particular region of Colombia, they considered the uncertainties in power demand and generation associated with both the users and the PV generators (radiance and temperature).
The DCPPSO was tuned using the PSO algorithm [23], and the following parameters were obtained: a cognitive and social component of 1.93 and 1.79, respectively; a maximum and minimum velocity of 0.1 and 0.1 , respectively; a range of inertia between 0.7 and 0.001; a maximum number of iterations of 219; a maximum number of non-improvement iterations of 50.
In step 2, the initial particle swarm is generated using the discrete–continuous codification presented in Figure 1c. Since the traditional PSO algorithm works with continuous variables, the variables associated with the location of the PV DGs must be discretized, guaranteeing at all times that the maximum number of buses in the electrical system under analysis is respected. The variables associated with the sizing of the PV DGs are created in the traditional manner, according to the power limits set for these devices (see Equation (10)).
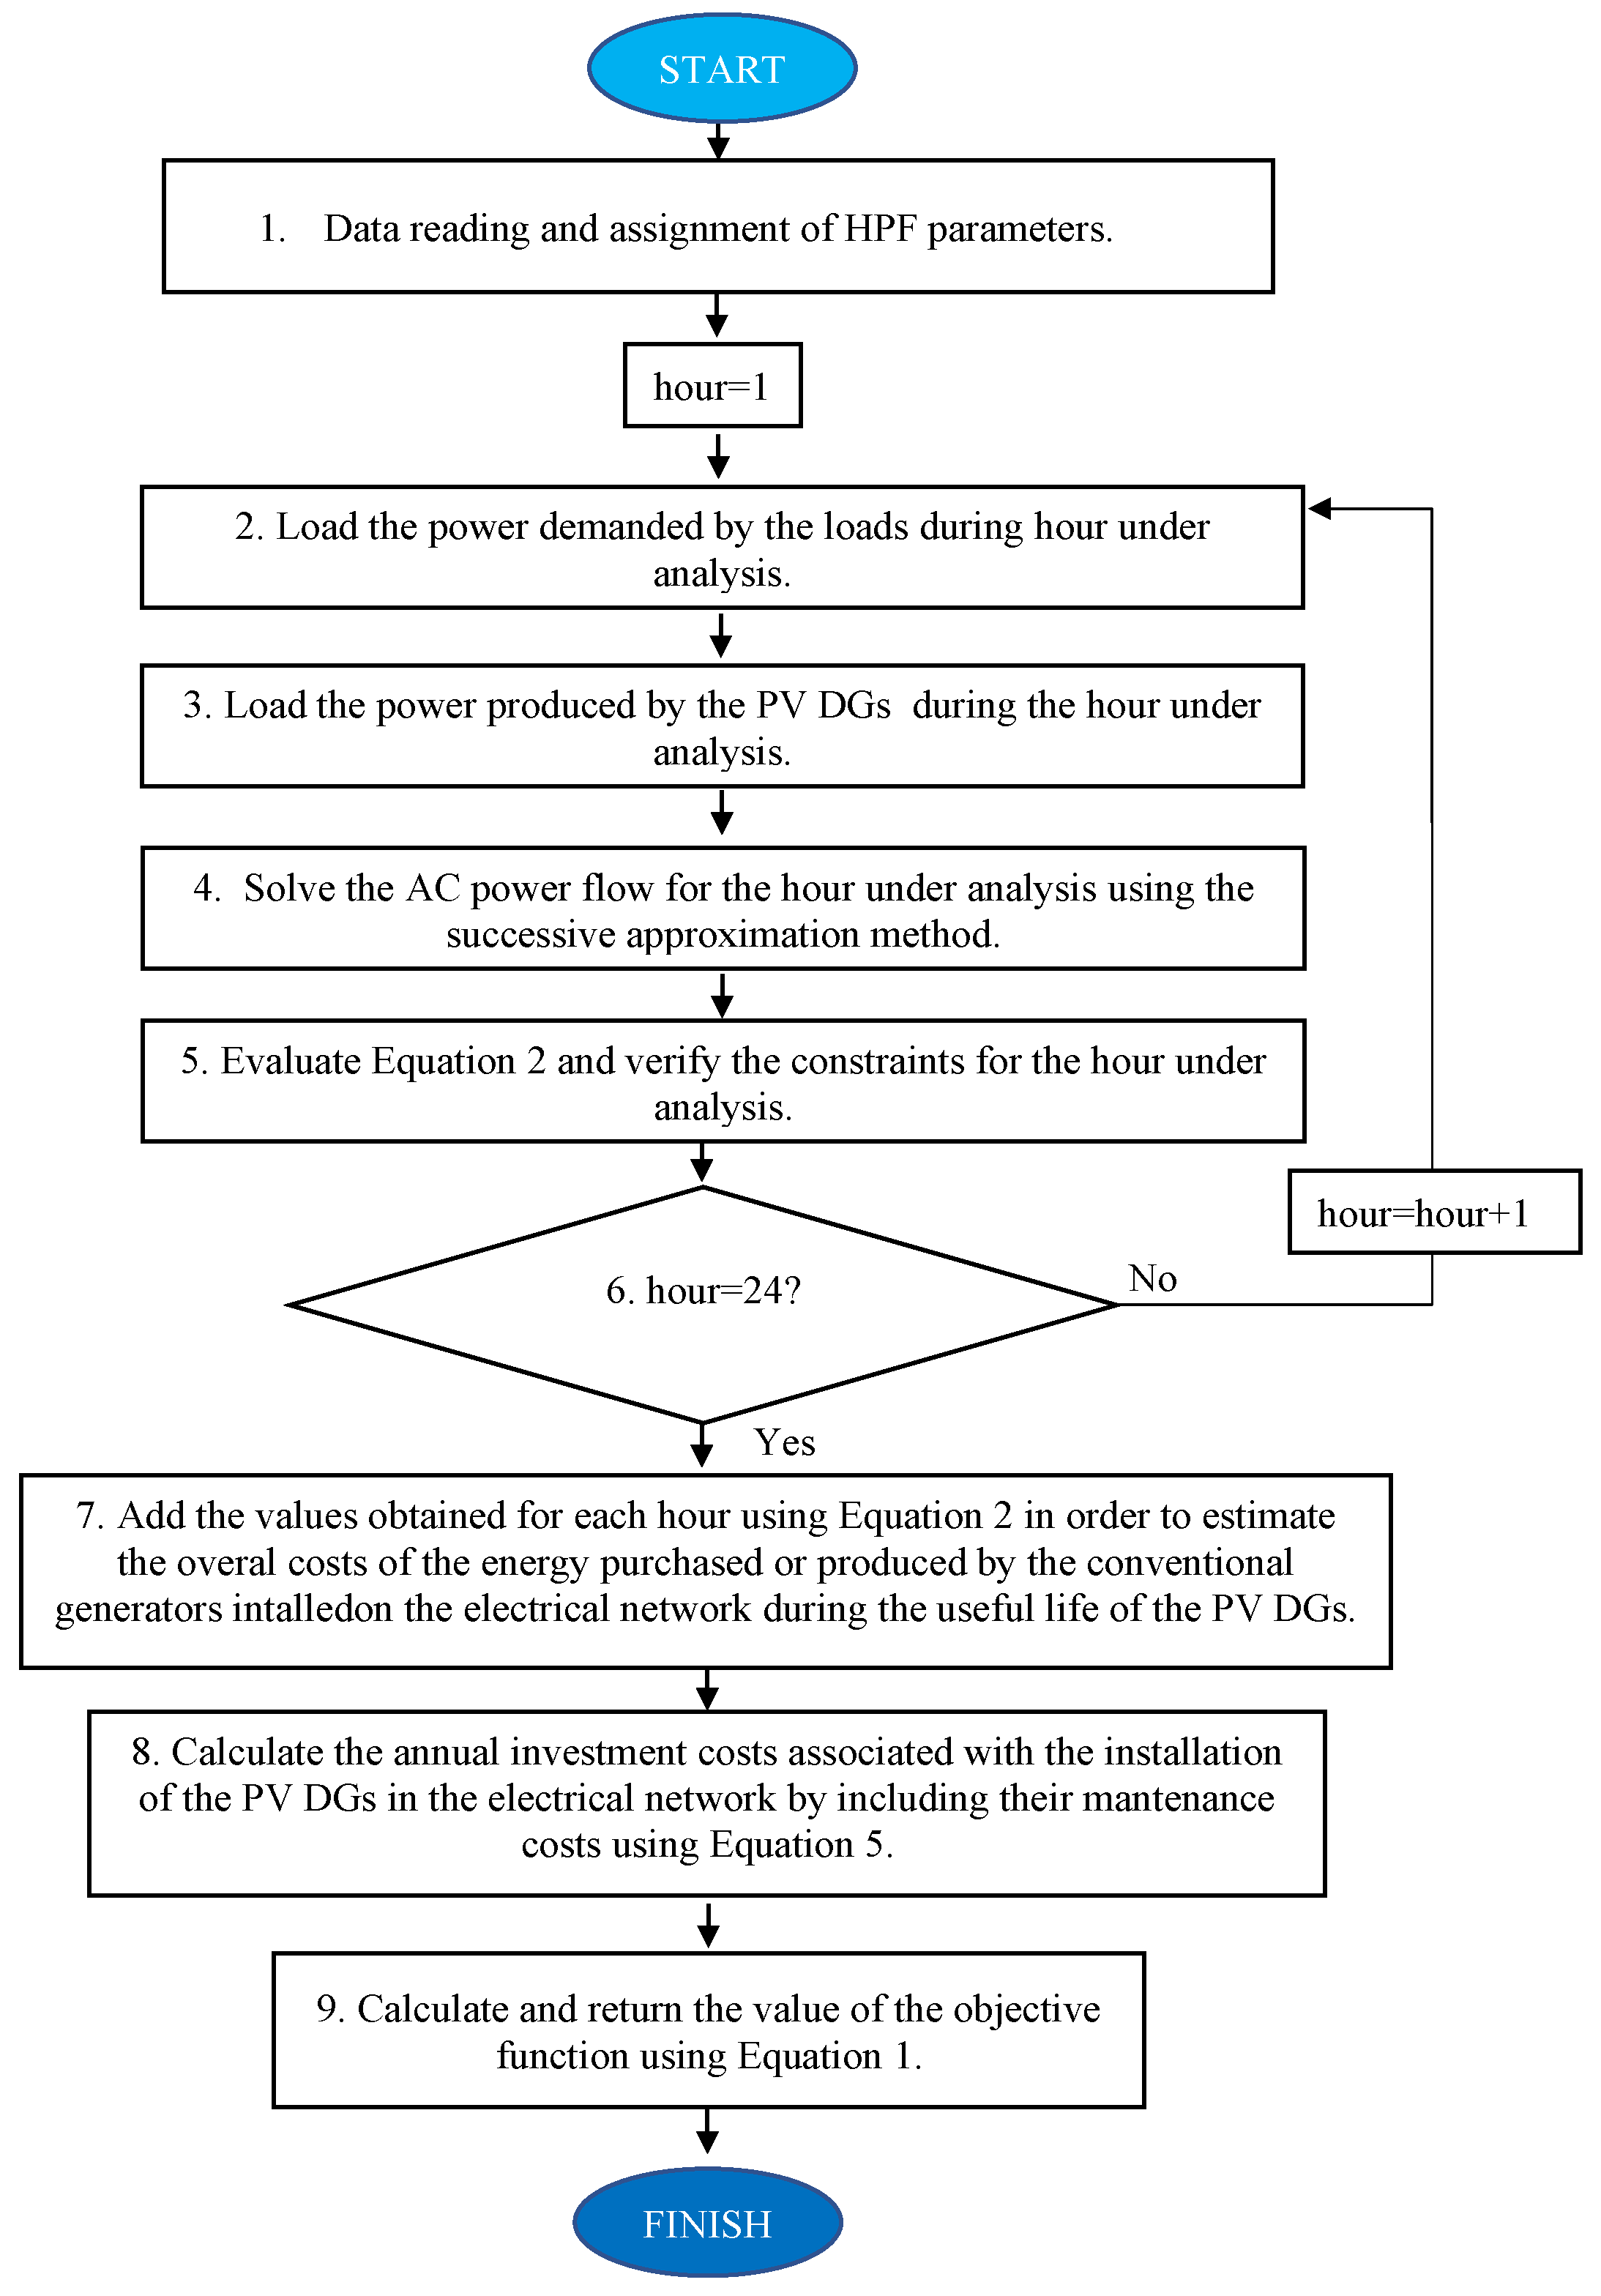
In step 3, the Hourly Power Flow (HPF) is solved for each particle in the swarm using parallel processing in order to evaluate the objective function and the set of constraints. This power flow is responsible for assessing the energy purchase costs associated with the behavior of the power demand and PV generation during a normal day, as well as the investment in the PV DGs and their maintenance costs. The aim is to estimate the annual costs of these expenses over the planning horizon determined by the useful life of the PV DGs. To that end, we used an adapted version of the power flow method reported in [29], which employs successive approximations to calculate the voltages at the load terminals. In such adapted version, the location and sizing of the PV generators proposed by each particle in the swarm is assessed, taking into account the variation in power demand and PV generation in each period of the time horizon (24 h).
Figure 4 describes the HPF process implemented in this research to evaluate the objective function of the problem under analysis. The algorithm starts by reading the electrical data (buses, lines, etc.) and power flow parameters (number of iterations, convergence error, and initial voltages). Then, the data on the power demanded by the loads and the power produced by the PV DGs every hour in the time horizon (24 h, i.e., a one-day operation) are loaded. These data are employed in the HPF to solve the power flow problem using the power flow method based on Successive Approximations (SA) [29]. Then, the HPF evaluates Equation (2) and validates the constraints for each hour in the period of analysis. This process is repeated until all hours in the time horizon (24 h, in this case) have been evaluated. Subsequently, the values obtained for each hour using Equation (2) are summed to calculate the overall costs of the energy purchased or produced by the conventional generators installed in the electrical network during the useful life of the PV DGs. Afterward, the annual investment costs associated with the installation of the PV DGs in the electrical network are estimated by including their maintenance costs using Equation (5). Finally, the value of the objective function is calculated and stored using Equation (1).
Step 3 is the step of the algorithm that takes up the majority of the total processing time. For this reason, and in order to improve the performance of the proposed methodology, we used parallel processing. This tool allowed us to simultaneously evaluate multiple individuals in the population and, thus, reduce the time required by step 3. Equation (14) can be used to calculate the processing time required to evaluate the entire particle swarm using parallel processing, i.e., the Parallel Processing Time (PPT). In this equation, n denotes the number of particles in the swarm; W, the number of workers in the computer; and M T P R , the longest time required to evaluate all the particles using parallel processing [30]. Moreover, function C E I L in this equation makes it possible to obtain the integer of the ratio between the number of particles (n) and the number of workers (W); this in order to determine the number of times that the M T P R is required depending on the n and W selected or used.
P P T = C E I L ( n / W ) · M T R P
The remaining steps of the DCPPSO method are similar to those in the conventional PSO algorithm. In step 4, the solution and position obtained by each particle in the swarm is chosen as the best particle solution and position. In step 5, the best solution of the particle swarm and its associated position is selected as the incumbent solution to the problem. In step 6, the velocity vector is calculated, and the position of the particle swarm is updated. In step 7, the HPF is solved for each particle using parallel processing. In step 8, the best particle solution and position are updated, as well as the incumbent solution to the problem. In step 9, the stopping criteria defined for the DCPPSO algorithm are evaluated. In this case, we used the maximum number of iterations and the maximum number of non-improvement iterations as the stopping criteria. If the stopping criteria are met, the DCPPSO algorithm stops; otherwise, it begins another iteration starting from step 6.

4. Test Systems, Methods Used for Comparison, and Considerations

4.1. Test Systems

Two of the most widely used test systems in the specialized literature were employed in this document in order to evaluate the effectiveness and robustness of the solution methodologies proposed to solve the problem of integrating DGs into electrical networks: the 33- and 69-bus test systems [10,31]. The next sub-sections describe both test systems.

4.1.1. 33-Bus Test System

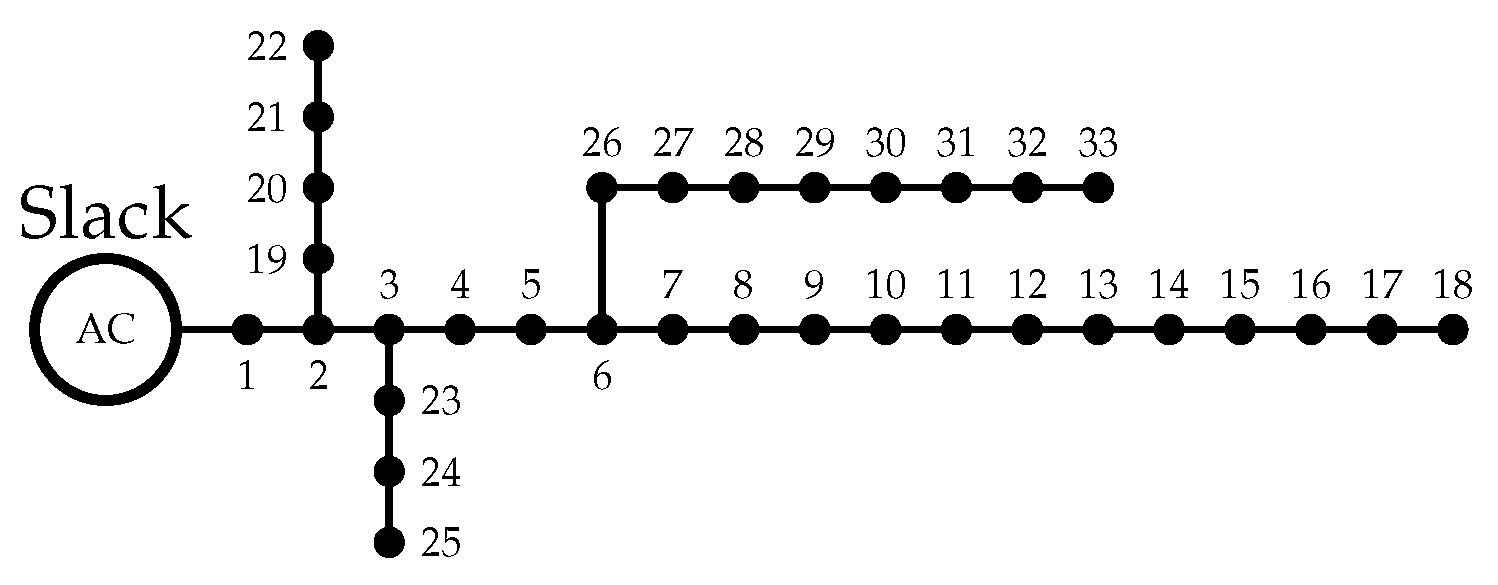
This test system is a radial distribution network that consists of 33 buses and 32 lines. The schematic configuration of the IEEE 33-bus grid is depicted in Figure 5.
Table 2 presents the electrical parameters of this test system. From left to right, this table specifies the sending bus (bus i), the receiving bus (bus j), the resistance and admittance of the line that connects buses i and j, and the active and reactive power demanded at node j. This test system uses a base power of 100 kw and a base voltage of 12.66 kV. To ensure a secure operation of the distribution network, the voltage limits were set to ± 10 % of the nominal voltage, and a maximum current of 380 A was considered, which is associated with the use of a 400-kcmil electrical conductor. We used the same electrical conductor for all the lines (a nontelescopic topology). This maximum current value was obtained by running a power flow at the hour of peak power demand, without considering the DGs installed in the electrical system.

4.1.2. 69-Bus Test System

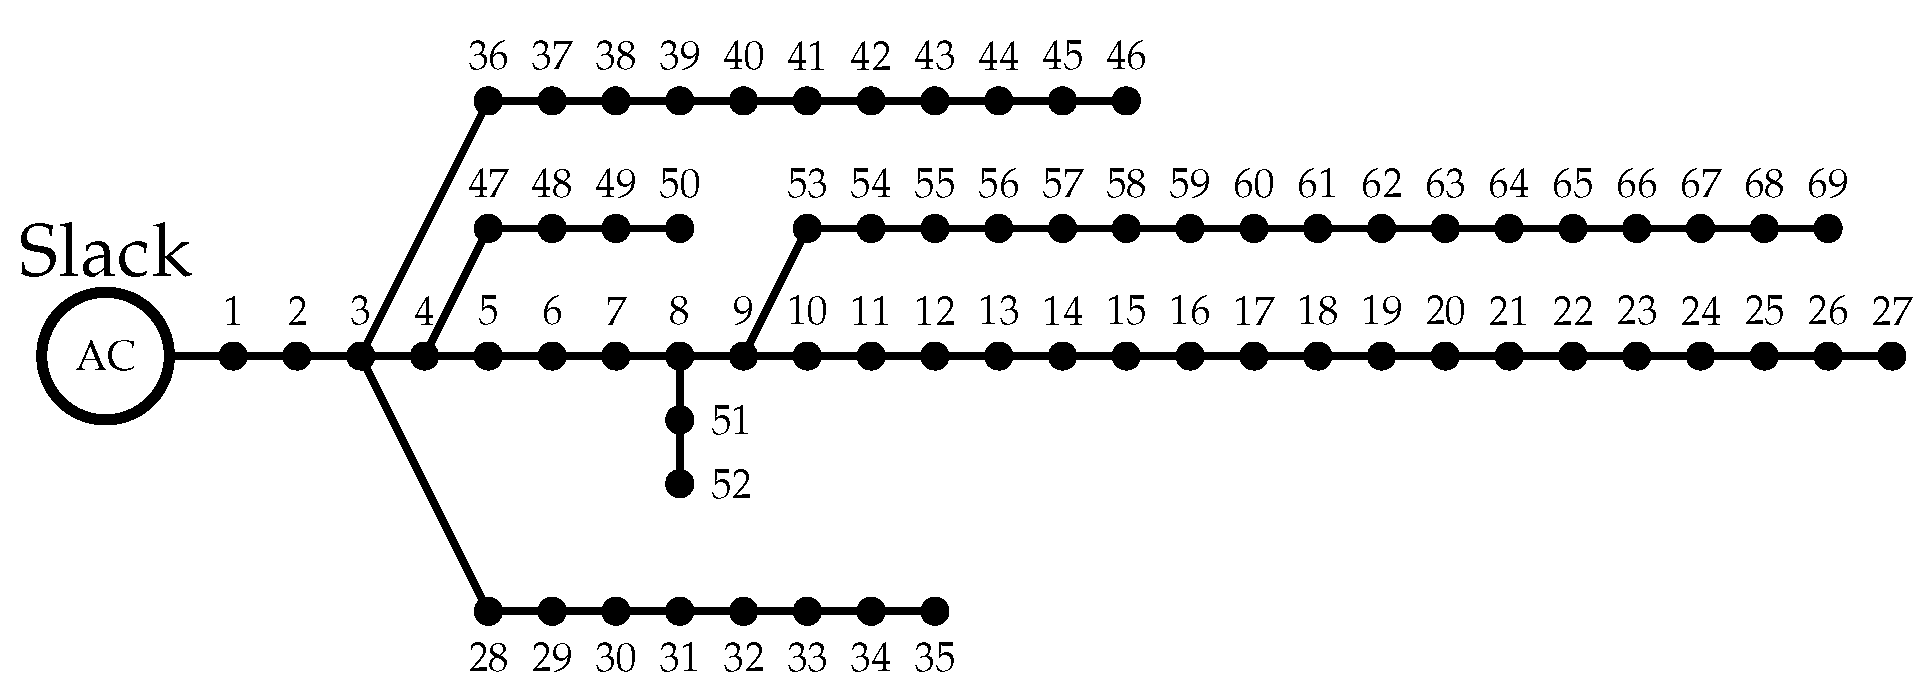
This test system consists of 69 buses and 68 lines. Its electrical diagram is illustrated in Figure 6, and its electrical parameters, which are described in [10], are presented in Table 3.
The same base power, base voltage, and voltage limits used for the 33-bus were employed in 69-bus test system. By using these values, we obtained a maximum current for this test system of 430 A, which is associated with the use of a 500-kcmil conductor. This maximum current value was obtained by running a power flow at the hour of peak power demand, without considering the DGs installed in the electrical network.

4.2. Methods Used for Comparison

To compare our proposed solution methodology, the following five optimization methods were employed (some based on commercial software and some on sequential programming): the BONMIM solver of the GAMS, the Discrete–Continuous version of the Chu and Beasly Genetic Algorithm (DCCBGA) [19], the discrete–continuous version of the Newton Metaheuristic Algorithm (DCNMA) [21], the Discrete–Continuous version of the Vortex Search Algorithm (DCVSA) [3], and the Discrete–Continuous version of the Generalized Normal Distribution Optimization (DCGNDO) method [5]. These methodologies were selected because they are the most widely used in the specialized literature and have yielded excellent results in terms of the quality of the solution, repeatability, and processing times. Moreover, the studies in which such solution methodologies were introduced employed the same test scenarios and mathematical model as those presented in Section 2 of this manuscript.

4.3. Considerations

The following are the main aspects considered in order to find a solution to the problem under analysis and assess the effectiveness of the DCPPSO:
  • The maximum number of DGs to be integrated into the electrical network was three, and their power limits were set to 0–2.4 p.u. [3].
  • The parameters of the DCPPSO, as well as the power generation and demand curves used for all comparison methodologies were as described in Section 3.
  • The parameters employed for the successive approximation power flow method used in the HPF were taken from [29].
  • With the aim to test the methods used for comparison, the optimization parameters were employed as reported by their authors. These used tuning methodologies to find the computational parameters for each solution methodology, thus allowing to obtain the best performance in terms of the quality of the solution and processing times.
  • In order to assess the repeatability and precision of the studied solution methodologies, each of them was executed 100 times, evaluating the obtained standard deviation and mean values.
  • All simulations were performed using Matlab 2020 in a Dell Precision T7600 Workstation with an Intel(R)Xeon(R) CPU ES-2670 @ 2.50 GHz processor and 32 GB of RAM.

5. Simulation Results

This section presents all the numerical validations for the proposed and comparison optimization methods in both test feeders.

5.1. 33-Bus Test System

Table 4 shows the results obtained by each solution methodology in the 33-bus test system. From left to right, this table details the solution methodology implemented, the buses where the PV DGs were located and their installed nominal power, the annual costs (USD/year) obtained by each solution method and their percentage reduction with respect to the base case (whose values are reported in the second row of the table), the required processing time, the standard deviation obtained after 100 executions, the worst voltage profile, and the maximum current obtained in the time horizon under study.
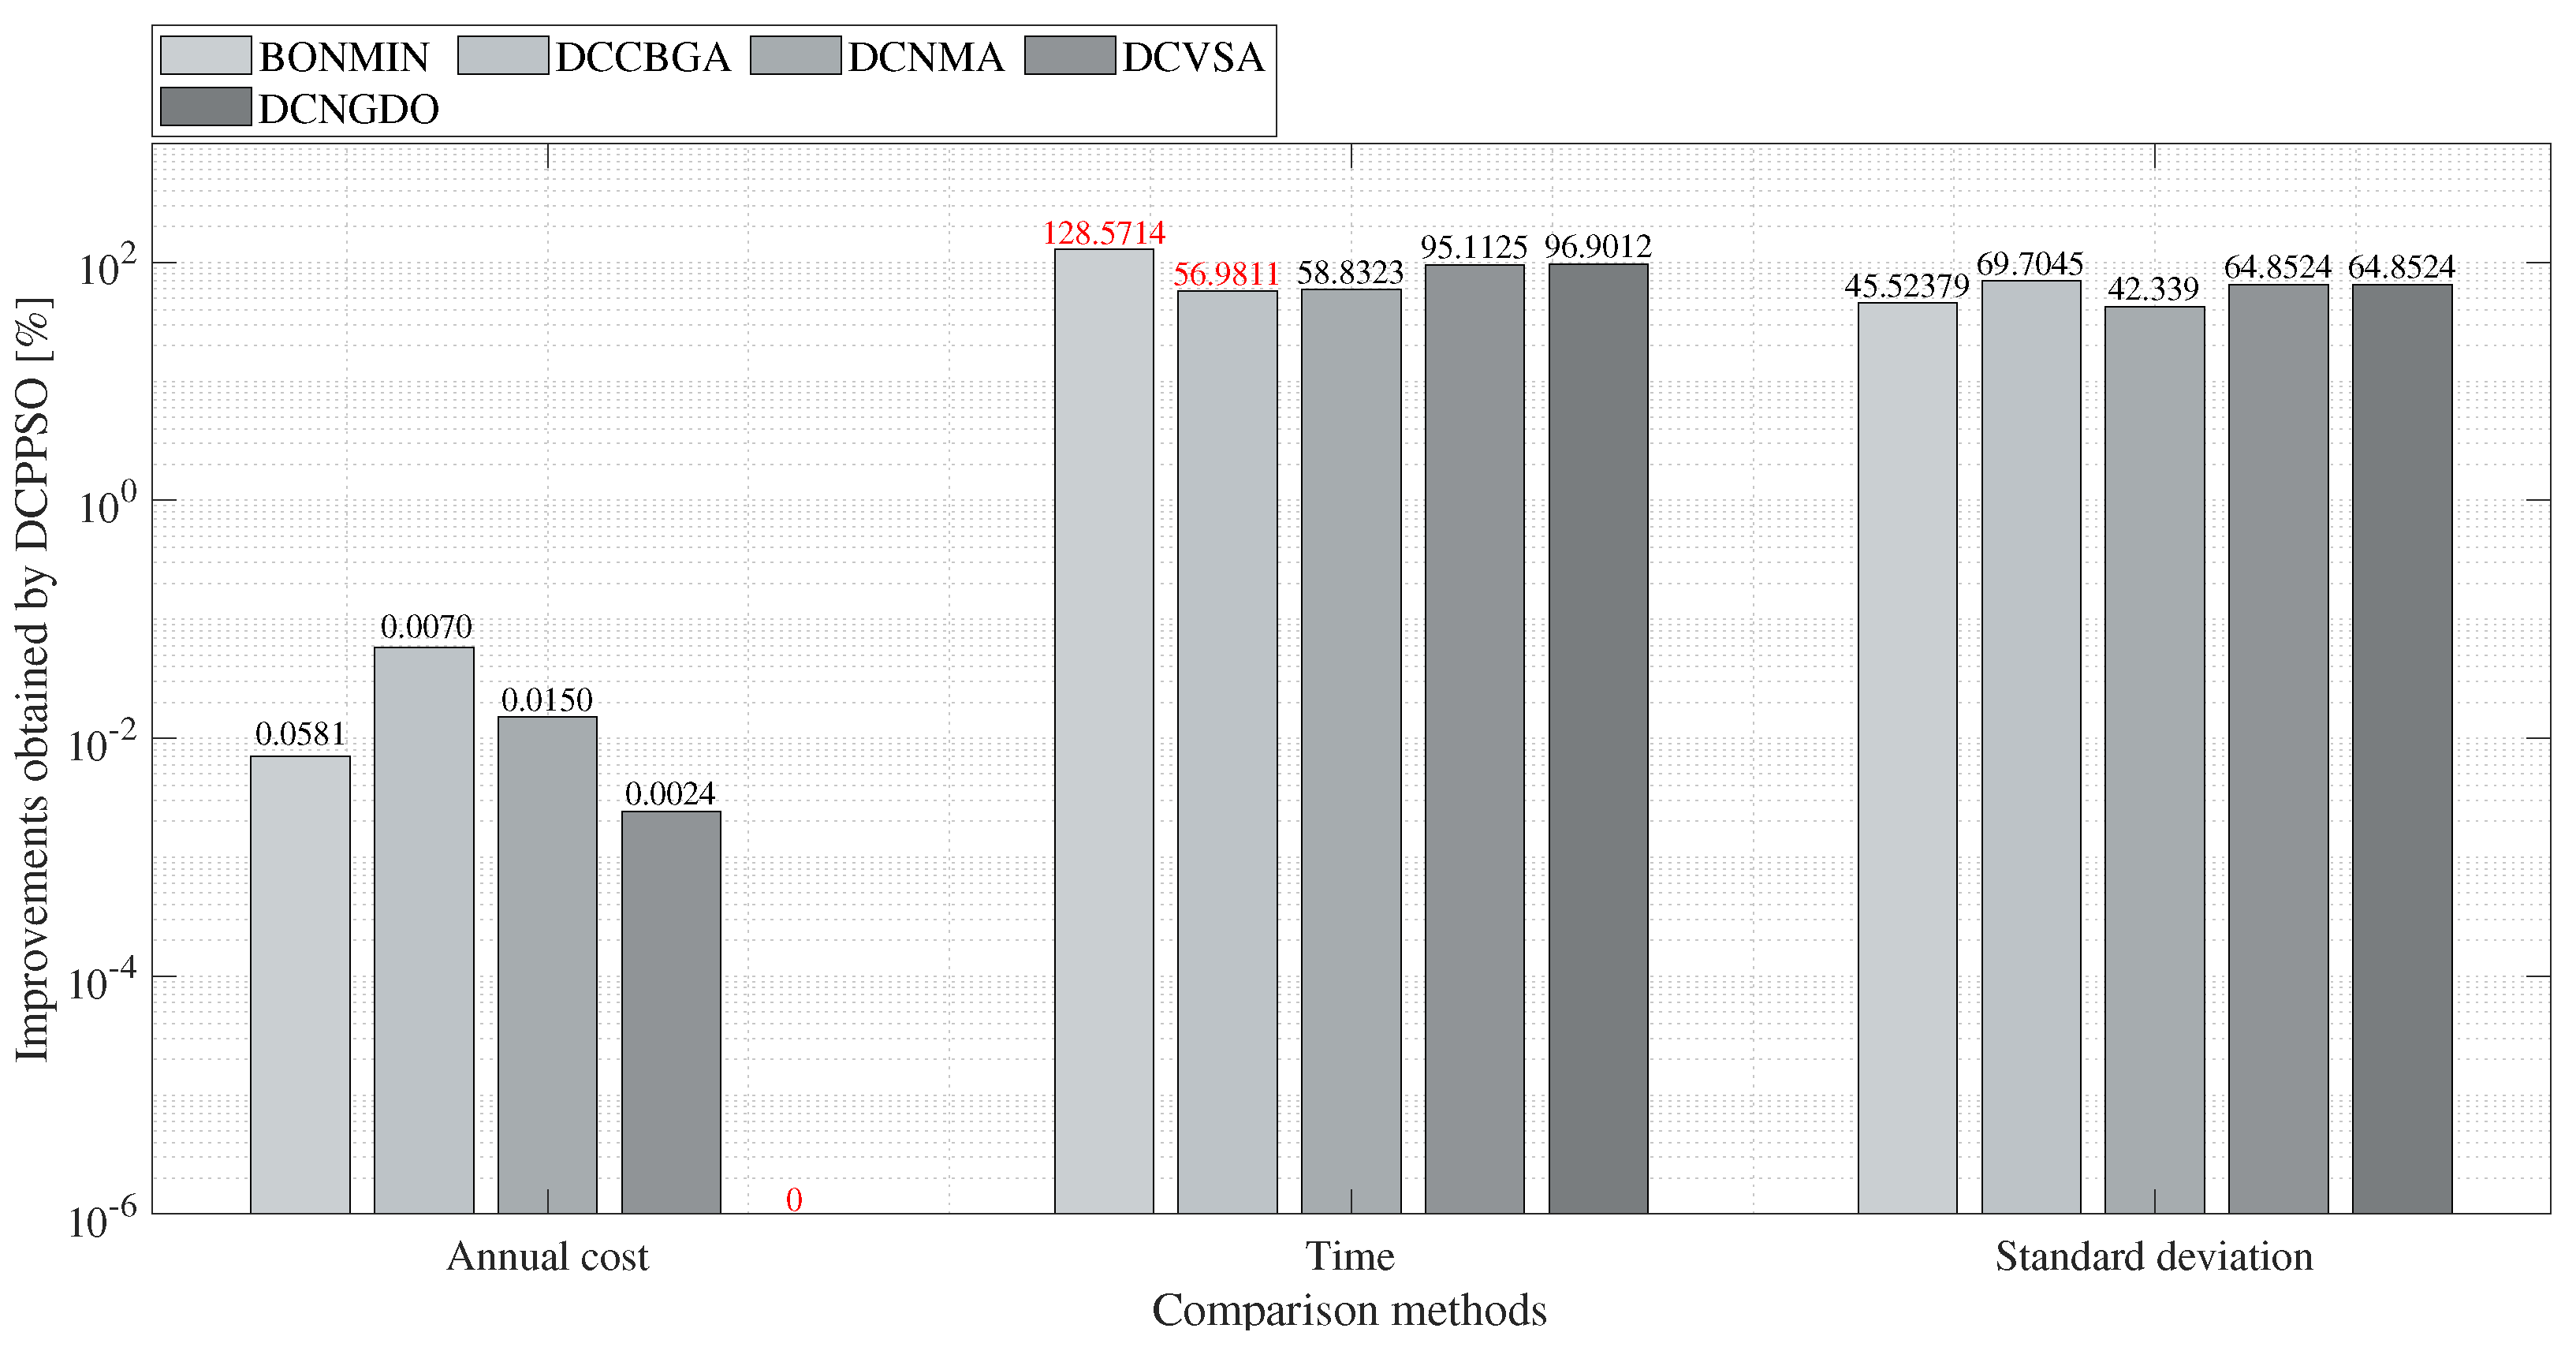
Figure 7 shows the improvements obtained by the DCPPSO with respect to the other solution methods in terms of annual costs, processing time, and standard deviation. Regarding annual costs (annual energy purchase costs plus investment costs), the DCPPSO and the DCGNDO provided the same solution (see Table 4), which is why the improvement obtained by the DCPPSO with respect to the DCGNDO was zero. When compared to the other solution methodologies, these two methods obtained an average reduction in annual costs of 0.0165%, 0.0070%, 0.0581%, 0.0150%, and 0.0024% with respect to the BONMIN solver, the DCCBGA, the DCNMA, and the DCVSA, respectively.
As for processing times, the BONMIN solver and the DCCBGA were faster than the proposed solution methodology, as they reduced processing times by 128.57% and 56.98% with respect to the DCPPSO. However, these two methods produced the worst results in terms of quality of the solution and standard deviation when compared to the DCPPSO. Hence, their improvements in processing times are not considered significant, as both methods show a fast convergence to local optima. When compared to the other solution methodologies, the DCPPSO achieved an average reduction in processing times of 83.61%, with a reduction of 58.83%, 95.11%, and 96.90% with respect to the DCNMA, the DCVSA, and the DCGNDO.
Finally, after analyzing the improvements obtained by the DCPPSO in terms of standard deviation, it was found to be superior to the other methods. It obtained an average reduction in standard deviation of 57.45%, with a maximum and minimum reduction of 60.70% (with respect to the DCCVGA) and 42.33% (with respect to the DCNMA), respectively.
These improvements obtained by the DCPPSO in the 33-bus test system demonstrate its superiority in terms of quality of the solution, processing time, and repeatability. Therefore, the proposed solution methodology is regarded as the best option to solve the problem of optimally integrating PV DGs into electrical networks to reduce annual costs.

5.2. 69-Bus Test System

Table 5, which is organized in the same way as Table 4, presents the simulation results obtained by the solution methodologies in the 69-bus test system. Based on these results, Figure 8 illustrates the performance of the proposed solution methodology when compared to the other methods. Note that this work did not report on the performance of the BONMIN solver in this test system because it was unable to converge to a solution. This is due to the large size of the solution space, as well as the nonlinear and non-convex nature of the problem under study.
When analyzing the results obtained by the DCPPSO in terms of reduction in annual costs, it provided the best results for the 69-bus test system. It showed an improvement of 0.0221%, 0.0372%, 0.0087%, and 2 × 10 6 % with respect to the DCCBGA, the DCNMA, the DCVSA, and the DCGNDP, respectively, for an average improvement of 0.0170%. Hence, it is regarded as the best algorithm to solve the problem of the optimal integration of DGs in the 69-bus test system.
Regarding processing times, the DCCBGA was the fastest of all the methods, with a processing time of 22.36 s. However, this method yielded the worst results in terms of the quality of the solution and its standard deviation values, which is why, when compared to the other methods, it is not considered to be suitable for solving the problem under analysis. The second-fastest method was the DCPPSO (Figure 8), with an average reduction in processing times of 63.24% when compared to the other solution methodologies.
Finally, as for the standard deviation, the DCPPSO obtained the best results, with a maximum reduction of 89.55% (with respect to the DCGNDO) and a minimum reduction of 71.64% (with respect to the DCVSA). It achieved an average reduction of 80.10% when compared to the other methodologies.
According to these results, the DCPPSO performs better than the other methods as the large electrical network increases. It produced the best results in terms of quality of the solution and repeatability, with excellent processing times. Finally, after analyzing the information in columns 6 and 7 of Table 5, all solution methods were found to meet the voltage profile and current limits established for the 69-bus test system.

5.3. Additional Comments

After applying the proposed solution methodology based on DCPPSO to determine the optimal sizes and locations of the PV generation units in radial distribution systems and comparing its results with recently developed literature approaches, the numerical results in the IEEE 33- and 69-node test feeders allowed observing that:
i.
The proposed DCPPSO approach, as well as the compared methodologies, find adequate results for the studied problem, with small differences between them. However, the proposed DCPPSO approach exhibits better optimization properties regarding the ability to find the best solution for both test feeders.
ii.
With regard to the processing times of the proposed and comparison approaches, in the IEEE 33-bus grid, it was evidenced that the solution of the exact MINLP model in the GAMS software with the BONMIN tool has lower processing times when compared to metaheuristic techniques. However, the main problem with this solver is that it is stuck in local optimal solutions, unlike all the metaheuristic-based optimization approaches used for comparison. In addition, in the case of the IEEE 69-bus grid, it was observed that the BONMIN solver does not ensure convergence to any feasible solution, which confirms the high complexity of the exact MINLP model.
iii.
For comparing metaheuristics, a typical approach is based on assessing their numerical performance via standard deviations as presented in Table 4 and Table 5. These results confirmed that the proposed DCPPSO is the most effective metaheuristic-based approach to solve the studied problem. However, in the IEEE 33-bus system, the standard deviation of the BONMIN solver is zero, which is not the case of the DCPPSO. This is an understandable result, since the BONMIN solver deals with the MINLP model by using a combination of the Branch and Bound method with interior points, which implies that, for the same inputs, the results will be the same. However, it does not have the ability to escape from local optimal solutions, unlike the proposed DCPPSO approach. This makes the DCPPSO the best solution alternative for the problem analyzed in this research.
iv.
The numerical performance regarding processing times when comparing the DCCBGA and the proposed DCPPSO showed that, in both test feeders, the first approach takes only a few seconds when compared to our proposal. This situation is explained by the fact that the DCCBGA evaluates the initial population one time, and, at each iteration, only two new individuals are evaluated, i.e., if the population size is N i and the number of iterations is t max , then the total evaluations of the DCCBGA is N i + 2 t max ; whereas our proposal is a population-based approach that evaluates N s individuals in each iteration, which implies, after the search process ends, a total of t max + 1 N s . These evaluations of the potential solutions for both approaches (DCCBGA vs. DCPPSO) clearly demonstrate that the proposed DCPPSO approach requires additional processing times. Nevertheless, this translates into better solutions in comparison with all metaheuristic-based approaches.

6. Conclusions

This work proposed a new methodology for solving the problem of optimally integrating PV DGs into electrical networks to reduce annual costs (including energy purchase and investment costs). The proposed solution methodology uses the Discrete–Continuous Parallel Particle Swarm Optimization method (DCPPSO), which considers both the discrete and continuous variables associated with the location and sizing of DGs in an electrical network. The optimization parameters of the proposed solution methodology were tuned using the PSO algorithm. To validate the performance of the DCPPSO, we employed the 33- and 69-bus test systems and compared it with other five solution methods, one of which uses specialized software and the others employ a discrete–continuous codification.
Regarding the results obtained in the 33-bus test system, the DCPPSO achieved an average reduction in annual costs, processing times, and standard deviation of 0.0165%, 13.0586%, and 57.45%, respectively. This demonstrates its excellent performance in terms of effectiveness and repeatability in small electrical networks. By analyzing the results reported for the 33-bus test system, it is possible to notice that the implementation of metaheuristic algorithms allowed obtaining solutions with an average reduction in annual cost of 0.53% with respect to the commercial software highly used in the literature (the BONMIN solver of GAMS), with a maximum standard deviation value of 0.08%, with the DCPPSO thus being the solution methodology with the best performance. This is due to the fact that the mathematical formulation of the DG location problem includes a non-linearity that prevents exact methods such as the BONMIN solver from obtaining the optimal solution, trapping them in local optima.
As for the 69-bus test system, the authors of this manuscript did not evaluate the performance of the BONMIN solver because it was unable to solve the nonlinear and nonconvex problem associated with this electrical system. This proves that as the size of the electrical system increases, the complexity of the problem under analysis increases too. Regarding the results obtained by the other methods in this test system, the DCPPSO achieved an average reduction in annual costs, processing times, and standard deviation of 0.0170%, 32.56%, and 80.10%, respectively. Hence, the proposed solution methodology presented the best performance and repeatability.
When comparing the results obtained in the 33- and 69-bus test systems, the DCPPSO achieved an average reduction in annual costs, processing times, and standard deviation of 0.0005%, 19.5014%, and 22.65%, respectively. This demonstrates that the larger the solution space, the better the quality of the solution provided by the DCPPSO. Thus, it is possible conclude that the proposed solution methodology is the best option to solve the problem of optimally integrating PV DGs into electrical networks to reduce annual costs.
Future studies should consider using an objective function focused on technical and environmental aspects as well, with the aim of analyzing the financial, technical, and environmental impacts of integrating PV DGs into electrical networks. Furthermore, they could consider integrating energy storage systems in parallel with PV DGs in order to improve the financial impact of distributed generation resources on annual costs and other aspects used as objective functions.

Author Contributions

Conceptualization, methodology, software and writing, revising, and editing the manuscript: L.F.G.-N., O.D.M., E.-J.M.-G., C.A.R.-P. and A.-J.P.-M. All authors have read and agreed to the published version of the manuscript.

Funding

This research was funded by Minciencias through the Fondo Nacional de Financiamiento para la Ciencia, la Tecnología y la Innovación, Fondo Francisco José de Caldas; Instituto Tecnológico Metropolitano; Universidad Nacional de Colombia; and Universidad del Valle under the project entitled “Estrategias de dimensionamiento, planeación y gestión inteligente de energía a partir de la integración y la optimización de las fuentes no convencionales, los sistemas de almacenamiento y cargas eléctricas, que permitan la generación de soluciones energéticas confiables para los territorios urbanos y rurales de Colombia (código: 70634)”, which is part of the research program entitled “ Estrategias para el desarrollo de sistemas energéticos sostenibles, confiables, eficientes y accesibles para el futuro de Colombia ((Código:1150-852-70378, Hermes: 46771))”.

Data Availability Statement

Not applicable.

Conflicts of Interest

The authors declare no conflict of interest.

References

  1. González, D.M.L.; Rendon, J.G. Opportunities and challenges of mainstreaming distributed energy resources towards the transition to more efficient and resilient energy markets. Renew. Sustain. Energy Rev. 2022, 157, 112018. [Google Scholar] [CrossRef]
  2. Al-Shahri, O.A.; Ismail, F.B.; Hannan, M.; Lipu, M.H.; Al-Shetwi, A.Q.; Begum, R.; Al-Muhsen, N.F.; Soujeri, E. Solar photovoltaic energy optimization methods, challenges and issues: A comprehensive review. J. Clean. Prod. 2021, 284, 125465. [Google Scholar] [CrossRef]
  3. Cortés-Caicedo, B.; Molina-Martin, F.; Grisales-Noreña, L.F.; Montoya, O.D.; Hernández, J.C. Optimal Design of PV Systems in Electrical Distribution Networks by Minimizing the Annual Equivalent Operative Costs through the Discrete-Continuous Vortex Search Algorithm. Sensors 2022, 22, 851. [Google Scholar] [CrossRef]
  4. Kandemir, E.; Cetin, N.S.; Borekci, S. A comprehensive overview of maximum power extraction methods for PV systems. Renew. Sustain. Energy Rev. 2017, 78, 93–112. [Google Scholar] [CrossRef]
  5. Montoya, O.D.; Grisales-Noreña, L.F.; Ramos-Paja, C.A. Optimal Allocation and Sizing of PV Generation Units in Distribution Networks via the Generalized Normal Distribution Optimization Approach. Computers 2022, 11, 53. [Google Scholar] [CrossRef]
  6. Grisales-Noreña, L.F.; Gonzalez Montoya, D.; Ramos-Paja, C.A. Optimal sizing and location of distributed generators based on PBIL and PSO techniques. Energies 2018, 11, 1018. [Google Scholar] [CrossRef] [Green Version]
  7. Gong, X.; Dong, F.; Mohamed, M.A.; Awwad, E.M.; Abdullah, H.M.; Ali, Z.M. Towards distributed based energy transaction in a clean smart island. J. Clean. Prod. 2020, 273, 122768. [Google Scholar] [CrossRef]
  8. Chen, J.; Alnowibet, K.; Annuk, A.; Mohamed, M.A. An effective distributed approach based machine learning for energy negotiation in networked microgrids. Energy Strategy Rev. 2021, 38, 100760. [Google Scholar] [CrossRef]
  9. Junedi, M.; Ludin, N.; Hamid, N.; Kathleen, P.; Hasila, J.; Affandi, N.A. Environmental and economic performance assessment of integrated conventional solar photovoltaic and agrophotovoltaic systems. Renew. Sustain. Energy Rev. 2022, 168, 112799. [Google Scholar] [CrossRef]
  10. Moradi, M.H.; Abedini, M. A combination of genetic algorithm and particle swarm optimization for optimal DG location and sizing in distribution systems. Int. J. Electr. Power Energy Syst. 2012, 34, 66–74. [Google Scholar] [CrossRef]
  11. Montoya, O.D.; Gil-González, W.; Grisales-Noreña, L. An exact MINLP model for optimal location and sizing of DGs in distribution networks: A general algebraic modeling system approach. Ain Shams Eng. J. 2020, 11, 409–418. [Google Scholar] [CrossRef]
  12. Mohanty, B.; Tripathy, S. A teaching learning based optimization technique for optimal location and size of DG in distribution network. J. Electr. Syst. Inf. Technol. 2016, 3, 33–44. [Google Scholar] [CrossRef] [Green Version]
  13. Kollu, R.; Rayapudi, S.R.; Sadhu, V.L.N. A novel method for optimal placement of distributed generation in distribution systems using HSDO. Int. Trans. Electr. Energy Syst. 2014, 24, 547–561. [Google Scholar] [CrossRef]
  14. Nguyen, T.P.; Dieu, V.N.; Vasant, P. Symbiotic organism search algorithm for optimal size and siting of distributed generators in distribution systems. Int. J. Energy Optim. Eng. 2017, 6, 1–28. [Google Scholar] [CrossRef]
  15. Injeti, S.K.; Kumar, N.P. A novel approach to identify optimal access point and capacity of multiple DGs in a small, medium and large scale radial distribution systems. Int. J. Electr. Power Energy Syst. 2013, 45, 142–151. [Google Scholar] [CrossRef]
  16. Ramadan, A.; Ebeed, M.; Kamel, S.; Agwa, A.M.; Tostado-Véliz, M. The Probabilistic Optimal Integration of Renewable Distributed Generators Considering the Time-Varying Load Based on an Artificial Gorilla Troops Optimizer. Energies 2022, 15, 1302. [Google Scholar] [CrossRef]
  17. Labbadi, M.; Elyaalaoui, K.; Loubna, B.; Ouassaid, M.; Cherkaoui, M. Modeling, Optimization and Intelligent Control Techniques in Renewable Energy Systems: An Optimal Integration of Renewable Energy Resources Into Grid; Springer: Berlin/Heidelberg, Germany, 2022; Volume 434. [Google Scholar]
  18. Nagadurga, T.; Narasimham, P.; Vakula, V.; Devarapalli, R. Gray wolf optimization-based optimal grid connected solar photovoltaic system with enhanced power quality features. Concurr. Comput. Pract. Exp. 2022, 34, e6696. [Google Scholar] [CrossRef]
  19. Montoya, O.D.; Grisales-Noreña, L.F.; Perea-Moreno, A.J. Optimal Investments in PV Sources for Grid-Connected Distribution Networks: An Application of the Discrete–Continuous Genetic Algorithm. Sustainability 2021, 13, 13633. [Google Scholar] [CrossRef]
  20. Montoya, O.D.; Giral-Ramírez, D.A.; Hernández, J.C. Efficient Integration of PV Sources in Distribution Networks to Reduce Annual Investment and Operating Costs Using the Modified Arithmetic Optimization Algorithm. Electronics 2022, 11, 1680. [Google Scholar] [CrossRef]
  21. Montoya, O.D.; Grisales-Noreña, L.F.; Alvarado-Barrios, L.; Arias-Londoño, A.; Álvarez-Arroyo, C. Efficient reduction in the annual investment costs in AC distribution networks via optimal integration of solar PV sources using the newton metaheuristic algorithm. Appl. Sci. 2021, 11, 11525. [Google Scholar] [CrossRef]
  22. Abualigah, L.; Diabat, A.; Mirjalili, S.; Abd Elaziz, M.; Gandomi, A.H. The arithmetic optimization algorithm. Comput. Methods Appl. Mech. Eng. 2021, 376, 113609. [Google Scholar] [CrossRef]
  23. Grisales-Noreña, L.F.; Montoya, O.D.; Ramos-Paja, C.A. An energy management system for optimal operation of BSS in DC distributed generation environments based on a parallel PSO algorithm. J. Energy Storage 2020, 29, 101488. [Google Scholar] [CrossRef]
  24. Nanda Kumar, E.; Dhanasekaran, R. Optimal power flow with FACTS controller using hybrid PSO. Arab. J. Sci. Eng. 2014, 39, 3137–3146. [Google Scholar] [CrossRef]
  25. Rosales Muñoz, A.A.; Grisales-Noreña, L.F.; Montano, J.; Montoya, O.D.; Perea-Moreno, A.J. Application of the Multiverse Optimization Method to Solve the Optimal Power Flow Problem in Alternating Current Networks. Electronics 2022, 11, 1287. [Google Scholar] [CrossRef]
  26. Kim, J.Y.; Mun, K.J.; Kim, H.S.; Park, J.H. Optimal power system operation using parallel processing system and PSO algorithm. Int. J. Electr. Power Energy Syst. 2011, 33, 1457–1461. [Google Scholar] [CrossRef]
  27. Da Silva, P.P.; Dantas, G.; Pereira, G.I.; Câmara, L.; De Castro, N.J. Photovoltaic distributed generation–An international review on diffusion, support policies, and electricity sector regulatory adaptation. Renew. Sustain. Energy Rev. 2019, 103, 30–39. [Google Scholar] [CrossRef]
  28. Zhang, F.; Deng, H.; Margolis, R.; Su, J. Analysis of distributed-generation photovoltaic deployment, installation time and cost, market barriers, and policies in China. Energy Policy 2015, 81, 43–55. [Google Scholar] [CrossRef] [Green Version]
  29. Montoya, O.D.; Garrido, V.M.; Gil-González, W.; Grisales-Noreña, L.F. Power flow analysis in DC grids: Two alternative numerical methods. IEEE Trans. Circuits Syst. II Express Briefs 2019, 66, 1865–1869. [Google Scholar] [CrossRef]
  30. Grisales-Noreña, L.F.; Montoya, O.D.; Hincapié-Isaza, R.A.; Echeverri, M.G.; Perea-Moreno, A.J. Optimal location and sizing of DGs in DC networks using a hybrid methodology based on the PPBIL algorithm and the VSA. Mathematics 2021, 9, 1913. [Google Scholar] [CrossRef]
  31. Rosales Muñoz, A.A.; Grisales-Noreña, L.F.; Montano, J.; Montoya, O.D.; Giral-Ramírez, D.A. Optimal Power Dispatch of Distributed Generators in Direct Current Networks Using a Master–Slave Methodology That Combines the Salp Swarm Algorithm and the Successive Approximation Method. Electronics 2021, 10, 2837. [Google Scholar] [CrossRef]
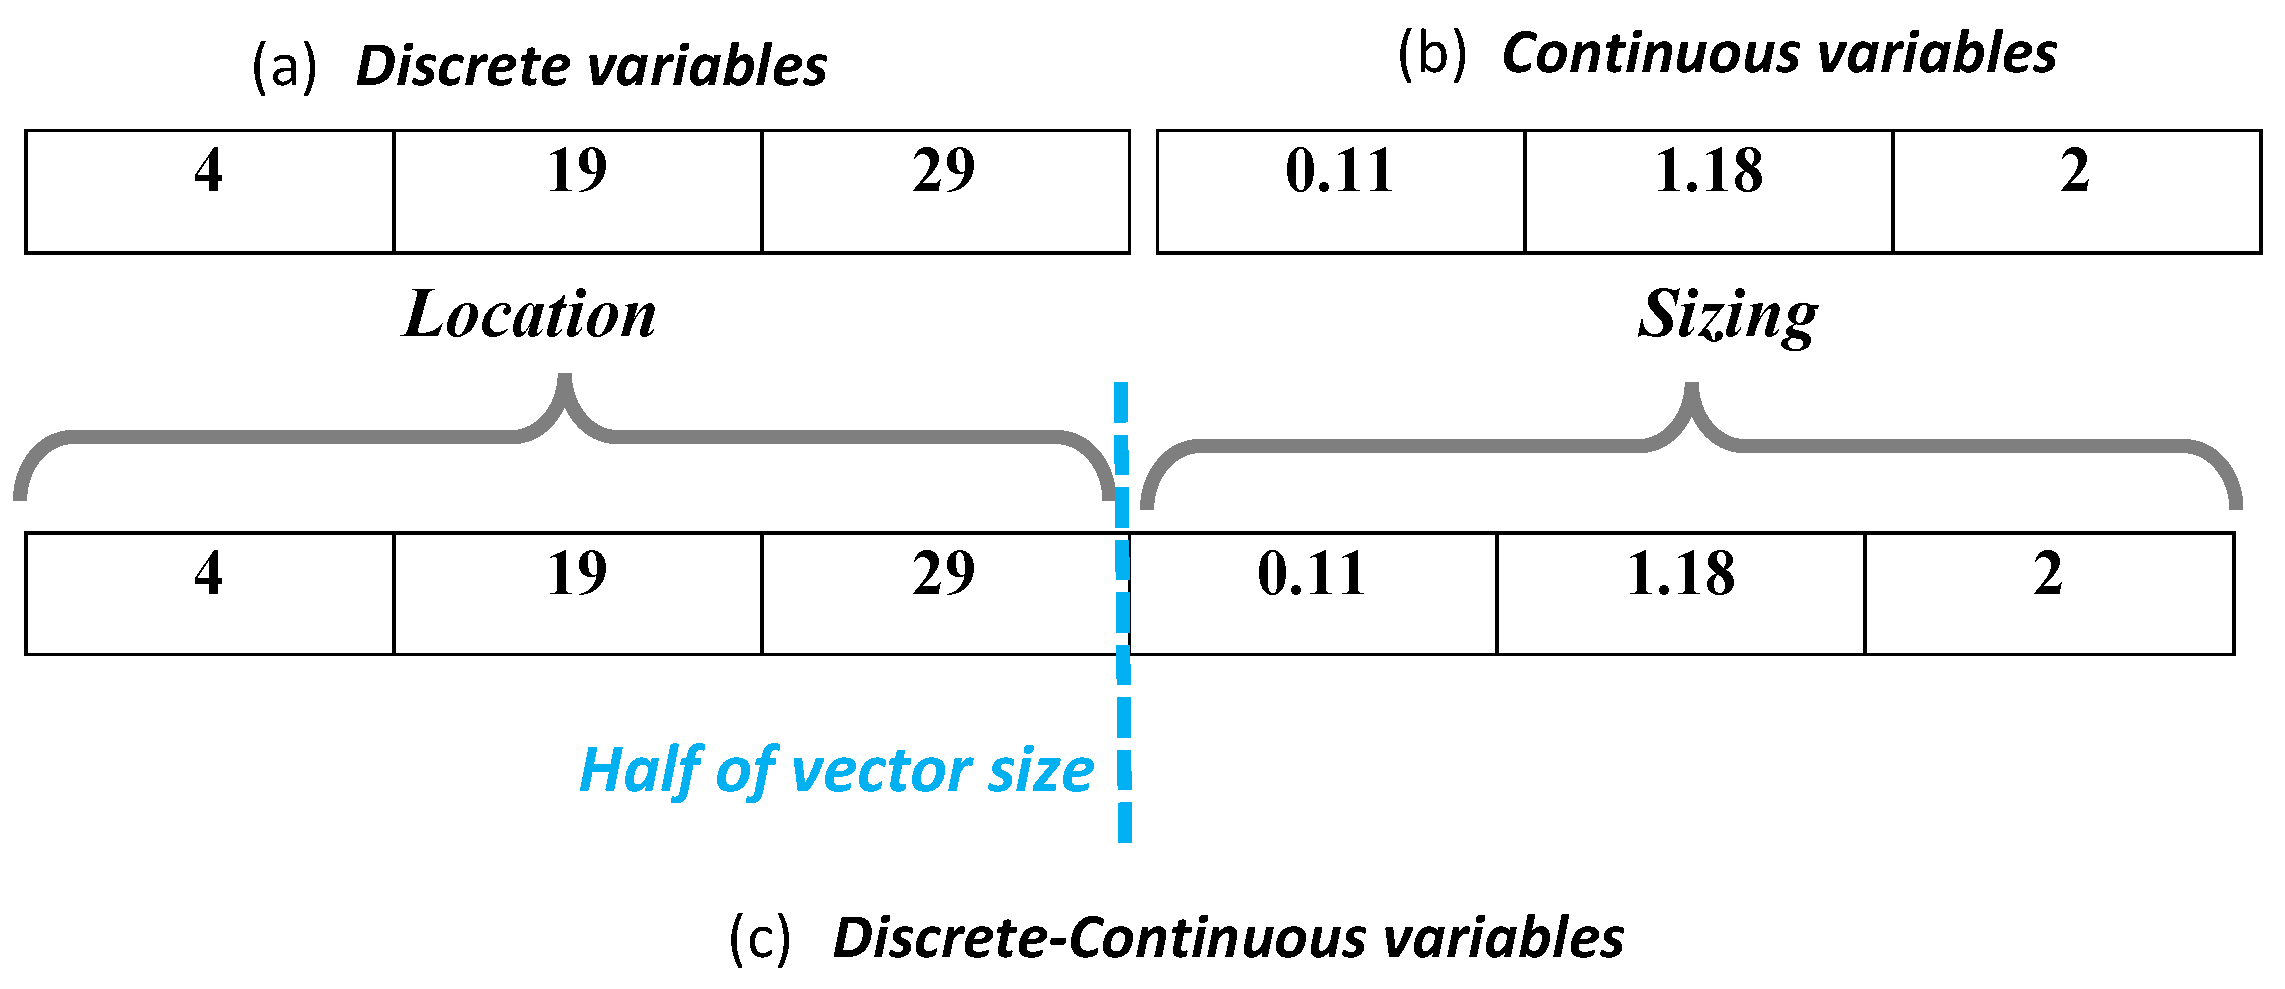
Figure 1. Discrete–continuous codification.
Energies 15 07465 g001
Figure 2. Discrete–Continuous Parallel version of the Particle Swarm Optimization algorithm (DCPPSO).
Energies 15 07465 g002
Figure 3. Average behavior of PV generation and power demand in Colombia during a normal day [19].
Energies 15 07465 g003
Figure 4. Hourly power flow proposed to evaluate the objective function in the DCPPSO method.
Energies 15 07465 g004
Figure 5. Electrical diagram of the 33-bus test system.
Energies 15 07465 g005
Figure 6. Electrical diagram of the 69-bus test system.
Energies 15 07465 g006
Figure 7. Improvements obtained by the DCPPSO with respect to the other methods in the 33-bus test system.
Energies 15 07465 g007
Figure 8. Improvements obtained by the DCPPSO with respect to the other methods in the 69-bus test system.
Energies 15 07465 g008
Table 1. Parameters used to calculate the objective function [3].
ParameterValueUnitParameterValueUnit
C k W h 0.1390USD/kWhT365days
t a 10% N t 20years
Δ h 1h t e 2%
C p v 1036.49USD/kWp C 0 a n d M 0.0019USD/kWh
N p v a v a i l 3- Δ V ± 10 %
P k p v , min 0kW P k p v , max 2400kW
α 1 100 × 10 4 USD/V α 2 100 × 10 4 USD/V
α 3 100 × 10 4 USD/W α 4 100 × 10 4 USD/A
Table 2. Parameters of the 33-bus test system.
Bus iBus j R ij [ Ω ] X ij [ Ω ]P[kW]Q[kvar]Bus iBus j R ij [ Ω ] X ij [ Ω ]P[kW]Q[kvar]
120.09220.04771006017180.73200.57409040
230.49300.251190402190.16400.15659040
340.36600.18641208019201.50421.35549040
450.38110.1941603020210.40950.47849040
560.81900.7070602021220.70890.93739040
670.18720.61882001003230.45120.30839050
781.71141.235120010023240.89800.7091420200
891.03000.7400602024250.89000.7011420200
9101.04000.740060206260.20300.10346025
10110.19660.0650453026270.28420.14476025
11120.37440.1238603527281.05900.93376020
12131.46801.1550603528290.80420.700612070
13140.54160.71291208029300.50750.2585200600
14150.59100.5260601030310.97440.963015070
15160.74630.5450602031320.31050.3619210100
16171.28901.7210602032330.34100.53026040
Table 3. Parameters of the 69-bus test system.
Bus iBus j R ij [ Ω ] X ij [ Ω ]P[kW]Q[kvar]Bus iBus j R ij [ Ω ] X ij [ Ω ]P[kW]Q[kvar]
120.00050.0012003360.00440.01082618.55
230.00050.00120036370.06400.15652618.55
340.00150.00360037380.10530.123000
450.02150.02940038390.03040.03552417
560.36600.18642.62.239400.00180.00212417
670.38100.194140.43040410.72830.85091021
780.09220.0470755441420.31000.362300
890.04930.0251302242430.04100.047864.3
9100.81900.2707281943440.00920.011600
10110.18720.061914510444450.10890.137339.2226.3
11120.71140.235114510445460.00090.001239.2226.3
12131.03000.3400854470.00340.008400
13141.04400.34008547480.08510.20837956.4
14151.05800.34960048490.28980.7091384.7274.5
15160.19660.0650453049500.08220.2011384.7274.5
16170.37440.123860358510.09280.047340.528.3
17180.00470.0016603551520.33190.11403.62.7
18190.32760.1083009530.17400.08864.353.5
19200.21060.069010.653540.20300.103426.419
20210.34160.11291148154550.28420.14472417.2
21220.01400.004653.555560.28130.143300
22230.15910.05260056571.59000.533700
23240.34630.1145282057580.78370.263000
24250.74880.24750058590.30420.100610072
25260.30890.1021141059600.38610.117200
26270.17320.0572141060610.50750.25851244888
3280.00440.01082618.661620.09740.04963223
28290.06400.15652618.662630.14500.073800
29300.39780.13150063640.71050.3619227162
30310.07020.02320064651.04100.53025942
31320.35100.11600065660.20120.06111813
32330.83900.2816101066670.00470.00141813
33341.70800.5646141467680.73940.24442820
34351.47400.48734468690.00470.00162820
Table 4. Simulation results obtained by the solution methodologies in the 33-bus test system (AC and DC networks).
MethodologyBus/Power [MVAr] A cos t (USD/Year)/Reduction [%]Time [s]STD [%] V worst [p.u.] I max [A]
Base case[0–2.4]3,700,455.380--[0.9–1.1]380
BONMIN17/1.3539
18/0.2105
33/2.1451
2,701,824.14/29.98673.6400.90366
DCCBGA11/0.7604
15/0.9689
30/1.9059
2,699,932.29/27.03785.300.04520.90366
DCNMA8/0.2770
16/1.2688
30/2.0961
2,700,227.33/27.029820.210.08120.90365
DCVSA11/0.7606
14/1.08517
31/1.8029
2,699,761,71/27.0424170.230.04270.90366
DCGNDO10/1.0083
16/0.9137
31/1.7257
2,699,671.75/27.0436268.690.07000.90365
DCPPSO10/1.0092
16/0.9137
31/1.7245
2,699,671.75/27.04368.320.02460.90366
Table 5. Simulation results obtained by the solution methodologies in the 69-bus test system (AC and DC networks).
MethodologyBus/Power [MVAr] A cos t (USD/Year)/Reduction [%]Time [s]STD [%] V worst [p.u.] I max [A]
Base case[0–2.4]3,700,455.380--[0.9–1.1]430
DCCBGA24/0.5325
61/1.8954
64/1.3771
2,825,783.32/27.139722.360.09990.90394
DCNMA12/0.0794
60/1.3805
61/2.3776
2,826,368.60/27.136791.810.19000.90393
DCVSA16/0.2632
61/2.27197
63/0.11166
2,824.923.29/27.1501887.640.09420.90394
DCGNDO21/0.4812
61/2.4
64/0.9169
2,824923.38/27.15891237.230.25580.90393
DCPPSO21/0.489
61/2.4
64/0.9169
2,824,923.29/27.158955.150.02670.90393
Publisher’s Note: MDPI stays neutral with regard to jurisdictional claims in published maps and institutional affiliations.