1. Introduction
According to Angel et al. [
1], the number of people living in cities keeps growing and is expected to double from 2011 to 2054. This increase in the mobility requirement is leading to the need for faster, cheaper, safer, and cleaner forms of transportation [
2], not only to avoid the depletion of fossil energy sources but above all to preserve the environment. Transportation accounts for around one-fifth of today’s global carbon dioxide (CO
2) emissions [
3]. Road travel accounts for three-quarters of them, while the contribution of aviation to transport-associated emissions is 11.6%. Increasing the efficiency of the utilization of energy in transport systems, speeding up the deployment of sustainable energy sources, and enhancing zero-emission vehicles are the main actions that have been proposed to reduce the environmental impact of transportation [
3] and fulfill future mobility requests.
In the last few years, many companies have developed delivery and taxi services conceived to work in the air. These new services are denoted as Urban Air Mobility (UAM) and Urban Air Delivery. This investigation focuses on Urban Air Mobility and, in particular, on the air-taxi service. In this field, several companies have developed electric vertical take-off and landing (eVTOL) aircraft over the past few years. However, there are still many open issues such as the lack of infrastructure, the need to ensure safety (in particular avoiding collisions during the mission), and the development of suitable air-traffic management systems [
4,
5,
6].
UAM is an appealing application for electric power systems thanks to its short-range and limited speed requirements that make full electric powertrains possible, even with today’s batteries (i.e., despite their moderate values of energy density and power density, which are the major bottlenecks for larger aircraft). For longer distances, hybrid-electric concepts can be considered to provide the necessary range while guaranteeing silent and environmentally friendly transport systems. To ensure the success of electric and hybrid-electric air taxis, an extensive charging infrastructure powered by clean energy sources is needed as well as the availability of a large number of take-off and landing facilities [
7]. Moreover, ad hoc flight mechanics analysis tools and design techniques need to be developed to tackle the challenge of sizing and management of hybrid and fully electric aircraft. In fact, the analysis of the energy request of this kind of vehicle and their environmental impact is a hot topic still in need of further research efforts, as proved by the limited works in this topic, such as the recent studies on Urban Air Delivery [
8,
9,
10] and UAM [
11,
12,
13,
14].
Uber [
11] performed a comparison between a traditional road vehicle and a VTOL one in terms of time spent, distance covered, and costs without considering the environmental impact. As pointed out in [
12], the sustainability of air-taxi services is unclear because of the high energy requirement of this kind of vehicle, above all for take-off and climb. A comprehensive review of the research on UAM is presented in [
15], where the development of more refined and high-fidelity models is suggested as one of the potential research directions in this field. This work also points out the importance of taking into account the largest safety allowed by the hybrid-electric power systems in rotorcraft thanks to the possibility of performing safe descents after an engine/motor failure.
The authors of [
14], proposed a comparison of the Greenhouse Gas (GHG) emissions of a VTOL over a distance of 100 km versus ground-based passenger cars and, in particular, a conventional internal combustion engine vehicle and a battery-electric vehicle. However, this work performs a simplified analysis: the part-load efficiency of the powertrain and the large variability of energy consumption of a road vehicle due to the effect of the traffic conditions are not taken into account. The different effects of traffic conditions and weather on the travel time of road and aerial vehicles are addressed in [
12] where it is also pointed out that the travel time of a VTOL is much more predictable than that of a road vehicle.
A similar but more detailed analysis is performed in [
16], in which the authors developed a model to quantify trip emissions using UAM and compared them with automotive-based trips. The authors of this study consider gasoline and electric vehicles as automotive technology and calculate the emissions associated with electricity production using the emission factor of the metropolitan area of Chicago and Dallas. Moreover, this work proposes the detour ratio (defined as the distance saved or gained by using an aerial vehicle instead of a road vehicle driving the same route) as a metric to compare air and road transportation while the circuity factor (the ratio of the shortest road route to the Euclidian distance) is proposed in [
12] to compare air and road vehicles.
The present work differs from [
12,
16] in the following aspects that constitute its novel contribution to the scientific literature on UAM:
- -
The UAM is modeled with a detailed approach for the battery that takes into account non-linear and aging effects and part-load efficiencies for the engine and the motor.
- -
Different powertrains (conventional, fully electric, and parallel hybrid electric) are considered for the air taxi and the role of energy management is addressed in the case of the hybrid electric powertrain.
- -
The emissions associated with the battery charging are calculated as a function of emission intensity of the electricity production, with particular reference to the European Union.
- -
The road vehicles considered in this investigation are different for today and 2035 technology and are analyzed under favorable and unfavorable driving conditions (in terms of traffic congestion, driving style, and circuity factor).
- -
The performances of the electrified air taxis are evaluated with the battery at the start and the end of its life.
- -
The environmental impact is assessed with a new well-to-wing/wheel approach per km of straight or Euclidean distance between the initial and final place of the emission (i.e., taking into account different values of the circuity factor for the road vehicles).
A more complete analysis of the environmental impact of road and air vehicles should be performed at the cradle-to-grave emissions level [
16], i.e., taking into account all processes from the extraction to the discarding of materials (thus including production, operation, and disposal phases). However, this is beyond the scope of this investigation.
After this first introductory section, the present paper is organized as follows. The second section depicts the simplified sizing of the aerial vehicles and their specification. The third part describes the proposed detailed methodology for the energy analysis of aerial vehicles. Then, the road vehicles used for the comparison are presented and the procedure for the evaluation of the environmental impact is explained in session 5. Finally, the results for today and 2035 technologies are discussed, and the conclusions are drawn.
2. Simplified Sizing of the Air-Taxis
A hypothetical four-passenger vertical take-off and landing (VTOL) rotorcraft with co-axial rotors is considered as air taxi architecture. This is in line with the works proposed in the literature; see, for example [
12,
17], in which electric VTOL vehicles with four to five occupants are considered for UAM.
In this work, three different power systems are proposed and compared: conventional (turboshaft-based powertrain), full electric (Lithium-ion battery and permanent magnet motors), and parallel hybrid electric (combining the previous technologies). The evaluation of the air-taxi mass in the three cases is not a trivial issue and depends on the present-day and future values for specific power and density of the main components [
18,
19,
20,
21,
22,
23,
24,
25]. The goal of the investigation is to propose a methodology for the energy analysis of a complex power system for UAM, not to analyze a particular technology. However, it is interesting to point out the strong expected improvement in the components of an electrified power system and to show how this affects the results of the proposed methodology. For this reason, the data retrieved in the scientific literature for today and future (2035) technologies (
Table 1) were assumed for the turboshaft engines, the electric machines (and their inverter), and the battery. The potential different contribution of the gearbox to the weight of the proposed powertrains is neglected for simplicity.
It is important to mention the relation between battery power density and energy density. The values of
Table 1 are related to batteries optimized for energy density (this is the normal choice for a fully electric system), but the design of a Lithium-ion battery can be aimed at optimizing the power density at the expense of energy density or vice versa [
26]. The power density of a battery mainly depends on its
, i.e., the maximum current at which the battery can be discharged, termed as a multiple of the battery nominal capacity [
26]. In fact, the nominal continuous power (
of a Lithium-ion battery in discharge can be expressed as:
where
is the nominal capacity (in Ah),
is the nominal voltage of a Lithium-ion cell (3.6 V), and
is the number of cells in the series. Assuming a nominal voltage of 270 V for the battery pack (
), as suggested by Bérubé et al. [
20], it is easy to verify that the values in
Table 1 refer to a battery with a continuous
, ranging between 3 and 4, but higher values of the
can be obtained even with today’s technology [
21] and without significantly penalizing the energy density. It should also be noted that, for a short interval of time compatible with the duration of the take-off (about 30 s), the battery can be operated at a current higher than
which is named burst
and is generally equal to
[
24,
26].
To obtain realistic specifications for the UAM powertrains, the following procedure is proposed here for fast preliminary sizing:
The empty mass is initially assigned equal to 1000 kg.
A payload of 360 kg is added in all cases to account for four passengers (including luggage) and a reserve of 50 kg of fuel is considered for the conventional and hybrid electric powertrains.
For each of the configurations considered in this work (conventional, parallel hybrid electric, and fully electric), a tentative value is assigned to the size of the components (nominal power for the energy converters, energy content for the battery).
Using the data of
Table 1, the take-off mass of the powertrain is estimated for current and 2035 technology.
The empty weight is upgraded to keep the ratio of empty-to-take-off mass equal to 0.6 [
14].
The take-off weight is used to estimate the take-off power. If this cannot be achieved with the proposed powertrain, the size of the converters is increased.
The iteration is terminated when the convergence on the empty mass is reached.
The take-off power is calculated as suggested in the literature [
12,
16] for VTOL vehicles by using the formula for the power request in hover:
where
is the disk loading and
is the sea-level air density (1.22 kg/m
3), g is the gravity acceleration. For all the powertrains, a value of 0.85 was assumed for the propulsive efficiency [
16] and the disk loading was set to 380 Nm
−2 [
16,
27].
The results of the procedure are shown in
Figure 1,
Table 2 and
Table 3 in terms of final take-off mass and powertrain specifications.
Regarding the take-off mass (
Figure 1) the largest contribution of the powertrain to the take-off weight is associated with the battery, especially in the case of today’s technology and fully electric aerial vehicles. It should also be noted that, at constant mass, the 2035 technology allows a designer to shift from conventional to hybrid (with about 1350 kg) and from hybrid to electric (accepting a take-off weight of about 1850 kg).
Regarding the installed power, in the conventional case, we considered a twin-engine configuration to allow safety in case of failure. The size of 295 kW (400 HP) was chosen according to the specification of the Hill GT500 engine [
22]. Since it is difficult to scale down a turboshaft engine, the same nominal power was also considered for the 2035 technology. For the motors, we opted for modules of 120 kW since more powerful electric machines for aerospace applications are still under development [
23]. The number of modules (
) was chosen so that the take-off could be performed with
motors. The size of the battery was set equal to 35 and 140 kW for the hybrid and the full-electric case, respectively, based on the experience of the authors and with a trial-and-error procedure on the mission analysis described later in the paper.
For the hybrid electric taxi, take-off can be performed in thermal, electric, or power-assist modes. Since it is also necessary to guarantee that the battery can feed the motors in case of electric take-off, the minimum continuous
required for the battery in the different cases was estimated and entered in
Table 2 and
Table 4. Based on the previous discussion about the typical continuous and burst
of today’s battery, we can conclude that the battery is able to guarantee an electric take-off in all cases reported in
Table 2 and
Table 3.
As a partial validation of the sizing procedure, it is possible to notice that the take-off mass obtained for the 2035 electric air taxis is very close to the value of 4000 lbs assumed in [
11] for a UAV powered by a battery with 400 kWh/kg. However, the goal of this first step was not to propose a detailed sizing methodology but to obtain reasonable values for the take-off weights of the three powertrains to allow a fair comparison in terms of energy and power request.
3. Proposed Methodology for the Air-Taxi
Once the powertrain was defined, the energy and fuel consumptions were calculated with the procedure here explained and illustrated in
Appendix A (
Figure A1) for the hybrid propulsion system. Note that the fully electric and conventional powertrains can be considered as particular cases of this complex power system.
The simulations proposed in this investigation were performed with a quasi-static approach. Each mission was divided into intervals of time length
h and, at any time step, the components of the power system were assumed to work in stationary conditions even if the working point was different at each time step. Such an approach is generally accepted in the minimization of fuel consumption in complex powertrains [
26] because it allows the design of a supervisory controller to optimize the power flows in the propulsion system with a small computational effort. However, this approach requires the mission to be known a priori and is not able to handle feedback control problems or to take into account the dynamic response of the energy converters to a variable power request that affects the shaft dynamic in a rotorcraft or the dynamic behavior of the fuel valve [
28]. A dynamic model of the whole power system, including the twin rotors, is currently being implemented by some of the authors of this investigation and preliminary results can be found in [
29]. Note that a dynamic approach would be able to take into account other factors, such as the effect of temperature on each component of the power system, that are neglected in this investigation.
3.1. The Route (Start and Final Points)
The vehicles are supposed to perform the same hypothetical route which corresponds to a total straight-line or Euclidean distance of 70 km. When comparing air-taxi and ground-based transportation systems, it is necessary to take into account the circuity factor, i.e., the ratio between actual road travel distance and coordinate-calculated Euclidean distance. A circuity factor of 1.2 is considered in [
30] for the comparison between air and road vehicles. However, this value is strongly variable from country to country, as pointed out in [
18] where an average circuity factor of 1.46 is reported for Europe.
It is important to point out that the trip time of the road taxi is strongly affected by driving style, weather, and traffic conditions. Headwinds or tailwinds, on the other hand, do not change the true airspeed (TAS) of the aerial vehicle even if they affect the groundspeed. However, frequent back and forth along a given air-taxi route would likely balance these changes [
12].
3.2. Mission Profile and Flight Dynamics
Based on the white paper of Uber [
11], a typical mission was considered, consisting of take-off, climb, cruise, descent, and landing. The proposed mission was characterized by a cruise altitude of 458.6 m and a cruise speed of 67 m/s (150 mph); as suggested in [
11,
27] the
(Rate of Climb) and
(Rate of Descent) were assumed equal to 2.54 m/s (500 ft/min) in the present investigation.
The shaft power request vs. time was estimated using literature methods and data ([
16,
27]). For the vertical take-off and landing, the power request was calculated as in Equation (2).
In these equations,
is the take-off mass of the vehicle and
is the true airspeed. The values of the propulsive efficiency
used in this investigation are reported in
Table 2. The powertrain efficiency is included in the denominator of these formulas in the approach proposed in [
16], while in the present investigation,
in Equations (2)–(5) is only the propulsive efficiency (i.e., the efficiency of the rotor) while the powertrain efficiency is calculated with the detailed model explained below.
It is also necessary to point out that in the conventional and hybrid-electric powertrains, the mass of the vehicle decreases in time due to the consumption of fuel. Even if this effect can be easily implemented in the proposed procedure, it is not considered here because the amount of fuel consumed in the reference mission was much smaller than the take-off mass of the vehicle, as shown later. Note that the total power requirements for VTOL flight include the additional power drawn from auxiliary systems such as avionics or passenger comforts (heating/cooling, phone charging, radio, etc.). As suggested in [
16], these contributions are neglected in this investigation.
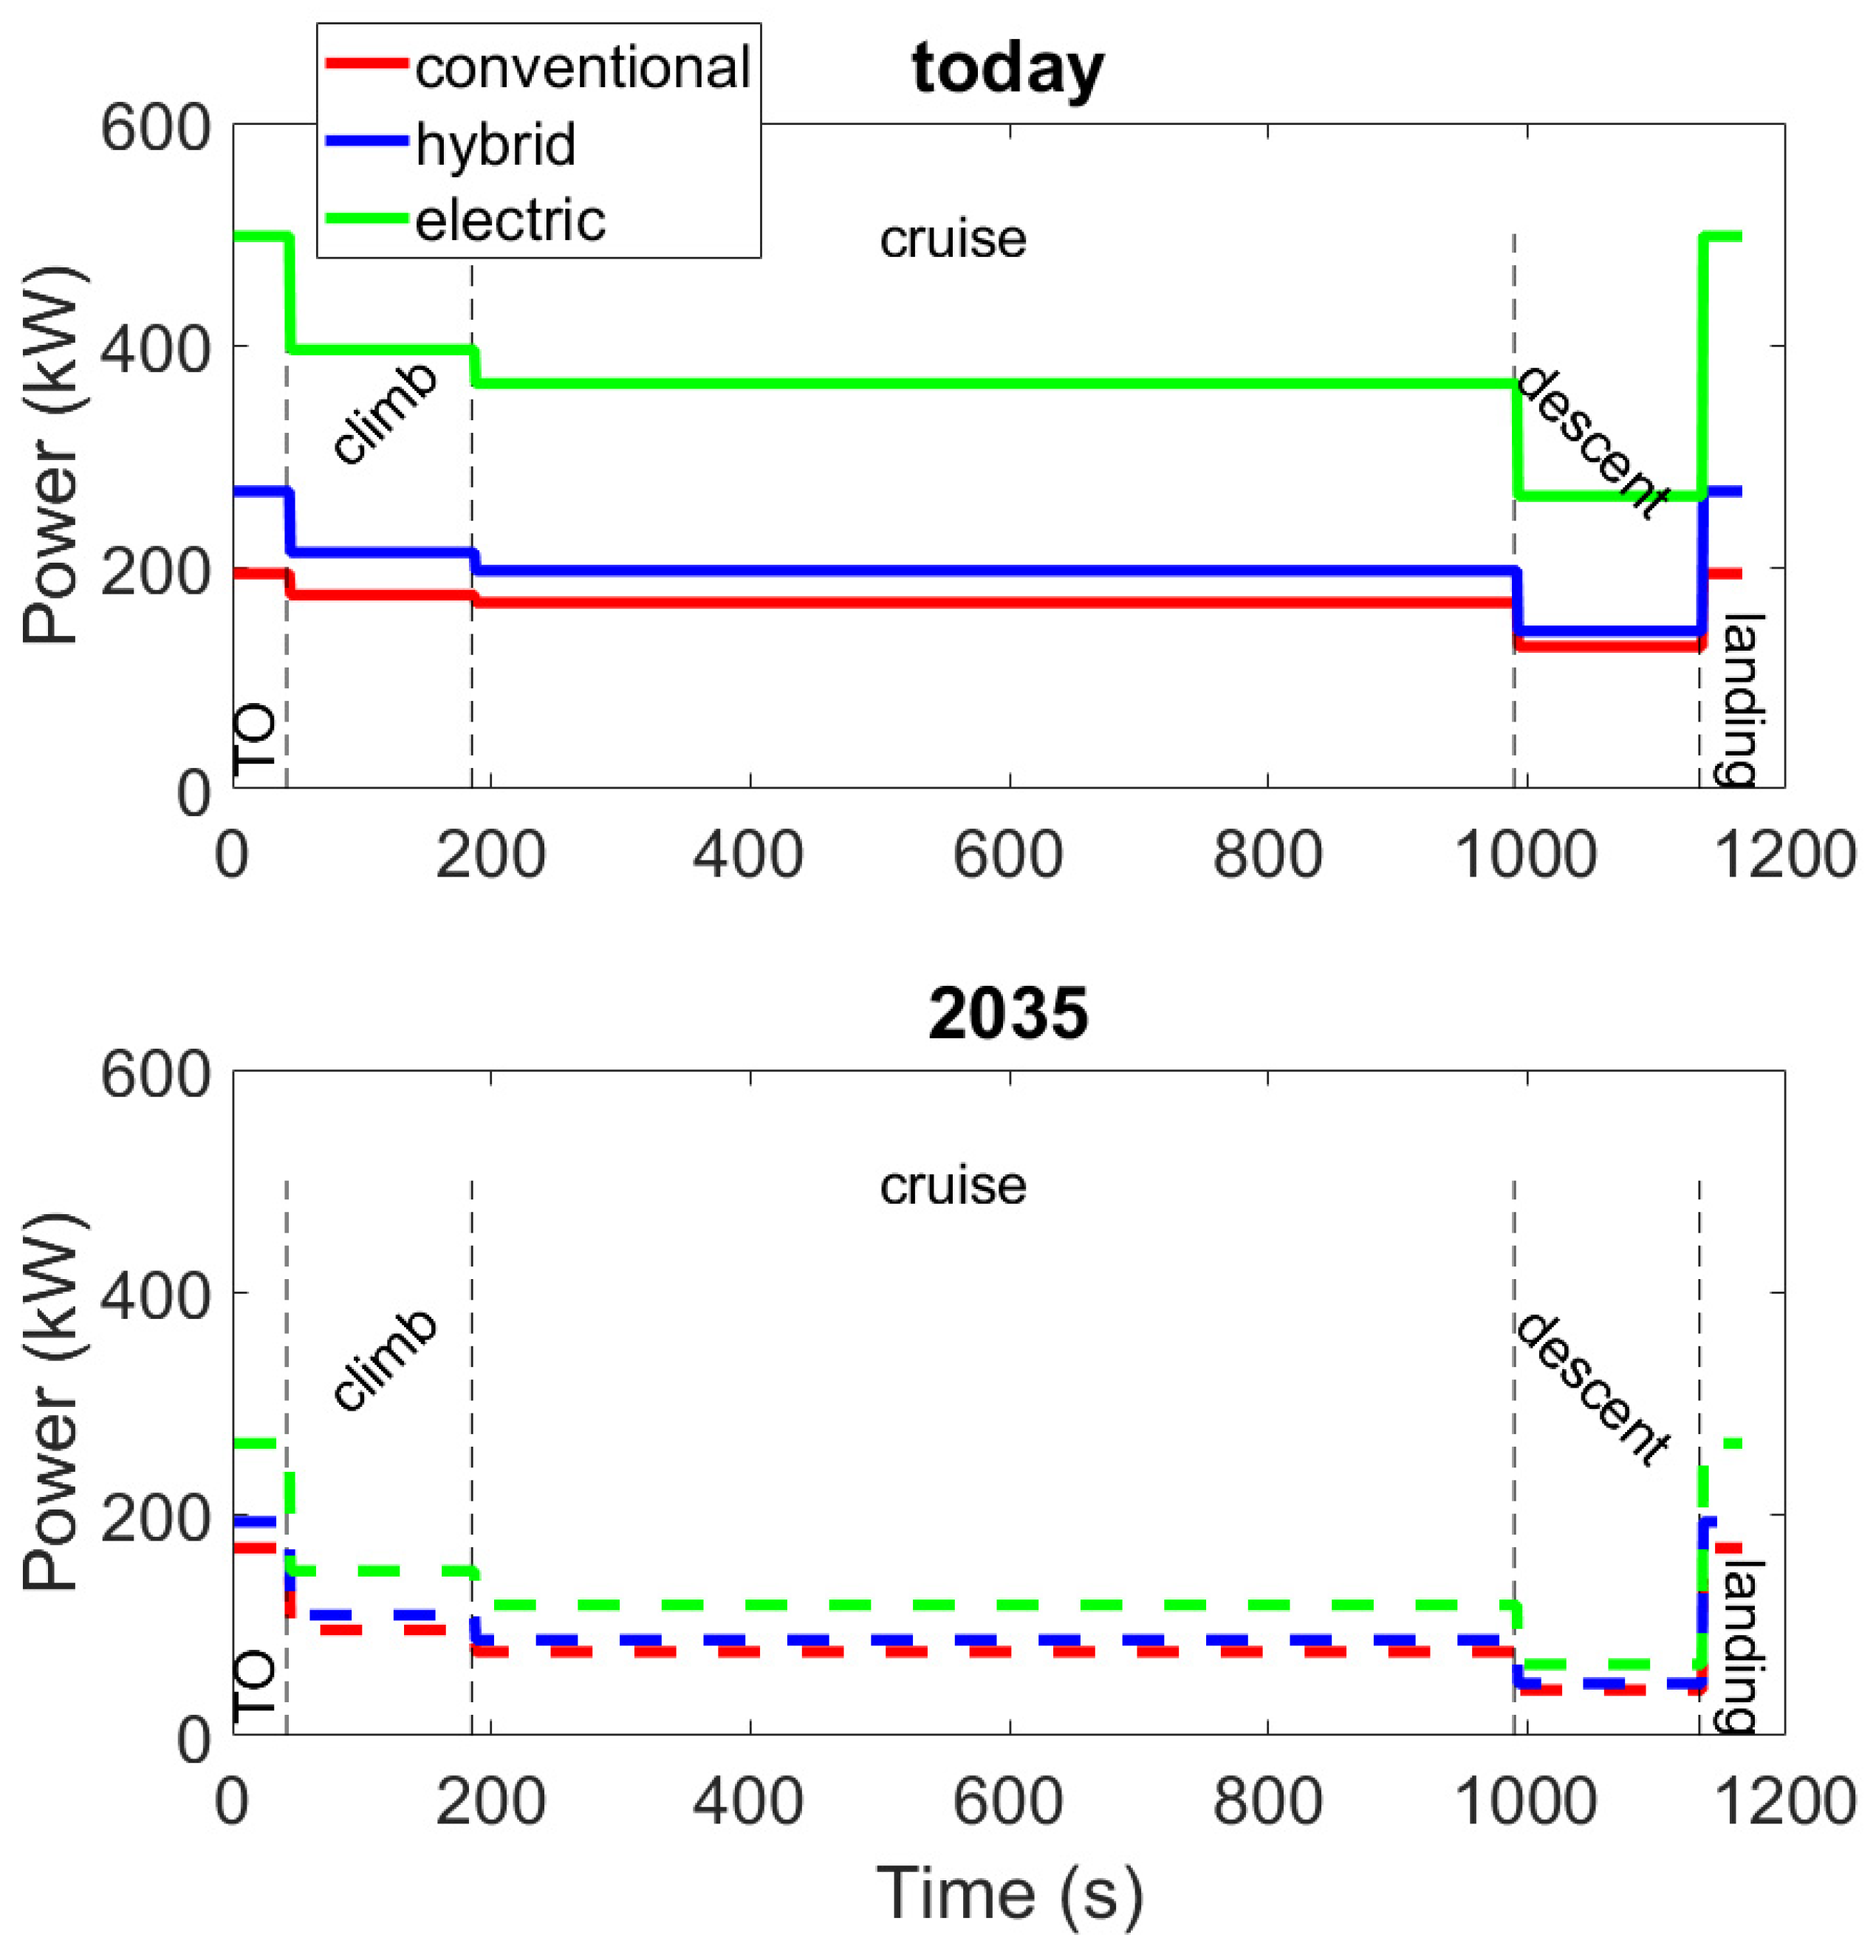
The time histories of the shaft power request for the three powertrains (according to their different masses) are reported in
Figure 2.
3.3. Simulation of the Energy Flows
The missions of
Figure 2 were discretized with a time step of 1 s. At each time step, the required shaft power was used as input to the detailed model of the power system.
In the conventional case, the power shaft request is fulfilled by the engine. In the electric case, it is fully developed by the electric machines. For the hybrid electric powertrain, an appropriate energy management strategy must be defined because it can be operated in four different modes:
- -
Thermal mode: the electric drive is not used and the power request is entirely satisfied by the engine.
- -
Electric mode: the engine is turned off (or in failure) and the power request is fulfilled by the electric drive.
- -
Power-assist mode: both the electric machines and the engine give power to the shaft.
- -
On-flight charge mode: the turboshaft engine is used to meet the power request and to charge the battery during the flight.
Note that the on-flight charge mode was not implemented in this work because it was found to be of little utility in the case of air vehicles [
31]. All the other modes can be obtained with a specific value of the control parameter
u, which is defined here as:
where
is the nominal power of the electric machine, and
is the contribution of the electric machine at time step
h. Therefore, the power to be delivered by the thermal engine,
is:
Note that the denominator in the expression of the control variable
, Equation (6), should be the minimum between the nominal power of the electric motors and the available battery power. However, it has been already verified that the battery can satisfy the take-off power with reasonable values of the
. Similarly,
should be compared with the maximum power of the engine at the flight altitude
to ensure that the engine is able, at any moment, to satisfy the request. Since the engine is quite oversized (see
Table 2 and
Table 4) and the other phases of the flight require much less power than take-off and landing (see
Figure 2), this constraint is easily met.
In the authors’ previous investigation [
31], the ECMS (equivalent consumption minimization strategy) was proposed for a similar application to calculate the optimal
. The Equivalent Consumption Minimization Strategy [
26] considers the battery as an auxiliary fuel tank and converts its electrical energy into virtual fuel consumption. The virtual and actual fuel flow rates are combined to obtain the instantaneous equivalent fuel consumption in the following way:
where the equivalence factor
converts the battery power to a virtual fuel flow rate. The virtual fuel flow rate can be either positive or negative according to the sign of the battery power (battery charged or discharged). Thus, the equivalent fuel consumption can be higher or lower than the actual fuel consumption in the ECMS original strategy. The penalty factor
is a correction that accounts for the divergence of the current SOC from the (constant) desired value of the battery state of charge (
). In this investigation, the penalty factor
is calculated according to the deviation of SOC at timestep
h from a reference curve
:
The optimal values of
and
were obtained in a previous work [
31].
According to the results of [
31], we selected a reference SOC curve that decreases linearly over time, except in cruise where it is kept constant (the battery is not used).
During each simulation run with the proposed strategy, local optimization was performed at each time step h of the mission, by considering all the values of ranging between 0 and 1 with a step of 0.1 and choosing the value of u corresponding to the minimum of . In other words, an enumerative optimization technique was used. However, other local search methods could have been used when the strategy was applied online in the UAM vehicle.
The ECMS has the main goal of minimizing fuel consumption during the mission. However other targets can be considered specifically for air-taxi operation. For this reason, we propose in this investigation a simple rule-based strategy aimed at reducing the environmental and acoustic impact of the hybrid-electric configuration during take-off and landing. To this scope, take-off and landing are performed in electric mode and cruise in thermal mode. The climb phase is performed in power assist mode (with ) until the SOC reaches a threshold value (90%) to obtain the desired curve. The other phases of the flight are performed in thermal mode.
3.4. Total Fuel Burn in the Mission )
The total fuel burn is calculated starting from the
of the turboshaft engine with a simple empirical model, developed in a previous investigation [
31]. The specific fuel consumption
at each time step is estimated as:
where
Z is the altitude (in meters) and
M is the Mach number (note that this effect is negligible for this application).
, and
are the shaft power and the specific fuel consumption of the engine at its design point, respectively. This equation contains seven parameters (
,
,
,
,
,
,
) whose values were fitted in [
31] by comparison with a detailed model of the engine.
The fuel flow rate is calculated as . By numerically integrating , the total fuel burn is obtained for the conventional and hybrid electric power system.
3.5. Electric Consumption of the Mission
The power contribution of the electric machines is used as input to calculate the electricity consumption. Each electric machine (inclusive of the driver) is modeled with a simple Willans line as proposed by [
26] so that the battery current can be expressed as:
where
is the intrinsic efficiency of the electrical-to-mechanical energy conversion process and
accounts for the losses taking place after the energy conversion (friction, heat losses, etc.). In this investigation, we assumed
and
as reported in [
26] for permanent magnet machines.
The battery is simulated with an electric equivalent circuit [
26]. The Open-Circuit Voltage
is a function of the battery state of charge, while the internal resistance
is considered independent of the SOC but related to the specification of the battery and varying along with the battery life. Therefore, the battery current is calculated by solving the following equation:
By integrating the battery power, the total electric consumption of the mission is obtained for the hybrid electric and full electric power systems.
The battery is also affected by the Peukert effect, i.e., the battery’s actual capacity decreases when the discharge power is increased. To take into account this phenomenon, the effective current
is calculated as:
where
is the Peukert coefficient,
is the current at which the nominal capacity of the battery is obtained.
Using the effective current, the state of charge is upgraded, at any time during the mission, as:
where
is the battery state of charge at the beginning of the mission. The Depth of Discharge (DOD) is calculated as the change between the initial and final SOC of the battery in each mission.
With this modeling approach, it is possible to take into account the increase in battery current at constant power due to the reduction in the SOC which, in turn, determines a reduction in the OCV. Another important characteristic of the proposed battery model is that the values of capacity, internal resistance, and Peukert coefficient are updated with the battery state of health. In particular, the values of these parameters at the beginning and the end of the battery life are shown in
Table 5. For more details about the aging model, please refer to [
32].
The end of life for a vehicle drive battery is defined as the time when either the battery energy capacity or its available power (which is inversely proportional to the internal resistance) drop below a specified minimum, which is usually set equal to 80% of the initial value [
33]. The time at which this condition is reached is the minimum between the cycle life (degradation due to repeated charge–discharge cycling) and the calendar life (degradation over time). Calendar and cycle life are affected by the battery operation, and in particular operating temperature, DOD, and charge/discharge current [
34]. The dependence on DOD can be found in the datasheet provided by the battery manufacturer or estimated with the models proposed in the scientific literature (see for example [
35,
36]).
4. Reference Road Vehicles
The emissions of CO2 of the different powertrains for air taxi will be compared with those of a road vehicle performing the same mission. Recently, the European Commission revised the Regulation setting CO2 emission standards for cars and light commercial vehicles, reducing the target value by 37.5% in 2030 compared to the 2021 limit of 95 g CO2/km. However, this value refers to the whole fleet and only the Tank-to-Wheel emissions are considered. For a more detailed comparison, reference road vehicles are used in this investigation.
The vehicle used as an example of today’s road technology is a well-known series/parallel hybrid electric vehicle, the Toyota Prius. The reason for the choice of this car is twofold: it is one of the most common vehicles used as a road taxi and is the most-studied hybrid electric vehicle (see, for example [
37]). The Prius non-plug-in vehicle has a curb mass of 1470 kg and a declared fuel consumption of 4.8 L/km over the New European Driving Cycle. However, tests performed on the same vehicle [
38] revealed that the fuel consumption (FC) of the Prius can range between 3 and 6 L/100 km on regulatory cycles (depending also on the version of the vehicle) while a still higher variability is obtained in real driving conditions [
39] where the fuel consumption can be as high as 14.8 L/100 km in case of urban routes and aggressive driving styles. Note that the curb mass of the Toyota Prius is 1350 kg. By adding the same payload of the aerial vehicle (360 kg), a mass of 1710 kg is obtained, a value not much different than that of the hybrid electric air taxi with today’s technology.
The fully electric Nissan Leaf was chosen as exemplative of 2035 road taxi because it is one of the most-studied electric vehicles and was also proposed for road-taxi services [
40]. The Nissan Leaf has a range of 200 km and a nominal electric consumption of 0.17 kWh/km [
41]. The expected improvement in technology for this kind of vehicle in 2035 is difficult to evaluate. For simplicity, we will assume that the expected increased energy density will allow the usage of a larger battery with the same mass. This will translate into a strong increase in range that will enhance the usage of vehicles as taxi service, but the energy consumption will be quite unchanged. Note that the electricity consumption must be corrected with the circuity factor, as in the case of the Toyota Prius, before performing the comparison with the aerial taxi. Moreover, the effects of traffic conditions and driving style are also to be considered [
42]. For the Nissan Leaf, the study in [
43] reports a value of 0.24 kWh/km in real driving conditions.
5. Environmental Impact
To compare the different vehicles from an environmental point of view, a Well-To-Wheel/Wing approach is considered, i.e., the greenhouse emissions are calculated considering the whole process from the primary energy source (e.g., crude oil) to the final energy to the wheels/wings. Moreover, they are normalized to the Euclidean distance between the initial and final places of the mission. To this scope, for gasoline and kerosene, it is possible to assume 3.15 kg
CO2/kg
fuel for the Tank-to-Wheel conversion, and 0.55 kg
CO2/kg
fuel for the WTT. In other words, the WTT emissions account for 15% of the WTW contribution [
44]. The grams of CO
2 per km of Euclidean distance (
ED) of the aerial vehicle are calculated as:
where
is expressed in kg and
ED in km.
To account for the circuity factor, the WTW emissions of CO
2 of the Toyota Prius per km of Euclidean distance are calculated as:
where
FC is the fuel consumption in l/100 km,
,
is the circuity factor, and 3.7 kg
CO2/kg
fuel is the WTW emission factor gasoline.
The contribution associated with the electricity for the aerial vehicles is linearly proportional to the amount of electricity released by the battery (
). To account for the losses in the grid and at the charging station, an overall efficiency
is introduced and its value is set to 80% [
45]:
where
is the Emission Intensity factor in g/kWh for the production of electricity.
The Toyota Prius considered in this work is not a plug-in vehicle, therefore there was no electric consumption associated with the mission and the battery was continuously charged and discharged thanks to the presence of the engine (charge-sustaining strategy). For the Nissan Leaf, the electric consumption per km was corrected to take to account the circuity factor. The same values of
EI and charge efficiency of the aerial vehicle are used in this case:
where
EC is the electric consumption expressed in kWh/100 km.
For the emission intensity factor
, a sensitivity study was conducted. In fact, even if electricity generation from renewable sources has significantly increased in the last years, most of the electric energy is currently produced from fossil fuels [
46,
47].
According to the European Energy Agency (EEA [
48]), the greenhouse Emission Intensity for EU in 2019 is, on average, 275.0 g CO
2/kWh with a maximum of 891 g CO
2/kWh for Estonia and a minimum of 8 g CO
2/kWh for Sweden as shown in
Figure 3a, where the value for Italy is also shown. However, the greenhouse emission intensity is expected to be reduced significantly in the next future. In this investigation, we will consider the average value of 90 g CO
2eq/kWh as the projected value in 2035.
6. Results
The overall results of the proposed methodology are shown in
Table 6 in terms of burn fuel
, electric consumption
, and battery DOD for the proposed configurations. Note that with today’s technology, the overall energy consumption of the air taxi is very high for all the configurations but in particular for the full electric because of its very large mass.
Starting from conventional powertrains, we can see that with current and 2035 technology the fuel consumption is 34.1 and 23.1 kg/100 km, respectively. Such levels of consumption are very high when compared with those typical of the Toyota Prius.
For the hybrid solution, the consumption strongly depends on the energy management strategy because of the different power distribution, as shown in
Figure 4.
The ECMS strategy guarantees the best fuel economy because it allows the battery to be discharged up to the desired threshold of 60% at the end of the mission (for backup operation). With 2035 technology, the fuel consumption in the case of rule-based strategy is 38% higher than that obtained with the ECMS while the electric consumption is 46.6% lower. The higher fuel consumption obtained with the rule-based strategy is mainly associated with the lower usage of the battery. However, the rule-based strategy guarantees a reduction i emissions at the road level because take-off, landing, and part of the climb are performed in electric mode (see
Figure 4). Moreover, the lower DOD obtained with this strategy is advantageous in terms of both battery life and charging time between two consecutive flights. The bottom plots of
Figure 4 show the efficiency curves of the motor and the engine in the two cases.
In the case of ECMS, engine efficiency is strongly dependent on the flight phases, like in a conventional aircraft. With the rule-based strategy, the engine is used only for cruise and part of the climb and is, therefore, quite oversized. This makes the engine work with an efficiency lower than 15% in the cruise phase. From a thermal efficiency point of view, it would be useful to choose a smaller engine or to select a different kind of thermal converter such as, for example, a piston engine. However, a smaller engine would not be able to perform take-off and landing in case of failure of the electric drive.
As for the electric powertrain, today’s technology with the proposed size of the battery is not suitable for the mission considered in this study. In fact, the DOD is very high, and the electric consumption is 1.84 kWe/km. The very high DOD is not only detrimental to the battery life and charge time but also does not allow reserve hover time. Note that at the moment there is no official regulation from aviation authorities about the reserve energy of the battery [
12].
In the case of 2035 technology the electric consumption is reduced to 0.58 kWe/km, which is still much higher than the value registered for the Nissan Leaf vehicle in the worst conditions (0.24 kWe/km). A smaller DOD could be obtained by choosing a larger battery. However, this would significantly increase the take-off weight of the fully electric vehicle according to the sizing procedure described in
Section 2.
6.1. WTW Analysis with Today Technology
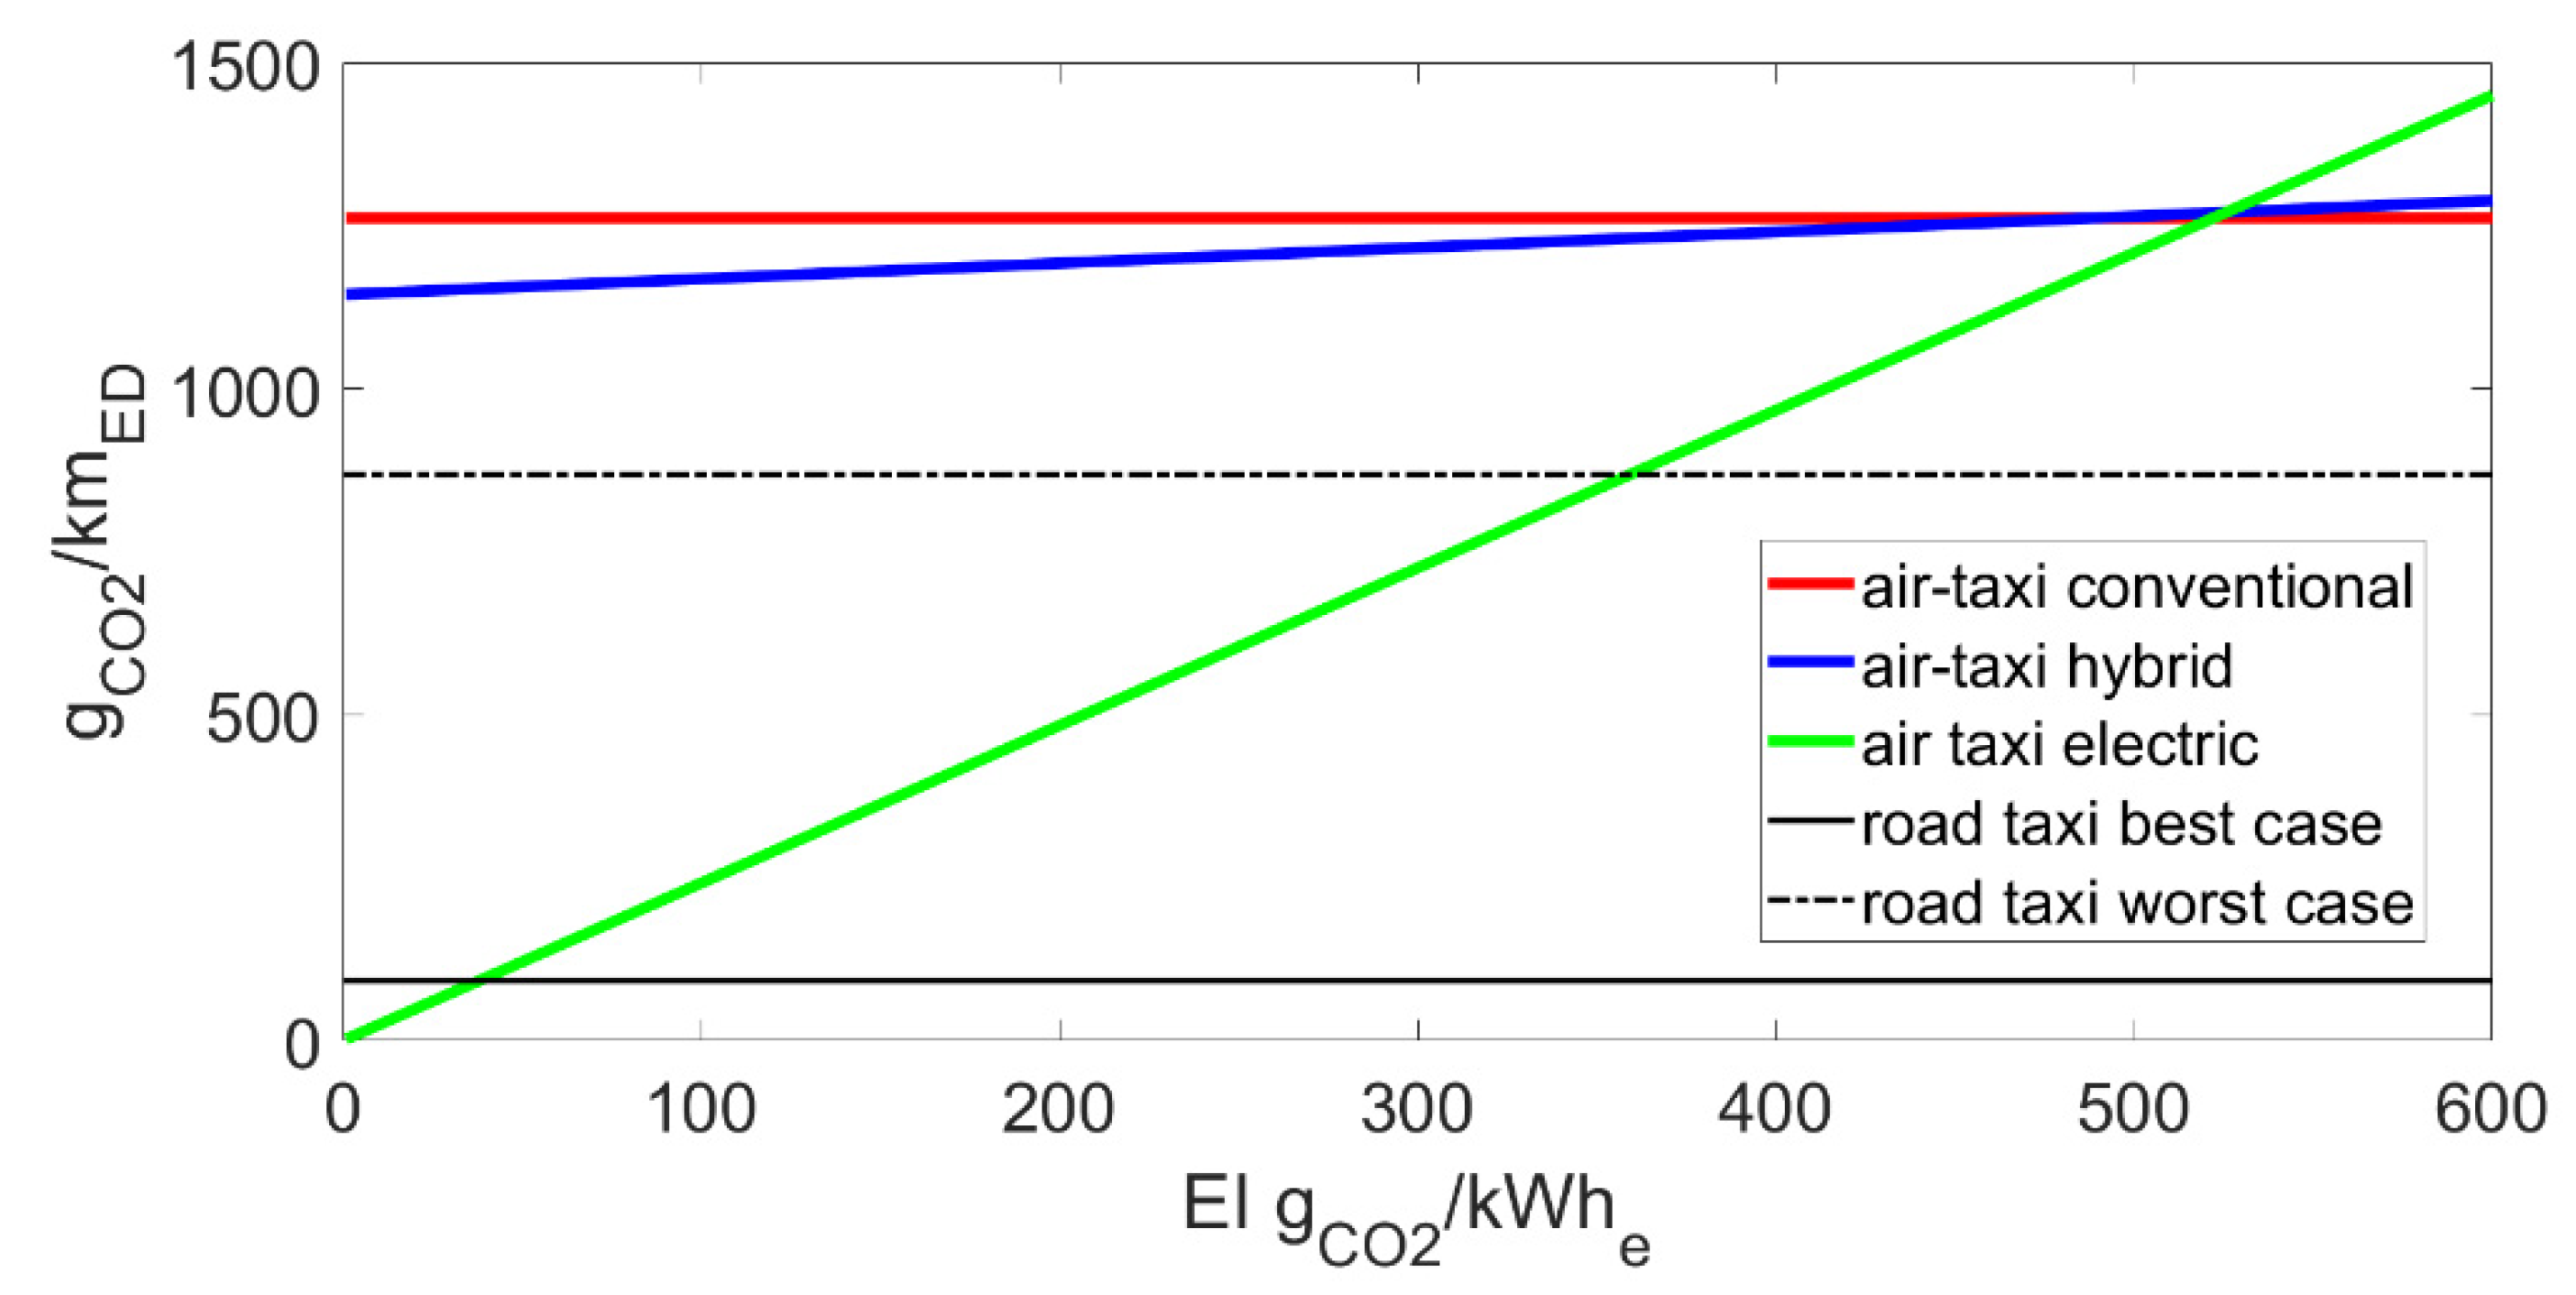
Figure 5 shows the WTW emissions of the air-taxi configurations with today’s technology as a function of the Emission Intensity of electricity production. For simplicity, only the results with the rule-based strategy are reported for the hybrid electric vehicle. The best and worst cases related to the road taxi (Toyota Prius) were obtained with the following procedure.
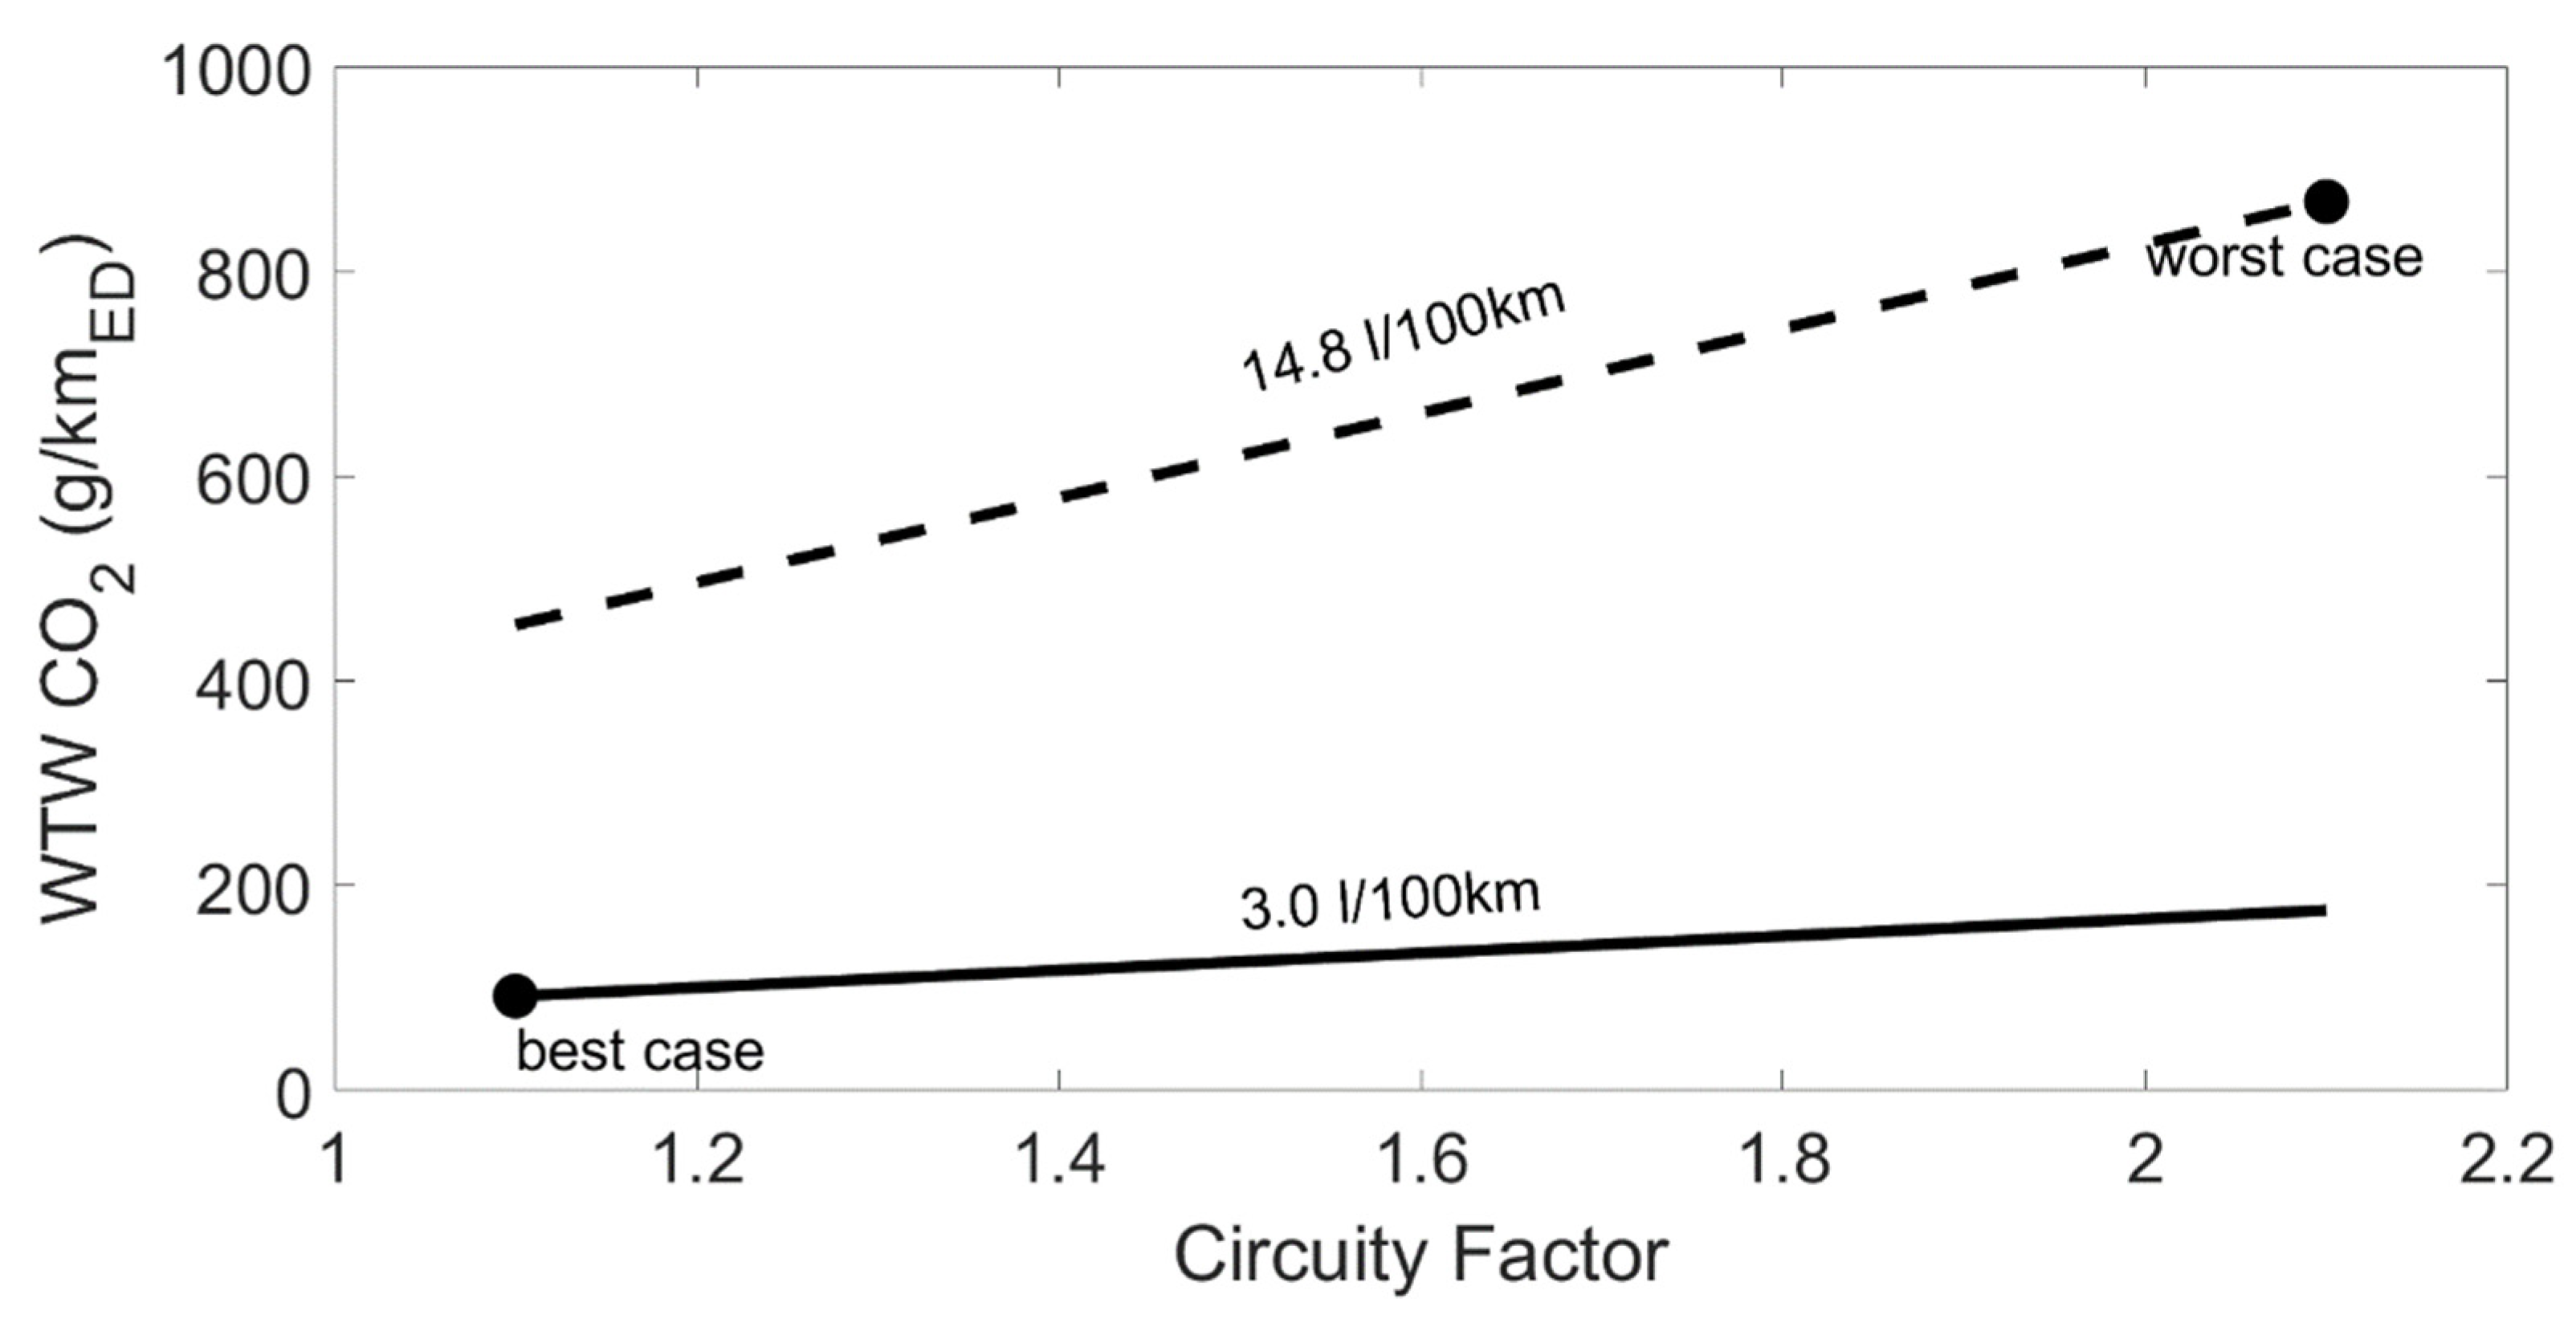
The circuity factor was increased from 1.1–2.1 [
30] and Equation (17) was applied with the two values of fuel consumption (3 and 14.8 L/100 km) representative of the best and worst conditions of traffic and driving style for the Toyota Prius to obtain the plot of
Figure 6. In the same plot, it was demonstrated that the WTW emissions of CO
2 per km of Euclidean distance ranged in the interval 92–868 g/km
ED. These are the values reported in
Figure 5 as best and worst cases for the road vehicle.
From the curve of
Figure 5, we can notice that the air taxi with conventional or hybrid electric power systems generates levels of WTW emissions per km much higher than the road vehicles, even in the worst case. For the hybrid electric powertrain, the Emission Intensity of the electricity production has a weak effect on the overall values. The emissions of the full-electric air taxi are below those of the road vehicle under the best and worst driving conditions if the EI is below 40 and 360 g/kWe, respectively.
6.2. WTW Analysis with 2035 Technology
The final comparison with 2035 technology is shown in
Figure 7. For the Nissan Leaf (road taxi) the best and worst cases were calculated with the following values: 24 kWh/100 km and a circuity factor of 2.1 as the worst case, 17 kWh/100 km and CF = 1.1 as the best case.
Even in the worst conditions, the electric road taxi is advantageous over the air taxi in terms of overall WTW emissions of CO2 per kmED.
The WTW emissions with the expected Emission Intensity of 90 g/kWe for the European Union in 2035 are quite low (67 g/km) for the full electric air taxi. Moreover, if all road taxis would be replaced by aerial vehicles, there would be a significant improvement in the traffic level with positive effects on the consumption and emissions of the whole road fleet.
Note that the two electric vehicles (road and electric air taxi with 2035 technology) have about the same mass (curb + payload) but the power demand of the aerial vehicle is much higher because of the very high cruise speed (240 km/h). As a consequence, the flight time is about 20 min while the road taxi would take from 1 to 2.5 h according to the traffic conditions with a circuity factor of 1.28 [
11,
49].
To understand the corrective measures to be taken to reduce the unfavorability of aerial vs. road vehicles, it is sufficient to analyze the terms in Equation (3) since the cruise is the most relevant flight phase in terms of energy consumption. For the road vehicle, the power request at the wheel at constant speed V and no road grade can be calculated as:
where
is the aerodynamic coefficient,
is the frontal area of the vehicle,
is the rolling friction coefficient, and
is the ambient air density. Assuming the same mass of 1800 kg for each vehicle and suitable values of
(0.7 m
2) and
(0.012) for a full-sized vehicle [
26], the power request of the road vehicle is shown in
Figure 8 and compared with those of the air taxi at the same speed (calculated from Equation (3)). Note that the road taxi power is lower than that of the aerial vehicle up to about 210 km/h, which is, however, too high a speed for a road vehicle. Moreover, improvement in
and
can be expected in the future for road vehicles that would further reduce the energy request of these vehicles.
For the aerial vehicle, the cruise power is equally influenced by and propulsive efficiency so a strong improvement of one or more of these parameters would be needed to reduce the energy consumption at constant cruise speed.
6.3. Effect of Battery Aging
The results shown in the previous section were obtained with a battery at the start of its life. If the battery-aging phenomena were considered, the same trip would require more electricity to charge the battery (because the battery would be discharged faster) and the battery would not be able to sustain the selected mission (in particular in the case of the electric vehicle with today’s technology).
To take into account the effect of battery aging, the energy consumption of the hybrid electric and electric power systems with 2035 technology was recalculated with the battery at the end of its life (equivalent to 400 full discharge–recharge cycles). The results are shown in
Table 7. For the hybrid electric case, only the results with the rule-based strategy are shown in
Figure 9. We noticed that the aging of the battery determined a slight increase in fuel consumption (+1.5%) because of the rules used during the climb. In fact, in this phase of the flight, the battery is used until its SOC reaches the value of 90%. In the case of the aged battery, this threshold is reached at the end of take-off so the climb is performed only in thermal mode. Because of the reduced capacity, increased internal resistance, and increased Peukert coefficient, the electric consumption is 12 and 27% higher for the hybrid-electric and electric configuration, respectively. The DOD is also significantly increased in both cases with a reduction in the number of consecutive missions that the vehicle can perform before fully charging the battery. The DOD affects the charging time between two subsequent flights, which also depends on the charging current. Rapid charging introduces problems in terms of charging cost, reduces the battery life, and compromises the energy density (because there is a tradeoff between energy density and power density in the design of the batteries, as already explained).
For a fully electric taxi, Uber [
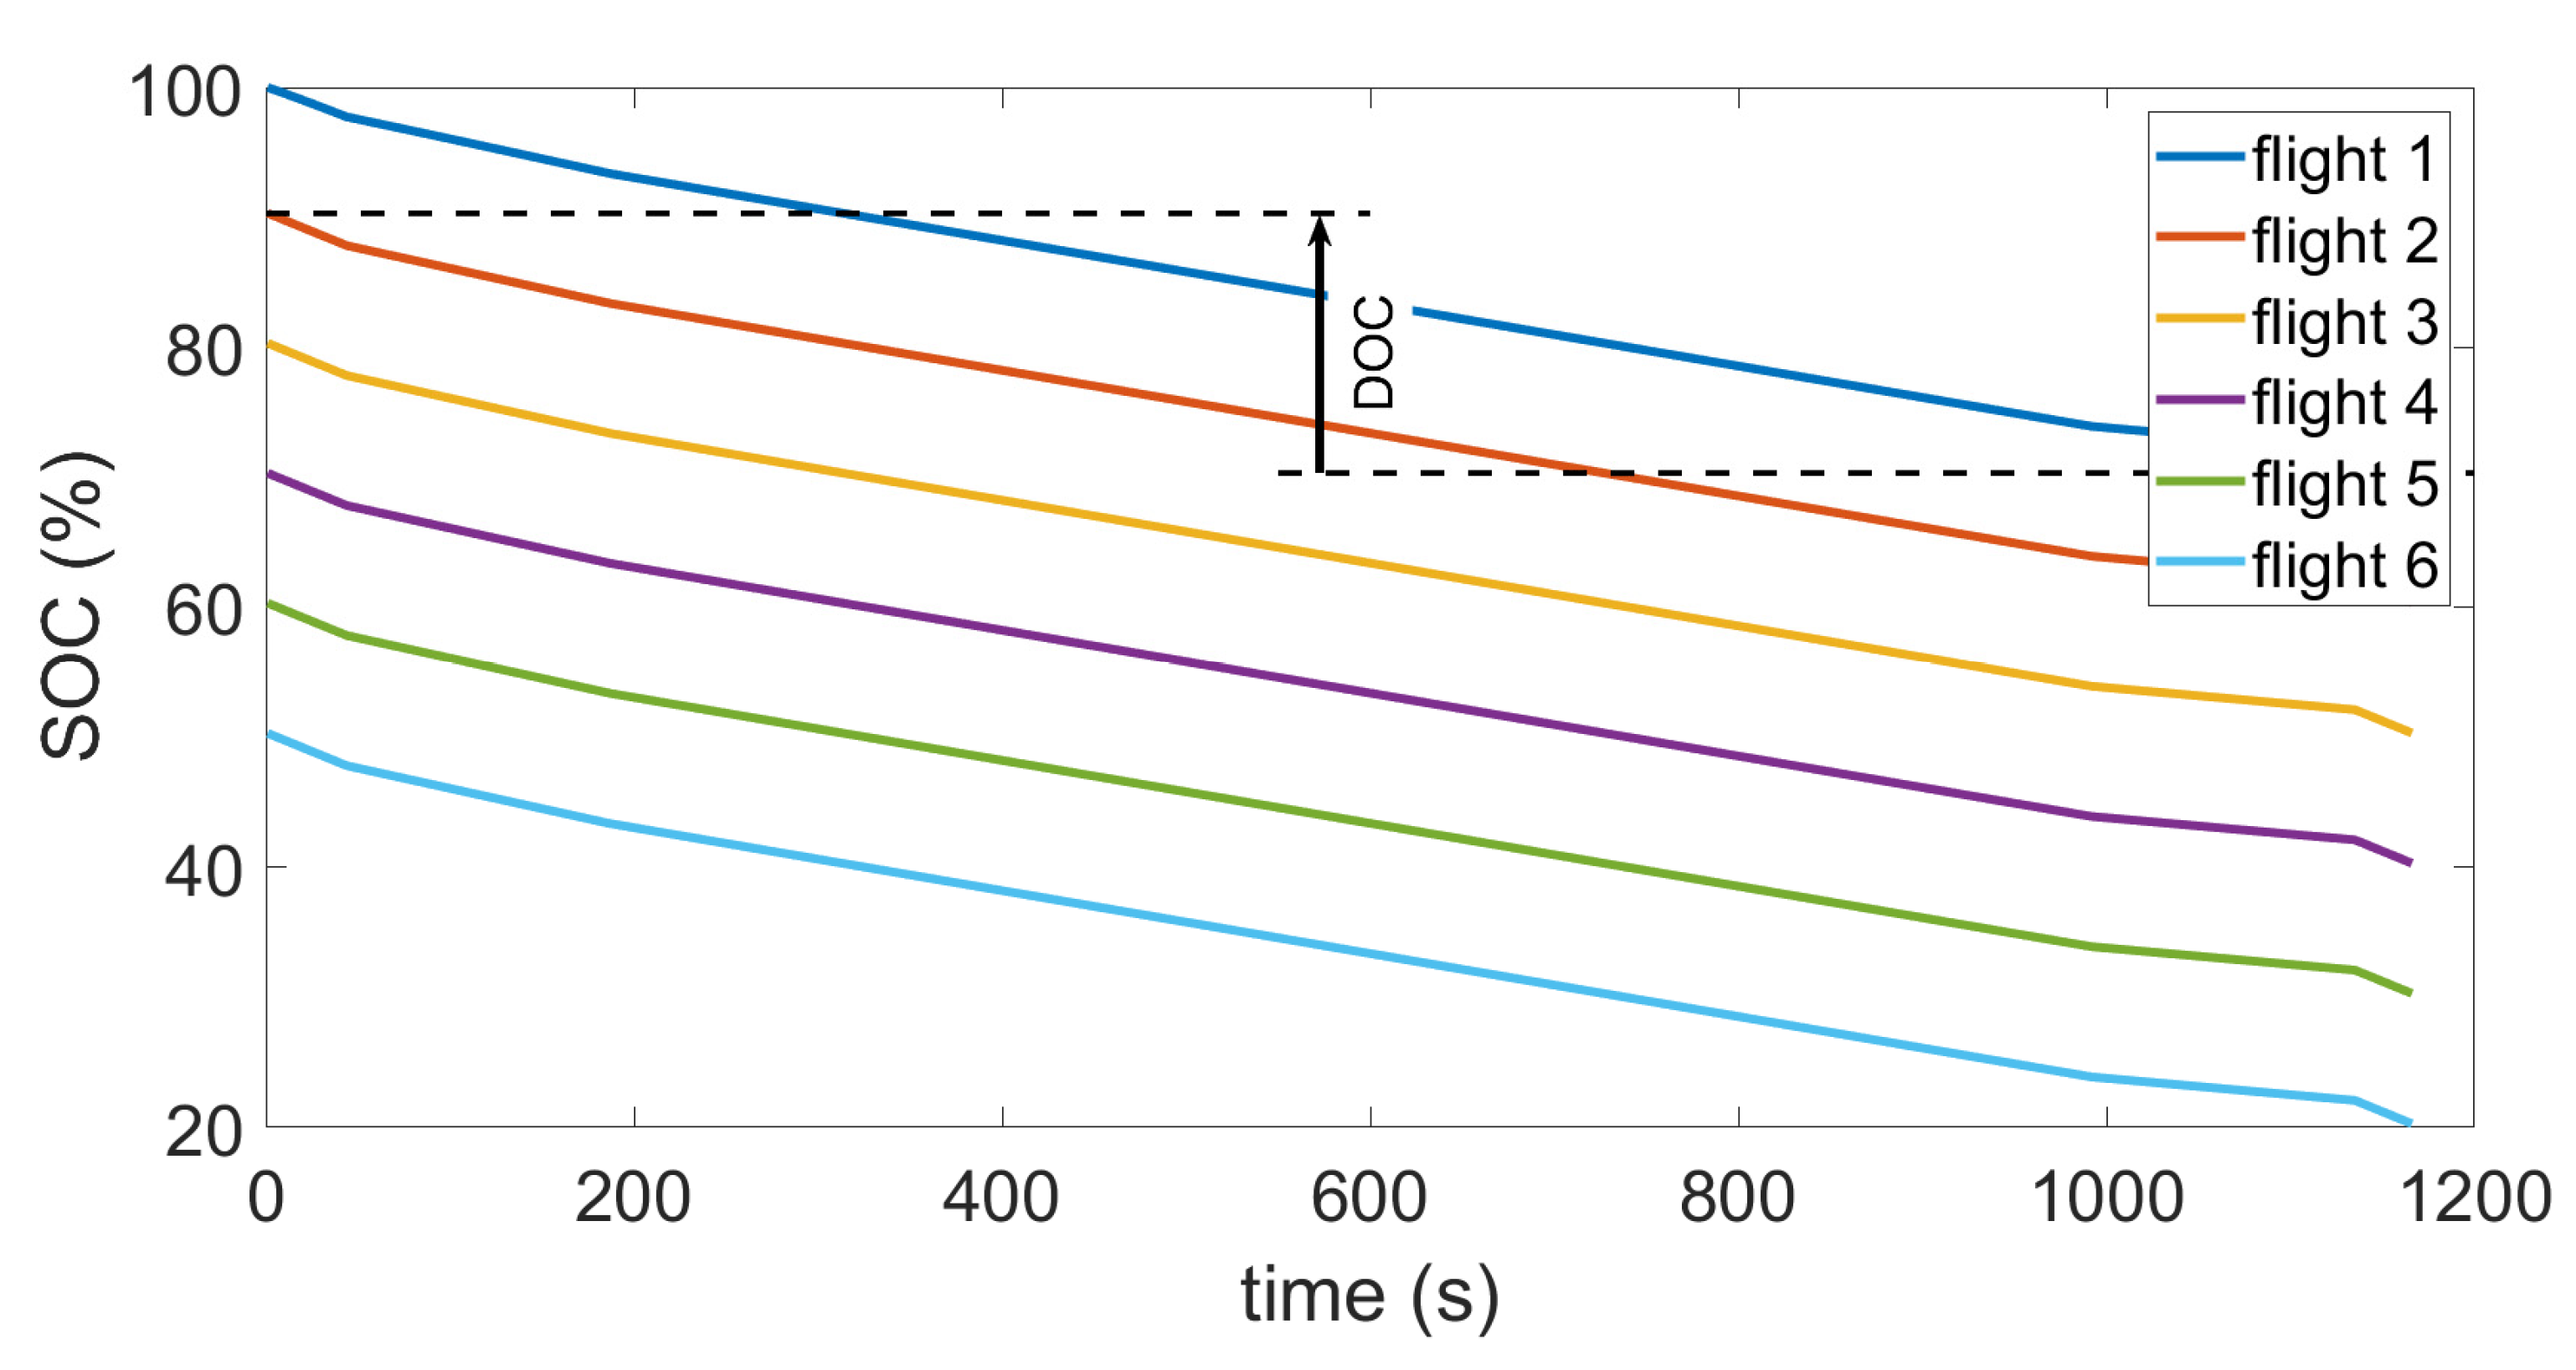
11] suggests that the vehicle should be operated continuously for at least 3 h without reaching the minimum reserve state of charge (30%) and with a 7 min recharge between each flight to partially recharge the battery. To do this, Uber suggests limiting the DOD in each mission and partially charging the battery between each mission. This approach was used here to estimate the number of consecutive missions with different levels of charging between them. This quantity was denoted as DOC (Depth of Charging) and varied between 0 (no charge) and 20%, meaning that the initial state of charge for a mission was set equal to the final SOC of the previous mission plus DOC. The simulation ended when the SOC reached the threshold of 20%. The procedure is illustrated in
Figure 10 with specific reference to the electric air taxi with 2035 technology and the battery at the beginning of its life. The arrow in the
Figure 10 explains the concept of DOC. The results obtained in the other cases are shown in
Table 8. Note that the higher the DOC, the longer the charging time between two missions. The estimation of the charging time was not performed in this investigation because it is not relevant to the goal of this investigation.
In the case of a hybrid-electric vehicle with a DOD of 20% and a new battery, the vehicle can operate continuously because the DOD is almost equal to the DOC, while in the case of an aged battery it is possible to perform seven consecutive flights. For the fully electric vehicle, the continuous flight is obtained with DOC = 29.7% when the battery is at the beginning of its life.
The number of consecutive flights without full charge is very limited (two) in the case of DOC = zero, i.e., without intermediate partial charging for both the hybrid and the electric aerial taxis.
7. Summary and Conclusions
A new and detailed methodology was developed to analyze the performance of conventional, hybrid electric, and full-electric air taxis and to compare their environmental impact with road taxis performing the same route. The novel contribution to the state of the art is in the detailed modeling approach of the powertrains, the evaluation of CO2 emissions with a Well-to- Wing approach as a function of the electricity Emission Intensity factor, and the comparison with road vehicles performing the same route in different driving conditions.
In particular, the air taxis were designed according to current and 2035 technology and modeled with an in-house simulation tool. The proposed simulation approach computes the off-design efficiencies of the engine and motor during the mission and accounts for battery non-linear discharge effects (such as the Peukert dependence of capacity from discharge current) and aging phenomena. In the case of the hybrid-electric air taxi, two different energy management strategies were considered and compared.
Reference vehicles were selected for comparison with road taxis and literature values were assumed for the consumption of these vehicles in real driving conditions. The comparison demonstrated the advantages of the electrified air taxi with today’s technology over a hybrid-electric road taxi, especially in the case of low emission intensity of the electricity production and penalizing boundary conditions (congested traffic, aggressive driving style, and high values of circuity factor). In the case of 2035 technology, the comparison with a fully electric road vehicle was unfavorable but the WTW emissions with the expected Emission Intensity of 90 g/kWe for the European Union in 2035 were quite low (67 g/km). Note that these results could be interpolated for a reasonable estimation of the energy consumption and CO2 emissions with short-term improvement (such as, for example, 2025 technologies).
The results of the simulation performed with the aged battery underlined the negative effect of this phenomenon on the consumption of the air taxi and on the number of consecutive flights that can be performed with fast intermediate charging of the battery. These results stress the importance of improving the battery technology not only in terms of power and energy density but also in terms of calendar and cycle life to enhance the usage of electrified propulsion systems as an air-taxi service. In future work, the authors will tackle the development of a dynamic model of the hybrid electric power system to account for the shaft dynamic of the rotorcraft and the transient behavior of the fuel system of the turboshaft engine.


