Abstract
To limit the global temperature change to no more than 2 °C by reducing global emissions, the European Union (EU) set up a goal of a 20% improvement on energy efficiency, a 20% cut of greenhouse gas emissions, and a 20% share of energy from renewable sources by 2020 (10% share of renewable energy (RE), specifically in the transport sector). By 2030, the goal is a 27% improvement in energy efficiency, a 40% cut of greenhouse gas emissions, and a 27% share of RE. However, the integration of RE in energy system faces multiple challenges. The geographical distribution of energy supply changes significantly the availability of the primary energy source (wind, solar, water) and is the determining factor, rather than where the consumers are. This leads to an increasing demand to match supply and demand for power. Especially intermittent RE like wind and solar power face the issue of energy production unrelated to demand (issue of excess energy production beyond demand and/or grid capacity) and forecast errors leading to an increasing demand for grid services like balancing power. Megawatt electrolyzer units (beyond 3 MW) can provide a technical solution to convert large amounts of excess electricity into hydrogen for industrial applications, substitute for natural gas, or the decarbonization of the mobility sector. The demonstration of successful MW electrolyzer operation providing grid services under dynamic conditions as request by the grid can broaden the opportunities of new business models that demonstrate the profitability of an electrolyzer in these market conditions. The aim of this work is the demonstration of a technical solution utilizing Pressurized Alkaline Electrolyzer (PAE) technology for providing grid balancing services and harvesting Renewable Energy Sources (RES) under realistic circumstances. In order to identify any differences between local market and grid requirements, the work focused on a demonstration site located in Austria, deemed as a viable business case for the operation of a large-scale electrolyzer. The site is adapted to specific local conditions commonly found throughout Europe. To achieve this, this study uses a market-based solution that aims at providing value-adding services and cash inflows, stemming from the grid balancing services it provides. Moreover, the work assesses the viability of various business cases by analyzing (qualitatively and quantitatively) additional business models (in terms of business opportunities/energy source, potential grid service provision, and hydrogen demand) and analyzing the value and size of the markets developing recommendations for relevant stakeholder to decrease market barriers.
1. Introduction
The replacement of fossil fuels with renewable energy sources at the EU level will demand a total transformation of its energy system [1,2,3]. The new EU energy system will be characterized by two basic modifications: (1) highly increasing power generation from Renewable Energy Sources and (2) increased electrification of energy end-use segments. The combination of the above parameters creates significant challenges for the electrical stability of the emerging power system, since on the one hand the power supply is intermittent (wind and solar power production varies significantly both in the short and long-term), and on the other hand the power demand is variable (daily and seasonal), resulting in the fact that they do not easily match over long periods of time. These characteristics of the new energy system result in problems related to the voltage and frequency of the electrical network and to frequent power curtailments, especially from wind parks [4].
These problems are even more severe in autonomous-isolated power systems, such as the ones serving non-interconnected islands. Therefore, measures related to energy storage to achieve grid balancing should be enforced in the electricity networks at an EU level. Such measures will significantly contribute in higher RES penetration and in the production of useful energy carriers (electricity and hydrogen) that could be used in a variety of applications. The variable power production of renewables, especially when exceeding specific thresholds, in combination with the daily and seasonal variable power demand, creates a need for short- and long-term grid balancing [4].
The concept of grid balancing is related to the introduction of additional load demand, especially in the periods of high renewable energy production and low power demand, absorbing excess renewable energy, which can be sent back to the grid at periods of low production from wind and solar parks and relatively high demand.
It is widely known [5,6,7] that in order to balance the variations of power production from renewables and power consumption and ensure that stability of the electricity grid, there are different methods and approaches.
The simplest balancing method, which has been used widely in the past is the enforcement of power curtailments in wind parks mainly at periods of high renewable energy production. According to this method, the operator of the electricity grid provides wind energy producers with low set-points of operation/production, or even shuts-off the entire wind energy production. This method is highly ineffective, since on the one hand it significantly increases the payback period of large investments in the field of renewable energy and on the other hand it significantly reduces renewable energy penetration in the overall energy system [8]. In case of high demand and low renewable energy production, the simplest method used in the past was to turn on additional generators driven by fossil fuels, which is not a viable option as well, since this strategy is not compatible with EU decarbonization targets [9].
Extensive research has already been done in order to explore the potential of integrating renewable energy sources with electrolyzers and fuel cells for the stabilizing of the power grid. This research concerns not only the pure technical part, but the economical part as well. Matute et al. [10] showed for the case of Spain that the use of multi-MW electrolysis for the provision of grid balancing services appears to be a promising option in order to obtain cost competitive hydrogen. Gutierrez-Martın et al. [11] also examined different scenarios for the adoption of hydrogen use for electric grid balancing in the Spanish power system, showcasing the feasibility of a 42% renewable energy penetration. Guinot et al. [12] investigated the economic viability of an electrolysis-based hydrogen power plant, which provides balancing services to the network and highlighted the threshold values within which it could become economically attractive. Mansilla et al. [13] examined possible cost reductions in hydrogen production by a discontinuous operation of alkaline electrolyzers, observing a 4% increase in profits compared to continuous operation. Grueger et al. [14] investigated the integration of electrolyzers with wind turbines as a means to balance any fluctuations in the grid, showcasing the profitability of the above under the suitable circumstances. Sorensen [15] showed the effect of power to power systems including hydrogen production on the renewable energy penetration for northern European grids. Paulus et al. [16] examined the effects of electrolyzer operation for the provision of grid services in an industrial context, while Jorgensen et al. [17] investigated the effect on hydrogen pricing resulting from the adoption of an electrolysis unit, powered by curtailed wind power with the subsequent participation in the power market. Kiaee et al. [18] demonstrated the feasibility of utilizing alkaline electrolyzers for regulating the grid’s frequency, based on the fast response to varying operation loads, which can be achieved by such devices.
The three leading technologies for electrolysis are the Proton Exchange Membrane (PEM) electrolyzers, the Solid Oxide Electrolysis Cell (SOEC) electrolyzers, and the alkaline electrolyzers, each of which comes with its benefits and its drawbacks. SOEC electrolyzers still are a relatively immature technology, but show great potential, due to certain characteristics such as their ability to operate reversibly. PEM electrolyzers provide high current densities and high hydrogen purity, while presenting the ability to respond to variable loads in a satisfying manner. Alkaline electrolyzers, while not as flexible as PEM electrolyzers, due to their ability to overload operation up to 150% seem ideal for power to gas applications, coupled with intermittent power supply. Besides, pressurized alkaline electrolyzers tend to contribute to an overall lower power consumption due to the fact that the energy needed for compression by an external compressor is lower [19].
The new and emerging EU energy system uses modern and innovative techniques for grid balancing. The first approach for the new grid balancing method is a combination of coupling different sectors and an interconnection of the building heating and cooling demand, the transport and industrial sector as energy consumers with power generation. Such an approach provides a higher stability to the renewable energy system [20]. The second approach for grid stabilization and balancing is the application of long-term storage/discharge technologies. The third approach is the transportation of energy from centers of supply to centers of demand, using also smart grid techniques. The first approach enables balanced demand between different sectors, the second one provides grid balancing directly through the storage/discharge units of renewable power, while the third approach can be combined with the other two, in order to come up with a stabilized, efficient, and environmentally friendly EU energy system.
Hydrogen is an ideal solution for grid balancing, both as a mechanism for the coupling of sectors, and as a long-term plus large-scale energy storage option [21]. Hydrogen can also serve ideally the third grid balancing approach as well, since it can be transported from centers of supply to centers of demand. In other words, hydrogen is necessary to ensure the transition to the transformed EU energy system [21]. In more detail, the contribution of hydrogen to grid balancing of the emerging EU system (for each of the three approaches) is analyzed below.
1.1. Sector Coupling
The basic concept behind coupling of sectors lies in the direct connection of power generation with other energy demand sectors, such as the one of transport. This approach solves two problems related to grid balancing: (a) energy is not produced at the location where it is required and (b) it is not produced at the time it is required. The following technologies of the approach are used:
Power to heat: This is an interesting technology, using the excess of renewable energy production to supply heating/cooling for buildings or other infrastructure, driving electric boilers, heat pumps, etc., or feed it directly into the district heating infrastructure, wherever it is available. The power to heat technique is generally efficient, yet nevertheless has specific drawbacks: (a) it can only be used in specific applications (buildings and infrastructure), (b) it does not contribute significantly to grid stabilization, since the timing of excess renewable energy production and heating/cooling demand is usually different, and (c) long-term heating storage is not possible without degradation.
Power to gas: This is a more flexible sector coupling option in terms of achieving grid balancing and stabilization. Hydrogen can play an important role in this method, since in contradiction with other gases, the conversion of excess power to hydrogen through electrolysis can be a cost-efficient solution, especially when there is abundant renewable power. By using this method of hydrogen production through electrolysis driven by excess renewable energy, the emerging EU system can be stabilized on a yearly basis and high RES penetration accompanied with very low wind energy curtailments can be achieved. Hydrogen is as flexible as natural gas, and in addition this option produces zero greenhouse gas emissions (especially CO2). Moreover, hydrogen has the advantages of rapid scale-up, storage, and efficient power distribution to a variety of other energy consuming segments, without introducing a need for major infrastructure modifications as well.
1.2. Storage and Discharge
The option of storage/discharge is complementary to the approach of sector coupling, in order to achieve direct grid balancing and stabilization. Batteries can be considered as an obvious solution for this method of grid balancing, but they have specific disadvantages: (a) they can only store energy for short-term periods, (b) they are also expensive when taking into account the amount of energy stored, and (c) they have significantly lower energy density. Therefore, the main drawback of this technology is that they cannot store high energy amounts, especially for longer periods of time. With respect to storage and discharge method for grid balancing, there are specific technologies that can be used:
Pumped Hydro: This is a well appreciated long-term energy storage option, which unfortunately has a limited application in the EU energy system. Another drawback of this technology is the fact that it has specific natural, regulatory, permitting, and social-related barriers. Pumped hydro units have also another disadvantage: they can only be installed in selected geographical areas, having specific characteristics, therefore their application is limited
Hydrogen: It has the advantages of storing energy in the long-term, at higher quantities (large-scale energy storage), and at a competitive cost as well, when compared to other conventional large-scale energy storage technologies, such as pumped hydro. This storage/discharge option may have a lower conversion efficiency compared to other technologies, it is widely accepted that the re-electrification of hydrogen (and the associated low conversion factors) will not be required, since hydrogen can be used in a variety of applications, such as the transport and industrial sector and also provide heat for buildings and related infrastructure. Another advantage of hydrogen compared to other storage solutions, such as pumped hydro is the fact that the EU has significant H2 storage capacities. EU has a grid capacity of 36 billion m3 and if we assume a 10% blending, then the energy storage capacity in the form of hydrogen is in the order of 100 TWh [22]. Specific geological formations, such as salt caverns and depleted gas fields, will be used in the future for storing hydrogen. It has been calculated that almost 40 TWh of hydrogen can be stored only in salt caverns in the EU [23]. It is also important that the technical feasibility of this concept has already been proved, since six projects related to storing hydrogen in salt caverns are already in operation today.
1.3. Transportation of Energy
This is the third approach for grid balancing, dealing with the fact that except from the seasonality of supply, the location of supply is also critical. It is widely known that the renewable energy installations are often situated in areas that cannot absorb the entire production of wind and solar parks. The solution of building energy transmission lines infrastructure has a high cost. Hydrogen provides an advantageous solution for this grid balancing approach as well, since after the conversion of electricity to this energy carrier, it can be transported in liquid and compressed form, or transferred through pipelines.
In Figure 1, a comparison of sector coupling and storage technologies is depicted, clearly showing the advantages of hydrogen use in grid balancing applications.
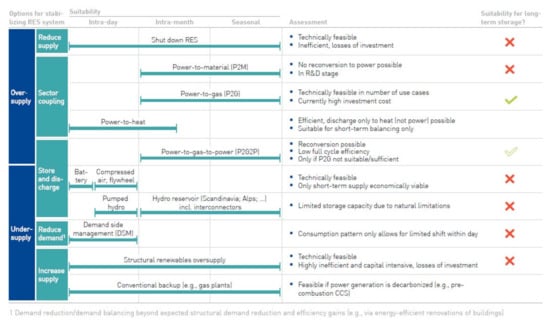
Figure 1.
Comparison of sector coupling and storage technologies for grid balancing [21].
The following work aims at evaluating potential benefits, stemming from the use of hydrogen in grid balancing applications, while identifying different value streams resulting from the integration with industrial settings. One of the main findings of this study is the need for inter-sector co-operation for achieving profitable business cases based on hydrogen adoption.
2. EU Policies for the Promotion of Renewable Energy Sources and Energy Storage
In the context of this paragraph, the most significant EU policies for the promotion of renewable energy sources and energy storage will be presented. Specific targets for the targeted EU member states (Spain, Austria, and Greece) in these fields will also be demonstrated.
2.1. EU Policies for the Promotion of Renewable Energy Sources
The promotion of renewable energy sources in the European Union has been adopted through the Directive 2009/28/EC, which sets specific goals for the RE share in the European energy mix of at least 20% by 2020. The above mentioned directive was revised in 2018. The revised renewable energy directive resulted in a European policy adopting one of the most ambitious policies in the field worldwide. The revised renewable energy directive is part of the Clean Energy for all Europeans package. The main components of this policy are the following [2]:
- The revised renewable energy EU directive continues European leadership in the field, setting a binding target of renewables of at least 27% by 2030 in the energy system of Europe.
- The directive significantly contributes to Europe’s fight against climate change and the achievement of Paris Agreement climate goals.
- The new directive contributes in the protection of EU environment and will specifically help in reducing air pollution in European cities and regions.
- The revised renewable energy EU directive gives the chance (and allows) to households, communities, and companies to become producers of clean energy and contribute to the reduction of greenhouse gas emissions.
- It also reduces the dependency of the European Union on energy imports and increases the security of energy supply.
- The revised RE directive highly contributes in the creation of more job positions and in the attraction of new investments in the European economy related to energy.
- The new policy framework established for renewables, incorporated through the adoption of the revised EU directive results in specific benefits:
- o
- It provides a longer-term risk reduction for investors and speeds up the procedures to receive permits for renewable energy projects.
- o
- It introduces an innovation, where the energy consumer has an important role in the energy transition, having a clear right to produce their own renewable energy and distribute it to the European electricity grid.
- o
- It helps increasing the competition and the integration of renewable electricity to the market.
- o
- It will accelerate the uptake of renewable energy sources in other sectors such as heating/cooling and transport applications.
- o
- It has a main focus on increasing the sustainability of bio-energy and promoting innovative technologies (including hydrogen production as a grid-balancing method).
The policies and measures for the targeted countries (Austria, Greece, and Spain) for the promotion of renewable energy sources will be presented in detail in the following sections.
2.1.1. Austria
The 2010 National Renewable Energy Action Plan [24] of the country was developed in order to adopt Directive 2009/28/EC. According to this directive, Austria should have increased its renewable energy share in the final energy consumption to 34% by 2020. This figure in 2005, which is used as a base year, was 24.4%, while in 2008 this value had already reached 29%. The achievement of this target will be based on the following two conditions:
- In comparison to the reference scenario of base year 2005, a total reduction of final energy consumption in the order of 13% should be achieved.
- The installed capacity of renewable energy should be increased by 18% in comparison to the installed capacity of 2008.
The target of 34% renewables in the final energy consumption of Austria can be achieved by different combinations of each renewable energy technology. In addition to renewable energy technologies producing electricity such as wind, solar, and hydro, the exhaustion of available biomass potential is important to provide heating and cooling, while achieving the 10% biofuel target. To determine the final energy mix of different renewable energy technologies in order to achieve the above-mentioned target, the factors of cost-efficiency, resource availability, and environmental protection are taken into account.
With respect to the decrease of final energy consumption compared to the reference scenario, required in the context of the national renewable energy plan of Austria, the following reductions should be achieved in the three main areas of energy use:
- 22% reduction in the transport sector,
- 12% reduction in heating and cooling, and
- 5% reduction in the electricity sector.
The National Renewable Energy Action Plan identifies the existing or planned measures and policies that will be used in order to achieve its targets and promote the use of energy produced from renewable energy sources. The most significant measures and policies in the Austrian plan are presented in Table 1.

Table 1.
Overview of all policies and measures of the National Renewable Energy Action Plan of Austria [24].
2.1.2. Spain
The National Renewable Energy Action Plan of Spain [25] foresaw that the Share of Renewables in the Annual Average Electricity Demand Would be Close to 40% by 2020. The Breakdown between Different Renewable Energy Technologies Shows that Wind Energy Has the Lion Share of the whole re production (in the order of 52%), and is followed at a high distance from Hydro, Solar Thermoelectric and Solar Photovoltaic which Have a Share of Respectively 8.3%, 3.8% and 3.6% of Gross Total Electricity Generation. The National Electricity Balance of Spain is presented in Table 2.
Table 2.
National Electricity Balance of Spain [25].
According to the Spanish National Renewable Energy Action Plan, the share of energy from renewable energy sources in the gross final consumption of energy was 8.7% in 2005 (base year). The target for energy from renewables in gross final consumption of energy for the year 2020 was 20%, while the total expected adjusted energy consumption in year 2020 was 97,041 ktoe, from which 19,408 ktoe would come from renewable energy sources.
Spain’s target and estimated trajectory of energy from renewable energy sources in heating and cooling, electricity, and transport are presented in Table 3.
Table 3.
Spain’s target and estimated trajectories in heating/cooling, transport, and electricity [25].
Measures and policies to support the achievement of Spain’s targets in the renewable energy sector are presented in Table 4 and Table 5.
Table 4.
General measures [25].
Table 5.
Measures in the field of electricity generation using renewables [25].
2.1.3. Greece
The National Renewable Energy Action Plan of Greece [26] describes the procedures and goals of the country in order to promote the penetration of renewable energy sources and meets the obligations imposed by the 2009/28/EC Directive. According to the Greek National Renewable Energy Action Plan, the share of energy from renewable energy sources in the gross final consumption of energy in the country was 6.9% in 2005 (base year). The target for energy from renewables in gross final consumption of energy for the year 2020 was 18%, while the total expected adjusted energy consumption in the year 2020 was expected to be 24,114 ktoe, from which 4341 ktoe would come from renewable energy sources.
Greece’s target and estimated trajectory of energy from renewable energy sources in heating and cooling, electricity, and transport are presented in Table 6.
Table 6.
Greece’s target and estimated trajectories in heating/cooling, transport, and electricity [26].
Measures and policies to support the achievement of Greece’s targets in the renewable energy sector are presented in Table 7.
Table 7.
Selected measures and policies of the Greek National Renewable Energy Action Plan [26].
2.2. EU Policies for the Promotion of Energy Storage (Including Hydrogen)
Energy storage, both short- and longer-term has been recognized as a prerequisite for higher RES penetration and grid balancing in the EU. The objective of this paragraph is to present policies adopted by the European Commission and the Member States as well those that support the promotion of energy storage. Focus will also be given to the countries of Austria, Spain, and Greece.
Energy storage has a growing role in the energy transition of the European Commission. It contributes in the following:
- Greenhouse gases reduction
- Decarbonization of other economic sectors such as the transport and industrial sector
- More electricity in the energy consumption
- It is necessary to bring up changes in the electricity mix: in more detail it helps phasing out conventional generation and introducing more intermittent renewables.
The following steps related to energy storage and its promotion to the European energy system have been made so far:
- Definition of energy storage and set-up of basic policy principles
- Electricity market design
- Storage technologies initiatives have been developed
- Sector coupling (electricity, gas, heating, industry, transport, agriculture)
- Support of Energy Storage Projects,
- Discussion with stakeholders.
With respect to the latter step (discussion with stakeholders), the European Commission asked stakeholders to answer to the following questions:
- Why does the energy system need storage?
- What are the barriers (regulatory, fiscal, economic, technical) in the deployment of energy storage?
- Is the regulatory framework sufficient to ensure that markets can deploy energy storage?
- Should the EU make further efforts? What type of actions/policy options should be considered?
In the following paragraphs, the above-mentioned six (6) steps related to energy storage and its promotion as a means of grid balancing amongst other, will be analyzed in detail.
Definition and policy principles: According to the Proposal of Electricity Directive (recast), Article 2, “Energy Storage” means (in terms of an electricity system) deferring an amount of the electricity that was generated to the moment of use, either as final energy or converted into another energy carrier. The following principles support the market development of energy storage:
- Contribution in energy security and decarbonization targets of the electricity system
- Participation in electricity markets
- Participation with equal terms with providers of flexibility services
- The cost-efficient use of decentralized energy storage and its integration into the system should be enabled in a non-discriminatory way
Electricity market design: The Electricity Market is designed by taking into consideration certain rules that ensure the flexibility of energy storage:
- It ensures the neutrality of network operators vis-à-vis new business activities in storage: In more detail, when a network operator needs energy to manage its network, this energy is procured from market participants, and only in cases there are no market interests at all, a regulatory authority may grant a temporary derogation.
- Regulatory authorities should ensure that charges for access to network do not discriminate energy storage.
- Storage deployment will be facilitated by the fact that stricter rules on RES curtailment (in combination with higher targets on RES penetration) exist.
- In day-ahead and intra-day market, energy trading should be as close to real time as possible and a bid size should not exceed 1 MW.
- Strengthening of short-term price signals will ensure that electricity prices provide correct and meaningful production and investment signals.
- Risk preparedness: all measure, including storage that will help in avoiding crisis or containing a crisis are equally relevant.
Storage technologies initiatives: The following energy storage technologies initiatives already exist at EU level:
- Technological innovation in energy storage is strongly supported and financed by the EU under the HORIZON 2020 Programme.
- The collaboration within the Strategic Energy Technology Plan (SET Plan) enables EU players to define priorities on research and innovation and collaborate in the energy sector. This includes also the action on smart energy system and the action on batteries.
- The technologies related to the use of electricity to produce gas, mainly hydrogen, are managed through a specific program office, the Fuel Cells and Hydrogen Joint Undertaking (FCH JU).
- The EU Battery Alliance aims to create competitive and sustainable battery cell manufacturing in Europe, supported by a full EU-based value chain. The Action Plan supporting this alliance was published by the European Commission in May 2018.
Sector coupling: The objectives of coupling between different sectors (electricity, heating and cooling, transport, industry, and agriculture) are the following:
- The basic concept lies in both physical and market coupling of the electricity, gas, heating and cooling with other economic sectors (industry, transport, agriculture)
- It is a tool contributing to the decarbonization of the energy system, while in parallel provides the necessary flexibility to the electricity and has networks (e.g., excess of decarbonized electricity is transformed to other forms of energy for temporary storage, or direct use, or for the production of useful products)
- There are several studies available at the EU level, aiming to identify:
- o
- Existing regulatory barriers and potential gaps to the coupling, in particular of electricity, gas, and heating sectors.
- o
- Recommendations to overcome barriers/fill the gaps.
Support of Energy Storage Projects: The following support is given to energy storage projects by the EU:
- Energy Storage Projects in electricity can also become Projects of Common Interest (PCIs).
- In the context of the TEN-E infrastructure framework, large storage projects, above 225 MW, may be included in the selection process for the PCI. Smaller storage units may be part of smart grid PCIs.
- In November 2017, the European Commission published its third list of PCIs, which includes 15 storage projects in electricity (11 projects on pumped hydro storage and 4 projects on compressed air energy storage).
Discussion with stakeholders: The following interaction with different stakeholders and the EC has been done [9]:
- High level roundtable on energy storage and sectoral integration was organized on March 2018. Representatives from industry, research, and the European Commission participated in the discussions related to the role of energy storage and sectoral integration in the transition to a low-carbon economy.
- Discussions with member states at the Electricity Co-ordination Group took place on July 2018.
In more detail, the following policies aiming to regulate the contribution of energy storage in the EU electricity market have been designed by the commission:
- Balancing: The concept of financial responsibility is defined with an aim of balancing the energy system with the contribution of all participants of the energy market.
- Day ahead and intra-day: The electricity market is evaluated in time periods of 15 min and facilitates bids up to 1MW.
- Price caps: There exist no maximum or minimum price caps.
- Priority dispatching: Priority is given to small-scale renewable energy producers as to high efficiency CHP.
- Curtailment of re-dispatching: There is curtailment only in case it is cost efficient and while it is not exceeding 5%.
- Bidding zone: The bidding zones are shaped according to the observed long-term high-demand scenarios.
- Network congestion: Any issues of network congestion should be resolved by utilizing non-discriminatory solutions that are adapted to the market needs.
- Grid fees: The fee structure is being recommended partially by ACER. The structure should take into consideration issues such as customer’s profile, the presence of energy storage, etc.
- Regional TSO cooperation is assured by developing solutions at the regional level.
- The “EU DSO entity” has a twofold role: (a) The co-ordination of transmission and distribution networks, and (b) the integration of RES with distributed power generation, energy storage, etc.
In the next sections, the initiatives, measures, and policies related to energy storage and hydrogen in particular, at national level of the three targeted countries (Austria, Spain, and Greece), will be presented.
2.2.1. Austria
Austrian Climate and Energy Strategy (2030-objectives)
- Share of 44–50% renewable energy in gross final energy consumption by 2030 (currently 33.5%).
- A total of 100% of total national electricity consumption from renewable energy sources by 2030 (currently 72%).
- Transition to low and zero-emission vehicles via alternative propulsion systems and fuels based on renewable energies (battery vehicles, fuel cell vehicles, bio-gas, and liquid bio-fuels).
National Hydrogen Strategy
- This strategy is being developed by BMVIT and the Ministry for Sustainability and Tourism in close cooperation with science and industry until the end of 2019.
- The strategy is part of the contents of the European Hydrogen Initiative initiated by Austria during the EU-presidency. The elaborated targets and measures will be included in the National Climate and Energy Plan, which will be submitted to the EC by the end of this year, which will already be partially implemented in the Renewable Development Act (EAG) 2020.
- Four working groups:
- o
- Infrastructure, generation, and storage
- o
- Greening the gas
- o
- Hydrogen in industrial processes
- o
- Fuel cells and hydrogen end-use (mobility and buildings).
European Hydrogen Initiative
- Objective: Maximize the great potentials of sustainable hydrogen technology for the decarbonization of multiple sectors, the energy system, and for the long-term energy security of the EU.
- Signatories: 23 EU member states and more than 100 companies and research organizations.
- Conversion of hydrogen to renewable natural gas: Austria explores the most effective conversion of renewable hydrogen into synthetic methane and other renewable fuels.
- Sector integration and coupling: Austria emphasizes the role of hydrogen as a promising link between the electricity, industry, and mobility sectors. In this way, new opportunities arise, in activities such as energy flexibility, availability, and security, as well as improved efficiency and cost-effectiveness, which contribute to the overall decarbonization of the energy sector.
- Industry: Austria promotes the use of renewable hydrogen as well as derived products in industrial processes.
Austria as a potential hydrogen valley in the heart of Europe
- Bridging many neighboring countries including eastern Europe.
- Central player of the European natural gas grid with huge storage capacity.
- High share in renewable energy sources: second in Europe in transport, approaching 100% renewable electricity.
- Strong energy sector and vehicle industry as well as high R&D-competence.
- Complementarity with other European counties as provider of supply components and engineering services.
Challenges
- Dependency on energy imports: fossil fuels worth around €400 billion are imported annually, which accounts for more than 25% of all imports into the EU.
- Emission reduction: simultaneous reduction of greenhouse gases, pollutants, and noise to achieve EC climate goals, COP21 objectives, and clear air regulations.
- Storage of intermittent renewable energy sources, setup of nationwide grid of hydrogen refueling stations, development of cheap and reliable fuel cells.
Austrian automotive industry
- Automotive industry is a global key industry sector and one of the most successful industrial branches in Austria.
- 75,000 employees and 700 companies.
- Turnover of 21.5 billion €/year.
- Automotive export revenues three times higher than import expenditures.
- 26% of employees in R&D and 21,459€ for R&D per employee (industrial average of 8700 €).
2.2.2. Spain
Policies Enabling Demand Response in Spain
Currently, in Spain the only possibility to provide grid services using loads [2] is called interruptibility grid service and is meant for situations where there is not enough generation to supply the demand [2]. This could be due to a peak of extraordinary consumption, or a sudden loss of production, which are not usual events in Spain due to the sufficient capacity of the generation system. The service is regulated by Order IET/2013/2013 [27], which establishes the competitive mechanism of assignation of the interruptibility demand management grid service. The service awards large industrial consumers and has been used very few times in the past decade until 2018, when the transmission system operator (TSO) Red Eléctrica de España decided to use it with economic criteria to lower electricity prices instead of restricting it to shortcoming technical issues. Since the beginning of 2018, the service has been requested to the providers more times than in the last decade. The service requires decreasing consumption from loads through 5 or 90 MW packages and with three different response times: (a) instantaneous execution without pre-order (response within seconds), (b) fast execution (minimum pre-order of 15 min), and (c) hourly execution (minimum pre-order of 2 h) with tenders every year to select the providers and set the remuneration for the available capacity offered (EUR/MW) and for the energy reduction (EUR/MWh). This scenario is feasible for participation of multi MW electrolyzers, but a service availability of more than 95% is required by the TSO, which would mean an electrolyzer of minimum 5 MW in continued production being able to reduce power consumption in 5 MW when requested, with the consequent operational costs linked to such a mode of operation. This is feasible for a large electrolyzer providing a continuous stream of hydrogen, for example in a chemical plant, with a huge demand of this fuel. However, this use is already mature (stationary operation) and restricted to specific niche markets. These include industries with a need for hydrogen for their processes, unable to cover the large upcoming hydrogen markets planned to be deployed in the EU, with smaller demands. This is the case of mobility with FCEVs, which do not require such an amount of this fuel yet. Thus, the interruptibility grid service is not considered as the option to capture revenues in a case study meant to analyze the potential to serve mobility with FCEVs.
A more attractive option to implement demand response with flexible multi-MW loads to provide grid services in Spain would be the possibility to adjust grid frequency through the secondary regulation market (as it is possible in Austria for example with the aFRR). This is because the provision of the service includes a remuneration not only for power reductions (as it is the case of interruptibility), but also for increases through 10 MW packages with a time response of less than 5 min. Currently, only generators are allowed to participate in the secondary regulation service, so loads such as electrolyzers would be excluded from application, which limits the possibilities for demand response implementation in the country as a complementary tool to face the increasing penetration of renewable generation in the electricity system. However, having a look at the trends in other EU countries where there are already grid services in place providing remuneration to loads increasing or decreasing consumption by packages of more than 1 MW or 5 MW to regulate frequency, accommodate RES, and comply with the EU goals in this matter, it seems Spain should require soon a similar approach to avoid substantial updates in grid infrastructures.
Potential for Hydrogen Markets
Besides mature markets (e.g., hydrogen production required in chemical plants), in Spain the greatest potential in the last years has been towards hydrogen mobility. However, Spain is still lagging behind EU initiatives in terms of hydrogen refueling infrastructure, which concentrate mainly in the countries in the center and north of Europe. Table 8 shows the expected amount of HRS in the EU in 2020, 2025, and 2030 in the pioneering countries in the introduction of FCEVs [28,29,30,31,32].
Table 8.
Perspectives for the cumulated number of HRS deployed in EU countries.
Inside this framework, Spain is trying to join these initiatives so as not to remain isolated from the deployment of hydrogen corridors, which link these EU countries and specifically, to create links with France. Now, six HRS are available in Spain for refueling and four new ones are foreseen by 2020 to link the north of the country with the south of France through the H2PiyR project [33,34]. The aforementioned initiatives will try to meet the targets of the Spanish Government, aiming at the commissioning of 20 HRS by 2020 [35]. A drawback that hinders the adoption of hydrogen mobility in Spain is the high total costs of ownership (TCO) for the FCEVs. The FCEVs, which are currently available in the market, showcase similar performance to conventional ICE vehicles (e.g., Hyundai ix35, Toyota Mirai, Honda Clarity FCV, or Renault Kangoo ZE H2). The improved CAPEX and OPEX values result from the improved efficiency of hydrogen, since it is converted into electricity onboard, instead of being burnt in an ICE. There, it is still need to reduce the presence of platinum group metals to reduce CAPEX in the fuel cell as well as to work on durability to increase lifetime of fuel cell stacks and reduce maintenance costs (i.e., OPEX). In the case of the refueling infrastructure, if built to be fed with green hydrogen from renewable energy by means of electrolysis, it involves the CAPEX of the electrolyzer and the cost of hydrogen storage and the HRS (which includes a compression installation), which in case of supply at 700 bar (latest standard pressure for refueling in the EU) means more than 1000 kEUR for a supply of around 200 kg of hydrogen per day (an average car in the EU travels 12,000 km/year, which means 2.3 kg of hydrogen demand per week if 1 kg of this fuel allows to drive for 100 km). These costs are even increased if the HRS is small, as economies of scale strongly benefit FCH technologies.
2.2.3. Greece
The main policy adopted by Greece to facilitate the deployment of energy storage in its national energy system is related to provisions introduced in Greek Laws 3468/2006 and 3851/2010 with respect to the operation of hybrid power systems in the non-interconnected electricity networks of the country.
More specifically, Greece was one of the first EU member states to introduce specific policies and measures promoting energy storage as a medium of increasing renewable energy sources penetration, mainly in the weak electricity grids of islands. According to this legislative and regulatory framework, the operation of hybrid power stations comprising of at least one renewable energy source and at least one energy storage device is allowed in all autonomous (non-interconnected) electricity networks of the country.
According to the provisions of the above-mentioned legislation, a feed-in tariff model is introduced for the promotion of hybrid power stations in Greece; the tariff being calculated differently for each individual isolated (autonomous) electricity network, as a result of a detailed energy study and simulations taking mainly into account the marginal system price, the actual cost for energy production, and the existing renewable energy penetration. Using this legislative and policies measures, the following hybrid power stations operate/have been designed in Greece:
- Tilos island hybrid power station comprising wind, PV, and batteries (in operation).
- Ikaria hybrid power station comprising wind and pumped hydro (under construction).
- Crete hybrid power station comprising wind and pumped hydro (under permitting procedure).
- Ai Stratis hybrid power station comprising wind, PV, and batteries (design of the project completed).
- The Greek government has announced that three additional small Greek island will be transformed into green energy islands, through the introduction of energy storage technologies in combination with RES, namely Symi, Astypalaia, and Kastelorizo. There will be a tendering procedure for investors that will take over the implementation of these projects.
The feed-in tariffs for hybrid power stations have not been set for all non-interconnected electricity in Greece, since this is a time-consuming procedure, triggered by investor applications for power production permits in each system. For the time being, the tariffs that have already been set in Greece range from 165 to 234€/MWh.
The technical specifications regarding the terms of operation and pricing, and the provisions set in the above-described legislation have been designed mainly taking into account the energy storage technology of pumped-hydro. This fact creates significant problems in the economic viability of hybrid power stations using other energy storage technologies, including hydrogen.
In addition, according to Greek Law 4439/2016, the country adopts the EC Directive 94/2014 regarding alternative fuels infrastructure. All required technical specifications of vehicles and hydrogen refueling station infrastructure are set in this legislation. Unfortunately, the Greek state has not taken any other measures and policies to promote hydrogen, both as an energy storage medium and grid-balancing method.
3. Overview of European Electricity Markets and Prices
One of the most important parameters and input in the market potential assessment of hydrogen produced through electrolysis for grid balancing purposes is the identification of the methodology of operation of the European electricity markets and especially the prices related to renewable electricity, including its short- and long-term variations. This is a critical parameter for the economic viability of any project aiming at providing grid balancing services for the following reasons:
- The economic viability of hydrogen production through PAE for grid balancing applications is strongly related to the cost of electricity used to drive the electrolyzer. Therefore, the operation of the electrolyzer to provide grid balancing services becomes economically favorable when the cost of electricity is low.
- In the northern European countries and in general in countries with high RES (especially wind) penetration, there is an opportunity to buy electricity at very low (or even negative cost) at periods of high RES production and when the electricity demand is relatively low (e.g., during nighttime).
- On the other hand, hydrogen production to provide grid balancing services makes sense in financial terms, in countries that have low cost of electricity (with Greece being one among them) all year around.
- Daily variations on the cost of electricity in countries with smart metering operation and the ability to change between electrical energy providers gives the opportunity to the producers of hydrogen through electrolysis to decide the periods of time in which they will operate in order to reduce their costs of electricity and come up with a more profitable business case.
- In addition, another option for grid balancing is to sell electricity produced from hydrogen in fuel cells back to the grid. Electricity prices are important for this option as well, where hydrogen producers become electricity producers and they are able to select periods of low renewable energy production in order to sell electricity at higher prices.
3.1. Overview of Electricity Prices for Industrial Electrolyzers at an EU Level
In the FCH JU study titled “Water Electrolysis in the European Union” [4], representative data sets values for different types of regulatory and pricing environment from five European member states were selected in order to analyze the available cost of electricity for industrial electrolyzers. The countries selected represented significant variations (by electricity price, penetration of renewables, and overall market size) in order to come up with an overview of different cases and business development environments. As can be seen in Figure 2, a large range of electricity prices for industrial consumers is available in different member states.
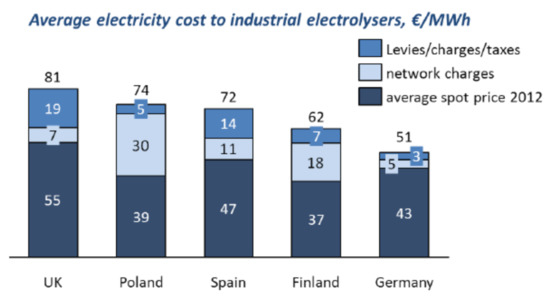
Figure 2.
Average electricity cost of industrial electrolyzers in 2012 [4].
The large variation in electricity prices in different countries and in different periods of time and conditions results in a significant differentiation on the cost of hydrogen produced from electrolysis, depicted in Figure 3 and Figure 4, since as will be analyzed in the following paragraphs, electricity prices are a critical factor affecting highly both total hydrogen production cost and the economic viability of the investment as well. It should be noted that in Figure 3 and Figure 4,“RG only” refers to renewable generators.
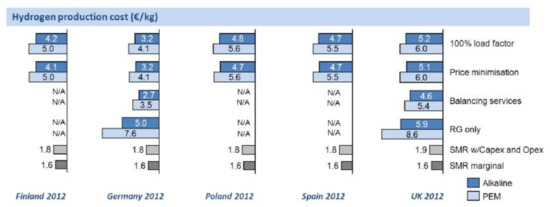
Figure 3.
Hydrogen production costs in 2012 for best case KPIs for Alkaline and PEM electrolyzers in different electricity market scenarios [4].
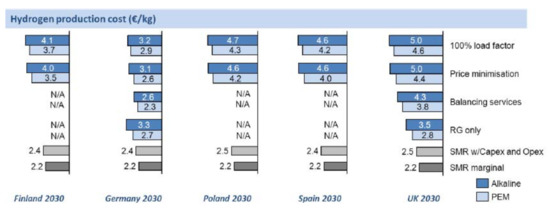
Figure 4.
Hydrogen production costs estimated for 2030 for the best case KPIs for Alkaline and PEM electrolyzers in different electricity market scenarios [4].
3.2. Identification of Electricity Prices for Industrial Electrolyzers in the Targeted EU Countries
The electricity prices for industrial electrolyzers in the remaining targeted EU countries, namely Austria and Greece (these prices were presented for Spain in the previous paragraph), are presented in the following paragraphs.
3.2.1. Austria
Market conditions in Austria have changed significantly. The bidding zone integrity between German and Austrian electricity market has been suspended and replaced with a capacity market mechanism. This has led to significant price changes for wholesale electricity. Additionally, the market design for the Austrian regulatory energy market changed in 2018.
A simulation based on past market data was designed and implemented. This simulation incorporates the new balancing power market design (introduced in summer 2018) and changes originating from the bidding zone separation of Austrian and German wholesale electricity market. Due to the new market design, price levels and bidding strategies have changed considerably.
The new simulation data is based on market information from October 2018 until March 2019. Although a full calendar year set of market data is not available yet, relevant changes are incorporated in the available data and the results of the simulation incorporate actual market conditions.
Thus for the case of Austria, the relevant costs have been calculated as presented in Table 9.
Table 9.
Production cost of hydrogen.
3.2.2. Greece
The electricity prices for industrial customers in Greece vary according to: (1) grid connection status (low, medium, or high voltage), (2) the required maximum capacity, and (3) the usage factor (low or high). Currently, there are no provisions related to lower electricity prices for the operation of the electrolyzers in time periods and areas with excess renewable energy production and high curtailments in the regulatory framework of the country. The only exemption to that is the existence of specific provisions and high feed-in tariffs for selling electrical energy from hybrid power stations (combined RES and energy storage installations, which may include hydrogen as a storage medium) back to the grid. The feed-in tariff mentioned from the energy storage installations above, could reach up to 250€/MWh.
Therefore, Greece cannot be considered currently as a member state with a high market potential for power to hydrogen applications, with the potential exception of re-electrification systems in the autonomous, non-interconnected to the mainland grid, islands of the country.
To provide an idea of the electricity costs for industrial electrolyzers for the country of Greece, the so-called BY pricing invoice of the Public Power Corporation (PPC) is presented in Table 10. This electricity pricing invoice is directed to commercial and industrial end-users at medium voltage, having a high usage factor of electrical energy.
Table 10.
BY electricity pricing invoice of the Public Power Corporation (PPC) in Greece (www.dei.gr, last accessed at 5 January 2022).
On top of the electricity prices related to the production and procurement of electrical energy, PPC pricing invoices have also regulated charges, which are presented in Table 11.
Table 11.
BY regulated charges invoice of the Public Power Corporation (PPC) in Greece (www.dei.gr, last accessed at 5 January 2022).
4. Business Climate for Grid Balancing/Current Markets for Pressurized Alkaline Electrolyzers in Europe
In the following paragraphs, the overall business climate for pressurized alkaline electrolyzers and the potential end-users for hydrogen per each application sector will be presented. This analysis is a significant part of the overall market potential assessment, since it identifies the target market groups and specific potential applications. The business climate analysis for grid balancing and all the above-mentioned components will be described in detail and categorized per application in the following sectors.
The versatility of hydrogen applications is the strongest advantage, since it can be used as a fuel, can be injected to the natural gas grid, can be used as an industrial gas in many processes, provides an ideal solution for clean transport, and can be re-electrified in fuel cells to produce power again. Moreover, hydrogen produced from electrolysis is an excellent medium to provide grid services and balancing and produce additional revenues.
The business climate for hydrogen production through water electrolysis to contribute to grid balancing was analyzed in detail in the “Study on early business cases for H2 in energy storage and more broadly power to H2 applications” prepared by TRACTEBEL and Hinicio, which was funded by the Fuel Cells and Hydrogen Joint Undertaking (FCH JU) and supported by the European Commission [4].
The basic conclusion of the above-mentioned study was that power to hydrogen is bankable already today. It has been concluded that the estimated cumulative electrolyzer capacity to be installed in Europe by 2025 is in the order of 2.8 GW. This estimation is based on sound economics and represents a total market value of €4.2 bn. Even today, the total amount of profitable business cases in the field would be in the order of 1.4. GW, with a market value of €2.6 bn, if all these cases were realized.
As was already described in the previous paragraph, the critical factor for the economic viability of such an investment is the price of electricity. According to this study, a total (baseload) electricity price in the order of 40–50€/MWh is required to build a profitable business case. This price includes the total cost of electricity needed to drive the electrolyzer, grid fees, all taxes and levies.
The most effective method to achieve profitability is to combine several revenue streams from different market applications that will be described in more detail in the next paragraphs. In European areas that have access to discounted electricity prices through valorization of local curtailed renewable electricity, the most bankable business cases identified for the short- and medium-term include mobility and industry as primary applications. These include regional hydrogen mobility, refineries and cooking oil production, complemented by hydrogen injection to the natural gas grid. The payback time of the identified business cases varies from 3 to 11 years, depending on the primary application. The primary success condition is a gas grid injection tariff of at least 90 €/MWh LHV.
The refinery business case is the only one that is not identified as profitable (as a stand-alone application) in the study. To bring this business case to breakeven today, a subsidy of at least 10% on capital investment costs would be required.
One of the basic conclusion of the study was that business cases that are based in single primary applications (selling hydrogen to industrial or mobility applications) will have good chances of profitability, but with higher payback periods compared to business cases that combine multiple revenue streams. The bankability of such an application will be improved when including revenues from the provision of services to balance and improve the quality of grid frequency to the power system (frequency containment and/or restoration reserves). Such an approach contributes in decreasing payback times as well. These services, even though representing a relatively small share of the total revenues of the investment (between 10% and 30%), also have a sizeable and positive effect on net margin (+40 to +80%), since the additional cost needed to provide grid services is relatively low. The impact of including grid frequency/balancing services to the investment payback time is a reduction, ranging between 30 and 50%, and more specifically from 4–11 years, down to 3–8 years.
In Table 12, the profitability results for the three best short-term business cases assessed in the context of this study are presented.
Table 12.
Profitability results of the three best short-term business cases of the study [4].
4.1. Power to Gas
This business case refers to the production of hydrogen through water electrolysis and its injection to the natural gas grid. This concept was first tested in small-scale in the last two decades. Currently, it is characterized as a secondary value stream, since it is considered insufficient to drive a solid business case on its own, but it can turn out to be very useful in creating opportunities to stack additional revenues on top of a primary value stream at very low marginal cost, resulting in a significant increase of the profitability of the investment.
Gas injection to the grid is an energy storage method and is being characterized as a large-scale application. In addition, this is a pathway for long-term storage of excess renewable electricity. The basic advantage of gas grid injection lies in the fact that no additional investments in infrastructure are required, since the already existing natural gas grid can be used for storage and as a transport medium for hydrogen as well. This method can therefore be applied in order to both store and transport very large quantities of excess renewable energy, which in several cases occur on a seasonal basis, over long distances, without introducing a need for building new connectors.
This energy storage method is being seriously examined in Germany, where large quantities of excess wind energy (produced in the north) that cannot be absorbed by the electricity grid of the country, cannot be easily transferred to the consumption centers of the south due to line congestion. The result of this situation is wind energy curtailment at a very high percentage. Of course, it can be easily understood that batteries are not an option for large-scale and long-term energy storage of the excess wind energy. Moreover, the construction of new electricity distribution lines is extremely challenging in terms of cost and public acceptance. Energy storage in hydrogen, followed by its injection to the natural gas grid is a potential solution to the above-mentioned problems.
As described above, the power to gas option has theoretically several advantages, but specific issues related to economic and regulatory matters should be solved in order to become a solid business case. In more detail, there is one barrier related to a regulatory limitation on the maximum hydrogen percentage that can be injected to the natural gas grid. There are also technical limits for specific natural gas end-users, the processes of which are not tolerant to high hydrogen content in the NG. The production of synthetic natural gas through methanation is a potential solution to overcome the limitations on maximum hydrogen content injected to the grid, but this option is associated with the introduction of additional costs and makes this business case economically unattractive.
The economic analysis of this study concluded that the power to gas option is not attractive, since without any kind of support or subsidies, the cost of hydrogen injected is comparable to the natural gas delivered by the pipeline. Therefore, in order to build solid power to gas business cases, specific instruments should be introduced. There are two options:
- A feed-in tariff (or injection tariff) scheme for green hydrogen, which can operate on principles, which are similar to the scheme that already exists in several countries for biomethane. Currently, such a scheme does not exist for green hydrogen or low carbon hydrogen in any European country.
- A carbon price that would apply (among others) as a tax on natural gas. Such a provision would help in reducing the cost between these two gases (natural gas and hydrogen).
The first option of introducing feed-in tariffs for green hydrogen, is considered to be the most probable action in the short- to medium-term.
As a conclusion, the power to gas market option will have to be handled as a secondary value stream to build a successful and profitable business case. Until, the above regulatory, technical, and economic barriers are removed through modifications in the existing support policies (and mainly by introducing a green hydrogen feed-in tariff), this will not be a solid and profitable stand-alone business case for hydrogen producers through water electrolysis.
4.2. Power to Mobility
This is the second option/business case for hydrogen produced from water electrolysis, providing grid services/balancing. Using hydrogen in the mobility sector to contribute to greenhouse gases emissions reductions is an emerging market, the development of which requires additional refueling infrastructure. It is considered as a primary application, having good chances of profitability, but with higher payback periods of time as a stand-alone value stream. When combined with other methods of commercial exploitation of hydrogen (including power to gas), the payback time of the investment will significantly reduce.
The critical factor for the economic viability of the value stream of this application is the end-users acceptable final price of hydrogen. One basic assumption of this study was that the end-user will accept to pay a final price that is at least equal to the current cost of fossil fuels/km.
The end-user acceptance price is very important in order to calculate the price at which hydrogen will be provided by hydrogen producers through electrolysis to the owners of hydrogen refueling stations (HRS), taking also into account the costs and profit margin of HRS operators. In this analysis, hydrogen is taken into account as tax-free in the short-term, as a policy to promote low and zero emission mobility.
In Table 13, the HRS operator acceptance prices per each mobility application are presented. This calculation has been based on specific reference boundary conditions, namely:
Table 13.
Acceptable hydrogen prices to end-users and HRS operators per mobile application [4].
- Typical fleet consumption of hydrogen (daily, weekly, monthly, and annually)
- Constraints that impact the operation of the electrolyzer and available storage tank
- Typical requirements of HRS
- Ranges for acceptable hydrogen prices
The results of these calculations demonstrated that the acceptable prices of hydrogen for HRS operators ranges between 4–7 €/kg, depending on each mobility application. The cost margin for HRS operators ranges from 40 to 100%.
As a conclusion, the power to mobility market option should be handled as a primary value stream to build a successful and profitable business case. In order to maximize revenues and reduce significantly payback times, this business case should be (at least in the short-term) combined with one or more other applications (primary or secondary), such as power to gas, power to power, or power to industry in order to come up with an attractive business case from the financial point of view.
4.3. Power to Industry
The third option/business case for hydrogen produced from water electrolysis, providing grid services/balancing is the one of selling hydrogen as a chemical in order to be used in industrial applications. The usage of hydrogen in industry can be divided into large and light applications depending on their hydrogen consumption volume. Large industry typically includes refineries, chemical plants, and steel manufacture characterized by a very large quantity of hydrogen consumption (over 10,000 Nm3/hr). In these applications, hydrogen is supplied either by steam methane reforming (SMR) or by pipelines available in specific countries. On the other hand, light industrial applications are supplied by hydrogen either through trucks or small-scale SMR units. In industrial applications, hydrogen is used as a chemical required in the processes of the various categories of plants.
The power to industry business case is characterized as a primary value stream that has good chances for creating profitability, but when used as a stand-alone end-user, results in higher payback periods of time. Therefore, a better economic viability for this application can be achieved by combining this application of hydrogen produced from water electrolyzers with additional value streams in order to reduce payback times and increase profitability.
In general, hydrogen required for large-scale industrial applications (especially in refineries) is produced through SMR at significantly lower costs compared to hydrogen produced from electrolysis. Unless, specific decarbonization policies are enforced in order to promote green hydrogen through subsidies, this business case will not be profitable for hydrogen producers using electrolyzers.
On the other hand, hydrogen required for light industrial applications could be a viable business case/value stream dependent on the specific conditions and the industrial sites locations. In more detail, in the context of the above-mentioned study, it has been concluded that in Denmark and France [36], there is a high potential for introducing hydrogen produced from electrolysis in light industry applications, due to high distances from any filling center and the low competitive environment and high price of trucked in hydrogen. Similar favorable conditions for this value stream can also be found in other European areas.
As a conclusion, the power to industry market option should be handled as a primary value stream to build a successful and profitable business case. It is evident that light industry applications come up with a higher profitability for hydrogen producers through water electrolysis. In order to maximize revenues and reduce significantly payback times, this business case should be (at least in the short-term) combined with one or more other applications (primary or secondary), such as power to gas, power to power, or power to gas in order to come up with an attractive business case from the financial point of view.
4.4. Power to Power (Re-Electrification of Hydrogen)
The fourth option/business case for hydrogen produced from water electrolysis is producing energy in fuel cells driven by the previously stored hydrogen and selling it back to the electricity grid. Non-interconnected islands, where electricity is currently produced by diesel or heavy oil are the best locations for hydrogen re-electrification, since the cost of energy produced in these systems is already high.
Power to power business case should be combined with provision of grid services (combined grid balancing and frequency control) to have an additional income and make this application more economically attractive and profitable. Nevertheless, it should be noted that in almost all European countries, there is not a regulatory provision for capacity payments for frequency containment.
From the financial point of view, the power to power option is stronger in small autonomous island systems that present an already high cost. It has been estimated that this business case becomes viable in island systems that present a power generation cost over 200–250 €/MWh, depending also on the availability of wind and solar potential. This option will highly contribute in the increase of renewable energy penetration in the weak electricity grids of islands and its decarbonization. The main competitor here, is batteries, but the power to power business case provides the advantage of seasonal energy storage.
As a conclusion, the power to power market option should be considered in the short-term for small-size, non-interconnected islands with already high power generation costs. Power to produce hydrogen through the electrolyzer should be provided by renewables (excess electricity that cannot be absorbed by the grid). To achieve profitability, this business case should be combined with the provision of grid services (grid balancing and frequency control) to maximize revenues and come up with an attractive investment.
4.5. Grid Services Provision
The fifth option/business case for hydrogen produced from water electrolysis is the provision of grid services by the owner of the electrolyzer (hydrogen producer). This is a secondary value stream, since it cannot provide a profitable business case as a stand-alone application and should be considered as an additional income source, combined with a primary application. A water electrolyzer could potentially provide the following grid services to transmission and distribution operators:
- Balancing and management of congestion (transmission grid at national level).
- Frequency containment services for increased stability of the electricity network (at transmission grid and also includes enhanced frequency reserve service type).
- Distribution grid services: these services are not as mature as services at the transmission level. The value of the distribution grid should be assessed by taking into account the respective CAPEX and OPEX, which can be avoided due to the operation of the electrolyzer (load shifting activation).
The revenues produced from the operation of an electrolyzer and its flexibility to provide grid services in each of the above-described categories are depicted in the following paragraphs:
- Balancing services: In cases where hydrogen production targets are clearly set for the electrolyzer over time periods, such as a week, while maintaining a spare capacity, it allows an electrolyzer to provide load shifting (meaning additional flexibility) for balancing services. Therefore, it could adopt its consumption to renewable energy variation. The analysis conducted in the context of this study, showed that the revenues of an electrolyzer providing balancing services vary according to the operation scenario. In Figure 5, the expected revenues for a 1 MW electrolyzer providing balancing services for a number of case studies in different EU member states and different activation costs are presented.
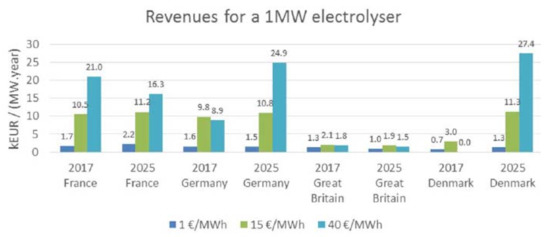 Figure 5. Balancing services expected annual revenues for a 1 MW electrolyzer with 3 activation costs [4].
- Load frequency control: There is a great differentiation in the terms of regulation and remuneration related to ancillary services for load-frequency control across EU member states, therefore the revenue expected from this application/business case of hydrogen produced through electrolysis differ greatly.
- Distribution grid services: In the context of the above-mentioned study, specific simulations were realized, in order to calculate the profitability of this business case. The key results of this assessment indicated that the income linked to the flexibility provided by the electrolyzer are very low, since the electricity networks need to be reinforced to install the electrolyzer (which results in an additional capital cost), while this added value of its flexibility lies in postponing reinforcement investments. The calculations showed that the expected income from such an operation of the electrolyzer will be lower than 1 k€/MW/yr (annualized over the lifetime of the electrolyzer).
As a conclusion, the grid services provision market option should be handled as a secondary value stream to build successful and profitable business cases. It is evident that provision of grid services (balancing services, load frequency control, and distribution grid services) for hydrogen producers through water electrolysis should be combined with at least one other business case/application of hydrogen, such as power to mobility, power to industry, or power to gas. Such an approach would result in creating a more attractive and profitable business case for hydrogen producers.
4.6. Power to Heat
Power to Heat application of hydrogen is sometimes overlooked due to the low overall efficiency of the process of producing hydrogen through electrolyzers using renewable electricity and then using hydrogen in H2 burners in order to produce heat. This application has the disadvantage of needing additional infrastructure, mainly for the hydrogen burner, therefore it is usually less profitable compared to natural gas grid injection. Nevertheless, in specific cases, power to heat applications could turn into solid and profitable business cases. The main end-user of this application would be light industrial applications with high heating demand. The most important critical factors for the economic viability of this business case are: (1) cost of electricity, (2) distance from the end-user, and (3) current cost of natural gas of the industrial users.
In cases of proximity of the industry to the hydrogen producer, low cost of electricity to produce hydrogen and high natural gas prices, the business case of power to heat gas has a good chance to become a viable and profitable investment. To increase income and profitability, it should be combined.
As a conclusion, the power to heat market option could become viable as a light industry application when the following conditions exist: (1) proximity of the industry to the hydrogen producer, (2) low cost of electricity to produce hydrogen, (3) high heating demand, and (4) high natural gas prices. It is evident that for power to heat applications to become profitable for hydrogen producers through water electrolysis, it should be combined with at least one other business case/application of hydrogen, such as power to mobility, or provision of grid services. Such an approach would result in creating a more attractive and profitable business case for hydrogen producers.
4.7. List of at Least Ten Market Opportunities at the EU Level
Following the analysis of business climate and current potential markets for the application of pressurized alkaline electrolyzers in providing grid balancing services, the following market opportunities have been identified:
- Power to gas application in northern Germany: Although power to gas applications are considered as a secondary value stream (due to the existing regulatory and legislative frameworks all over Europe), a solid application/business case of a pressurized alkaline electrolyzer for this scope can be set up in northern Germany due to the high percentage of wind energy curtailments in the area. A significant market opportunity can be created in this area of Europe, which will be facilitated by the fact that several demonstration projects in this field have been already realized in the last two decades, resulting in the acquisition of high-level experience for scaling it up.
- Power to mobility application MPREIS (Austria): This project has already taken a strategic decision to replace a good part of its fossil-fuel-driven vehicles with hydrogen ones. In addition, the company has already decided to install a pressurized alkaline electrolyzer to produce hydrogen that will be fed in a Hydrogen Refueling Station (HRS) to support its new hydrogen vehicle fleet. As analyzed above, the power to mobility business case is considered as a primary value stream and will most probably be a profitable business case as well. Moreover, such a large-scale introduction of hydrogen technologies in the transport sector will facilitate a wider use of hydrogen vehicles in commercial applications (heavy duty trucks) in Austria.
- Power to mobility applications in Innsbruck region (Austria): The region of Innsbruck is one of the ones showing a high penetration of hydrogen vehicles. Hydrogen refueling stations (HRS) are also located in this area. Therefore, it is sensible to identify a market opportunity for pressurized alkaline electrolyzers in this location and this application, which will be higher in the next years, when the penetration of hydrogen vehicles will be higher.
- Power to mobility application in AB Vasilopoulos logistic center in Greece: Logistic centers are considered one of the best markets for the commercial introduction of hydrogen technologies, including hydrogen production through pressurized alkaline electrolyzers. One of the largest supermarket chains in Greece, namely AB Vasilopoulos, are interested in creating the hydrogen production infrastructure required in order to substitute part of their battery electric forklift vehicles with hydrogen ones in their main logistics center.
- Power to industry application in Hellenic Petroleum SA (HELPE): Hellenic Petroleum SA owns the biggest refinery in Greece and they are generally interested in investing in clean energy technologies. They are also leading the efforts for establishing the Greek Hydrogen Association, therefore they have a serious interest in investing in hydrogen energy technologies, including hydrogen production through pressurized alkaline electrolyzers.
- Power to power application on Milos Island: As explained in the above sections, power to power applications can become profitable only in small- to medium-scale non-interconnected islands, where hydrogen will be produced through electrolysis driven only by renewable energy (mainly wind energy), which cannot be absorbed by the weak island electricity grid. Power to power applications should be supported by grid services provision (namely frequency and voltage control). Milos is a Greek island in the southwestern Aegean Sea, with a peak electricity demand of 13–14 MW and ca. 5000 inhabitants. In the island, a small wind farm operates. The total yearly wind energy curtailments on the island exceed 20%, therefore Milos is ideal for such an application. Moreover, the Municipality of Milos has joined the FCH JU European Regions and Cities Initiative.
- Power to power application on Kalymnos Island: Kalymnos is a Greek island in the southeastern Aegean Sea (in Dodecanese complex) with similar characteristics to Milos. As a matter of fact, Kalymnos is a little bit bigger than Milos and has almost 9000 inhabitants. The main difference is that Kalymnos is interconnected with another eight islands, forming a non-interconnected complex, since these islands are not interconnected to the mainland. In the electricity network, several wind farms operate and the wind energy curtailments exceed 30%, therefore Kalymnos is an ideal business case for power to power applications, since energy storage is required. Moreover, Kalymnos has joined the FCH JU European Regions and Cities Initiative as well and has already developed its local hydrogen development plan, selecting specific business cases of hydrogen technologies, including local hydrogen production infrastructure through water electrolysis driven by renewable energy sources.
- Grid balancing services application on Crete Island: Crete is the biggest island of Greece, having a total population of over 680,000 inhabitants. A large number of wind farms have been installed and operate in the autonomous power system of the island, having reached the technical limit of penetration. Wind energy curtailments on this island are huge, surpassing 40%. As a consequence of this situation, there are several problems related to the stability of the electricity grid, therefore the provision of grid balancing services (both frequency and voltage control) through the operation of pressurized alkaline electrolyzers would be valuable for the power quality of the island of Crete.
- Grid balancing services application on Rhodes Island: Rhodes is the biggest island of Dodecanese, having a total population of over 115,000 inhabitants. Rhodes faces similar problems related to power quality and the operation of wind energy farms with Crete, but due to its high tourism development and the high difference in electricity requirements between summer and winter, the island suffers from serious blackouts and stability problems. Therefore, provision of grid services through pressurized alkaline electrolyzers would create a solid market opportunity.
- Power to heat application in MPREIS Bakery industry: MPREIS is one of the biggest bakery industries in Austria and it requires huge quantities of thermal power. Therefore, using hydrogen produced by pressurized alkaline electrolyzers to feed suitable burners is a very good market opportunity. Moreover, to achieve the desired quality in baking of specific products of the company requires heat produced only by hydrogen, thus this is a solid business case.
5. Concepts of Financing and Support
Due to the fact that hydrogen production for water electrolysis providing grid balancing and other similar services incorporates an additional (premium) cost, it is important to investigate available financing/funding and support policies to fill the gap of this extra cost at an EU level. There are specific tools available at the European level that can be used in order either to finance, or even partly fund infrastructure of hydrogen production through water electrolysis for grid balancing and some hydrogen applications discussed above. The most important funding/financing tools at the EU level are the following:
- European Regional and Development Fund (ERDF) and European Social Fund (ESF), with a total available budget of 562.6 billion Euros. These tools foresee a funding rate between 75–85% for the less developed regions, 60% for the transition regions, and around 50% for the more developed regions. ERDF and ESF can be used to fund a variety of pieces of infrastructure for various applications, including hydrogen technologies.
- The Funding Programme Connecting Europe Facility (CEF)—Transport, can be used to receive funds for the development of hydrogen and fuel cell technologies (especially infrastructure) in the transport sector. The total available budget of the program, which is managed by the European Investment Bank, is around 24 billion Euros. This program could be used in order to fund power to mobility applications and the development of hydrogen refueling stations (HRS). Only projects of common interest (PCIs) are eligible for funding under the CEF tool.
- Cohesion Fund aims at strengthening the economic and social cohesion of Europe and also provides support to: (1) investments related to the improvement of environmental quality and sustainability, and (2) Trans-European Networks for Transport (TEN-T) with a total available of 3.8 billion Euros. Funding details depend on the national management authorities of each member state, while the maximum funding rate can reach up to 85% of the investments.
- Urban Innovation Actions—UIA Programme, which provides support in urban European areas, in order to test innovative solutions with a limited maturity level. The total budget of the program is 372 million Euros and a co-funding rate of at least 20% is required. It is available for municipalities and regions with a population of at least 50,000 inhabitants.
Other funding and support tools are also available for hydrogen technologies in general at a national level at a significant number of member states. National policies on the promotion of hydrogen technologies in general (including hydrogen production through water electrolysis for grid balancing) at the targeted countries (Austria, Spain, and Greece) will be presented in the following paragraphs.
5.1. Austria
5.1.1. The National Hydrogen Programme
At the 20 March 2019, Austria launched the development of a hydrogen strategy to achieve climate goals, which are defined in the #mission2030—the Austrian climate and energy strategy. The strategy will be finished by the end of this year. The topic will be managed by the Federal Ministry for Sustainability and Tourism (BMNT) with the participation of the Federal Ministry of Transport, Infrastructure and Technology (BMVIT) in close collaboration with science, business, and industry.
5.1.2. Overall R&D Funding (Promotion of Alternative Propulsion Systems and Fuels) 60 M€ per Year
- R&D projects aimed at the development of automotive solutions as well as research infrastructure itself.
- FFG programs for research and development of business relevant projects.
- Centers of competence regarding the readiness of research solutions.
- Climate & Energy Fund: funding for research and development for alternative energy sources/carriers.
- International networking (IPHE, IEA, H2020, Joint Undertaking) “Fuel Cells & Hydrogen European technology platforms (ERTRAC BIOFUELS, ERA-NET Transport).
5.1.3. WIVA P&G
In Austria, the research association WIVA P&G (Wasserstoffinitiative Vorzeigeregion Austria Power and Gas—www.wiva.at, last accessed at 5 January 2022 was founded for the further development of the Austrian energy system. Τhis has in part been achieved by the development of renewable gases such as green hydrogen and biomethane. WIVA P&G takes into consideration the experience that was gathered from a number of completed projects, in order to use this experience for the implementation of sub-projects in an energy model region. The development of the model region by WIVA P&G is in accordance with existing structures in Austria, as well as with international cluster projects, while having a multidisciplinary nature, encouraging innovation and demonstrating intelligent applicable systems.
5.2. Spain
In Spain, hydrogen technologies are also widely recognized and accepted as a tool with great potential to achieve the objectives of sustainability in the energy and transport sectors. In 2007, as part of the Spanish Strategy for Climate Change and Clean Energy 2007–2013–2020, it was already indicated, as part of the action area in renewable energy, the generation of biohydrogen in the energy field, and the incentive of hydrogen technologies (such as fuel cells) to give solutions in the field of mobility using it as clean fuel generated from renewable energy. Thus, its importance in the different national strategies and action plans relating to renewable energy is being recognized due to its versatility and flexibility to be used in different applications.
Reference was also made on a preliminary basis to actions related to renewable energy and energy efficiency in the Renewable Energy Plan 2005–2010 and in the Energy Saving and Efficiency Strategy Action Plan 2008–2012 in Spain, respectively. Both documents have been updated and their second phase is being implemented, with hydrogen technologies still being widely described and characterized.
Recently, the National Renewable Energy Action Plan (NREAP) 2011–2020 is based on the mandates of the Directive 2009/28/EC of the European Parliament and of the council of 23 April, on the promotion of the use of energy from renewable sources, which stipulated that each member state should develop a national action plan in the field of renewable energy, and updates to the Renewable Energy Plan 2005–2010. For the case of hydrogen, the role in the plan is to support the renewable energy generation to store the surplus generated so that they can be used for different applications such as delivery to the gas network, sustainable mobility, uses in the chemical industry or re-electrification through fuel cells. There were therefore established goals for hydrogen generation through renewable energy that, despite some very low levels being established for the year 2020, make it clear that the clean hydrogen generated by renewable energy should begin to be considered in the short- and medium-term in Spain. In this scenario, the Secretary of State for Energy at the Ministry of Industry, Tourism and Trade, through the IDAE, decided to deepen in the NREAP 2011–2020. The objective of this analysis in 2011 was to consider the evolution of the world and Spanish economy and the analytical work of the Spanish energy strategy for the next 25 years. They recommended a participation in renewable energy of 20.8% in 2020 in response to the Law No. 2/2011 of Sustainable Economy, which required the drafting of all the plans needed to meet the objectives of the Directive 2009/28/ EC. In this way, the Renewable Energy Plan (REP) 2011–2020 was launched following NREAP 2011–2020, which gave added depth to its objectives and also conducted an in-depth sectoral analysis. The REP 2011–2020, in its entirety, recognizes the potential of hydrogen technologies in the following areas:
- Clean biofuel generation as biodiesel.
- Clean biogas generation from biomass.
- Combustion engine propulsion.
- Gasification, fermentation and pyrolysis to get hydrogen from biomass.
- Electrochemical storage of hydrogen generated from electrolysis on a large scale to be used in the chemical industry, the gas network or in applications with fuel cells such as hydrogen-powered vehicles. This plan recognizes hydrogen as the best alternative to store energy in the long term and large quantities of wind energy surplus, with regard to systems such as the adiabatic storage of energy in compressed air or electrochemical batteries.
In addition, in the sectorial analysis, hydrogen is explicitly mentioned in the different lines of R&D&I of REP 2011–2020 highlighting:
- Biogas sector: following the communication by the European Commission, “European Strategic Energy Technology Plan (towards a low carbon future)” recognizes the potential of the conversion of biogas in hydrogen.
- Wind Sector: for the work areas which REP 2011–2020 recognizes (Work Area 3, applications), the ability is provided to search for the development of energy storage projects for its application in off-peak periods, through the use of systems for the production of hydrogen and fuel cells.
- Horizontal sector: accumulation systems of energy from the power grid. Hydrogen storage is described as promising for the future, for which large-scale demonstrations, efficiency increase, and the seeking out, adaptation, or building of systems suitable for storing are fundamental.
On the other hand, the Energy Savings and Efficiency Action Plan (ESEP) has been updated for the period 2011–2020 and again for the period 2014–2020 following the adoption of the Directive 2012/72/EC on energy efficiency by the European Parliament and by the council, which aims for a reduction of 20% in the energy consumption for all member states.
In the fundamental version, developed for the period 2011–2020 and which will be subject of adaptation according to the mandates and directives to fulfil the 2020 objectives, hydrogen technologies applied to the transport sector are mentioned. Specifically, it recognizes the importance of starting to renew conventional vehicle fleets with hydrogen and fuel cell-propelled vehicles. In particular, in order to achieve this objective, financial aid is proposed for the acquisition of vehicles that use hydrogen as fuel by compensating the extra cost involved in their purchase.
Accordingly, the Ministry of Industry, Energy and Tourism (MINETUR), as an official body responsible for transposing the European Directive 2014/94 relating to the implementation of an infrastructure for alternative fuels, has included hydrogen as one of the fuels to consider within its Alternative Fuel Vehicle (AFV) Strategy. In this action, the commitment of MINETUR to these technologies is evident, since the transposition of the directive to member countries with regard to hydrogen was optional and not compulsory.
On the other hand, the report Assessment of the Potential for the Development of Energy Technologies in Spain, developed by the Alliance for Energy Research and Innovation (ALINNE), describes hydrogen and fuel cells technologies as one of those which will contribute to an extraordinary development of new energy technologies in the next ten years. In the end, as observed in the different existing plans previously described, it is clear that Spain recognizes the potential of hydrogen technologies to achieve the goals of the plans and strategies related to renewable energy, energy efficiency, and sustainability. However, it is necessary to first achieve an increase in efficiency and a reduction of the cost of components and systems to achieve the competitiveness of hydrogen technologies with respect to those existing in the state of the art, for which support from national R&D&I plans is needed. It is undeniable that public authorities, with honorable and notable exceptions, can do more for the deployment and development of these technologies. A possible reason for this may lie in the fact that knowledge of these technologies is not yet widespread in society.
In Spain, the National R&D&I Plan has been regularly updated since 1988. During the period 2005–2013, the percentage of financing allocated to projects related to hydrogen and fuel cells under the main calls for initiatives in collaboration (Singular Strategic Projects 2005–2011 and call INNPACTO 2010–2013) accounted for about 6.25% with respect to other thematic lines of the plan as wind power and bioenergy.
Currently, the National Plan 2013–2016 recognizes a series of challenges including hydrogen technologies. In particular, the corresponding challenge to secure efficient and clean energy is looking for a sustainable generation and an environmentally friendly and socio-economically acceptable energy distribution. To do this, it promotes the transition towards an energy system that allows the reduction of fossil fuel dependence at a time when they are scarce and demand is growing, whilst at the same time their environmental impact is significant. Within this challenge, the fifth scientific-technical and business priority is hydrogen and fuel cells, including: (1) hydrogen production; (2) research and development of technologies for hydrogen and fuel cells; (3) hydrogen storage and distribution; (4) portable and stationary hydrogen applications.
In Spain, there are entities such as the Spanish Hydrogen Association (AeH2), the National Hydrogen Centre (CNH2), the Spanish Hydrogen and Fuel Cell Platform (PTEHPC), and the Spanish Fuel Cell Association (APPICE), which are very active in the promotion and development of projects related to hydrogen technologies.
In regard to the Spanish regions, practically all of them promote the use of technology and are active at national and European levels, especially Andalusia, Canary Islands, Catalonia, Autonomous Community of Madrid, Navarre, Galicia, the Basque Country, Valencia, and Castilla La Mancha.
5.3. Greece
There is no national program for the promotion of hydrogen technologies (including hydrogen production from water electrolysis for grid balancing among other applications) in Greece. Only demonstration R&D projects on this application may be funded up to 80% through the National R&I Programme of Greece (Research, Create, Innovate), in which certain topics of hydrogen technologies and fuel cells (including hydrogen production) are eligible.
6. Market Opportunities Analysis/Solid Business Cases Definition
As described in the first analysis of potential applications for an electrolyzer providing grid balancing services, it is evident that in order to come up with solid and profitable business cases and take advantage of early market opportunities, combinations between primary (industry and mobility) and secondary (power to gas and gas injection, power to power—re-electrification in islands mainly and provision of grid services) should be designed in order to maximize income and decrease payback time of the investment. In Figure 6, the basic scheme for business case definition is depicted.
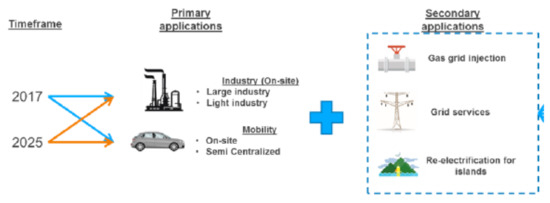
Figure 6.
Combinations of basic business cases [4].
As will be described in the next paragraphs, the selection location is vital for a successful business case set-up, due to the fact that in areas with high grid constraints, there is access to low electricity cost to run the electrolyzer.
6.1. Existing Market Opportunities Analysis/Solid Business Cases Definition
To analyze the existing market opportunities and define complex business cases related to hydrogen production through water electrolysis for the provision of grid balancing services (comprising of combinations of primary and secondary value streams), the first step is to understand the basic characteristics of each primary application as a stand-alone:
- Mobility applications: Hydrogen supply for these applications can be both from on-site production and by a delivery from a production unit located nearby, usually by truck delivery in a range of maximum 50 km. It should be taken into account that for different mobility applications, there is a significant variation in hydrogen prices.
- Light industrial applications: There is a high variation in terms of hydrogen supply chain requirements for the industrial customer and the specific location. Light industrial end-users for hydrogen could be oil and fat, glass manufacturing, metallurgy, and electronics. Suitable end-users for hydrogen in light industrial applications are companies with a consumption that is high enough to justify on-site production.
- Large industrial applications: refer to companies and processes that have high consumption of hydrogen, such as refineries, plants for ammonia production, and steel mills. These industries can only be supplied through large-scale on-site production, through pipelines distributing hydrogen gas. Currently, steam methane reforming (SMR) demonstrates significantly lower hydrogen production cost, compared to electrolysis driven by renewable electricity. Therefore, unless significant carbon taxes are introduced to the SMR process, this is not a viable and profitable business case for hydrogen producers through water electrolysis in the short-term. Among the above-mentioned industries, refineries could be a potential exception as a business case, due to the fact that already today fuels are subject to specific targets on carbon intensity through the Fuel Quality Directive and renewable share through the Renewable Energy Directive, which is under revision. Depending on the targets under revision and their final values, refineries may become a new market for green hydrogen after 2020.
A similar analysis took place for the secondary value streams for hydrogen through water electrolysis as stand-alone applications, before developing more complex business cases incorporating combinations between different primary and secondary applications. A very important finding of the study, in relation to the supply of secondary value streams, is the fact that the electrolyzer can be de-optimized in terms of cost of electricity (meaning hydrogen production cost) compared to the initial hydrogen production plan, which was designed in order to supply the primary application. The most important findings of the FCH JU on the viability of secondary value streams are the following:
- Gas grid injection: It allows to sell spare quantities of hydrogen not used by the primary application, in order to achieve additional income. The extra revenue is related to the supply of energy to the gas grid combined in parallel with the provision of grid services. In case the revenues coming from gas injection are high enough, an over-dimensioning of the electrolyzer in comparison with the size needed to supply the primary application can be well justified. The mode of operation of the electrolyzer in this case is that priority is given naturally in covering the demand of the primary application and when there is remaining capacity of hydrogen, it can operate with a profit as long as the marginal cost of operation is lower than the grid gas injection revenue. The operating hours are of course strongly dependent on the cost of electricity.
- Electricity grid services-frequency: The critical factor in deciding whether this application is economically profitable is the existing regulatory framework in each member state or region and its provisions on frequency containment. Therefore, depending on the type of reserve participation that is allowed by the regulatory framework (symmetric or asymmetric), the revenues from such an application are differently calculated:
- o
- Participation in a symmetric reserve demands the possibility to modify the electrolyzer’s consumption up and down at any time. Therefore, especially for alkaline electrolyzers, which cannot exceed their nominal power, no revenues can be obtained, unless the electrolyzers are over-dimensioned for such an operation.
- o
- Participation in an asymmetric reserve requires the possibility to vary the electrolyzer’s consumption either upwards or downwards. Depending on the electrolyzer’s state of operation (consuming electricity or not), the revenues can strongly vary, but they are not in any case zero values.
- o
- In general, alkaline electrolyzers do not present rapid response times (<30 s) required from most electricity grid operators for providing frequency containment, therefore, this secondary application is not considered highly profitable.
- Electricity grid services-balancing: If we compare the expected revenues for providing grid-balancing services as a stand-alone business with the supply of hydrogen in a primary application as well, a reduction in the overall potential is expected. Specific constraints exist when providing balancing services, while focusing first on hydrogen supply for a primary application:
- o
- The electrolyzer can be turned off to delay its load consumption in order to provide grid services, only if it was previously under operation (switched on).
- o
- The agreed hydrogen supply target should be achieved, independently of whether it provides grid services or not. Therefore, the delayed consumption must be recovered within the day, at a higher cost of electricity.
- o
- The grid service is provided only whenever it includes benefits. The revenue associated with the load flexibility, called activation price, should at least cover the price difference linked with purchasing electricity at a higher cost.
- o
- In general, from the calculations conducted in the context of the FCH JU study, it has been estimated that the revenues of the business case of providing grid balancing services are lower compared to the ones of gas grid injection and frequency containment.
- Electricity grid services-balancing: The analysis of this secondary application showed that the potential revenues associated with it were much lower, both in absolute values (as a stand-alone application) and in comparison with the other secondary applications. Therefore, this is not seen as a solid and profitable business case.
- Re-electrification of hydrogen on islands: The profit to be obtained from this secondary application is generally based on the concept of buying electricity to produce hydrogen at a very low price and sell electricity from the re-electrification of hydrogen at a high price. As mentioned in Chapter 4, this application is not very profitable in most locations. More favorable conditions for this business case exist only in non-interconnected island systems, having already a high cost of electricity production, using heavy oil or diesel fuel (total electricity production cost over 200–250 €/MWh). Local conditions related to a combination of this application with at least another one result in a more profitable business case of this application.
6.2. Identification of Critical Factors Affecting Market Penetration
Having outlined the advantages and disadvantages of primary and secondary applications of hydrogen produced from water electrolysis in building solid and profitable business cases (both as stand-alone and combined applications), the second step is to identify the critical factors that should be taken into account when creating potential business cases. These factors strongly affect the economic viability and profitability of the business cases that will be selected as the first applications:
- Cost of electricity: From the analysis presented in the previous sections, it is evident that this is one of the most critical factors affecting directly hydrogen production cost and the overall profitability and payback times for a hydrogen production through water electrolysis investment. Low electricity cost can be found in areas and countries with high RES (especially wind energy) penetration and high excess renewable energy due to the fact that the available energy surpasses energy demand and cannot be absorbed by the electricity grid. This results in low electricity costs in order to increase load demand. Such favorable conditions in Europe can be found in northern Europe, especially in Denmark, Germany, and the UK, where there is a high penetration of wind farms and the energy produced is much higher compared to the consumption in nearby areas. The result of this situation is the presence of very low electricity (sometimes even negative) tariffs in specific periods of time.
- o
- Location: This is another critical factor affecting the profitability and economic viability of a hydrogen production from water electrolysis investment. The selection of the location, in which the electrolyzer will be installed is very important, since it can provide certain benefits and flexibility on the investment. The best locations to host such an investment are the following:
- o
- Areas with high RES (especially wind energy) penetration and high percentage of curtailments, resulting in high amounts of excess renewable energy-positive impact on hydrogen production cost.
- o
- Countries with a regulatory framework allowing variable (even daily) electricity costs, depending on RES production and energy consumption-positive impact on hydrogen production cost and on selling electricity produced from hydrogen on high prices.
- o
- Areas with extended natural gas grids and provisions on gas grid injection tariffs—solid business case (secondary application).
- o
- Areas where light or large industries are located in a range of less than 50 km from the hydrogen production through electrolysis facility—primary application securing sales.
- o
- Countries and regions having already today a maturity on different mobility applications—primary application with a high perspective for increased revenues in the short-term.
- o
- It is evident that the selection of locations combining the above-mentioned characteristics makes the investment more profitable and economically viable, since different applications (primary and secondary) can be combined in order to maximize revenues.
- Dimensioning of the electrolyzer: This is a critical design parameter directly affecting the financial viability of the hydrogen production investment. When dimensioning the electrolyzer the following should be taken into account:
- o
- Current and future primary and secondary applications.
- o
- Regulatory framework, especially on gas grid injection and on provision of grid services (mainly frequency containment and grid balancing).
- o
- Regulatory framework: This is one of the most important factors that should be taken into account when designing the development of the hydrogen production investment as was also explained in the previous critical factors. Regulatory frameworks having provisions for: (1) hydrogen injection tariffs in the natural gas network, (2) variable costs of electricity (mainly the ability to buy electricity from renewables at very low prices to produce hydrogen through the electrolyzer, thus minimizing hydrogen production cost), (3) existing carbon taxes on hydrogen production through steam methane reforming, and (4) specific support polices for financing and funding of hydrogen and fuel cell technologies create favorable economic and financial conditions for a successful and profitable investment in hydrogen production.
- Hydrogen prices: Another critical factor that is often overlooked when scheduling and designing an investment on hydrogen production through water electrolysis (driven by renewable electricity) is the current prices of hydrogen procurement in the country or region. It is obvious that such an investment installed in countries or regions having already today a high cost of hydrogen procurement creates favorable conditions for its viability and profitability.
It can be easily understood that when combining several positive aspects of the above-mentioned critical factors, the favorable conditions for the hydrogen production investment are multiplied.
6.3. Bankability Analysis of Business Cases
Following the previous analysis on creation of market opportunities and the identification of critical success factors for an investment on hydrogen production through water electrolysis (using excess and low-cost RES electricity), the bankability analysis presented in this chapter results in a complete assessment on the potential business models.
As described earlier in this work, there are already today bankable business cases for power to hydrogen, by combining hydrogen sales (either in the industry or mobility applications) and provision of flexibility services. The latter is a lower income compared to H2 sales, but is complimentary to it and contributes in increasing the profitability of the investment. The European Study on Power to Hydrogen by FCH JU revealed that this is a market of a total electrolyzers’ installed capacity in the order of 3.1 GW, representing a total value of 4.7 billion Euros.
In any case, low cost electricity, supported by partial exemption from grid fees, taxes, and levies is needed in order for such an investment to become profitable and economically viable in the short term. Such an approach is examined in the regulatory framework modification of many countries, since power to hydrogen investments are a profitable and easy method to achieve high renewable energy penetration, by significantly reducing curtailments (especially in wind energy) in the European energy system and meet decarbonization targets.
The strongest synergies identified between different power to hydrogen applications in building solid, profitable, and bankable business cases are the ones of selling hydrogen to mobility application, gas grid injection, and grid services. When designing a bankable investment in power to hydrogen, the following should be taken into account, when deciding the potential end-users to be selected:
- Combining power to hydrogen for mobility and/or light and large industrial applications with gas grid injection is more cost effective than a stand-alone injection of hydrogen for greening the natural gas. The stand-alone gas gird injection application will require a minimum feed-in tariff of 100 €/MWh in order to be economically viable. When this application is combined with hydrogen sales in the mobility or industrial sector, the above-mentioned tariff needed for the investment in order to become viable can be reduced up to 20%.
- The combination of hydrogen injection into the natural gas grid and hydrogen sales in the mobility and/or industrial sector (as primary applications) is a perfect business approach in order to reduce the risk of potential investments.
Power to hydrogen investments can benefit from a consistent and stable regulatory framework, which is comprised from favorable provisions (grid fees, taxes, levies partial exemption, etc.) for the promotion of hydrogen technologies.
The revision of the Renewable Energy Directive (RED) and the upcoming Renewable Energy Directive II (RED2—Winter Package), will be a unique opportunity to create market opportunities also in large-scale industry and more specifically in refineries. Such a modification in the regulatory framework and energy policy in general, will be highly beneficial for power to hydrogen using renewable electricity as it will become economically competitive with SMR hydrogen and will also have rapid positive effects in other applications, including mobility.
7. Identification of Risks and De-Risking at Business Level/Recommendations to Decrease Risks
Power to hydrogen business cases include a significant investment risk for hydrogen producers through water electrolysis for a number of reasons. The basic problem that creates investment risks is that currently this is an immature market, which has not been regulated and well organized. Contractual arrangement is the best tool to identify the risks of the investment and create conditions towards the bankability of these projects. In the following paragraphs an analysis on the potential risks and de-risking guidelines will be presented along with a list of recommendations for modifications to the existing regulatory frameworks in order to increase bankability and profitability of power to hydrogen investments.
7.1. De-Risking of Power to Hydrogen Applications
As already mentioned, solid contractual arrangements are considered to be the most important tool in order to de-risk power to hydrogen investments. Taking into account the complexity of all business cases in the field and the fact that the electrolyzer operator and owner should interact with different market players in different fields of activity, the following guidelines in the contractual agreements should be followed in order to reduce the investment risk:
- With respect to the model of electricity purchases for the operation of the electrolyzer, the following provisions should be taken: (1) Electricity must be purchased directly from the electricity market at the wholesale electricity price. In case of time periods when instantaneous local curtailments occur; (2) Electricity should be directly purchased from the curtailed renewable energy power plant, which will lead to a price, relatively to the wholesale electricity price. The counterparty of this contract agreement depends on national regulatory frameworks. This contractual agreement reduces significantly the fluctuation of the resulting costs for running the electrolyzer and is viewed as a critical factor for the viability of such an investment.
- With respect to grid fees, which are charged by the electricity grid operator for a connection to the network, it is very important to have favorable prices in order to de-risk the investment. These prices are determined by the national regulatory frameworks, therefore a power to hydrogen business will be economically viable in member states with low grid fee prices for such an operation.
- Another risk for the power to hydrogen investments is related to taxes and levies, which strongly vary between different member states. A stable and consistent regulatory framework in terms of taxes and levies strongly reduces the risks of the investment, therefore countries having already today favorable conditions on this issue should be selected in order to de-risk the investment.
- Regarding grid services provision (especially frequency containment), it should be noted that these are provided to the TSO and the remuneration for either availability or for effective use on request strongly vary depending on the national regulatory frameworks of different member states. To minimize this risk, power to hydrogen investors should locate their facilities in areas presenting favorable and stable conditions on this parameter.
- On the application of grid gas injection, to minimize the risk of the power to hydrogen investment, the operators of electrolyzers should seek for a contract agreement, in which hydrogen is sold to the gas grid operator as green gas through a promotional feed-in tariff. Therefore, also in this case the selection of areas with favorable tariffs for green gases will significantly contribute to de-risking of the investments.
The most important method that should be used in order to de-risk power to hydrogen investments and increase their bankability is to design the business cases taking into account a long-term perspective on costs and revenues.
Regarding costs of hydrogen production (strongly related to the electricity costs), there is a strong difficulty to design the investment with a safe long-term perspective. The electrolyzer owners and operators are basically an electricity consumer and as such they can, in the long-term, face variable fees, taxes, and levies, which are not related to electricity supply cost and may play an important role in the economic viability and profitability of the overall investment. In several countries, exemptions on fees, taxes, and levies exist, aiming to promote this technology, but the most important factor on the regulatory framework is the duration of such exemptions, and its stability, in order for the investor to have a guarantee that these favorable conditions will not be removed suddenly.
Regulatory frameworks providing higher certainty are the ones that offer similar exemptions for a period of at least ten years, therefore covering the best part of the lifetime of the investment. This is currently the case for grid fee exemptions that exist in Germany already today.
With respect to the revenue costs of the business case of hydrogen production through water electrolysis driven by excess renewable electricity, an important aspect of the business case development is securing contracts for the supplied hydrogen to different end-users of primary applications. The risk associated to this investment (mainly regarding the volume of hydrogen to be sold in different clients) can be further reduced in member states or regions offering feed-in tariffs for hydrogen injection to the natural gas grid.
7.2. Recommendations on Modifications to Regulatory Frameworks to Decrease Risks
As described in previous sections, the financial viability and profitability of power to hydrogen business cases, is strongly affected by the existing regulatory framework in each European country or region. The scope of this paragraph is to provide recommendations for potential modifications on the existing regulatory frameworks in order to promote hydrogen production through water electrolysis, driven by renewable electricity so as to come up with solid and profitable business cases in the short and medium-term. The most critical recommendations for changes on the regulatory frameworks, affecting positively the economic viability and profitability of power to hydrogen business cases are the following:
- There should be provisions in the regulatory frameworks in order to avoid the inflation of electricity prices with costs that are not related to electricity supply. As mentioned earlier, a beneficial for the investment regulatory modification would be to include partial exemptions from paying grid fees, taxes, or levies. Such an approach can be justified for the member states on the grounds that electrolyzers operate in a mode that is highly beneficial for the European energy system. This provision is very important on the viability and profitability of the investment, since in several European countries, taxes and levies constitute around 50% of the electricity bill. Therefore, such favorable provisions on the regulatory framework will result in a significant reduction of hydrogen production cost.
- The existence of a clear regulatory framework on how curtailed RES electricity is accessed, is essential in order to facilitate the uptake of bilateral contracts between RES producers (especially wind energy producers) and potential end-users. Such provision on the regulatory framework would result in avoiding, or at least significantly reducing RES power curtailments.
- Another important guideline/recommendation for modifications at the regulatory framework positively affecting the profitability of hydrogen to power business cases is the development of EU framework guidelines in order to provide an environment allowing access to frequency control grid service, focusing especially on asymmetric procurement. Such a provision in the regulatory frameworks would also result in increasing the income of these investments.
- Regulatory frameworks should be modified in order to include provisions that allow specific feed-in tariffs for the injection of zero-carbon gas into the natural gas grid. These provisions could refer to either bio-methane or green hydrogen. Feed-in tariffs are already available for bio-methane injection to the natural gas grid, therefore it is recommended to modify the existing regulatory frameworks in order to include feed-in tariffs for green hydrogen injection as well.
- An allowance in the regulatory frameworks for inclusion of green hydrogen in the carbon intensity calculation of conventional fuels in the forthcoming revision of the Fuel Quality Directive (FQD) and the expected revision of the Renewable Energy Directive (RED II) will also be beneficial for the economic viability and the profitability of hydrogen to power investments, introducing hydrogen produced from renewable electricity through water electrolysis into the refineries (large-scale industrial applications) market as well.
8. Current and Future Cost Perspectives
The capital cost of the alkaline electrolyzers is an important factor, affecting directly the economic viability and the profitability of power to hydrogen applications and value streams (primary and secondary). Future cost reductions of the current prices of alkaline electrolyzers will be needed in order to decrease the hydrogen production and result in solid business cases. In the following paragraphs, current costs for alkaline electrolyzers are presented and an analysis of future cost perspectives is demonstrated.
8.1. Current Costs of Alkaline Electrolyzers
In previous years, the capital cost of electrolyzers was high enough to hinder the development of profitable power to hydrogen investments. For example, in 2014 the capital cost of alkaline electrolyzer systems ranged between 1000 and 1500 €/kW plus installation.
The Demo4Grid project [37] aimed at demonstrating manufacturing costs for the 4MW single-stack PAE not higher than 725 kEUR/MW. The above values include subsystems such as power electronics, system control, gas drying (condenser/demister—>H2 purity of 99.6%), as well as commissioning. Not included in the above are cost relative to grid connection, hydrogen storage, additional external purification, and compression. Regarding the addition of external compressor, which represents a remarkable extra cost, it should be mentioned that for the specific applications in the context of Demo4Grid project, the 4MW PAE (generating H2 @ at least 33 bars @ full load), did not require the installation of any additional mechanical or other type of compressor (sometimes this type of ancillary equipment is necessary to make possible or facilitate storage operations in case of lower pressure electrolyzers) and therefore enables significant cost savings at the demo site.
Creating a link between manufacturing costs of the 4 MW pressurized alkaline electrolyzer (PAE) and its high efficiency, PAE manufactured in the context of Demo4Grid project showed that it complied with all 2020 CAPEX KPIs shown in Table 14.
Table 14.
Efficiency KPI 1 and Capex KPI 2 (MAWP, FCH JU).
8.2. Future Cost Perspectives of Alkaline Electrolyzers
The capital cost targets for 2020 for alkaline electrolyzers have been identified by the FCH-JU study “Water Electrolysis in the European Union” [4], according to which alkaline electrolyzer systems cost expectations for 2020 should be in the range 370-900 €/kW, central case 630 €/kW, as shown in Table 15.
Table 15.
System costs KPIs for alkaline electrolyzers (“Water Electrolysis in EU” FCH JU Study).
The results of the above-mentioned study show that in order to achieve these capital cost targets, several pathways will need to be pursued in parallel.
- Higher-volume/mass production.
- Supply chain development.
- Technology innovation.
High volume production and supply chain development will have to occur in parallel to a growth in deployment of electrolyzer (namely PAE) systems. These two parameters, however, are broadly not affected by technology development. The only exception to this are technology innovations that have the potential of facilitating the use of standardized low-cost components that are already in mass production.
This is currently the case for alkaline water electrolysis, which is regarded as more well-established than others (e.g., PEM), and for which the importance of technology innovation is of low importance in terms of anticipated cost reductions.
It is important to note that today alkaline electrolyzers (even if regarded as a fully “mature” technology) are built in small volumes for niche markets, therefore when going to mass production, significant cost reductions will be achieved.
Sales and hence production volumes are low. The choice of suppliers for specific system/Balance of Plant (BoP) components is also limited and may contribute to increasing manufacturing costs.
According to ref. [4], it is expected that much of the cost reduction potential will come from “an improved supply chain, and through increased production volumes for which more cost-efficient production techniques can be used”. The study also states that “the achievement of the expected reductions in cost is therefore directly dependent on the level of deployment in a given time period”.
In conclusion, what has been proved is that despite the current low level of deployment and the need to deliver the multi megawatt PAE well before 2020, manufacturing costs will be contained within limits fully compatible with MAWP 2020 Capex KPI and in line with the expected costs range defined in the FCH JU study “Water Electrolysis in the European Union”.
9. Conclusions
In the present work, a detailed market potential assessment on different business cases of hydrogen production through alkaline electrolyzers for a variety of primary and secondary applications was presented. The main scope of this work was to identify benefits of hydrogen applications in grid balancing in combination with other value streams. The analysis conducted produced the following conclusions:
- Hydrogen production through water electrolysis can provide a high flexibility in the European energy system, due to the high number of potential applications in different fields. It can also significantly contribute in achieving a high increase in the penetration of RES and meeting decarbonization goals of the European Union. Moreover, hydrogen is an ideal energy storage method, due to its characteristics (large-scale, long-term, ability to be injected to the natural gas grid), contributing also in the transmission of energy produced in area with high renewable energy capacity to the consumption centers.
- A number of European and national policies to promote renewable energy sources in the EU energy system. The most important policy is the Clean Energy for all European Energy Package, part of which will be the revised in Renewable Directive II (RED 2), which will play an important role in opening new markets for hydrogen produced through electrolyzers. Certain EU policies have been planned with respect to the promotion of energy storage in the European energy system (initiatives and tools such as the SET plan and Fuel Cells and Hydrogen Joint Undertaking—FCH JU, EU Battery Alliance, HORIZON 2020). The most important policy underway in order to promote energy storage in Europe will be the Energy Storage Directive, which is being prepared, having completed already the discussion with stakeholders.
- The analysis of business climate and identification of potential markets for pressurized alkaline electrolyzers (PAE) showed that there is a high potential even in the short-term at the European level. Power to hydrogen (to contribute to grid balancing as well) is a bankable business case already today. According to the European “Study on early business cases for H2 in energy storage and more broadly power to H2 applications”, it is estimated that the electrolyzer capacity to be installed by 2025 in Europe is in the order of 2.8 GW. This estimation is based on sound economics and represents a total market value of €4.2 bn. The short-term estimations for profitable business cases in this market are respectively 1.4 GW and €2.6 bn.
- With respect to the different power to hydrogen business cases, the basic conclusion of the analysis realized in the context of this work was that in order to achieve profitability, different value streams (primary and secondary) should be combined. The more detailed conclusions per business case are the following:
- o
- Power to gas: This market option will have to be handled as a secondary value stream to build a successful and profitable business case. Until the regulatory, technical and economic barriers are removed through modifications in the existing support policies (and mainly by introducing a green hydrogen injection feed-in tariff), this will not be a solid and profitable stand-alone business case for hydrogen producers through water electrolysis.
- o
- Power to mobility: This market option should be handled as a primary value stream to build a successful and profitable business case. It is also advised that in order to maximize revenues and reduce significantly payback times, this business case should be (at least in the short-term) combined with one or more other applications (primary or secondary), such as power to gas, power to power, or power to industry in order to come up with an attractive business case from the financial point of view.
- o
- Power to industry: The analysis conducted in this work showed that this market option should be handled as a primary value stream to build a successful and profitable business case. It is evident that light industry applications come up with a higher profitability for hydrogen producers through water electrolysis. It is also advised that in order to maximize revenues and reduce significantly payback times this business case should be (at least in the short-term) combined with one or more other applications (primary or secondary), such as power to gas, power to power, or power to gas in order to come up with an attractive business case from the financial point of view.
- o
- Power to power: The assessment for this market option, showed that it should be only considered in the short-term for small-size, non-interconnected islands with already high power generation costs, with the latter being the most important decision factor. Power to produce hydrogen through the electrolyzer should be provided by renewables (excess electricity that cannot be absorbed by the grid). To achieve profitability, this business case should be combined with the provision of grid services (grid balancing and frequency control) to maximize revenues and come up with an attractive investment.
- o
- Grid services provision: This market option should be handled as a secondary value stream to build successful and profitable business cases. It is evident that the provision of grid services (balancing services, load frequency control, and distribution grid services) for hydrogen producers through water electrolysis should be combined with at least one other business case/application of hydrogen, such as power to mobility, power to industry, or power to gas. Such an approach would result in creating a more attractive and profitable business case for hydrogen producers.
- o
- Power to heat: This market option could become viable as a light industry application when the following conditions exist: (1) proximity of the industry to the hydrogen producer, (2) low cost of electricity to produce hydrogen, (3) high heating demand of the industry, and (4) high natural gas prices. It is evident that power to heat applications to become profitable for hydrogen producers through water electrolysis should be combined with at least one other business case/application of hydrogen, such as power to mobility, or provision of grid services. Such an approach would result in creating a more attractive and profitable business case for hydrogen producers.
- In the context of the present work, the critical factors affecting economic viability and profitability of power to hydrogen business cases was performed; the most important factors to build a solid business case scenario were:
- o
- Cost of electricity
- o
- Location of the investment
- o
- Dimensioning of the electrolyzer
- o
- Regulatory framework
- o
- Hydrogen prices
- The identification of critical factors provided feedback in the identification of risks related to hydrogen production through water electrolysis business cases. The de-risking procedure was developed in the context of this work, followed by recommendations on potential modifications on the regulatory and legislative framework at the European and national level, in order to minimize risks and contribute in the development of sold power to hydrogen business cases in the short-term.
- Finally, in this work, current costs of alkaline electrolyzers were recorded and an analysis of the future cost perspectives (CAPEX, hydrogen production and manufacturing costs) was performed.
Author Contributions
Investigation, M.S.M. and E.Z.; Resources, E.P.; Supervision, E.S.; Writing—original draft, E.S. and E.G.; Writing—review & editing, M.S.M., E.Z. and N.C. All authors have read and agreed to the published version of the manuscript.
Funding
The current work has been partially funded by Demo4Grid & H2TRANS projects.
Institutional Review Board Statement
Not applicable.
Informed Consent Statement
Not applicable.
Data Availability Statement
Not applicable.
Acknowledgments
E.S., E.P., E.G., and M.S.M. acknowledge co-financing by the Fuel Cells and Hydrogen Joint Undertaking under grant agreement No 736351 (“Demo4Grid” project); E.S., E.M., and N.C. acknowledge co-financing by the European Regional Development Fund of the EU and Greek national funds under the call RESEARCH-CREATE-INNOVATE (project H2TRANS/T1EDK-05294).
Conflicts of Interest
The authors declare no conflict of interest.
References
- United Nations. Framework convention on climate change. In Proceedings of the 21st Conference of the Parties, Paris, France, 10 November–13 December 2015; Available online: https://unfccc.int/resource/docs/2015/cop21/eng/10.pdf (accessed on 5 January 2022).
- Directive 2009/28/EC of the European Parliament and of the Council of 23 April 2009 on the “Promotion of the Use of Energy from Renewable Sources and Amending and Subsequently Repealing Directives 2001/77/EC and 2003/30/EC”. Available online: https://eur-lex.europa.eu/LexUriServ/LexUriServ.do?uri=OJ:L:2009:140:0016:0062:en:pdf (accessed on 5 January 2022).
- Communication from the Commission to the European Parliament, the Council, the European Economic and Social Committee and the Committee of the Regions: A Policy Framework for Climate and Energy in the Period from 2020 to 2030. Available online: https://eur-lex.europa.eu/legal-content/EN/ALL/?uri=CELEX:52014DC0015 (accessed on 5 January 2022).
- E4tech and Element Energy Prepared for Fuel Cells and Hydrogen Joint Undertaking, Development of Water Electrolysis in the European Union Final Report. 2014. Available online: https://www.fch.europa.eu/sites/default/files/study%20electrolyser_0-Logos_0_0.pdf (accessed on 5 January 2022).
- Hybalance Project. Available online: https://hybalance.eu/ (accessed on 5 January 2022).
- European Commission. Commission Staff Working Document, “Energy Storage—The Role of Electricity” EC (SWD 61 Final). 2017. Available online: https://ec.europa.eu/energy/sites/ener/files/documents/swd2017_61_document_travail_service_part1_v6.pdf (accessed on 5 January 2022).
- Frois, B. Balancing the Grid with Hydrogen Technologies. Available online: http://businessdocbox.com/Green_Solutions/72041853-Balancing-the-grid-with-hydrogen-technologies.html (accessed on 5 January 2022).
- Constantinescu, T. Energy Storage in EU Energy Policies. In Proceedings of the European Commission—Energy, Eurelectric, Brussels, Belgium, 7 December 2017. [Google Scholar]
- Communication from the Commission to the European Parliament, the European Council, the Council, the European Economic and Social Committee, the Committee of the Regions and the European Investment Bank. A Clean Planet for All: A European Strategic Long-Term Vision for a Prosperous, Modern, Competitive and Climate Neutral Economy, EC COM 773 Final. 2018. Available online: https://eur-lex.europa.eu/legal-content/EN/TXT/PDF/?uri=CELEX:52018DC0773 (accessed on 5 January 2022).
- Matute, G.; Yusta, J.M.; Correas, L.C. Techno-economic modelling of water electrolysers in the range of several MW to provide grid services while generating hydrogen for different applications: A case study in Spain applied to mobility with FCEVs. Int. J. Hydrogen Energy 2019, 44, 17431–17442. [Google Scholar] [CrossRef]
- Gutiérrez-Martín, F.; Guerrero-Hernández, I. Balancing the grid loads by large scale integration of hydrogen technologies: The case of the Spanish power system. Int. J. Hydrogen Energy 2012, 37, 1151–1161. [Google Scholar] [CrossRef]
- Guinot, B.; Montignac, F.; Champel, B.; Vannucci, D. Profitability of an electrolysis based hydrogen production plant providing grid balancing services. Int. J. Hydrogen Energy 2015, 40, 8778–8787. [Google Scholar] [CrossRef]
- Mansilla, C.; Dautremont, S.; Tehrani, B.S.; Cotin, G.; Avril, S.; Burkhalter, E. Reducing the hydrogen production cost by operating alkaline electrolysis as a discontinuous process in the French market context. Int. J. Hydrogen Energy 2011, 36, 6407–6413. [Google Scholar] [CrossRef]
- Grueger, F.; Möhrke, F.; Robinius, M.; Stolten, D. Early power to gas applications: Reducing wind farm forecast errors and providing secondary control reserve. Appl. Energy 2017, 192, 551–562. [Google Scholar] [CrossRef]
- Sørensen, B. A renewable energy and hydrogen scenario for northern Europe. Int. J. Energy Res. 2008, 32, 471–500. [Google Scholar] [CrossRef] [Green Version]
- Paulus, M.; Borggrefe, F. The potential of demand-side management in energy-intensive industries for electricity markets in Germany. Appl. Energy 2011, 88, 432–441. [Google Scholar] [CrossRef]
- Jørgensen, C.; Ropenus, S. Production price of hydrogen from grid connected electrolysis in a power market with high wind penetration. Int. J. Hydrogen Energy 2008, 33, 5335–5344. [Google Scholar] [CrossRef]
- Kiaee, M.; Cruden, A.; Infield, D.; Chladek, P. Utilisation of alkaline electrolysers to improve power system frequency stability with a high penetration of wind power. IET Renew. Power Gener. 2013, 8, 529–536. [Google Scholar] [CrossRef]
- Götz, M.; Lefebvre, J.; Mörs, F.; McDaniel Koch, A.; Graf, F.; Bajohr, S.; Reimert, R.; Kolb, T. Renewable power-to-gas: A technological and economic review. Renew. Energy 2016, 85, 1371–1390. [Google Scholar] [CrossRef] [Green Version]
- Garcia Mezquita, Y. Reflections on energy storage. In Proceedings of the ENER-B4, Florence Forum, Florence, Italy, 31 May 2018. [Google Scholar]
- Hydrogen Roadmap Europe: A Sustainable Pathway for the European Energy Transition, FCH JU and European Commission. 2019. Available online: https://www.fch.europa.eu/sites/default/files/Hydrogen%20Roadmap%20Europe_Report.pdf (accessed on 5 January 2022).
- Eurogas. Statistical Report. 2015. Available online: https://eurogas.org/website/wp-content/uploads/2018/03/Statistics_2010_291110.pdf (accessed on 5 January 2022).
- Gillhaus, A. Natural gas storage in salt caverns–present status, developments and future trends in Europe. In Proceedings of the SMRI Spring Meeting, Basel, Switzerland, 29 April–2 May 2007. [Google Scholar]
- National Renewable Energy Action Plan, Austria. Available online: https://ec.europa.eu/energy/topics/renewable-energy/directive-targets-and-rules/national-renewable-energy-action-plans-2020_en (accessed on 5 January 2022).
- National Renewable Energy Action Plan, Spain. Available online: https://ec.europa.eu/energy/topics/renewable-energy/directive-targets-and-rules/national-renewable-energy-action-plans-2020_en (accessed on 5 January 2022).
- National Renewable Energy Action Plan, Greece. Available online: https://ec.europa.eu/energy/topics/renewable-energy/directive-targets-and-rules/national-renewable-energy-action-plans-2020_en (accessed on 5 January 2022).
- Orden IET/2013/2013, de 31 de Octubre, por la que se Regula el Mecanismo Competitivo de Asignación del Servicio de Gestión de la Demanda de Interrumpibilidad. Span. Off. J. (BOE) 2013. Available online: https://www.boe.es/buscar/act.php?id=BOE-A-2013-11461 (accessed on 5 January 2022).
- The Revised Renewable Energy Directive—Factsheet EC, 2018 EC “2050 Long—Term Energy Strategy”. Available online: https://ec.europa.eu/clima/eu-action/climate-strategies-targets/2050-long-term-strategy_en (accessed on 5 January 2022).
- Smart Energy Demand Coalition (SEDC). Explicit Demand Response in Europe—Mapping the Market 2017. Available online: https://smarten.eu/explicit-demand-response-in-europe-mapping-the-markets-2017/ (accessed on 5 January 2022).
- Mobility Belgium. National Implementation Plan Hydrogen Refuelling Infrastructure Belgium. HIT-2 Project. 2015. Available online: https://www.waterstofnet.eu/_asset/_public/H2MobilityBelgium-WaterstofNet-Final.pdf (accessed on 5 January 2022).
- FCH 2 JU H2ME Project. Available online: http://h2me.eu/about/hydrogen-refuelling-infrastructure/ (accessed on 5 January 2022).
- Mobilita H2 Italy. Available online: http://www.mobilitah2.it/plan (accessed on 5 January 2022).
- POCTEFA H2PiyR Project. Available online: www.h2piyr.eu (accessed on 5 January 2022).
- Jones, O. France Has Its Very First H2 Refueling Station; GasWorld: Truro, UK, 2017. [Google Scholar]
- Ministry of Economy, Industry and Competitivity. Spanish National Action Framework for Alternative Energy in Transport. 2016. Available online: https://industria.gob.es/es-ES/Servicios/Documents/national-action-framework.pdf (accessed on 5 January 2022).
- Mobilité Hydrogène France, Element Energy. H2 Mobilité France. Study for a Fuel Cell Electric Vehicle National Deployment Plan. 2014. Available online: https://inis.iaea.org/search/searchsinglerecord.aspx?recordsFor=SingleRecord&RN=45104849 (accessed on 5 January 2022).
- DEMO4GRID Project. Available online: https://www.demo4grid.eu/ (accessed on 5 January 2022).
Publisher’s Note: MDPI stays neutral with regard to jurisdictional claims in published maps and institutional affiliations. |
© 2022 by the authors. Licensee MDPI, Basel, Switzerland. This article is an open access article distributed under the terms and conditions of the Creative Commons Attribution (CC BY) license (https://creativecommons.org/licenses/by/4.0/).